SRTM vs ASTER elevation products. Comparison for two regions in Crete, Greece K. G. NIKOLAKOPOULOS{, E. K. KAMARATAKIS{ and N. CHRYSOULAKIS*§ {University of Athens, Department of Geology and Geoenvironment, Remote Sensing Laboratory, Iroon Polytechniou Str. 15127, Melissia, Greece {University of Leicester, Department of Geography, Leicester LE1 7RH, UK §Foundation for Research and Technology, Hellas, Institute of Applied and Computational Mathematics, Vassilika Vouton, PO Box 1527, GR-71110, Heraklion, Crete, Greece (Received 7 November 2005; in final form 5 January 2006 ) The Shuttle Radar Topography Mission (SRTM) collected elevation data over 80% of earth’s land area during an 11-day Space Shuttle mission. With a horizontal resolution of 3 arc sec, SRTM represents the best quality, freely available digital elevation models (DEMs) worldwide. Since the SRTM elevation data are unedited, they contain occasional voids, or gaps, where the terrain lay in the radar beam’s shadow or in areas of extremely low radar backscatter, such as sea, dams, lakes and virtually any water-covered surface. In contrast to the short duration of the SRTM mission, the ongoing Advanced Spaceborne Thermal Emission and Reflection Radiometer (ASTER) is continuously collecting elevation information with a horizontal resolution of 15 m. In this paper we compared DEM products created from SRTM data with respective products created from ASTER stereo-pairs. The study areas were located in Crete, Greece. Absolute DEMs produced photogrammetricaly from ASTER using differentially corrected GPS measurements provided the benchmark to infer vertical and planimetric accuracy of the 3 arc sec finished SRTM product. Spatial filters were used to detect and remove the voids, as well as to interpolate the missing values in DEMs. Comparison between SRTM- and ASTER-derived DEMs allowed a qualitative assessment of the horizontal and vertical component of the error, while statistical measures were used to estimate their vertical accuracy. Elevation difference between SRTM and ASTER products was evaluated using the root mean square error (RMSE), which was found to be less than 50 m. 1. Introduction The vast majority of social and environmental processes are global in scope; therefore the study of such processes requires global datasets (Shortridge and Goodchild 1999). Global elevation datasets are inevitably subjected to errors, mainly due to the methodology followed to extract elevation information and the various processing steps the models have undergone (e.g interpolation). Extensive and systematic evaluation of such datasets is difficult due to lack of substantial ground truthing. The past few decades, many efforts to assembly global elevation *Corresponding author. Email: [email protected]International Journal of Remote Sensing Vol. 27, No. 21, 10 November 2006, 4819–4838 International Journal of Remote Sensing ISSN 0143-1161 print/ISSN 1366-5901 online # 2006 Taylor & Francis http://www.tandf.co.uk/journals DOI: 10.1080/01431160600835853
Transcript
SRTM vs ASTER elevation products. Comparison for two regions inCrete, Greece
K. G. NIKOLAKOPOULOS{, E. K. KAMARATAKIS{ and
N. CHRYSOULAKIS*§
{University of Athens, Department of Geology and Geoenvironment, Remote Sensing
Laboratory, Iroon Polytechniou Str. 15127, Melissia, Greece
{University of Leicester, Department of Geography, Leicester LE1 7RH, UK
§Foundation for Research and Technology, Hellas, Institute of Applied and
Computational Mathematics, Vassilika Vouton, PO Box 1527, GR-71110, Heraklion,
Crete, Greece
(Received 7 November 2005; in final form 5 January 2006 )
The Shuttle Radar Topography Mission (SRTM) collected elevation data over
80% of earth’s land area during an 11-day Space Shuttle mission. With a
horizontal resolution of 3 arc sec, SRTM represents the best quality, freely
available digital elevation models (DEMs) worldwide. Since the SRTM elevation
data are unedited, they contain occasional voids, or gaps, where the terrain lay in
the radar beam’s shadow or in areas of extremely low radar backscatter, such as
sea, dams, lakes and virtually any water-covered surface. In contrast to the short
duration of the SRTM mission, the ongoing Advanced Spaceborne Thermal
Emission and Reflection Radiometer (ASTER) is continuously collecting
elevation information with a horizontal resolution of 15 m. In this paper we
compared DEM products created from SRTM data with respective products
created from ASTER stereo-pairs. The study areas were located in Crete, Greece.
Absolute DEMs produced photogrammetricaly from ASTER using differentially
corrected GPS measurements provided the benchmark to infer vertical and
planimetric accuracy of the 3 arc sec finished SRTM product. Spatial filters were
used to detect and remove the voids, as well as to interpolate the missing values in
DEMs. Comparison between SRTM- and ASTER-derived DEMs allowed a
qualitative assessment of the horizontal and vertical component of the error,
while statistical measures were used to estimate their vertical accuracy. Elevation
difference between SRTM and ASTER products was evaluated using the root
mean square error (RMSE), which was found to be less than 50 m.
1. Introduction
The vast majority of social and environmental processes are global in scope;
therefore the study of such processes requires global datasets (Shortridge and
Goodchild 1999). Global elevation datasets are inevitably subjected to errors,
mainly due to the methodology followed to extract elevation information and the
various processing steps the models have undergone (e.g interpolation). Extensive
and systematic evaluation of such datasets is difficult due to lack of substantial
ground truthing. The past few decades, many efforts to assembly global elevation
which flew twice on the Space Shuttle in 1994. Several modifications were made,
which gave the SRTM system new capabilities compared with the SIR-C/X-SAR.
The major changes were the addition of C-band and X-band antennas at the end of
a 60 m mast. These secondary, or ‘‘outboard’’ antennas, allowed the radar to use
interferometry to map the elevation of the terrain in a single pass, which was not
possible with SIR-C/X-SAR. The American C-band system SIR-C operated with a
4820 K.G. Nikolakopoulos et al.
wavelength of l55.6 cm; the wavelength of the German/Italian X-band system was
l53.1 cm. In order to obtain a global coverage between 60u north and 58u south the
Shuttle was flown at an altitude of 233 km with an inclination of 57u.The SRTM DEM products are being distributed mainly under two forms; these
are the SRTM 10 and SRTM 30, with spatial resolution of 1 and 3 arc sec,
respectively. The first is available only for the USA, while the latter is freely
distributed for the rest of the globe. Both datasets can be downloaded from various
data gateways; one is the USGS seamless data distribution website (USGS 2005).
Although currently many applications use SRTM products around the world, there
is limited scientific literature on their quality and application fitness. According to
mission specifications (Hensley et al. 2001), SRTM was expected to generate DEMs
with a vertical RMSE of 16 m. The equivalent vertical accuracy requirements for
topographic data at scale 1 : 250,000 that meet the USA map accuracy standards
(Welch and Marko 1981, Lang and Welch 1999) indicate that RMSE should be
around 15.3 m.
The Advanced Spaceborne Thermal Emission and Reflection Radiometer
(ASTER) is an advanced multispectral imager that was launched on board
NASA’s Terra spacecraft in December, 1999. Its viewing geometry is suitable for
DEM generation with horizontal spatial resolution of 15 m and a near-pixel-size
vertical accuracy. ASTER consists of three separate instruments subsystems, each
operating in a different spectral region, using separate optical system. The visible–
near infrared system, which is used in DEM production, consists of two telescopes—
one nadir looking with a three-band detector and the other backward looking (27.7uoff-nadir) with a single band detector. The most important specifications of the
ASTER stereo subsystem that govern the DEM generation capabilities include:
stereo geometry; platform altitude of 705 km and base-to-height ratio of 0.6
(Abrams 2000).The ASTER stereo-imaging has a relatively modest base-to-height
ratio, the disadvantages of which are more than compensated for by the relative
radiometric uniformity and freedom from temporal change offered by the forward-
nadir stereo geometry. The viability of stereo correlation for parallax difference
from digital stereoscopic data has been described and evaluated in previous studies
(Al-Rousan and Petrie 1998, Lang and Welch 1999). ASTER DEM data provided
the first high-resolution near-global elevation source. Although this remarkable data
set is extremely useful due to its relatively high resolution, it suffers from some
drawbacks, such as the lack of coverage in several areas due to the weather
conditions during the stereo-imagery acquisition.
Error in elevation data is widely recognized to comprise mainly two components,
the horizontal, often referred as positional accuracy, and the vertical component or
accuracy of the attribute. However, positional and attribute accuracy generally
cannot be separated; the error may be due to an incorrect elevation value at the
correct location, or a correct elevation for an incorrect location or some com-
bination of these. In this paper SRTM- and ASTER-derived DEMs for two regions
in Crete (North Heraklion and Sitia) were compared. Masks and filters were applied
to the DEMs to detect and remove the possible voids, to interpolate the missing
values and to separate the land from the sea. The vertical error of a 30 SRTM
product was therefore evaluated using a higher accuracy DEM product. This
reference DEM was produced by applying a digital stereo correlation approach to
ASTER stereo pairs. Ground trouthing was provided by GCP’s (ground control
points) derived from GPS (global positioning system) measurements differentially
SRTM vs ASTER elevation products 4821
corrected using the GPS base station of the Foundation for Research and
Technology, Hellas (Chrysoulakis et al. 2004).
2. Data and methodology
2.1 Study area
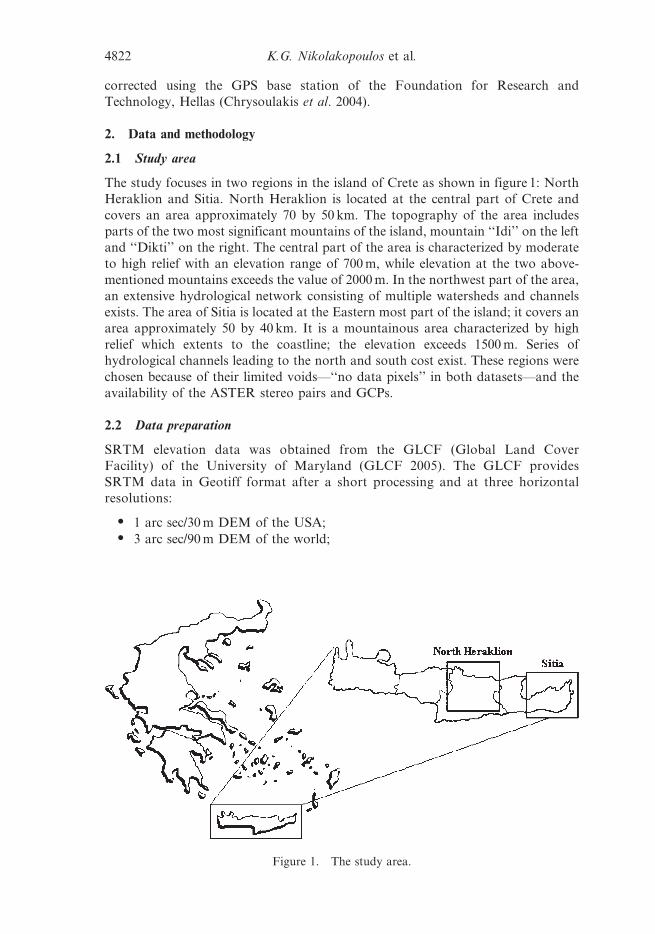
The study focuses in two regions in the island of Crete as shown in figure 1: North
Heraklion and Sitia. North Heraklion is located at the central part of Crete and
covers an area approximately 70 by 50 km. The topography of the area includes
parts of the two most significant mountains of the island, mountain ‘‘Idi’’ on the left
and ‘‘Dikti’’ on the right. The central part of the area is characterized by moderate
to high relief with an elevation range of 700 m, while elevation at the two above-
mentioned mountains exceeds the value of 2000 m. In the northwest part of the area,
an extensive hydrological network consisting of multiple watersheds and channels
exists. The area of Sitia is located at the Eastern most part of the island; it covers an
area approximately 50 by 40 km. It is a mountainous area characterized by high
relief which extents to the coastline; the elevation exceeds 1500 m. Series of
hydrological channels leading to the north and south cost exist. These regions were
chosen because of their limited voids—‘‘no data pixels’’ in both datasets—and the
availability of the ASTER stereo pairs and GCPs.
2.2 Data preparation
SRTM elevation data was obtained from the GLCF (Global Land Cover
Facility) of the University of Maryland (GLCF 2005). The GLCF provides
SRTM data in Geotiff format after a short processing and at three horizontal
resolutions:
N 1 arc sec/30 m DEM of the USA;
N 3 arc sec/90 m DEM of the world;
Figure 1. The study area.
4822 K.G. Nikolakopoulos et al.
N 30 arc sec/1 km SRTM-GTOPO30 product corrected by GTOPO30 30 arc secDEM.
All studies employing DEMs make use of planar coordinates to have the same
measurement units for both (x, y) and elevation. The SRTM data were provided in
UTM WGS84, therefore it was necessary to reproject the SRTM-derived DEM to
the Hellenic Geodetic Reference System 87 (HGRS87), because the reference
ASTER DEM was produced with respect to that grid. When dealing withmultiresolution datasets, there is often a need for data sampled at one scale to be
generalized to other scales. In this study, we had to compare two elevation datasets
sampled at different scales (spatial resolutions). The pixel size of the ASTER-derived
DEM was 15 m, whereas the SRTM-derived DEM had a pixel dimension of 90 m, as
provided by the GLCF. In order to compare the two datasets, the ASTER DEM
was scaled up to an aggregated pixel size, matching the dimensions of the SRTM
grid.
The SRTM-derived elevation data used in this study were initially referenced tothe WGS84 EGM96 geoid, and horizontally georeferenced to the WGS-84 ellipsoid
using a UTM projection. The values so measured could correspond to the bare
earth, the top of the vegetation, or the top of man-made features. The minimum
value (representing the voids) was 232,768 and the maximum value was 2433. The
original SRTM elevation data were reprojected to the HGRS 87 using the nearest
neighbourhood resampling method and preserving the 90 m pixel size. The nearest
neighbour resampling method was used to preserve the values of the DEM and
particularly the voids. Then, a spatial filter was applied to the SRTM DEM. Thisfilter detected all the negative values and changed them to the value 25, resulting a
DEM with less noise and homogenous voids. The borderline of the two study areas
was used to create binary masks to separate the land from the sea. It should be noted
that the SRTM DEM contained many more voids in the Sitia area (with a quite
large extent that exceeded in some cases 0.75 km2) than in the North Heraklion area.
Especially in the western part of the Sitia area, there were many large voids with a
NNE–SSW orientatopm. This may be explained by the NNE–SSW orientation of
the high mountains in this area. Following this, a second spatial filter was applied toboth DEMs to interpolate the missing values. The filter initially detected the areas
with the specified value of 25. If the majority of the pixels around this area had to
be replaced, then a low pass filter 565 was applied; otherwise a low-pass 363 filter
was applied.
The ASTER-derived DEMs used in this study were produced in the framework of
the REALDEMS project, aiming at providing accurate DEMs and land cover maps
for some Greek islands that were capable of being used in local studies. As a part of
this project, high spatial resolution ASTER stereo imagery was analysed to produceDEM for Heraklion and Sitia areas. Differentially corrected GPS measurements
were performed to provide GCPs for DEM correction and geo-location. The
planimetric and elevation accuracies (RMSE resulting from using survey monu-
ments available from 1 : 5000 survey maps) of the produced DEMs were 15.0 and
12.4 m, respectively. The ASTER DEM production procedure has been described in
detail by Chrysoulakis et al. (2003, 2004). The DEM for North Heraklion was
produced using a single ASTER scene, whereas the DEM for Sitia was produced
using a block of two ASTER scenes. As already mentioned, the ASTER-derivedDEM for both areas was scaled up to an aggregated pixel size matching the
dimensions of the SRTM grid.
SRTM vs ASTER elevation products 4823
2.3 ASTER SRTM DEM comparison
By superimposing the two DEMs for each area, a noteworthy misalignment of the
SRTM DEM was observed, which had probably been caused by the datum
transformation process and in particular when the borderline of the two study areas
was used to create binary masks to separate the land from the sea. In order to
evaluate misalignment, several elevation profiles along the north–south and east–
west directions for both SRTM and ASTER DEMs were compared. The SRTM
DEMs were found to be shifted approximately 200 m easting and 400 m northing,
which correspond to 2.2 and 4.4 pixels, respectively. To account for this
misalignment, a co-registration methodology was applied. Slope was derived for
both ASTER and SRTM datasets and two false coloured images were created for
each DEM pair (DEM + slope). The texture introduced from slope allowed the
location of several control points for an image-to-image co-registration, and thus
SRTM DEM was re-registered to ASTER DEM. Following the re-registration, the
spatial distribution of elevation difference between two SRTM and ASTER DEMs
for both study areas was produced by subtracting the respective images pixel-by-
pixel. Since the ASTER DEM is considered as the reference DEM, the difference
image also represents an error map for SRTM-derived elevations. Scatter plots of
SRTM–ASTER DEM difference vs elevation, as well as vs slope, were used in the
comparison procedure.
In order to describe and compare the elevation distributions in each DEM, several
descriptive statistic measures were employed, among them skewness and kurtosis
(King and Julstrom 1982). Skewness is a unitless measure of asymmetry in a
distribution (Shaw and Wheeler 1985). Positive skewness indicates a longer tail to
the right, while negative skewness indicates a longer tail to the left. A perfectly
symmetric distribution, like the normal distribution, has skewness equal to 0. Excess
kurtosis is a unitless measure of how sharp the data peak is. Traditionally the value
of this coefficient is compared with a value of 0.0, which is the coefficient of kurtosis
for a normal distribution. A value larger than 0 indicates a peaked distribution,
while a value less than 0 indicates a flat distribution.
Since both ASTER- and SRTM-derived elevation distributions were close to
normal, the F-ratio test was applied in order to test against the null hypothesis that
the variances of the two DEMs were equal. Two sample F-tests for variances of
ASTER and SRTM DEMs and the respective slope distributions for both North
Heraklion and Sitia were performed and the null hypothesis was rejected in all cases.
Therefore, two-sample t-tests assuming unequal variances for the means of ASTER
and SRTM DEMs and the respective slope distributions for both study areas were
performed and the null hypothesis was rejected again in all cases. The null
hypothesis in the t-tests assumed equal means for the two samples. Moreover, the
Kolmogorov–Smirnov nonparametric test that does not use any distributional
assumptions was used to check the null hypothesis that the distributions are
identical for the two datasets.
To obtain the degree of relationship between the ASTER and SRTM DEMs,
Pearson and Spearman correlation coefficients were calculated, for the elevations as
well as for the slope derived from them. Pearson’s correlation coefficient represents
the association between two variables or the degree of co-variation of the two
variables or the tendency of variable to vary together in the sense that one increases
as the other increases (positive covariation) or in the sense that one variable
increases as the other decreases (negative covariation).
4824 K.G. Nikolakopoulos et al.
The correlation between SRTM- and ASTER-derived elevation values was
estimated by analysing the respective scatter plots. Additional, a common measure
of quantifying vertical accuracy in DEMs, the root mean square error (RMSE) was
used. RMSE is an overall error indicator that takes into account both random and
systematic errors introduced during the data generation process. It is currently
widely adopted mostly because it is a comprehensive statistic and because it is easy
to implement. RMSE is the method adopted by the USGS in order to assess DEM
products, comparing them with elevation points that reflect the ‘‘most probable’’
elevations at specific locations. In this study, the RMSE of SRTM DEM in relation
to a reference DEM (ASTER DEM) was calculated. The elevation of each SRTM
DEM pixel was compared with the elevation of the respective ASTER DEM pixel
and the RMSE was calculated directly from raster data by employing an in-house
developed spatial model.
The comparisons were made using all valid height and slope values from the
SRTM and ASTER sources. The huge amount of data (259,852 pixels for the case of
North Heraklion and 109,807 pixels for the case of Sitia) used in calculations
provided evidence of the statistical significance of results (the resulting p-value was
less than 0.001 in all cases of F-test, t-test and Spearman and Pearson correlation
coefficient calculations). As stated above, the RMSE was used as error measure,
although the value of the systematic offset and the extent of the variation separately
were calculated from the histogram of the error map for SRTM-derived elevations
for both cases of North Heraklion and Sitia.
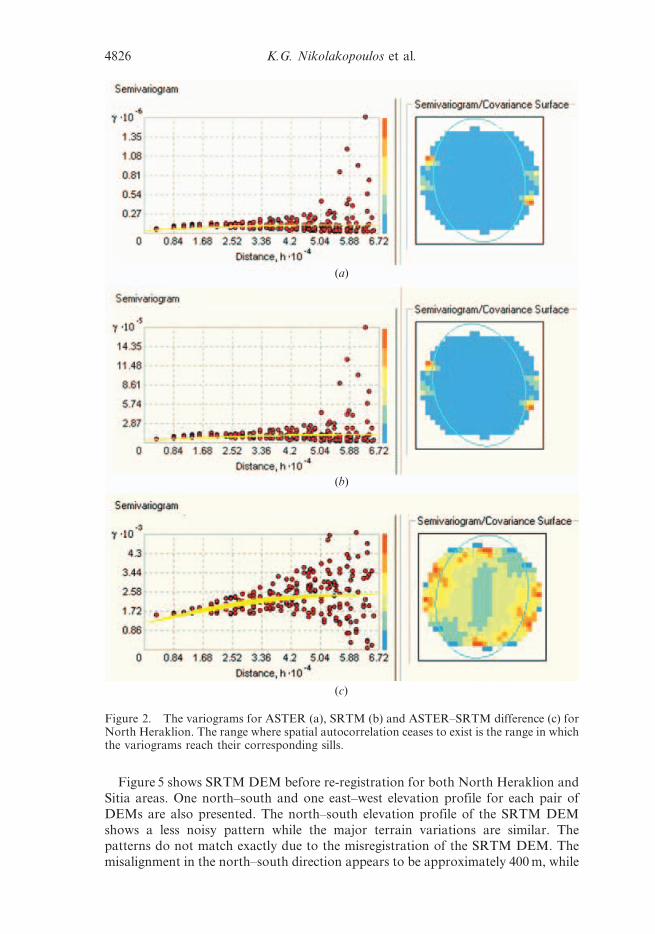
Moreover, the analysis indicated that there was a spatial correlation in the
original ASTER and SRTM datasets which inflated the corresponding correlation
coefficient. For this reason, the correlation analysis was performed again based on
spatially uncorrelated points. To do this a sub-sample of ASTER and SRTM DEMs
was used. The sampling was performed at rate that prevented spatial correlations.
The sampling rate was defined by analysing the variograms of ASTER and SRTM
DEMs, as well as of the respective slope distributions. The variograms for ASTER,
SRTM and ASTER–SRTM difference for North Heraklion are shown in figure 2.
The range in which the variograms reach their corresponding sills (that is the range
where spatial autocorrelation ceases to exist) was too large to allow for a random
sample of a satisfactory size. Nevertheless, one may observe that the rate at which
the variograms increase is too low for small distances from the origin. Thus, sub-
samples with a minimum distance of 3600 m (40 pixels) between sample points were
used and the correlation coefficients were calculated based on these sub-samples.
3. Results
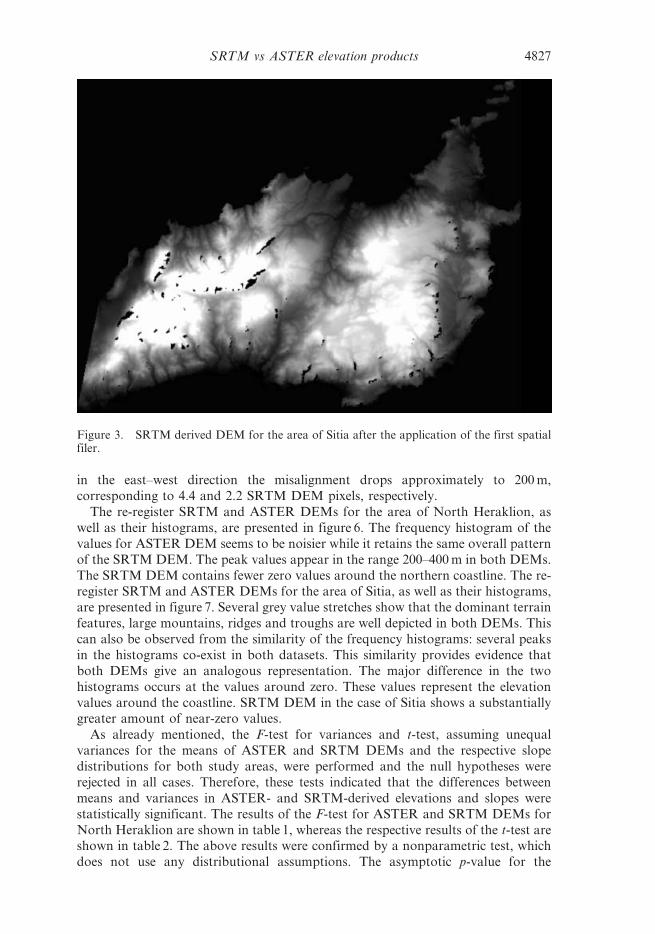
Figure 3 shows the SRTM-derived DEM for the area of Sitia after the application of
the first spatial filer. The land was separated from the sea using a binary mask.
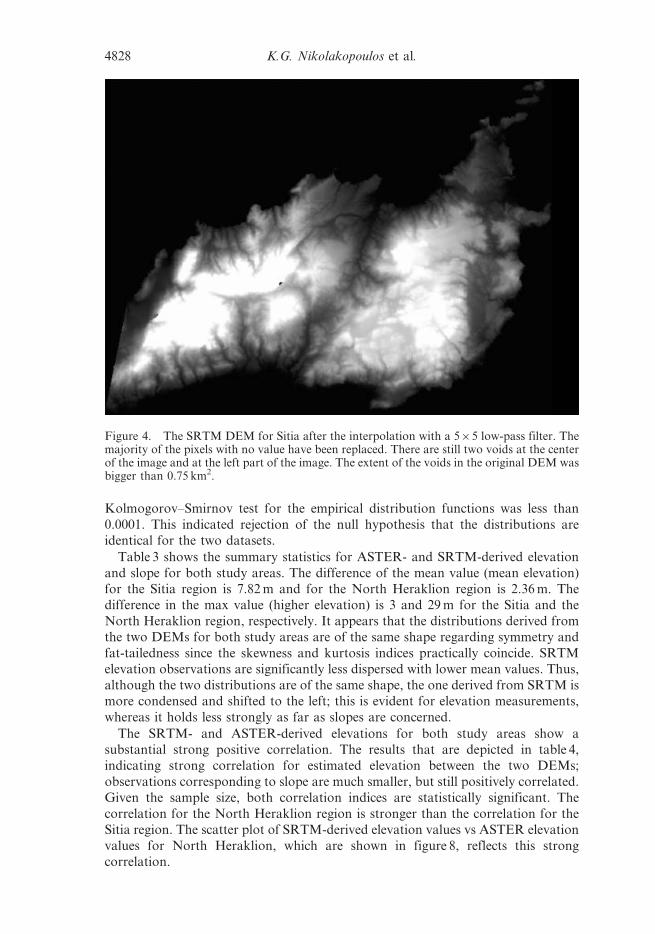
Areas with black pixels represent the voids. The final SRTM DEM for Sitia after the
interpolation with a 565 low-pass filter is shown in figure 4. The majority of the
pixels with no value have been replaced. There are still two voids at the centre of the
image and at the left of the image. The extent of the voids in the original DEM was
bigger than 0.75 km2. In the areas in which the 565 low pass filter did not manage
to interpolate all the missing values, a 767 filter was used to eliminate all voids. In
contrast, the 565 low-pass filter gave excellent results for the area of North
Heraklion.
SRTM vs ASTER elevation products 4825
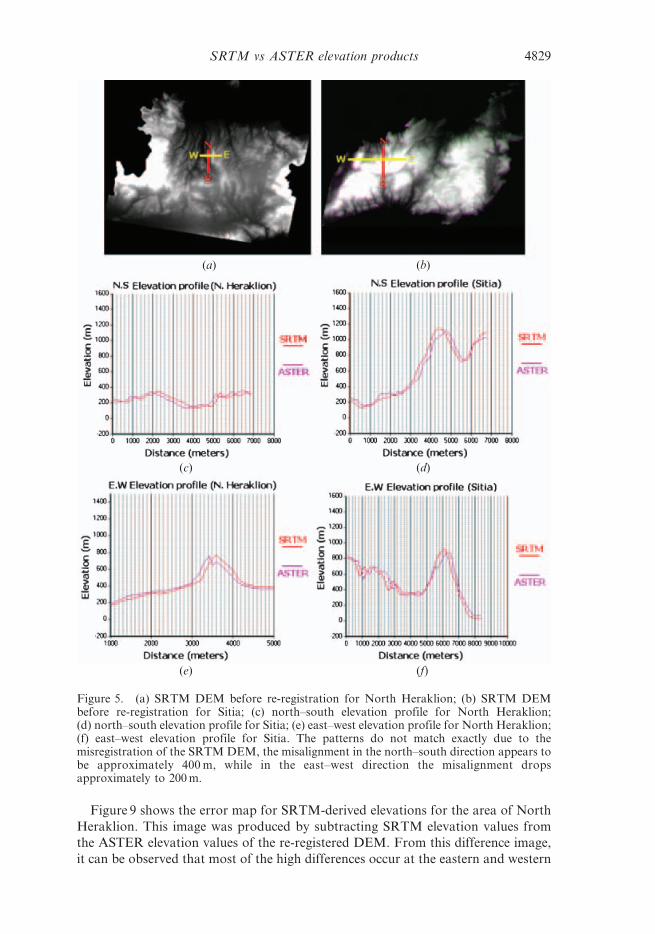
Figure 5 shows SRTM DEM before re-registration for both North Heraklion and
Sitia areas. One north–south and one east–west elevation profile for each pair of
DEMs are also presented. The north–south elevation profile of the SRTM DEM
shows a less noisy pattern while the major terrain variations are similar. Thepatterns do not match exactly due to the misregistration of the SRTM DEM. The
misalignment in the north–south direction appears to be approximately 400 m, while
(a)
(b)
(c)
Figure 2. The variograms for ASTER (a), SRTM (b) and ASTER–SRTM difference (c) forNorth Heraklion. The range where spatial autocorrelation ceases to exist is the range in whichthe variograms reach their corresponding sills.
4826 K.G. Nikolakopoulos et al.
in the east–west direction the misalignment drops approximately to 200 m,
corresponding to 4.4 and 2.2 SRTM DEM pixels, respectively.
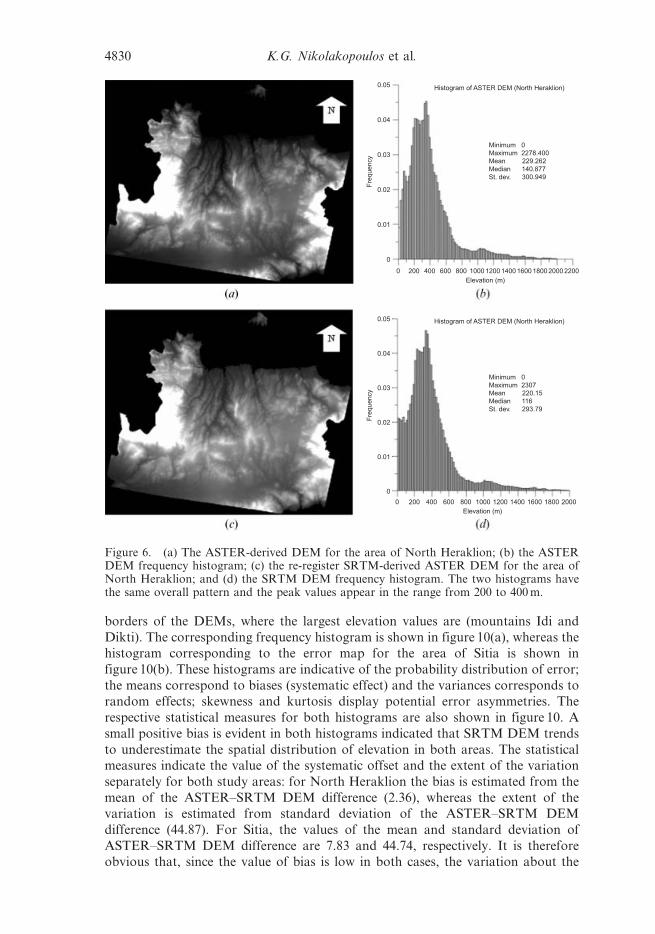
The re-register SRTM and ASTER DEMs for the area of North Heraklion, as
well as their histograms, are presented in figure 6. The frequency histogram of the
values for ASTER DEM seems to be noisier while it retains the same overall pattern
of the SRTM DEM. The peak values appear in the range 200–400 m in both DEMs.
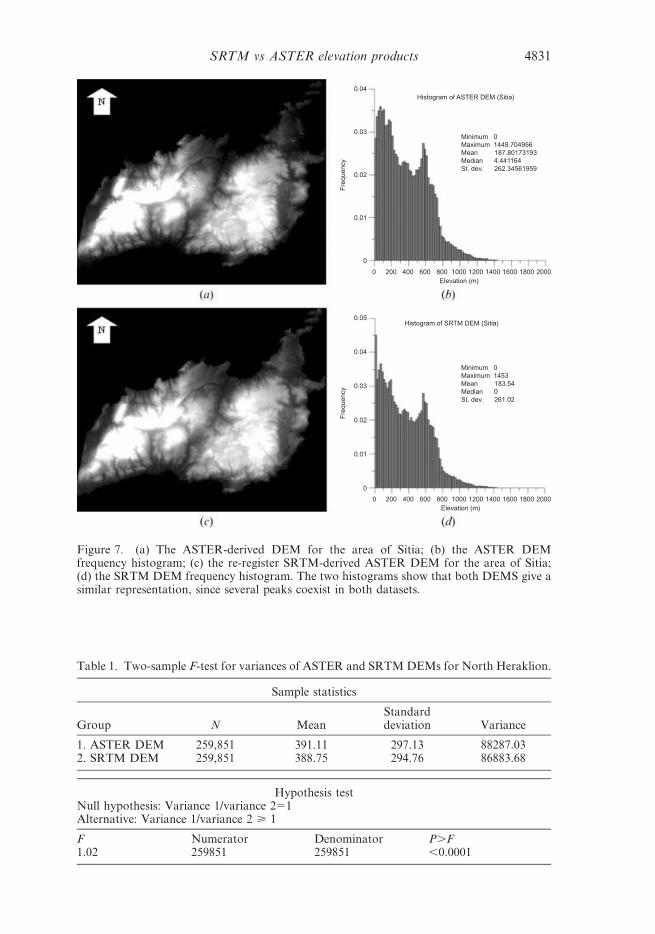
The SRTM DEM contains fewer zero values around the northern coastline. The re-register SRTM and ASTER DEMs for the area of Sitia, as well as their histograms,
are presented in figure 7. Several grey value stretches show that the dominant terrain
features, large mountains, ridges and troughs are well depicted in both DEMs. This
can also be observed from the similarity of the frequency histograms: several peaks
in the histograms co-exist in both datasets. This similarity provides evidence that
both DEMs give an analogous representation. The major difference in the two
histograms occurs at the values around zero. These values represent the elevation
values around the coastline. SRTM DEM in the case of Sitia shows a substantiallygreater amount of near-zero values.
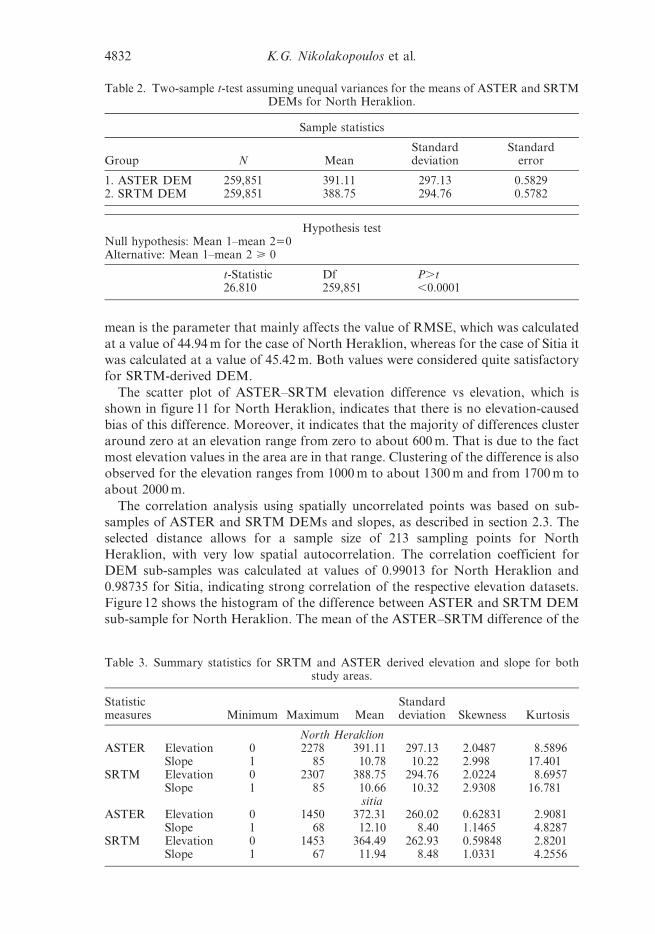
As already mentioned, the F-test for variances and t-test, assuming unequal
variances for the means of ASTER and SRTM DEMs and the respective slope
distributions for both study areas, were performed and the null hypotheses were
rejected in all cases. Therefore, these tests indicated that the differences between
means and variances in ASTER- and SRTM-derived elevations and slopes were
statistically significant. The results of the F-test for ASTER and SRTM DEMs for
North Heraklion are shown in table 1, whereas the respective results of the t-test areshown in table 2. The above results were confirmed by a nonparametric test, which
does not use any distributional assumptions. The asymptotic p-value for the
Figure 3. SRTM derived DEM for the area of Sitia after the application of the first spatialfiler.
SRTM vs ASTER elevation products 4827
Kolmogorov–Smirnov test for the empirical distribution functions was less than
0.0001. This indicated rejection of the null hypothesis that the distributions are
identical for the two datasets.
Table 3 shows the summary statistics for ASTER- and SRTM-derived elevation
and slope for both study areas. The difference of the mean value (mean elevation)
for the Sitia region is 7.82 m and for the North Heraklion region is 2.36 m. The
difference in the max value (higher elevation) is 3 and 29 m for the Sitia and the
North Heraklion region, respectively. It appears that the distributions derived from
the two DEMs for both study areas are of the same shape regarding symmetry and
fat-tailedness since the skewness and kurtosis indices practically coincide. SRTM
elevation observations are significantly less dispersed with lower mean values. Thus,
although the two distributions are of the same shape, the one derived from SRTM is
more condensed and shifted to the left; this is evident for elevation measurements,
whereas it holds less strongly as far as slopes are concerned.
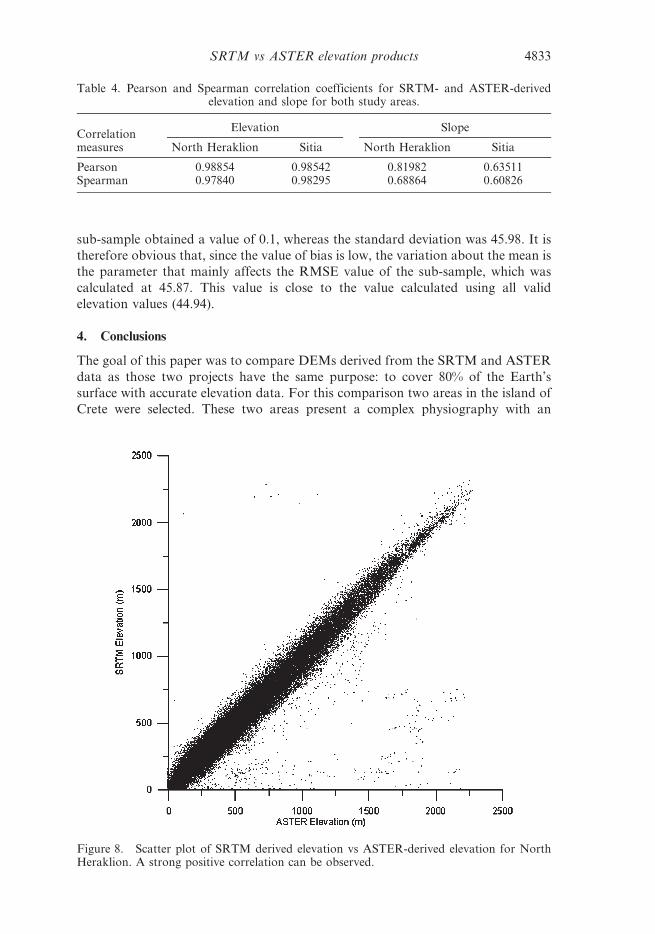
The SRTM- and ASTER-derived elevations for both study areas show a
substantial strong positive correlation. The results that are depicted in table 4,
indicating strong correlation for estimated elevation between the two DEMs;
observations corresponding to slope are much smaller, but still positively correlated.
Given the sample size, both correlation indices are statistically significant. The
correlation for the North Heraklion region is stronger than the correlation for the
Sitia region. The scatter plot of SRTM-derived elevation values vs ASTER elevation
values for North Heraklion, which are shown in figure 8, reflects this strong
correlation.
Figure 4. The SRTM DEM for Sitia after the interpolation with a 565 low-pass filter. Themajority of the pixels with no value have been replaced. There are still two voids at the centerof the image and at the left part of the image. The extent of the voids in the original DEM wasbigger than 0.75 km2.
4828 K.G. Nikolakopoulos et al.
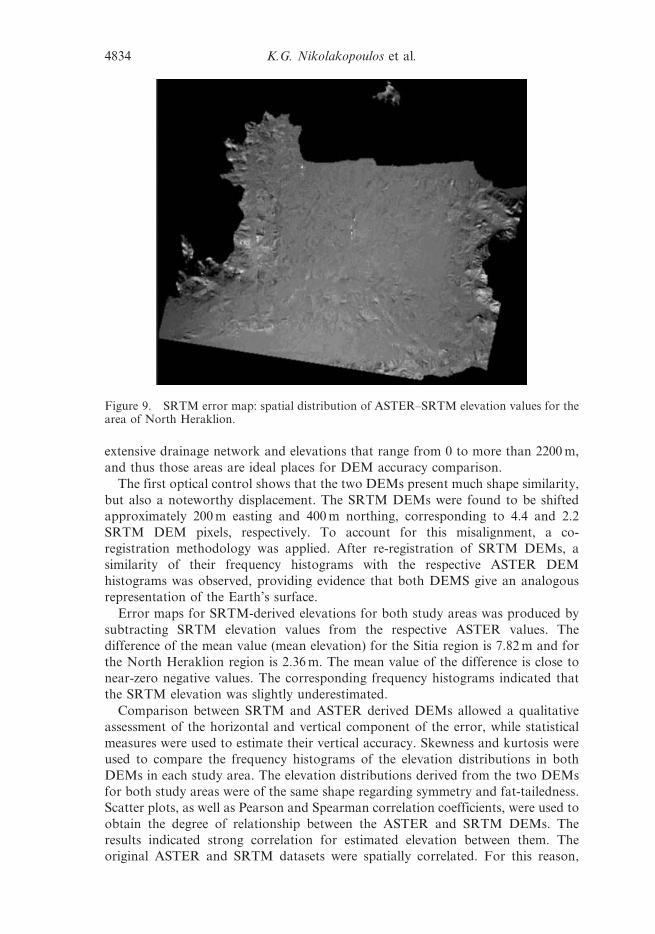
Figure 9 shows the error map for SRTM-derived elevations for the area of North
Heraklion. This image was produced by subtracting SRTM elevation values from
the ASTER elevation values of the re-registered DEM. From this difference image,
it can be observed that most of the high differences occur at the eastern and western
(a) (b)
(c) (d)
(e) (f)
Figure 5. (a) SRTM DEM before re-registration for North Heraklion; (b) SRTM DEMbefore re-registration for Sitia; (c) north–south elevation profile for North Heraklion;(d) north–south elevation profile for Sitia; (e) east–west elevation profile for North Heraklion;(f) east–west elevation profile for Sitia. The patterns do not match exactly due to themisregistration of the SRTM DEM, the misalignment in the north–south direction appears tobe approximately 400 m, while in the east–west direction the misalignment dropsapproximately to 200 m.
SRTM vs ASTER elevation products 4829
borders of the DEMs, where the largest elevation values are (mountains Idi and
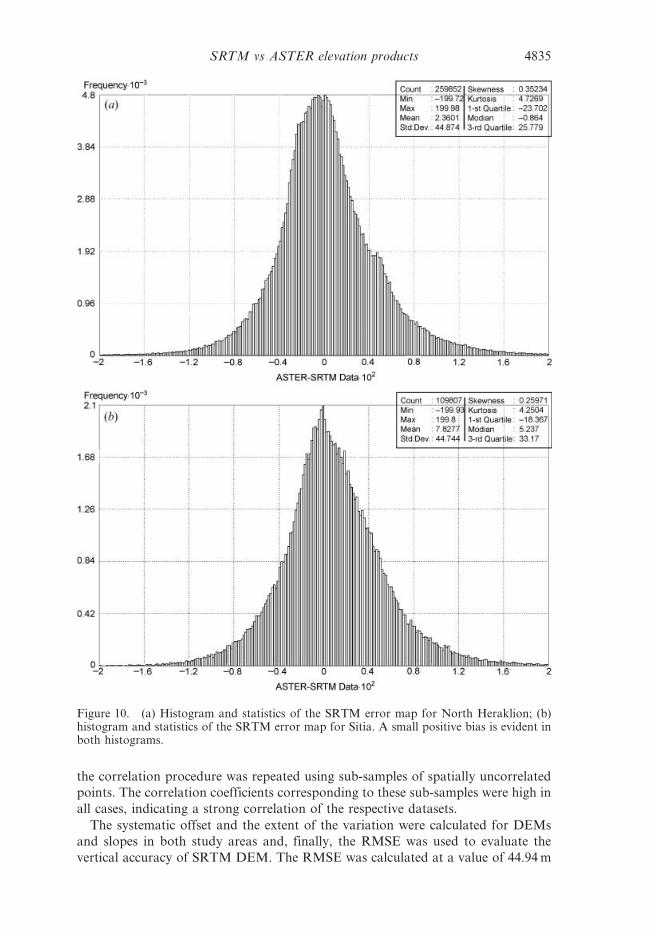
Dikti). The corresponding frequency histogram is shown in figure 10(a), whereas the
histogram corresponding to the error map for the area of Sitia is shown in
figure 10(b). These histograms are indicative of the probability distribution of error;
the means correspond to biases (systematic effect) and the variances corresponds to
random effects; skewness and kurtosis display potential error asymmetries. The
respective statistical measures for both histograms are also shown in figure 10. A
small positive bias is evident in both histograms indicated that SRTM DEM trends
to underestimate the spatial distribution of elevation in both areas. The statistical
measures indicate the value of the systematic offset and the extent of the variation
separately for both study areas: for North Heraklion the bias is estimated from the
mean of the ASTER–SRTM DEM difference (2.36), whereas the extent of the
variation is estimated from standard deviation of the ASTER–SRTM DEM
difference (44.87). For Sitia, the values of the mean and standard deviation of
ASTER–SRTM DEM difference are 7.83 and 44.74, respectively. It is therefore
obvious that, since the value of bias is low in both cases, the variation about the
Figure 6. (a) The ASTER-derived DEM for the area of North Heraklion; (b) the ASTERDEM frequency histogram; (c) the re-register SRTM-derived ASTER DEM for the area ofNorth Heraklion; and (d) the SRTM DEM frequency histogram. The two histograms havethe same overall pattern and the peak values appear in the range from 200 to 400 m.
Figure 7. (a) The ASTER-derived DEM for the area of Sitia; (b) the ASTER DEMfrequency histogram; (c) the re-register SRTM-derived ASTER DEM for the area of Sitia;(d) the SRTM DEM frequency histogram. The two histograms show that both DEMS give asimilar representation, since several peaks coexist in both datasets.
Table 1. Two-sample F-test for variances of ASTER and SRTM DEMs for North Heraklion.
Sample statistics
Group N MeanStandarddeviation Variance
1. ASTER DEM 259,851 391.11 297.13 88287.032. SRTM DEM 259,851 388.75 294.76 86883.68
Figure 8. Scatter plot of SRTM derived elevation vs ASTER-derived elevation for NorthHeraklion. A strong positive correlation can be observed.
SRTM vs ASTER elevation products 4833
extensive drainage network and elevations that range from 0 to more than 2200 m,
and thus those areas are ideal places for DEM accuracy comparison.
The first optical control shows that the two DEMs present much shape similarity,
but also a noteworthy displacement. The SRTM DEMs were found to be shifted
approximately 200 m easting and 400 m northing, corresponding to 4.4 and 2.2
SRTM DEM pixels, respectively. To account for this misalignment, a co-
registration methodology was applied. After re-registration of SRTM DEMs, a
similarity of their frequency histograms with the respective ASTER DEM
histograms was observed, providing evidence that both DEMS give an analogous
representation of the Earth’s surface.
Error maps for SRTM-derived elevations for both study areas was produced by
subtracting SRTM elevation values from the respective ASTER values. The
difference of the mean value (mean elevation) for the Sitia region is 7.82 m and for
the North Heraklion region is 2.36 m. The mean value of the difference is close to
near-zero negative values. The corresponding frequency histograms indicated that
the SRTM elevation was slightly underestimated.
Comparison between SRTM and ASTER derived DEMs allowed a qualitative
assessment of the horizontal and vertical component of the error, while statistical
measures were used to estimate their vertical accuracy. Skewness and kurtosis were
used to compare the frequency histograms of the elevation distributions in both
DEMs in each study area. The elevation distributions derived from the two DEMs
for both study areas were of the same shape regarding symmetry and fat-tailedness.
Scatter plots, as well as Pearson and Spearman correlation coefficients, were used to
obtain the degree of relationship between the ASTER and SRTM DEMs. The
results indicated strong correlation for estimated elevation between them. The
original ASTER and SRTM datasets were spatially correlated. For this reason,
Figure 9. SRTM error map: spatial distribution of ASTER–SRTM elevation values for thearea of North Heraklion.
4834 K.G. Nikolakopoulos et al.
the correlation procedure was repeated using sub-samples of spatially uncorrelated
points. The correlation coefficients corresponding to these sub-samples were high in
all cases, indicating a strong correlation of the respective datasets.
The systematic offset and the extent of the variation were calculated for DEMs
and slopes in both study areas and, finally, the RMSE was used to evaluate the
vertical accuracy of SRTM DEM. The RMSE was calculated at a value of 44.94 m
Figure 10. (a) Histogram and statistics of the SRTM error map for North Heraklion; (b)histogram and statistics of the SRTM error map for Sitia. A small positive bias is evident inboth histograms.
SRTM vs ASTER elevation products 4835
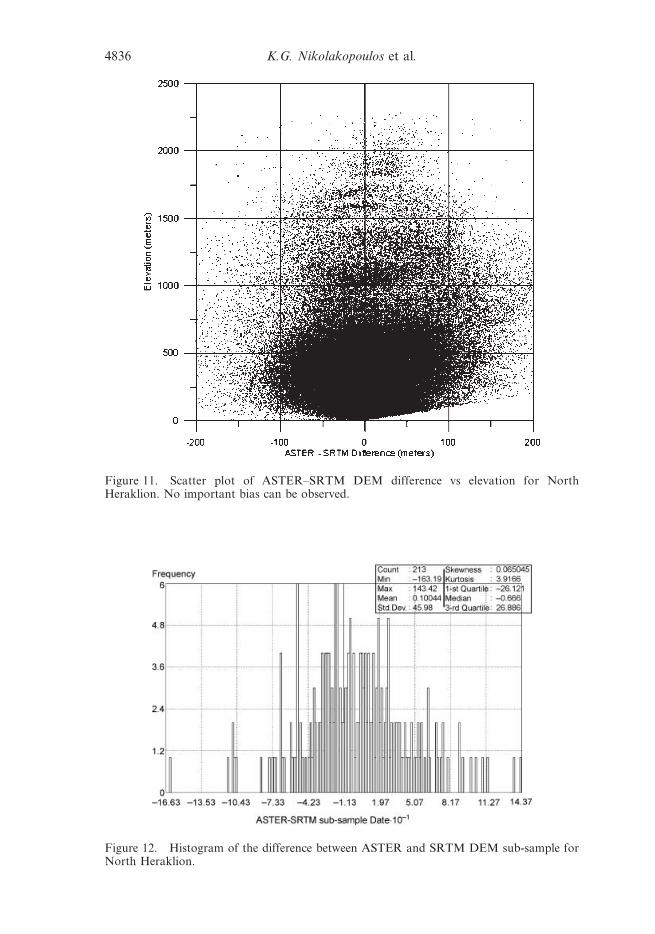
Figure 11. Scatter plot of ASTER–SRTM DEM difference vs elevation for NorthHeraklion. No important bias can be observed.
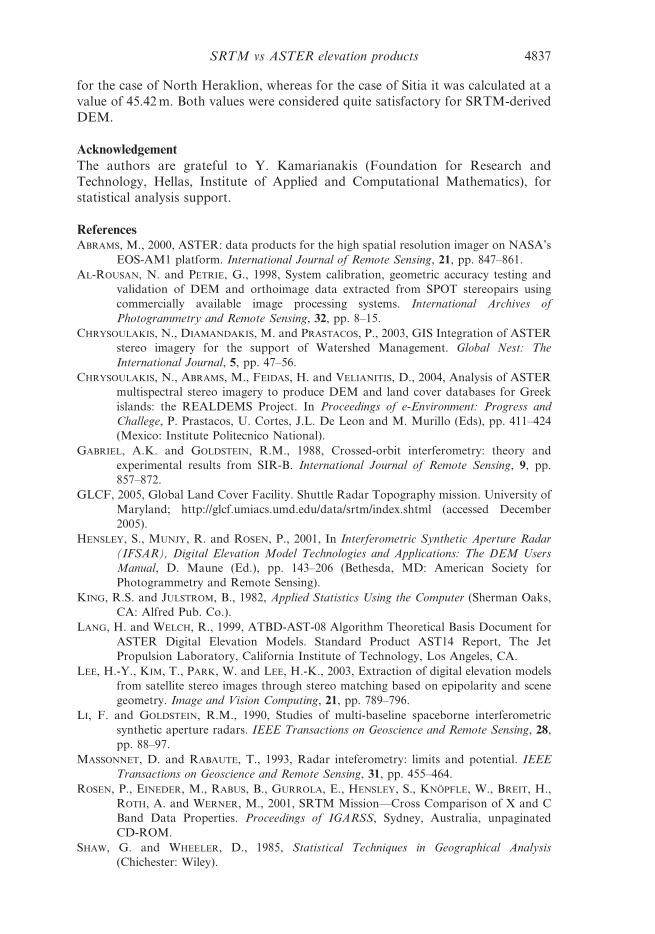
Figure 12. Histogram of the difference between ASTER and SRTM DEM sub-sample forNorth Heraklion.
4836 K.G. Nikolakopoulos et al.
for the case of North Heraklion, whereas for the case of Sitia it was calculated at a
value of 45.42 m. Both values were considered quite satisfactory for SRTM-derived
DEM.
Acknowledgement
The authors are grateful to Y. Kamarianakis (Foundation for Research and
Technology, Hellas, Institute of Applied and Computational Mathematics), for
statistical analysis support.
ReferencesABRAMS, M., 2000, ASTER: data products for the high spatial resolution imager on NASA’s
EOS-AM1 platform. International Journal of Remote Sensing, 21, pp. 847–861.
AL-ROUSAN, N. and PETRIE, G., 1998, System calibration, geometric accuracy testing and
validation of DEM and orthoimage data extracted from SPOT stereopairs using
commercially available image processing systems. International Archives of
Photogrammetry and Remote Sensing, 32, pp. 8–15.
CHRYSOULAKIS, N., DIAMANDAKIS, M. and PRASTACOS, P., 2003, GIS Integration of ASTER
stereo imagery for the support of Watershed Management. Global Nest: The
International Journal, 5, pp. 47–56.
CHRYSOULAKIS, N., ABRAMS, M., FEIDAS, H. and VELIANITIS, D., 2004, Analysis of ASTER
multispectral stereo imagery to produce DEM and land cover databases for Greek
islands: the REALDEMS Project. In Proceedings of e-Environment: Progress and
Challege, P. Prastacos, U. Cortes, J.L. De Leon and M. Murillo (Eds), pp. 411–424
(Mexico: Institute Politecnico National).
GABRIEL, A.K. and GOLDSTEIN, R.M., 1988, Crossed-orbit interferometry: theory and
experimental results from SIR-B. International Journal of Remote Sensing, 9, pp.
857–872.
GLCF, 2005, Global Land Cover Facility. Shuttle Radar Topography mission. University of
Maryland; http://glcf.umiacs.umd.edu/data/srtm/index.shtml (accessed December
2005).
HENSLEY, S., MUNJY, R. and ROSEN, P., 2001, In Interferometric Synthetic Aperture Radar
(IFSAR), Digital Elevation Model Technologies and Applications: The DEM Users
Manual, D. Maune (Ed.), pp. 143–206 (Bethesda, MD: American Society for
Photogrammetry and Remote Sensing).
KING, R.S. and JULSTROM, B., 1982, Applied Statistics Using the Computer (Sherman Oaks,
CA: Alfred Pub. Co.).
LANG, H. and WELCH, R., 1999, ATBD-AST-08 Algorithm Theoretical Basis Document for
ASTER Digital Elevation Models. Standard Product AST14 Report, The Jet
Propulsion Laboratory, California Institute of Technology, Los Angeles, CA.
LEE, H.-Y., KIM, T., PARK, W. and LEE, H.-K., 2003, Extraction of digital elevation models
from satellite stereo images through stereo matching based on epipolarity and scene
geometry. Image and Vision Computing, 21, pp. 789–796.
LI, F. and GOLDSTEIN, R.M., 1990, Studies of multi-baseline spaceborne interferometric
synthetic aperture radars. IEEE Transactions on Geoscience and Remote Sensing, 28,
pp. 88–97.
MASSONNET, D. and RABAUTE, T., 1993, Radar inteferometry: limits and potential. IEEE
Transactions on Geoscience and Remote Sensing, 31, pp. 455–464.
ROSEN, P., EINEDER, M., RABUS, B., GURROLA, E., HENSLEY, S., KNOPFLE, W., BREIT, H.,
ROTH, A. and WERNER, M., 2001, SRTM Mission—Cross Comparison of X and C
Band Data Properties. Proceedings of IGARSS, Sydney, Australia, unpaginated
CD-ROM.
SHAW, G. and WHEELER, D., 1985, Statistical Techniques in Geographical Analysis
(Chichester: Wiley).
SRTM vs ASTER elevation products 4837
SHORTRIDGE, A.M. and GOODCHILD, M.F., 1999, Communicating uncertainty for global data
sets. In International Symposium on Spatial Data Quality, W. Shi, M.F. Goodchild
and P.F. Fisher (Eds), pp. 56–65 (Hong Kong: Hong Kong Polytechnic University).
TOUTIN, Th., 2001, Elevation modelling from satellite VIR data: a review. International
Journal of Remote Sensing, 22, pp. 1097–1125.
TOUTIN, Th., 2004, Geometric processing of remote sensing images: models, algorithms and
method. International Journal of Remote Sensing, 25, pp. 1893–1924.
TOUTIN, Th., CHENIER, R. and CARBONNEAU, Y., 2001, 3D geometric modelling of Ikonos
Geo images. In ISPRS Joint Workshop ‘‘High Resolution from Space’’, Hannover,
unpaginated CD-ROM.
USGS, 2005, SRTM DTED. US Geological Survey; http://edc.usgs.gov/products/elevation/
srtmdted.html (accessed 15 June 2005).
WELCH, R. and MARKO, W., 1981, Cartographic potential of spacecraft line-array camera
system: stereosat. Photogrammetric Engineering and Remote Sensing, 47, pp.
1173–1185.
WERNER, M., 2001, Status of the SRTM data processing: when will the world-wide 30 m
DTM data be available? In Geo-Informationssysteme, pp. 6–10 (Heidelberg: Herbert
Wichmann/Huthig).
ZHEN, X., HUANG, X. and KWOH, L.K., 2001, Extracting DEM from SPOT stereo images. In
20th Asian Conference on Remote Sensing, Singapore, unpaginated CD-ROM.