26
Structural Determinants of Graduation Rates: A Causal Analysis Michael C. Morrison President April 2006
S St tr ru uc ct tu ur ra al l D De et te er rm mi in na an nt ts s o of f G Gr ra ad du ua at ti io on n R Ra at te es s: : A A C Ca au us sa al l A An na al ly ys si is s
M Mi ic ch ha ae el l C C. . M Mo or rr ri is so on n P Pr re es si id de en nt t
A Ap pr ri il l 2 20 00 06 6
2
S St tr ru uc ct tu ur ra al l D De et te er rm mi in na an nt ts s o of f G Gr ra ad du ua at ti io on n R Ra at te es s: : A A C Ca au us sa al l A An na al ly ys si is s
P Pu ur rp po os se e This study exams graduation rates at public twoyear, public fouryear and private fouryear colleges in the United States. Its major purpose is to account for the variance in graduation rates taking into account several institutional and institutionallyrelated student financial aid predictor variables. United States colleges and universities are the unit of analysis. College graduation rates are viewed as a function of structural differences between institutions.
L Li it te er ra at tu ur re e R Re ev vi ie ew w Any review of the many variables impacting college graduation rates needs to first take into account the strong impact of student input characteristics. Astin (200506) concludes that an institution’s degree completion rate is primarily a reflection of its entering student characteristics and that differences among institutions in their degree completion rates are primarily attributable to differences among their student bodies at the time of entry. There is such a strong relationship between student characteristics that more than twothirds of the variation in graduation rates is due to differences in their entering student bodies. Overwhelming support from the literature base supports the proposition that student background characteristics strongly impact degree completion rates (Anderson, 1987; Astin, 1993; Astin and Osequera, 2005; Astin, Tsui and Avalos, 1996; Dey and Astin, Pascarella, Smart and Ethington, 1986).
Two conceptual theories guide a considerable amount of persistence and retention research. Tinto’s (1975 and 1987) framework, labeled the Student Integration Model, explains failure to graduate to the lack of congruity between students and institutions. The predictive validity of the model is upheld as far as the role of precollege variables is concerned (Pascarella and Terenzini 1979 and 1980). However, mixed results surround the structural relations among the academic integration, social integration, and institutional and goal commitments (Braxton and Sullivan, 1987, Bers and Smith, 1989; Munro 1981; Nora 1987; Nora and Rendon, 1990; Pascarella and Terenzini 1983; Pascarella, Duby and Iverson, 1983; Pascarella and Chapman 1983; Pascarella, Smart and Ethington, 1986; Stage, 1988 and 1989).
An alternative model, labeled the “Student Attrition Model”, has been advanced by Bean (1980, 1982, 1982, 1983, 1985, and 1990). Bean
3
borrows concepts from psychology whereby beliefs shape attitudes and attitudes, in turn, influence behavioral intents. External factors to the institution also play an influential role in affecting both attitudes and persistence decisions. Bean and Vesper (1990) identified only six environmental, personal and organizational variables accounting for most of the variance in dropping out in a Midwestern college.
Nora and Castaneda (1993) merged Tinto and Bean’s conceptual models and tested all the nonoverlapping propositions underlying both frameworks. The integrated model accounted for 45 percent of the variance in persistence and 42 percent of the variance in “Intent to Persist”. Furthermore, 82 percent of hypothesized relations among the exogenous and endogenous variables were upheld.
Pascarella and Terenzini (1991) found the following organizational variables to influence graduation rates: colleges that attracted a higher proportion of fulltime and female students; institutional characteristics that promoted social integration; and instructional expenditures. In 2005 Pascarella and Terenzini found smaller influences of institutional characteristics, but did find an inverse relationship between college size and retention. Hamrick, Schuh and Shelley, II. (2004) modeled graduation rates as dependent on institutional characteristics: Carnegie type, selectivity and resource allocations: instructional expenditures and student affairs expenditures. Astin’s (1975) pioneering work identified higher persistence rates among more selective colleges.
Osequera (200506) analyzed graduation rates of 63,640 firsttime fulltime freshman undergraduates at 303 colleges and universities. He found that structural measures affected degree completion over and above student input variables. The principal structural variables inhibiting degree completion are large institutional size, low selectivity, commuting (rather than residence hall living), working offcampus, over reliance on financial aid that accrues debt payments, public control and low levels of instructional expenditures.
Bailey, Calcagno, Jenkins, Kienzl, and Leinbach (2005) found a number of community college characteristics related to student outcomes: Institution size is negatively correlated with successful student outcomes; a larger percentage of minority students (black, Hispanic, and Native American) at an institution is associated with lower graduation rates; higher percentages of students who are parttime tend to be related to lower graduation rates; a larger percentage of faculty who are parttime also correlates with lower student graduation rates at community colleges; rates of instructional expenditures and
4
student service expenditures have some positive impacts on graduation rates; and the state in which a college is located has significant impact on institutional graduation rates.
The same authors (Bailey, Calcagno, Jenkins, Kienzl, and Leinbach (2005)) determined that 60 percent of the variation in graduation rates were primarily explained by institutional characteristics such as location, size, expenditures, and student composition. Astin, Tsui, and Avalos (1996) in a study of 365 baccalaureate institutions found that private universities had the highest graduation rates, and attributed such outcomes to the enrollment of better prepared students. Also, highly selective institutions and those that enroll large numbers of students in fields like business, psychology, and the social sciences have higher graduation rates. Scott, Bailey, and Kienzl (2005) found that private colleges and those with students with higher average SAT scores, a higher proportion of women, and higher instructional expenditures per fulltime equivalent student had higher graduation rates. Lower graduation rates were associated with institutions with higher proportions of older students, minority students and parttime students. Also, they concluded that institutions with higher instate tuition also tended to have higher graduation rates, controlling for student characteristics.
Modeling baccalaureate college graduation rates Mortenson (1997) and Porter (2000) found similar findings regarding the importance of SAT scores for higher graduation rates. In addition, colleges with higher expenditures per student, higher percentage of freshmen living on campus as well as a higher proportion of enrolled females had higher graduation rates. Lower graduation rates were associated with colleges with many parttime students and relatively large engineering programs. Goenner and Snaith (2004) findings identify students’ GPA and SAT scores as important and positive predictors of institutional graduation rates. They also found that institutions in urban areas, the percentage of Native American students, the percentage of male students, and a student body with higher average age are all factors associated with lower institutional graduation rates.
Walker (2005) identified key distinctions between high graduation and low graduation rate institutions. Institutions that experienced high graduation rates exhibited the following characteristics: have higher enrollments of fulltime students; are more likely to attract students of traditional college age (18 – 24 years of age); have greater percentages of fulltime faculty; have lower student/faculty ratios; have higher expenditures per FTE student; rely on tuition to cover expenditures less than lower graduation rate institutions; are more
5
likely to enroll students who are academically advantaged upon college entrance and receive financial aid in the form of institutional grants.
Bailey, Alfonso, Scott, and Leinbach (2004) have identified many characteristics of community college students which place those institutions at a “graduation rate” disadvantage when comparisons are made with baccalaureate college graduation rates. Community Colleges typically enroll students with lower test scores in high school and are far more likely to delay enrollment in college after high school, attend part time, or interrupt their college studies. Also, they are much more likely to come from households in the lower socioeconomic quartiles.
Ryan (2004) studied 363 baccalaureate institutions to determine the impact of institutional expenditures for instruction, academic support, student services, and administrative support on graduation rates. Instructional and academic support expenditures have positive and significant effects on graduation rates, supporting research by Astin (1993). Contradicting other research findings, expenditures on student services and expenditures on administrative (institutional) support failed to produce any significant impact on graduation rates. Bailey, Calcagno, Carlos, Jenkins, Davis, Kienzl, and Leinbach (2005) found an inverse relationship between graduation rates and students enrolled in mediumsize community colleges (1,0015,000 FTE undergraduates. The adverse effect is between 13 and 15 percent higher attrition for students enrolled in a mediumsize community college (compared to students in small institutions fewer than 1,000 FTE undergraduates). Students enrolled in institutions with large proportions of parttime faculty and minority populations are less likely to graduate.
Titus (2004), merging two national datasets with individual student data, concluded that persistence is higher at more selective, residential, and larger institutions.
The bulk of this literature review appears to support Titus’ (2003) claim that structural differences between institutions may be as important to college persistence as differences in individual students’ experiences and commitments. The purpose of this analysis is to add to that body of research which analyzes the impact of structural determinants on graduation rates.
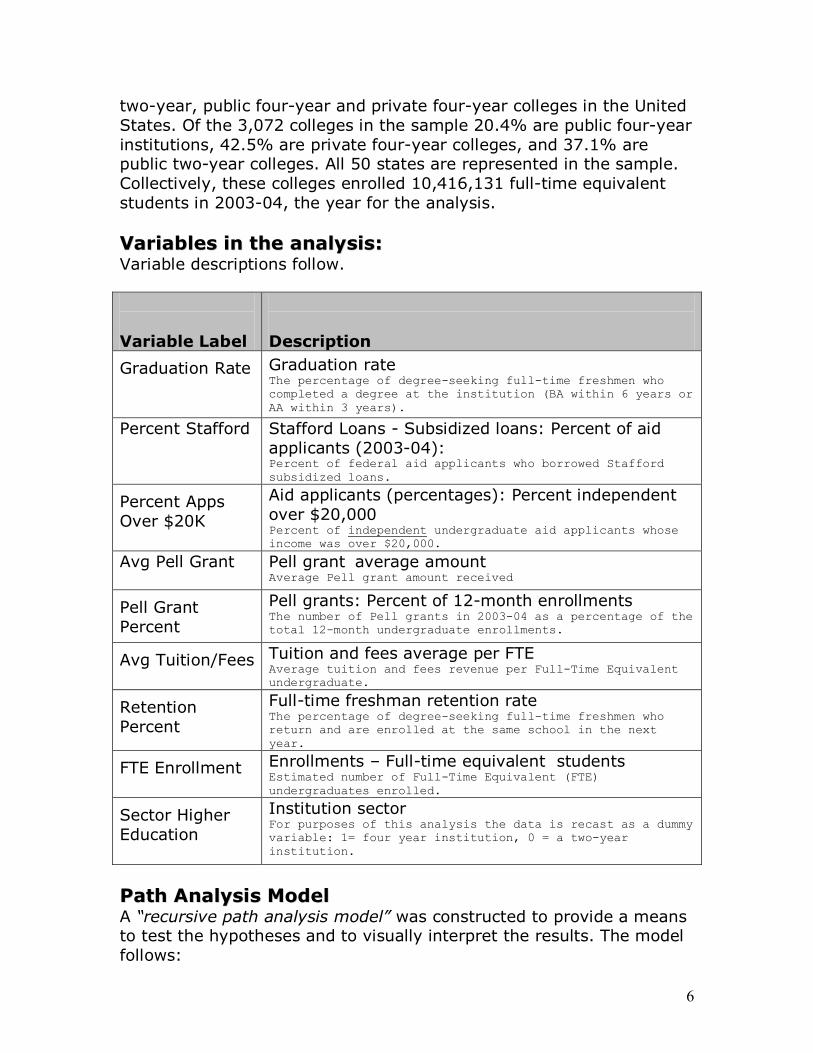
D Da at ta a a an nd d S Sa am mp pl le e Graduation rate and structural institutional data was obtained from Economic Diversity of Colleges.org. Sample size equals 3,072 public
6
twoyear, public fouryear and private fouryear colleges in the United States. Of the 3,072 colleges in the sample 20.4% are public fouryear institutions, 42.5% are private fouryear colleges, and 37.1% are public twoyear colleges. All 50 states are represented in the sample. Collectively, these colleges enrolled 10,416,131 fulltime equivalent students in 200304, the year for the analysis.
V Va ar ri ia ab bl le es s i in n t th he e a an na al ly ys si is s: : Variable descriptions follow.
Variable Label Description
Graduation Rate Graduation rate The percentage of degreeseeking fulltime freshmen who completed a degree at the institution (BA within 6 years or AA within 3 years).
Percent Stafford Stafford Loans Subsidized loans: Percent of aid applicants (200304): Percent of federal aid applicants who borrowed Stafford subsidized loans.
Percent Apps Over $20K
Aid applicants (percentages): Percent independent over $20,000 Percent of independent undergraduate aid applicants whose income was over $20,000.
Avg Pell Grant Pell grant average amount Average Pell grant amount received
Pell Grant Percent
Pell grants: Percent of 12month enrollments The number of Pell grants in 200304 as a percentage of the total 12month undergraduate enrollments.
Avg Tuition/Fees Tuition and fees average per FTE Average tuition and fees revenue per FullTime Equivalent undergraduate.
Retention Percent
Fulltime freshman retention rate The percentage of degreeseeking fulltime freshmen who return and are enrolled at the same school in the next year.
FTE Enrollment Enrollments – Fulltime equivalent students Estimated number of FullTime Equivalent (FTE) undergraduates enrolled.
Sector Higher Education
Institution sector For purposes of this analysis the data is recast as a dummy variable: 1= four year institution, 0 = a twoyear institution.
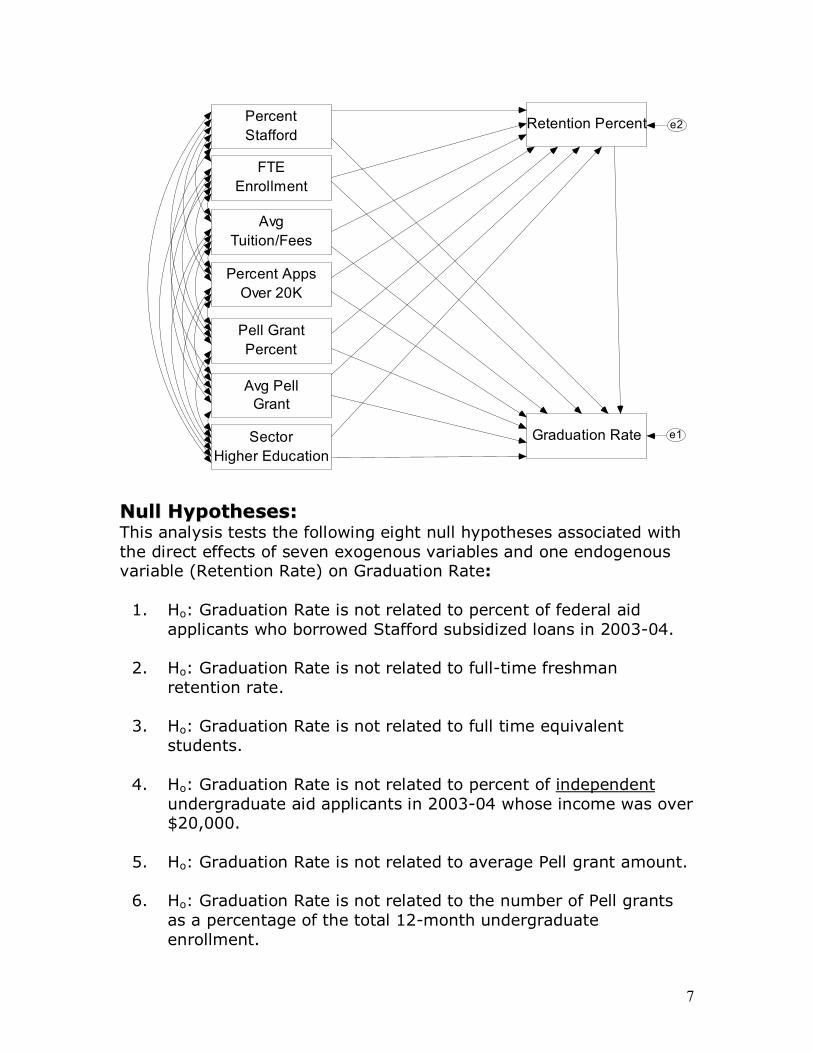
P Pa at th h A An na al ly ys si is s M Mo od de el l A “recursive path analysis model” was constructed to provide a means to test the hypotheses and to visually interpret the results. The model follows:
7
FTE Enrollment
Avg Tuition/Fees
Percent Apps Over 20K
Avg Pell Grant
Pell Grant Percent
Retention Percent Percent Stafford
Graduation Rate e1 Sector Higher Education
e2
N Nu ul ll l H Hy yp po ot th he es se es s: : This analysis tests the following eight null hypotheses associated with the direct effects of seven exogenous variables and one endogenous variable (Retention Rate) on Graduation Rate:
1. Ho: Graduation Rate is not related to percent of federal aid applicants who borrowed Stafford subsidized loans in 200304.
2. Ho: Graduation Rate is not related to fulltime freshman retention rate.
3. Ho: Graduation Rate is not related to full time equivalent students.
4. Ho: Graduation Rate is not related to percent of independent undergraduate aid applicants in 200304 whose income was over $20,000.
5. Ho: Graduation Rate is not related to average Pell grant amount.
6. Ho: Graduation Rate is not related to the number of Pell grants as a percentage of the total 12month undergraduate enrollment.
8
7. Ho: Graduation Rate is not related to average tuition and fees revenue per fulltime equivalent undergraduates.
8. Ho: Graduation Rate is not related to the type of institution (fouryear vs. twoyear).
Likewise, the analysis tests the following null hypotheses associated with the direct effects of seven exogenous variables on Retention Percent:
9. Ho: Retention Percent is not related to percent of federal aid applicants who borrowed Stafford subsidized loans in 200304.
10. Ho: Retention Percent is not related to full time equivalent students.
11. Ho: Retention Percent is not related to percent of independent undergraduate aid applicants in 200304 whose income was over $20,000.
12. Ho: Retention Percent is not related to average Pell grant amount received.
13. Ho: Retention Percent is not related to the number of Pell grants as a percentage of the total 12month undergraduate enrollment.
14. Ho: Retention Percent is not related to average tuition and fees revenue per fulltime equivalent undergraduates.
15. Ho: Retention Percent is not related to the type of institution (fouryear vs. twoyear).
As Retention Percent mediates the effects of the exogenous variables on Graduation rate, the direct, indirect and total effects of the exogenous variables on Graduation Rate will be identified and analyzed.
In addition, the path model will be tested to determine if the data fit the model.
16. The null hypothesis (Ho) being tested is that the postulated model holds in the population. “In contrast to traditional statistical procedures the researcher hopes not to reject Ho.” (Byrne, 2001:78)
9
S St ta at ti is st ti ic ca al l T Te ec ch hn ni iq qu ue e Multiple regression employing maximum likelihood estimation and path analysis techniques were utilized to:
• Test the null hypotheses and the model.
• Determine the amount of variance in Retention Percent and Graduation Rate explained by the model; and
• Develop a parsimonious model for the endogenous variables.
AMOS, version 6, was utilized as the statistical program.
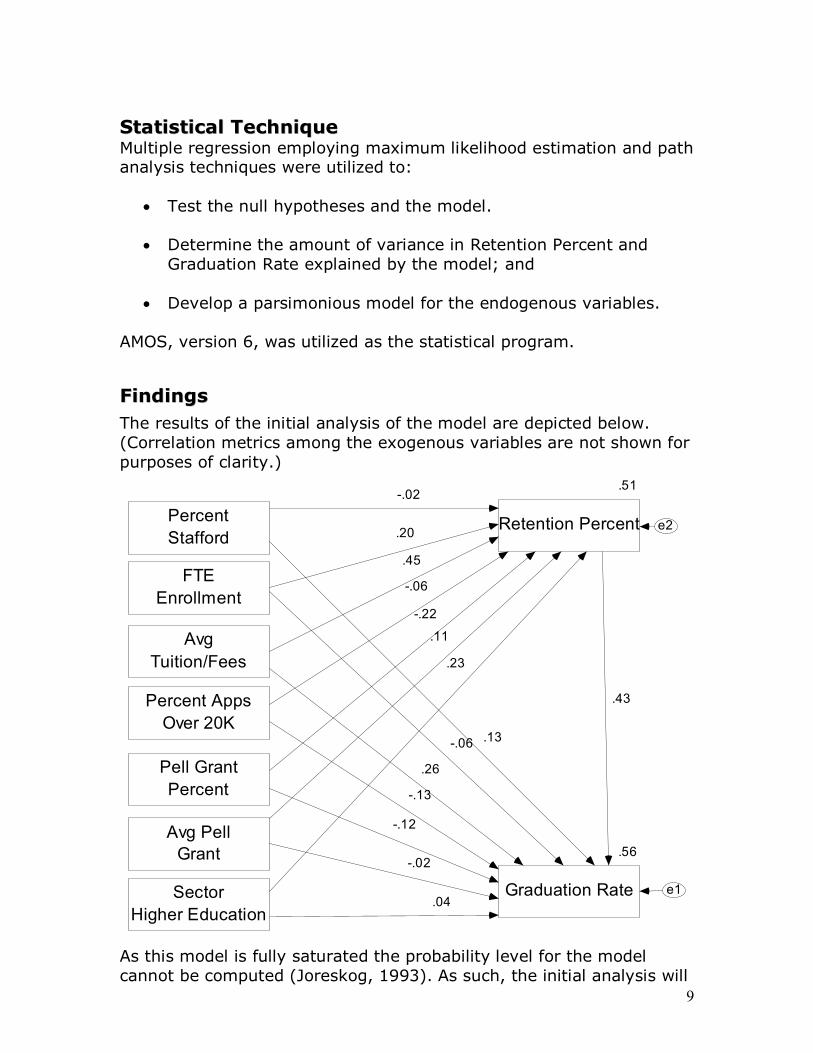
F Fi in nd di in ng gs s The results of the initial analysis of the model are depicted below. (Correlation metrics among the exogenous variables are not shown for purposes of clarity.)
FTE Enrollment
Avg Tuition/Fees
Percent Apps Over 20K
Avg Pell Grant
Pell Grant Percent
.51
Retention Percent Percent Stafford
.56
Graduation Rate e1 Sector Higher Education
e2
.43
.13 .06
.26
.13
.12
.04
.02
.02
.20
.45
.06
.11
.22
.23
As this model is fully saturated the probability level for the model cannot be computed (Joreskog, 1993). As such, the initial analysis will
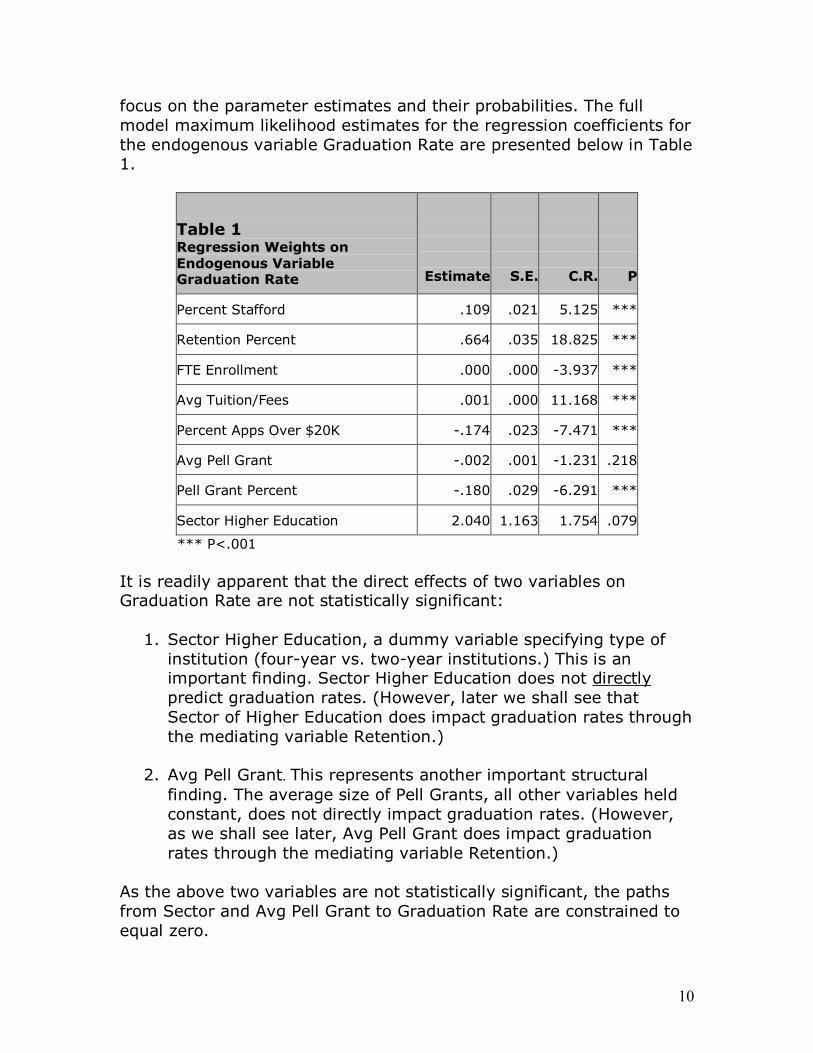
10
focus on the parameter estimates and their probabilities. The full model maximum likelihood estimates for the regression coefficients for the endogenous variable Graduation Rate are presented below in Table 1.
Table 1 Regression Weights on Endogenous Variable Graduation Rate Estimate S.E. C.R. P
Percent Stafford .109 .021 5.125 ***
Retention Percent .664 .035 18.825 ***
FTE Enrollment .000 .000 3.937 ***
Avg Tuition/Fees .001 .000 11.168 ***
Percent Apps Over $20K .174 .023 7.471 ***
Avg Pell Grant .002 .001 1.231 .218
Pell Grant Percent .180 .029 6.291 ***
Sector Higher Education 2.040 1.163 1.754 .079
*** P<.001
It is readily apparent that the direct effects of two variables on Graduation Rate are not statistically significant:
1. Sector Higher Education, a dummy variable specifying type of institution (fouryear vs. twoyear institutions.) This is an important finding. Sector Higher Education does not directly predict graduation rates. (However, later we shall see that Sector of Higher Education does impact graduation rates through the mediating variable Retention.)
2. Avg Pell Grant. This represents another important structural finding. The average size of Pell Grants, all other variables held constant, does not directly impact graduation rates. (However, as we shall see later, Avg Pell Grant does impact graduation rates through the mediating variable Retention.)
As the above two variables are not statistically significant, the paths from Sector and Avg Pell Grant to Graduation Rate are constrained to equal zero.
11
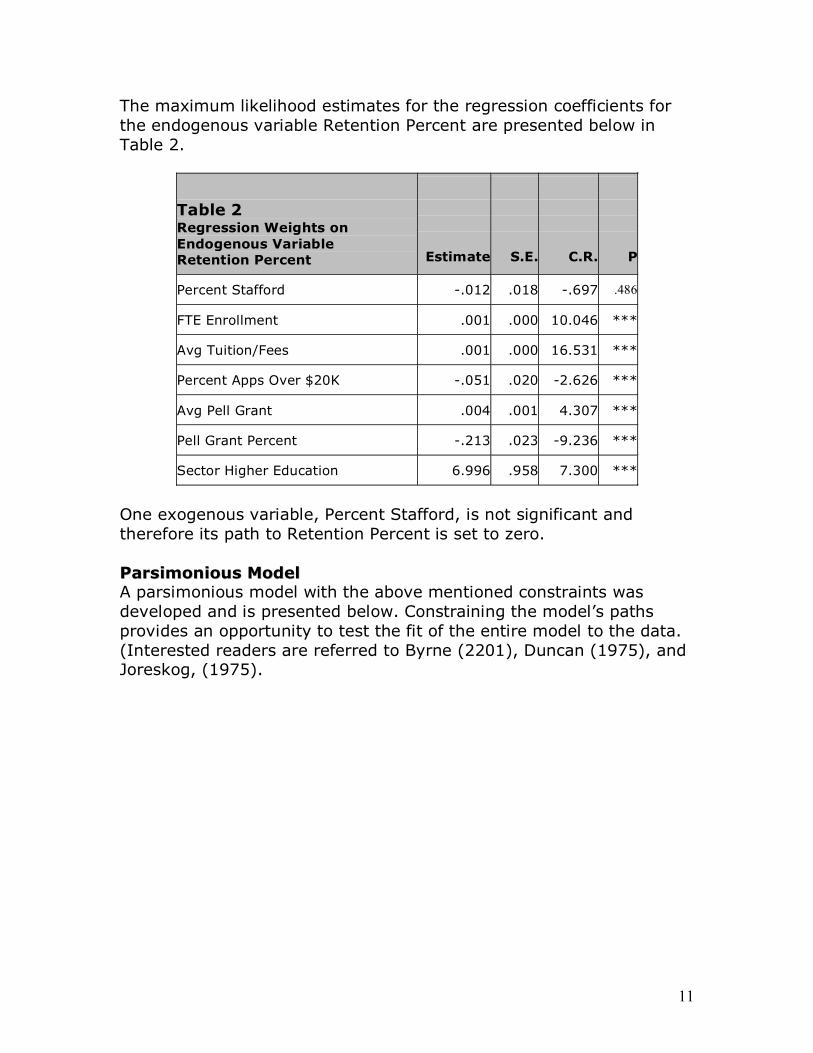
The maximum likelihood estimates for the regression coefficients for the endogenous variable Retention Percent are presented below in Table 2.
Table 2 Regression Weights on Endogenous Variable Retention Percent Estimate S.E. C.R. P
Percent Stafford .012 .018 .697 .486
FTE Enrollment .001 .000 10.046 ***
Avg Tuition/Fees .001 .000 16.531 ***
Percent Apps Over $20K .051 .020 2.626 ***
Avg Pell Grant .004 .001 4.307 ***
Pell Grant Percent .213 .023 9.236 ***
Sector Higher Education 6.996 .958 7.300 ***
One exogenous variable, Percent Stafford, is not significant and therefore its path to Retention Percent is set to zero.
P Pa ar rs si im mo on ni io ou us s M Mo od de el l A parsimonious model with the above mentioned constraints was developed and is presented below. Constraining the model’s paths provides an opportunity to test the fit of the entire model to the data. (Interested readers are referred to Byrne (2201), Duncan (1975), and Joreskog, (1975).
12
FTE Enrollment
Avg Tuition/Fees
Percent Apps Over 20K
Avg Pell Grant
Pell Grant Percent
.51
Retention Percent Percent Stafford
.57
Graduation Rate e1 Sector Higher Education
e2
.44
.14 .06
.27
.12
.12
.00
.00
.00
.19
.44
.07
.10
.23
.23
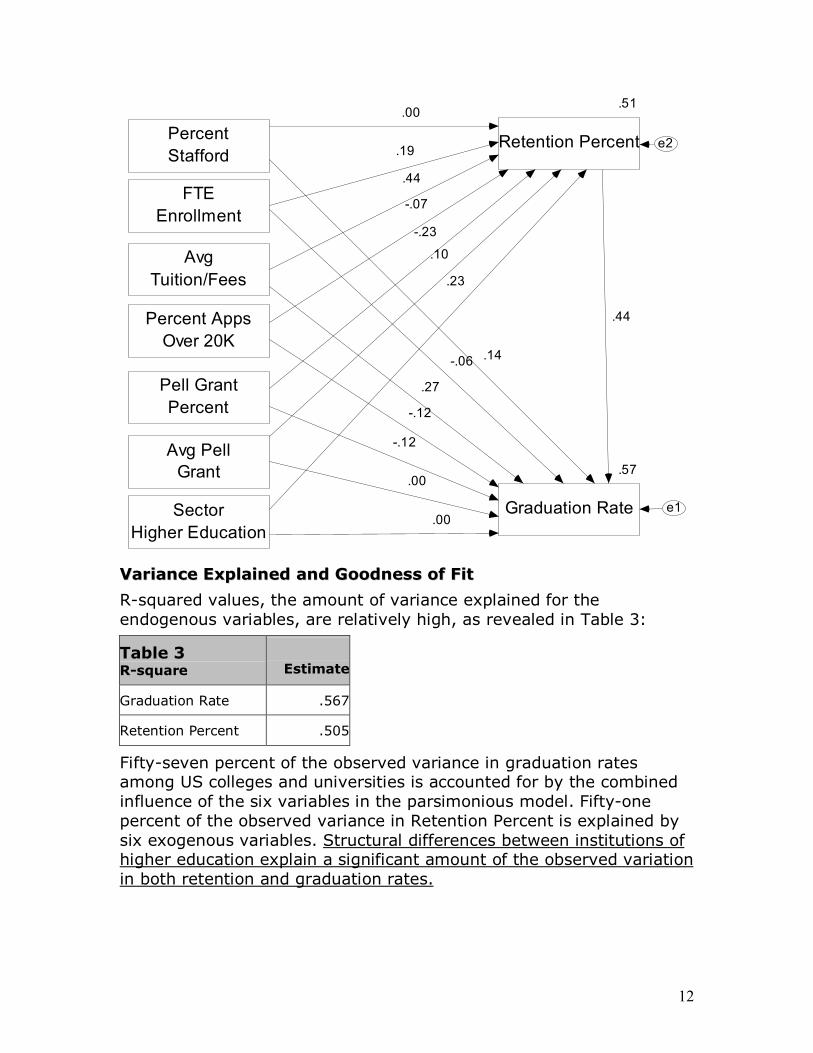
V Va ar ri ia an nc ce e E Ex xp pl la ai in ne ed d a an nd d G Go oo od dn ne es ss s o of f F Fi it t
Rsquared values, the amount of variance explained for the endogenous variables, are relatively high, as revealed in Table 3:
Table 3 Rsquare Estimate
Graduation Rate .567
Retention Percent .505
Fiftyseven percent of the observed variance in graduation rates among US colleges and universities is accounted for by the combined influence of the six variables in the parsimonious model. Fiftyone percent of the observed variance in Retention Percent is explained by six exogenous variables. Structural differences between institutions of higher education explain a significant amount of the observed variation in both retention and graduation rates.
13
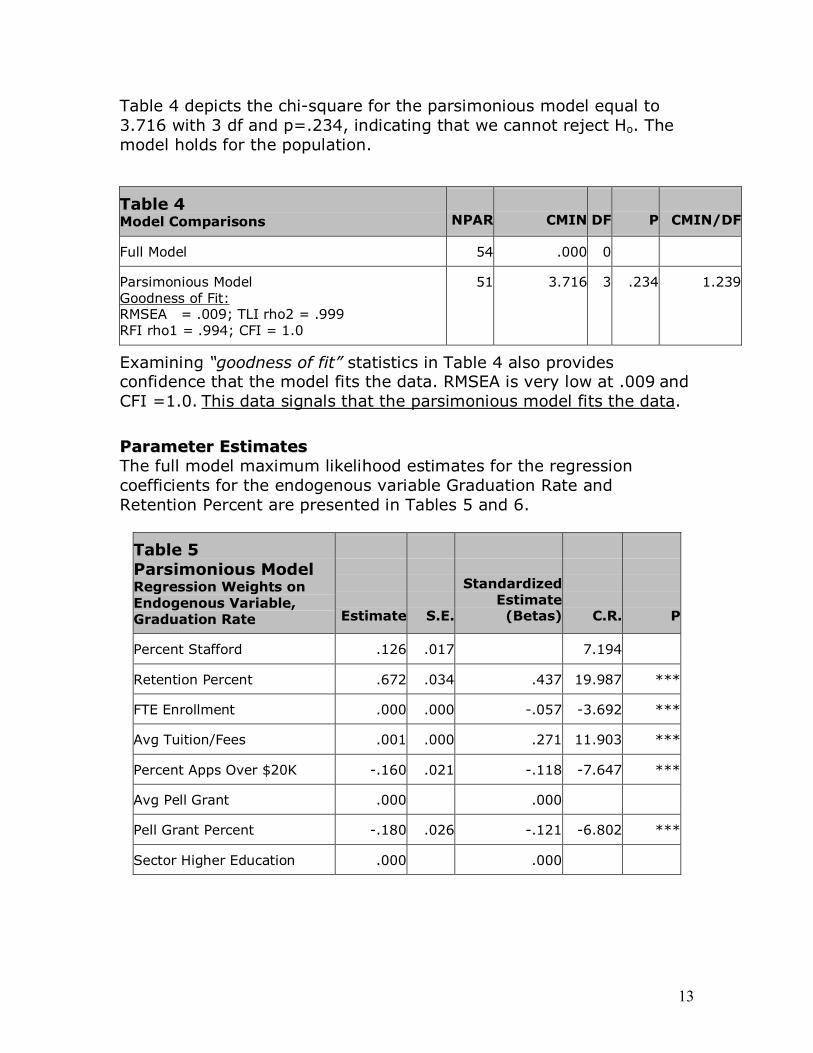
Table 4 depicts the chisquare for the parsimonious model equal to 3.716 with 3 df and p=.234, indicating that we cannot reject Ho. The model holds for the population.
Table 4 Model Comparisons NPAR CMIN DF P CMIN/DF
Full Model 54 .000 0
Parsimonious Model Goodness of Fit: RMSEA = .009; TLI rho2 = .999 RFI rho1 = .994; CFI = 1.0
51 3.716 3 .234 1.239
Examining “goodness of fit” statistics in Table 4 also provides confidence that the model fits the data. RMSEA is very low at .009 and CFI =1.0. This data signals that the parsimonious model fits the data.
P Pa ar ra am me et te er r E Es st ti im ma at te es s The full model maximum likelihood estimates for the regression coefficients for the endogenous variable Graduation Rate and Retention Percent are presented in Tables 5 and 6.
Table 5 Parsimonious Model Regression Weights on Endogenous Variable, Graduation Rate Estimate S.E.
Standardized Estimate (Betas) C.R. P
Percent Stafford .126 .017 7.194
Retention Percent .672 .034 .437 19.987 ***
FTE Enrollment .000 .000 .057 3.692 ***
Avg Tuition/Fees .001 .000 .271 11.903 ***
Percent Apps Over $20K .160 .021 .118 7.647 ***
Avg Pell Grant .000 .000
Pell Grant Percent .180 .026 .121 6.802 ***
Sector Higher Education .000 .000
14
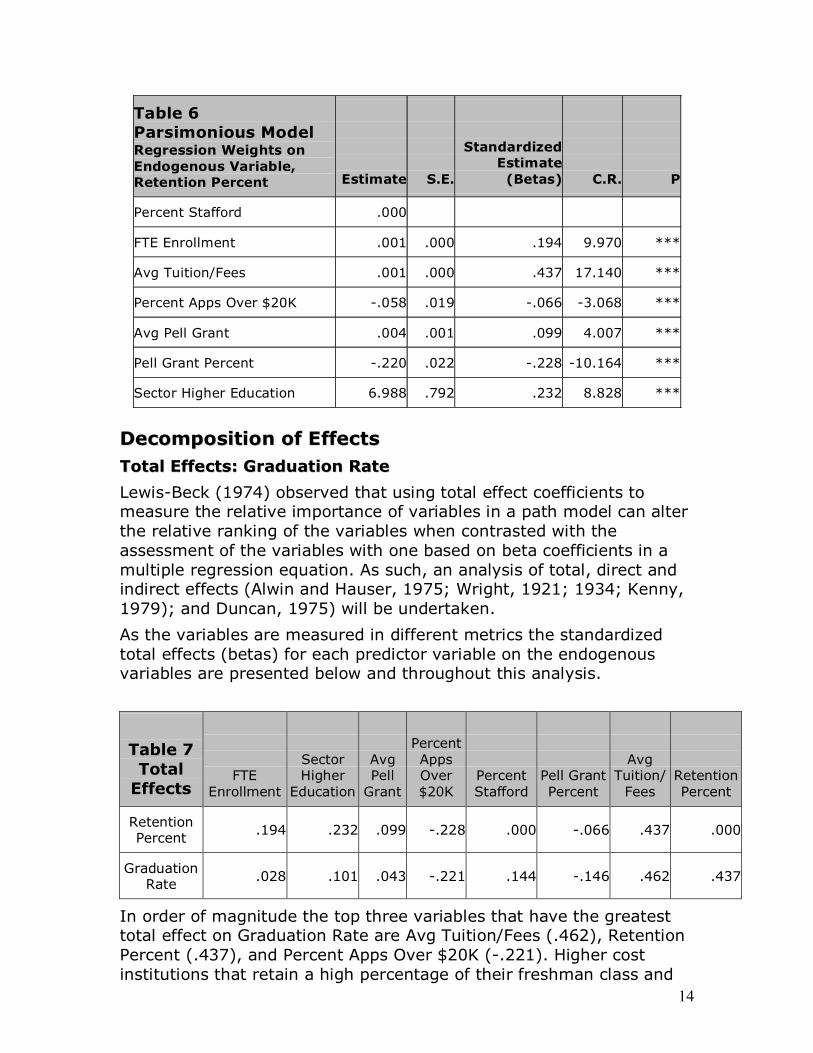
Table 6 Parsimonious Model Regression Weights on Endogenous Variable, Retention Percent Estimate S.E.
Standardized Estimate (Betas) C.R. P
Percent Stafford .000
FTE Enrollment .001 .000 .194 9.970 ***
Avg Tuition/Fees .001 .000 .437 17.140 ***
Percent Apps Over $20K .058 .019 .066 3.068 ***
Avg Pell Grant .004 .001 .099 4.007 ***
Pell Grant Percent .220 .022 .228 10.164 ***
Sector Higher Education 6.988 .792 .232 8.828 ***
D De ec co om mp po os si it ti io on n o of f E Ef ff fe ec ct ts s T To ot ta al l E Ef ff fe ec ct ts s: : G Gr ra ad du ua at ti io on n R Ra at te e
LewisBeck (1974) observed that using total effect coefficients to measure the relative importance of variables in a path model can alter the relative ranking of the variables when contrasted with the assessment of the variables with one based on beta coefficients in a multiple regression equation. As such, an analysis of total, direct and indirect effects (Alwin and Hauser, 1975; Wright, 1921; 1934; Kenny, 1979); and Duncan, 1975) will be undertaken.
As the variables are measured in different metrics the standardized total effects (betas) for each predictor variable on the endogenous variables are presented below and throughout this analysis.
Table 7 Total Effects
FTE Enrollment
Sector Higher Education
Avg Pell Grant
Percent Apps Over $20K
Percent Stafford
Pell Grant Percent
Avg Tuition/ Fees
Retention Percent
Retention Percent .194 .232 .099 .228 .000 .066 .437 .000
Graduation Rate .028 .101 .043 .221 .144 .146 .462 .437
In order of magnitude the top three variables that have the greatest total effect on Graduation Rate are Avg Tuition/Fees (.462), Retention Percent (.437), and Percent Apps Over $20K (.221). Higher cost institutions that retain a high percentage of their freshman class and
15
have proportionately fewer independent financial aid applicants with assets over $20,000 enjoy higher graduation rates. Retention Percent and Avg Tuition/Fees each have twice the impact on Graduation Rate compared to the impact of Percent Apps Over $20K.
More modest total effects are observed for Pell Grant Percent (.146), Percent Stafford (.144), and Sector Higher Education (.101). As the percentage of Pell grant recipients increases the lower the graduation rates, but as the percent of financial aid applicants who borrow from the Stafford loan program increases, graduation rates are elevated.
It could very well be that the percent of Pell Grant Percent variable is a proxy for socioeconomic status (SES), which has a well documented research base revealing an inverse relationship to graduation rates. Avg Pell Grant (.043), on the other hand, has a much more modest and direct total impact. Nonetheless, the percent of total students who receive Pell grants has over three times the impact on graduation rates than the average Pell grant received. Size of the institution, as operationalized by FTE Enrollment (.028), has the least total effect on Graduation Rate.
T To ot ta al l E Ef ff fe ec ct ts s: : R Re et te en nt ti io on n P Pe er rc ce en nt t
Table 6 reveals the top three variables that have the greatest total effect on Retention Percent: Avg Tuition/Fees (.437), Sector of Higher Education (.232), followed very closely by Percent Apps Over $20K (.228). Fouryear institutions with higher than average tuition and fees with proportionately fewer independent financial aid applicants with assets over $20,000 enjoy higher retention rates than twoyear institutions with lower average tuition/fees and proportionately higher independent financial aid applicants with assets over $20,000.
All other things equal, higher tuition and fees have nearly twice as much impact on retention rates as the choice to attend a fouryear versus a twoyear institution. Independent students with assets over $20,000 do not persist as desired. Size of the institution is directly related to retention as is average Pell grant. The two Pell grant variables – Avg Pell Grant (.099) and Pell Grant Percent (.066) – have more modest total effects and work in opposite directions in impacting Retention Percent, emulating the same pattern as was found for their total effects on Graduation Rate.
D De ec co om mp po os si it ti io on n o of f D Di ir re ec ct t a an nd d I In nd di ir re ec ct t E Ef ff fe ec ct ts s o on n G Gr ra ad du ua at ti io on n R Ra at te e
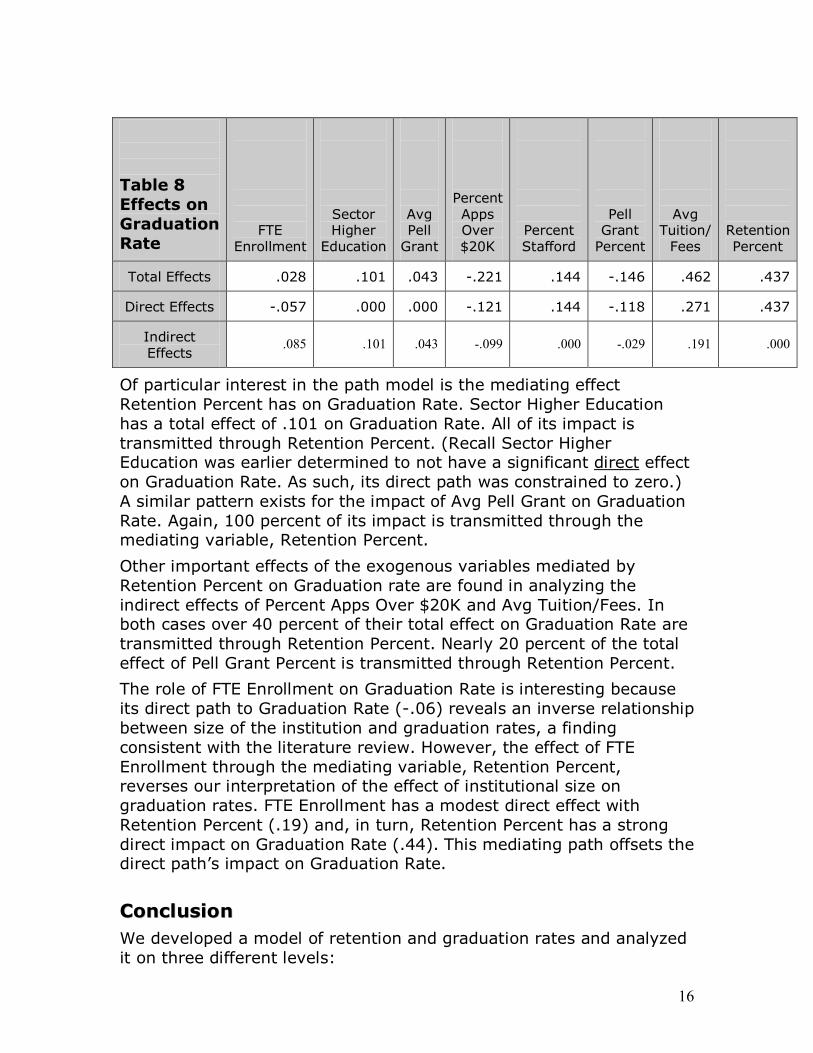
Table 6 depicts the total, direct and indirect effects of all variables in the parsimonious model of Graduation Rate.
16
Table 8 Effects on Graduation Rate
FTE Enrollment
Sector Higher Education
Avg Pell Grant
Percent Apps Over $20K
Percent Stafford
Pell Grant Percent
Avg Tuition/ Fees
Retention Percent
Total Effects .028 .101 .043 .221 .144 .146 .462 .437
Direct Effects .057 .000 .000 .121 .144 .118 .271 .437
Indirect Effects
.085 .101 .043 .099 .000 .029 .191 .000
Of particular interest in the path model is the mediating effect Retention Percent has on Graduation Rate. Sector Higher Education has a total effect of .101 on Graduation Rate. All of its impact is transmitted through Retention Percent. (Recall Sector Higher Education was earlier determined to not have a significant direct effect on Graduation Rate. As such, its direct path was constrained to zero.) A similar pattern exists for the impact of Avg Pell Grant on Graduation Rate. Again, 100 percent of its impact is transmitted through the mediating variable, Retention Percent.
Other important effects of the exogenous variables mediated by Retention Percent on Graduation rate are found in analyzing the indirect effects of Percent Apps Over $20K and Avg Tuition/Fees. In both cases over 40 percent of their total effect on Graduation Rate are transmitted through Retention Percent. Nearly 20 percent of the total effect of Pell Grant Percent is transmitted through Retention Percent.
The role of FTE Enrollment on Graduation Rate is interesting because its direct path to Graduation Rate (.06) reveals an inverse relationship between size of the institution and graduation rates, a finding consistent with the literature review. However, the effect of FTE Enrollment through the mediating variable, Retention Percent, reverses our interpretation of the effect of institutional size on graduation rates. FTE Enrollment has a modest direct effect with Retention Percent (.19) and, in turn, Retention Percent has a strong direct impact on Graduation Rate (.44). This mediating path offsets the direct path’s impact on Graduation Rate.
C Co on nc cl lu us si io on n We developed a model of retention and graduation rates and analyzed it on three different levels:

17
1) The amount of variance accounted for by the model. Overall, we are quite satisfied that the model explains 57 percent of the observed variation in graduation rates, as well as 51 percent of the observed variation in retention rates.
2) Variable parameters were tested against a series of null hypotheses to develop a parsimonious model and to asses the total, direct and indirect effects of each predictor variable on the endogenous variable.
3) The parsimonious model fits the data very well with very good measures of fit. We are confident that the model holds for the population.
Structural characteristics of American colleges, at two and fouryear institutions, significantly impact college retention and graduation rates. The path analysis model revealed that graduation rates are regulated by both exogenous variables and significantly by the endogenous variable retention.
The exogenous variables in this analysis
• Percent Stafford
• Percent Apps Over $20K
• Avg Pell Grant
• Pell Grant Percent
• Avg Tuition/Fees
• FTE Enrollment
• Sector Higher Education
are independent, external inputs into the system and as such have the property that they only cause the endogenous variable but not vice versa. These exogenous variables may be thought as the sources of change. Thus, if one desires from purely a structural point of view to improve retention and graduation rates then one could develop strategies to manipulate these structural change agents to maximize desired retention and graduation rates. An example follows.
We have observed that the sector of higher education (two versus fouryear colleges) does not have a direct impact on graduation rates. It is only through the mediating effect of retention does sector of higher education have an impact on graduation rates. Therefore, community colleges desiring to improve their graduation rates would be well advised to develop strategies that improve the percentage of degreeseeking fulltime freshmen who return and are enrolled at the same school in the next year.
18
We concluded our review of the literature with Titus’ (2003) claim that structural differences between institutions may be as important to college persistence as differences in individual students’ experiences and commitments. We end this analysis with the observation that Titus may well be right.
19
Bibliography
Adelman, C. (2003). Replicating the “tool box” hypotheses: Challenges in the data sets. Paper presented at the Annual Meeting of the Association for the Study of Higher Education, Portland, OR.
Adelman, C. (1999). Answers in the tool box: Academic intensity, attendance patterns, and bachelor’s degree attainment. Washington, DC: National Center for Education Statistics.
Adelman, C. (2003, November). Replicating the “tool box” hypotheses: Challenges in the data sets. Paper presented at the Annual Meeting of the Association for the Study of Higher Education, Portland, OR.
Alfonso, M. (2004). Educational attainment of Hispanics in sub baccalaureate education. Paper presented at the Roundtable on Community Colleges and Latino Educational Opportunity, The Civil Rights Project at Harvard University, Cambridge.
Alfonso, M., Bailey, T., and Scott, M. (2005). The educational outcomes of occupational subbaccalaureate students: Evidence from the 1990s. Economics of Education Review, 24(2), 197 212.
Alwin, D. and Hauser, R. (1975). The decomposition of effects in path analysis. American Sociological Review, 40, 3747.
Anderson, K. (1987). Persistence, student background, and integration/commitment: Variation by definition of persistence and institutional type. Paper presented at the annual meeting of the Association for the Study of Higher Education, Baltimore, MD.
Arulampalam, W. (1999). Practitioners’ corner: A note on estimated coefficients in random effects probit models. Oxford Bulletin of Economics and Statistics, 61(4), 597602.
Astin, A. W. (1993). What matters in college: Four critical years revisited. San Francisco: JosseyBass.
Astin, A. W. (1997). How “good” is your institution’s retention rate? Research in Higher Education, 38(6), 647658.
Astin, A. W. (20052006), Making sense out of degree completion
20
rates. Journal of College Student Retention, 7(12), 5 17.
Astin, A. W., and Oseguera, L. (2005) Degree attainment among Latino undergraduates: Rethinking timetodegree. Berkeley: California Policy Research Institute. UC Latino Policy Institute.
Astin, A. W., Tsui, L., & Avalos, J. (1996). Degree attainment rates at American colleges and universities: Effects of race, gender, and institutional type. Los Angeles: Higher Education Research Institute, UCLA.
Bailey, T., Calcagno, J.C., Jenkins, D., Kienzl, G, and Leinbach T. (2005). Is studentrighttoknow all you should know? An analysis of community college graduation rates. Community College Research Center, Teachers College, Columbia University.
Bailey, T., Calcagno, J.C., Jenkins, D., Kienzl, G., and Leinbach, T. (2005). Community College student success: What institutional characteristics make a difference? Community College Research Center, Teachers College, Columbia University.
Bailey, T., Calcagno, J.C., Jenkins, D., Leinbach, D., & Kienzl G. (2005). The effects of institutional factors on the success of community college students. New York: Columbia University, Teachers College, Community College Research Center.
Bailey, T., Jenkins, D., and Leinbach, T. (2005). Is student success labeled institutional failure? Student goals and graduation rates in the accountability debate at community colleges. Community College Research Center, Teachers College, Columbia University.
Bailey, T., Jenkins, D., & Leinbach, D. (2006). Is student success labeled institutional failure? Student goals and graduation rates in the accountability debate at community colleges. New York: Columbia University, Teachers College, Community College Research Center.
Bailey, T., Kienzl, G. S., & Marcotte, D. (2006). The return to a subbaccalaureate education: The effects of schooling, credentials, and program of study on economic outcomes. New York: Columbia University, Teachers College, Community College Research Center.
Bailey, T., & Alfonso, M. (2005, January). Paths to persistence: An analysis of research on program effectiveness at community colleges. New Agenda Series. Indianapolis: Lumina Foundation
21
for Education.
Bailey, T., Alfonso, M., Scott, M., & Leinbach, T. (2005). Educational outcomes of occupational postsecondary students. New York: Columbia University, Teachers College, Community College Research Center.
Bean, J. (1980). Dropouts and turnover: The synthesis and test of a causal model of student attrition. Research in Higher Education, 12, 155187.
Bean, J. (1982). Student attrition, intentions and confidence: Interaction effects in a path model. Research in Higher Education, 17, 291319.
Bean, J. (1983). The application of a model of turnover in work organizations to student attrition process. Review of High Education, 6, 129148.
Bean, J. (1985). Interaction effects based on a class level in an exploratory model of college student dropout syndrome. American Educational Research, 22, 3564.
Bean, J. (1990). Why students leave: Insights from research. In The strategic management of college enrollments, edited by D. Hossler and associates, San Francisco: CA: JosseyBass, 147 169.
Bean, J. and Vesper, (1990). Quantitative approaches to grounding theory in data using LISREL to develop a local model and theory of student attrition. Annual meeting of the American Educational Research Association, Boston, MA.
Bers, T. and Smith, K. (1989). Persistence of community college students: The influence of academic and social integration. Paper presented at the Association for the Study of Higher Education annual meeting, Portland, OR.
Berger, J. B., & Braxton, J. M. (1998). Revising Tinto’s interactionist theory of student departure through theory elaboration: Examining the roles of organizational attributes in the persistence process. Research in Higher Education, 39, 103119.
Braxton J. and Sullivan, A. (1997). Appraising Tinto’s theory of college student departure. In Smart, J. (Ed.). Higher education:
22
Handbook of theory and research. 12, Bronx, N.Y.: Agathon Press.
Burd, S. (2004, April 2). Graduation rates called a poor measure of colleges. The Chronicle of Higher Education, A1.
Byrne, B.M. (2001). Structural Equation Modeling with AMOS. Mahwah, New Jersey: Lawrence Erlbaum Associates.
Cabrera, A. F., Burkum, K. R., & La Nasa, S. M. (2004). Pathways to a fouryear degree: Determinants of transfer and degree completion. In A. Seidman, College student retention: A formula for student success. Westport: ACE/Praeger series on Higher Education.
Chamberlain, G. (1980). Analysis of covariance with qualitative data. Review of Economic Studies, 47(1), 225238.
Dey, E. L., and Astin, A.W. (1989). Predicting college student retention: Comparative national data from the 1982 freshman class. Los Angeles: Higher Education Research Institute, UCLA.
Duncan, O. (1975). Introduction to structural equation models. New York: Academic press.
Elkins, S. A., Braxton, J. M., & James, G.W. (2000). Tinto’s separation stage and its influence on firstsemester college student persistence. Research in Higher Education, 41(2), 251 268.
Goenner, C., and Snaith, S. (2004). Accounting for model uncertainty in the prediction of university graduation rates. Research in Higher Education, 45(1), 2541.
Greene, W. H. (2003). Econometrics. (5 th ed.). New York:
Prentice Hall.
Habley, W. R., & McClanahan, R. (2004). What works in student retention? Twoyear public colleges. Iowa City, IA: ACT.
Hamrick, Florence A., John H. Schuh and Mack C. Shelley, II. (2004). Predicting higher education graduation rates from institutional characteristics and resource allocation. Education Policy Analysis. Volume 12, Number 19, May 4.
23
Hanushek, E. (1986). The economics of schooling: Production and efficiency in public schools. Journal of Economic Literature, 24(3), 11421177.
Hanushek, E. (2003). The failure of inputbased schooling policies. The Economic Journal, 113(485), F64F98.
Joreskog, K. (1993). Testing structural equation models. In Bollen, K. and Long J., (Eds.). Testing structural equation models. Newbury Park, CA: Sage.
Kane, T. J., Orszag, P. R., & Gunter, D. L. (2003). State fiscal constraints and higher education spending: The role of Medicaid and the business cycle. Washington, DC: Brookings Institution.
Kane, T. J., and Staiger, D. (2001, March). Improving school accountability measures. Working Paper No. 8156. Cambridge, MA: National Bureau of Economic Research.
Kenny, D. (1979). Correlation and causality. New York: John Wiley and Sons.
Kuh, G. D., Kinzie, J., Schuh, J.H., Whitt, E. J., & Associates (2005). Student success in college: Creating conditions that matter. San Francisco: Jossey Bass.
LewisBeck M. (1974). Determining the importance of an independent variable: A path analysis solution. Social Science Research, 3, 95107.
McLaughlin, G. W., Brozovsky, P. V., & McLaughlin, J. S. (1998). Changing perspectives on student retention: A role for institutional research. Research in Higher Education, 39(1), 1 17.
Mortenson, T. (1997, April). Actual versus predicted institutional graduation rates for 1,100 colleges and universities. Postsecondary Education Opportunity, 58.
Munro, B. (1981). Dropouts from higher education: Path analysis of a national sample. American Educational Research Journal, 20, 133141.
Muraskin, L., & Lee, J. (2004). Raising the graduation rates of low income college students. Washington, DC: The Pell Institute for the Study of Opportunity in Higher Education.
24
Murtaugh, P. A., Burns, L. D., & Schuster, J. (1999). Predicting the retention of university students. Research in Higher Education, 40, 355371.
Nora A. (1987). Determinants of retention among Chicano college students: A structural model. Research in Higher Education, 26, 3159.
Nora A. and Castaneda, M. (1993). College persistence: Structural equations modeling test of an integrated model of student retention. Journal of High Education, 64, 123139.
Nora A. and Rendon, L. (1990).Determinants of predisposition to transfer among community college students: A structural model. Research in Higher Education, 31, 23555.
Oseguera, L. (20052006). Four and sixyear baccalaureate degree completion by institutional characteristics and racial/ethnic groups. Journal of College Student Retention, 7(12), 1959.
Pascarella E. and Chapman, D. (1983). A multiinstitutional path analytical validation of Tinto’s model of college withdrawal. American Educational Research Journal, 20, 87102.
Pascarella, E., Duby, P., and Iverson, B. (1983). A test and reconceptualization of a theoretical model of college withdrawal in a commuter institution setting. Sociology of Education, 56, 88100.
Pascarella, E., and Terenzini, P. (1979). Interaction Effects in Spady’s and Tinto’s Conceptual Models of College Dropouts. Sociology of Education, 52, 197210.
Pascarella, E., and Terenzini, P. (1980). Predicting freshman persistence and voluntary dropout decisions from a theoretical model. Journal of Higher Education, 51, 6075.
Pascarella, E., and Terenzini, P. (1983). Predicting voluntary freshman year persistence/withdrawal behaviors in a residential university: A path analytic validation of Tinto’s model. Journal of Educational Psychology, 75, 215226.
Pascarella, E., and Terenzini, P. (1991). How college affects students: Findings and insights from twenty years of research. San Francisco: JosseyBass.
25
Pascarella, E. T., and Terenzini, P. T. (1998). Studying college students in the 21st century: Meeting new challenges. The Review of Higher Education, 21, 151165.
Pascarella E. T., Smart, J., and Ethington C. (1986). Longterm persistence of twoyear college students. Research in Higher Education, 24, 4771.
Porter, S. R. (2000). The robustness of the “graduation rate performance” indicator used in the U.S. News and World Report college ranking. International Journal of Educational Advancement, 1(2), 1030.
Ryan, J. F. (2004). The relationship between institutional expenditures and degree attainment. Research in Higher Education, 45(2), 97 114.
Stage, F. (1988). University Attrition: LISREL with logistic regression for the persistence criterion. Research in Higher Education, 29, 343357.
Stage, F. (1989). Reciprocal effects between the academic and social integration of college students. Research in Higher education, 30, 517530.
Tinto V. (1975). Dropout from higher education: A theoretical synthesis of recent research. Review of Educational Research, 45, 89125.
Tinto V. (1982). Limits of theory and practice in student attrition. Journal of Higher Education, 53, 687700.
Tinto, V. (1987). Leaving college. Chicago, IL: University of Chicago Press.
Tinto, V. (1998). Colleges as communities: Taking research on student persistence seriously. Review of Higher Education, 21, 167177.
Tinto, V. (1993). Leaving college: Rethinking the causes and cures of student attrition. Chicago: University of Chicago Press.
Titus, M. (2003). An examination of the influence of institutional context on persistence at fouryear colleges and universities: A multilevel approach. Unpublished doctoral dissertation. College
26
Park: University of Maryland.
Titus, M. (2004). An examination of the influence of institutional context on student persistence at 4year colleges and universities: A multilevel approach. Research in Higher Education, 45(7), 673700.
Toutkoushian, R., and Smart, J. (2001). Do institutional characteristics affect student gains from college? Review of Higher Education, 25(1), 3961.
Walker, Susan. (2005). An Overview of the Pell Institute Report on Improving Graduation Rates of LowIncome College Students. Office of Strategic Research and Analysis. Board of Regents of the University System of Georgia.
Wright, S. (1921). Correlation and causation. Journal of Agricultural Research, 20, 557585.
Wright, S. (1934). The method of path coefficients. Annals of Mathematical Statistics, 5, 161215.


