David C. Wyld et al. (Eds): SPPR, NECO, GridCom, ICCSEA, SCAI, UBIC, SEMIT, MLDS - 2020 pp. 123-135, 2020. CS & IT - CSCP 2020 DOI: 10.5121/csit.2020.101911 ASSESSING THE MOBILITY OF ELDERLY PEOPLE IN DOMESTIC SMART HOME ENVIRONMENTS Björn Friedrich, Enno-Edzard Steen, Sebastian Fudickar and Andreas Hein Department of Health Services Research, Carl von Ossietzky University, Oldenburg, Germany ABSTRACT A continuous monitoring of the physical strength and mobility of elderly people is important for maintaining their health and treating diseases at an early stage. However, frequent screenings by physicians are exceeding the logistic capacities. An alternate approach is the automatic and unobtrusive collection of functional measures by ambient sensors. In the current publication, we show the correlation among data of ambient motion sensors and the well- established mobility assessment Short-Physical-Performance-Battery and Tinetti. We use the average number of motion sensor events for correlation with the assessment scores. The evaluation on a real-world dataset shows a moderate to strong correlation with the scores of standardised geriatrics physical assessments. KEYWORDS ubiquitous computing, biomedical informatics, health, correlation, piecewise linear approximation. 1. INTRODUCTION Being in good health and good physical condition is essential for the quality of life and well- being of humans. Especially, the elderly people who are more prone to diseases and functional decline. Frequently consulting physicians is important for this age group, because early diagnosis is the key for a better treatment and recovery. On the one hand, the logistic capacities of physicians are limited and are not sufficient for sophisticated continuous long-term monitoring. On the other hand, long-term monitoring enhances physician's decision-making process. To address this problem unobtrusive smart home sensors can be facilitated for continuous long-term monitoring of elderly people in their domestic environments. This kind of sensors are respecting the privacy of the inhabitant and are well-accepted among the target group. They get acquainted to the sensors in a few days and after that, they do not notice the sensors anymore [1]. The mobility of elderly people is one key indicator for their physical and mental condition. Moreover, falling is a critical incident for elderly people and even though they recover physically, they may not recover mentally [2-5]. The mobility, balance and muscle-strength of elderly people is usually assessed by physicians or physiotherapists by standardised geriatrics assessments like the Short- Physical-Performance-Battery (SPPB), Timed Up&Go and Tinetti and those assessments must be performed under the supervision of a professional. Due to capacity issues those assessments cannot be performed frequently. Moreover, the assessment measures the form of the day the person is doing the test and people tend to give their best effort in testing situations, in other
Transcript
David C. Wyld et al. (Eds): SPPR, NECO, GridCom, ICCSEA, SCAI, UBIC, SEMIT, MLDS - 2020
pp. 123-135, 2020. CS & IT - CSCP 2020 DOI: 10.5121/csit.2020.101911
ASSESSING THE MOBILITY OF
ELDERLY PEOPLE IN DOMESTIC SMART HOME ENVIRONMENTS
Björn Friedrich, Enno-Edzard Steen,
Sebastian Fudickar and Andreas Hein
Department of Health Services Research,
Carl von Ossietzky University, Oldenburg, Germany
ABSTRACT A continuous monitoring of the physical strength and mobility of elderly people is important
for maintaining their health and treating diseases at an early stage. However, frequent
screenings by physicians are exceeding the logistic capacities. An alternate approach is the automatic and unobtrusive collection of functional measures by ambient sensors. In the current
publication, we show the correlation among data of ambient motion sensors and the well-
established mobility assessment Short-Physical-Performance-Battery and Tinetti. We use the
average number of motion sensor events for correlation with the assessment scores. The
evaluation on a real-world dataset shows a moderate to strong correlation with the scores of
Being in good health and good physical condition is essential for the quality of life and well-being of humans. Especially, the elderly people who are more prone to diseases and functional
decline. Frequently consulting physicians is important for this age group, because early diagnosis
is the key for a better treatment and recovery. On the one hand, the logistic capacities of
physicians are limited and are not sufficient for sophisticated continuous long-term monitoring. On the other hand, long-term monitoring enhances physician's decision-making process. To
address this problem unobtrusive smart home sensors can be facilitated for continuous long-term
monitoring of elderly people in their domestic environments. This kind of sensors are respecting the privacy of the inhabitant and are well-accepted among the target group. They get acquainted
to the sensors in a few days and after that, they do not notice the sensors anymore [1]. The
mobility of elderly people is one key indicator for their physical and mental condition. Moreover, falling is a critical incident for elderly people and even though they recover physically, they may
not recover mentally [2-5]. The mobility, balance and muscle-strength of elderly people is usually
assessed by physicians or physiotherapists by standardised geriatrics assessments like the Short-
Physical-Performance-Battery (SPPB), Timed Up&Go and Tinetti and those assessments must be performed under the supervision of a professional. Due to capacity issues those assessments
cannot be performed frequently. Moreover, the assessment measures the form of the day the
person is doing the test and people tend to give their best effort in testing situations, in other
124 Computer Science & Information Technology (CS & IT)
words there is a difference between performance and capacity. The studies found that the performance is more clinically relevant than the capacity [6].
Our approach uses motion sensor events as indicator for the physical conditions of elderly people.
We used data from motion sensors installed in domestic environments of elderly people and correlate it with scores of the standardised geriatrics assessments SPPB and Tinetti. We consider
the two parts of the Tinetti separately as Tinetti13 and Tinetti28. Tinetti13 has only gait items and
Tinetti28 balance items. This paper is structured as follows
In Section 2 similar approaches are mentioned and the standardised geriatrics assessments are
explained. Section 3 Materials and Methods describes the study for collecting the data, the preparation of the dataset and the used interpolation and correlation methods. In the following
result section, the results are explained. In the last section the results are discussed, and an
outlook is given.
2. STATE OF THE ART
Approved and validated functional tests to assess the physical strength, the mobility and the risk
of falling in elderly people are SPPB [7] and Tinetti [8] test. Both tests must be supervised by a professional.
The SPPB assessment has been developed for assessing the mobility of people aged 65 and older.
The SPPB assesses the three domains balance, gait speed and strength of the lower limbs. Each domain is assessed by one item and the total performance is scored from 0 to 12 points, where a
higher score indicates better mobility and vice versa. The item for assessing the balance is
comprised of three sub-items related to balance. The first one is parallel stand, the second is semi-parallel stand and the third one is totally parallel stand. The strength of the lower limbs is
assessed by the 5-times Chair Rise item. At the beginning the patient is sitting on a chair and then
the patient is asked to stand up and sit down for 5 times in a row without using his or her arms. The gait is assessed by the 4m walk test and the patient is asked to walk over a distance of 4
metres. The time for all assessment items is measured separately and depending on the time the
item is scored. The patient can achieve 1 to 4 points for each of the three domains and a total of
12 points.
The Tinetti [9] test assesses the two domains balance and gait to estimate the risk of falling. The
modified version has eight items for balance and another eight for gait. The maximum score for gait performance are 13 points and the maximum score for balance are 15 points. The higher the
score, the better the mobility. The items of the Tinetti are on different scales. The balance items
are scored from 0 to 4 points, where three items have a score from 0 to 1, four items a score from
0 to 3 and one item from 0 to 4. The gait assessment items are scored from 0 to 2 points and five of the eight items are scored from 0 to 2 and the other three from 0 to 1. The supervisor will score
the items in best practice. The scoring depends on the impression of the supervisor because there
is a verbal description for giving the points instead of a quantified scale.
The approaches to assess the mobility of a person through sensors are, for example, the
determination of gait phases and gait parameters, such as step time or length, stride time or length, cadence, gait speed, or maximum toe clearance. These approaches use either wearable or
ambient sensors. The wearable sensors are usually inertial sensors, which are positioned at
different body locations and detect the movements of one or more parts of the body during
walking, are often used as wearable sensors [9]. Typically, inertial sensors are accelerometers, which are used alone or in combination with a triaxial gyroscope, a triaxial magnetometer, or a
barometer. Combinations of these sensors are called IMU (Inertial Measurement Unit). An
Computer Science & Information Technology (CS & IT) 125
inertial sensor or IMU is used either stand-alone [10-13] or integrated into a smart device such as smartphone [14], smartwatch [15] or fitness tracker [16].
Other approaches use pressure or force sensors, either as wearables, e.g. integrated in socks [17]
or insoles [18] or as ambient sensors, e.g. integrated into sensor carpets [19] or treadmills [20]. Here, the pressure distributions or ground reaction forces are analysed. Besides there is a similar
approach that uses capacitive proximity sensors, which can be placed invisibly under different
floor coverings and detect the movement of people above [21].
The approaches using video-based systems often determine the positions of joints to detect the
movement of the corresponding body parts. These systems can be divided into markerless and marker-based systems. Several markerless approaches use the Microsoft Kinect [22, 23]. Marker-
based approaches do not only employ markers, which are placed at anatomically important body
positions, e.g. joints, as well as the use of either passive [24] or active markers [25].
Home automation sensors have the advantages of being inexpensive, taking privacy concerns into
account, and may already are installed in the domestic environment of a person due to other
benefits such as lighting, heating control or security aspects. Typical sensors used to assess the
mobility are light barriers [26, 27] and motion sensors. Motion sensors can, for example, are mounted on the ceiling of a frequently used passageway and determine the walking speed of a
person [28]. Further approaches analyse the transition times between the coverage areas of
different sensors [29-31]
Other sensor-based approaches detect the movements of lower limbs by means of radar [32, 33],
laser scanner [34, 35] or ultrasonic sensors [36, 37].
Considering the summary of the state of the art, ambient sensors seem to be the best choice for
unobtrusive measurements in domestic environments. Ambient sensors are respecting the privacy
and measure the performance and not the capacity, because the person is not engaged in a test situation during the measurements.
3. MATERIALS AND METHODS
The used material was a dataset collected during a field study called OTAGO. The main goal of the study was to investigate whether the OTAGO exercise program [44] has an effect in
rehabilitation. The used methods are linear approximations for the sensor data and the assessment
scores, and a correlation coefficient for the statistical correlation analysis.
3.1. Data Acquisition The data has been collected during the OTAGO study which ranged from July 2014 to December
2015. The planned duration of the study was 40 weeks for each participant. Twenty participants
(17 female, 3 male) of an average age of 84.75 years (±5.19 years) participated in the study. They were in pre-frail or frail condition. Due to drop out the average participation time was 36.5
weeks. Due to sickness, visitors, public holidays etc. the average days between two assessments
were 31.3 days (±5.3 days). Two participants died during the study and two participants performed the assessments ten times. For the remaining 16 participants eleven assessments have
been conducted. At the beginning and every four weeks the standardised geriatrics assessments,
Timed Up&Go, SPPB, Barthel Index and Instrumental Activities of Daily Living among others
were performed [38-41]. In addition, ambient passive infrared wireless motion sensors have been installed in the living space of the participants. The motion sensors had a cool down time of 8
seconds when motion cannot be detected. All sensors sent their data over the air to a base station.
126 Computer Science & Information Technology (CS & IT)
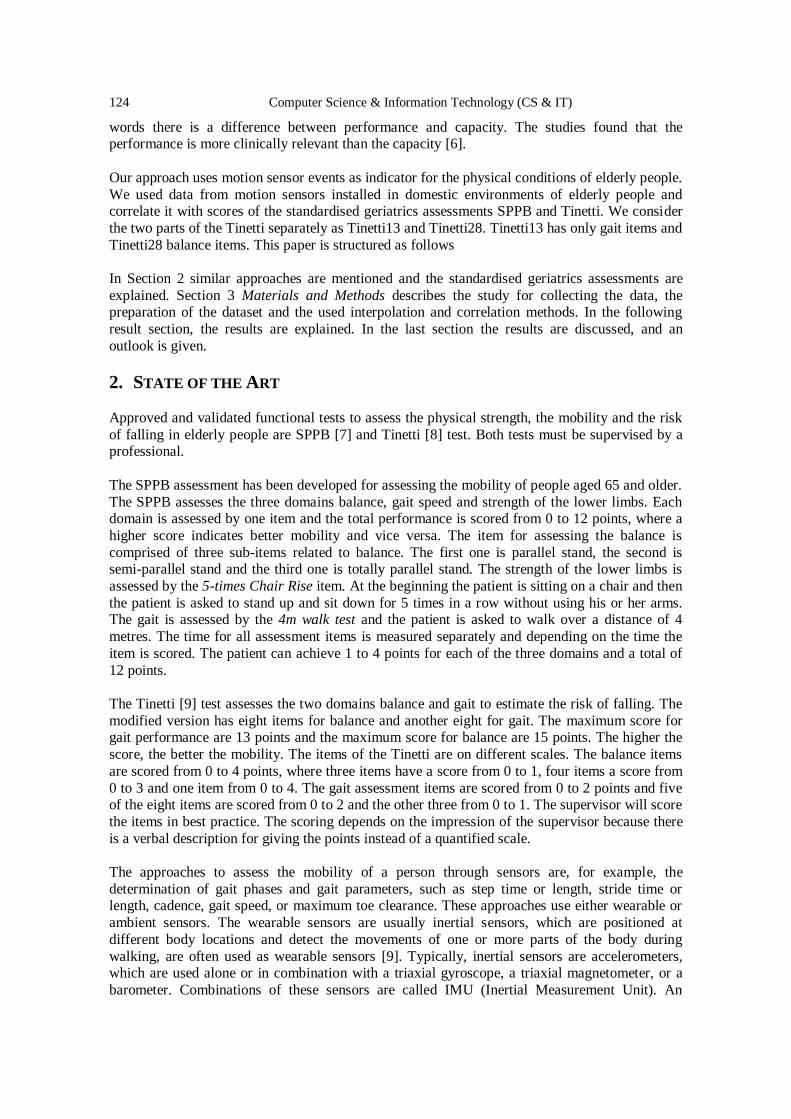
The sensor system was mainly comprised of home automation sensors and power sensors. A concussion sensor has been placed in the bed, since the used motion sensor was not sensitive
enough to measure the small movements while sleeping. A switch with four keys has been
installed next to the front door of the homes to indicate whether the person is alone in the flat or
not. The participants have been instructed to press a key to make the system aware when another person enters the flat. When the person leaves the flat again or the participant comes home,
another key had to be pressed to make the system aware that only one person is inside the flat. In
Fig. 1 a flat of one of the participants is shown.
Figure 1. Example of a flat of one of the participants. The positions of the sensors are marked by symbols.
3.2. Preprocessing
The data described in Section 3.1. is preprocessed in the following manner. The sensor events of
each day are added up for each sensor. Then the average number of events per day is computed by adding up the number of events and dividing it by the number of motion sensor in the flat of
the participant. The result is one feature per day. The mathematical formulation is
(I)
where n is the number of sensors installed in the flat, j the 8 seconds time window of the day and
1 the indicator function defined on the set A of all sensor events. In other words, the indicator
function is 1 if there is a sensor event e from sensor i in time window j and 0 if there is no event. If there is no sensor event recorded on a certain day, the day is excluded from the dataset. The
average days between two assessments after removing are 31.6 days and the assessment scores
were used as they were recorded. Unless a sub-item could not be performed, but the remaining items can, the sub-item is scored with 0 even though the items score cannot be 0 according to the
manual.
Computer Science & Information Technology (CS & IT) 127
Several participants have been excluded from the dataset. Three participants were excluded, because they were hospitalised during the study. Their data was incomplete and after being
discharged from the hospital the participants used walking frames and got assistance while
performing the assessments. In three flats the motion sensors in key areas have been installed a
few months after the study started. Hence, the data from the most frequently used rooms like the kitchen, living room and hallway is not available. These three participants have been excluded as
well. Another two participants have been excluded due to incomplete data, there was an error that
caused fragmented data. Overall, we excluded eight participants from the analysis. Such exclusion resulted in a final cohort of 12, with 10 female and 2 male participants.
3.3. Interpolation and Approximation
Two different interpolation methods were used for the values. The assessment scores are
interpolated using a spline interpolation and the average activities per day are approximated with a linear regression. The piecewise polynomial interpolation or spline interpolation is an ordinary
linear function defined as follows
(II)
where x is the date of the assessment, m the slope and b the interception with the y-axis. In
addition, for each two consecutive scores ai and ai+1 the following conditions must hold
(III)
where i denotes the index of the assessment score. Spline interpolation is used, because the
assessments were taken in an average interval of 31.3 days and assuming a linear change is feasible. The frequency of the average motion in one day is much higher. Between two
assessments an average of 31.6 values are available. This value is slightly larger than the average
days between two assessments, because we excluded some participants from our dataset. Linear regression is more robust in the face of outliers than spline interpolation. So, linear regression is
used to approximate a function for the average motion values. The linear regression has the same
base function as the spline interpolation, but the way of computing the values m and b is different
(IV)
where d is an arbitrary metric function, i the number of values and vi the i-th value of the value
set. Formula IV is computed for different m’s and the m which results in the smallest sum is
chosen as best parameter for the regression. For this research, the Euclidean distance is used as metric. The linear regression formula is not taking b into account. However, after computing m
there is only one unknown left in the equation. Using linear algebra, the unique solution can be
computed.
The interpolated and fitted values are correlated with each other using Spearman's ρ.
128 Computer Science & Information Technology (CS & IT)
3.4. Correlation Coefficient and Thresholds
For correlation, the Spearman Rank Correlation or Spearman's ρ is used [42]. The correlation
assesses whether there is a monotonic relationship between two variables. In contrast to the Pearson Correlation there is only one assumption that must hold. It is sufficient when the
variables are in an ordinal scale. To each value its rank is assigned. The values are sorted in an
ascending order and the rank is the index of the value. Since, two values can have the same rank, the rank is not well-defined. To overcome this, the equal values are slightly altered to become
different and the new rank is the mean of the ranks of the altered values. This is called Ties. Once
all ranks are assigned the correlation is computed with the formula
(V)
where R(xi) denotes the rank of value xi, µ the mean of all ranks of the corresponding variable and n is the number of values.
For judging the strength of the correlation, the definition of Cohen [43] is used. Correlations
between 0.1 and 0.3 are considered as small, between 0.3 and 0.5 are considered as moderate and larger than 0.5 are considered as large. This holds for the negative values as well. A correlation is
statistically significant when p<0.001 holds.
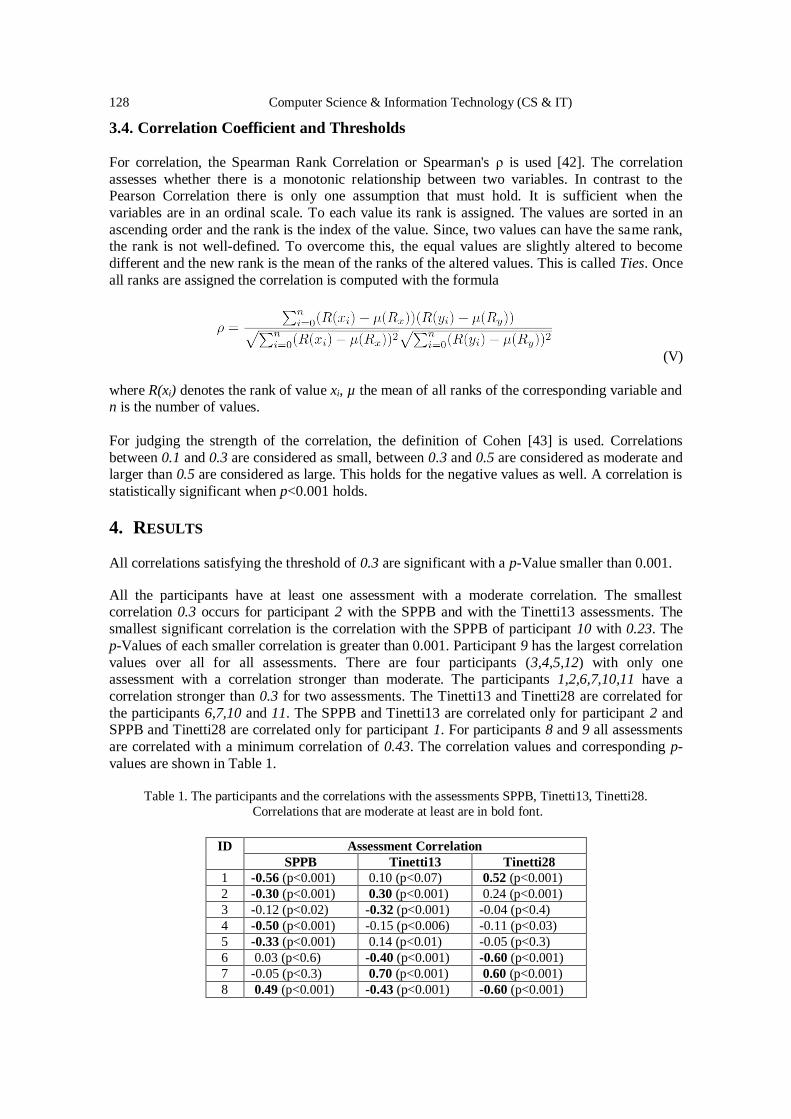
4. RESULTS
All correlations satisfying the threshold of 0.3 are significant with a p-Value smaller than 0.001.
All the participants have at least one assessment with a moderate correlation. The smallest correlation 0.3 occurs for participant 2 with the SPPB and with the Tinetti13 assessments. The
smallest significant correlation is the correlation with the SPPB of participant 10 with 0.23. The
p-Values of each smaller correlation is greater than 0.001. Participant 9 has the largest correlation
values over all for all assessments. There are four participants (3,4,5,12) with only one assessment with a correlation stronger than moderate. The participants 1,2,6,7,10,11 have a
correlation stronger than 0.3 for two assessments. The Tinetti13 and Tinetti28 are correlated for
the participants 6,7,10 and 11. The SPPB and Tinetti13 are correlated only for participant 2 and SPPB and Tinetti28 are correlated only for participant 1. For participants 8 and 9 all assessments
are correlated with a minimum correlation of 0.43. The correlation values and corresponding p-
values are shown in Table 1.
Table 1. The participants and the correlations with the assessments SPPB, Tinetti13, Tinetti28.
Correlations that are moderate at least are in bold font.
ID Assessment Correlation
SPPB Tinetti13 Tinetti28
1 -0.56 (p<0.001) 0.10 (p<0.07) 0.52 (p<0.001)
2 -0.30 (p<0.001) 0.30 (p<0.001) 0.24 (p<0.001)
3 -0.12 (p<0.02) -0.32 (p<0.001) -0.04 (p<0.4)
4 -0.50 (p<0.001) -0.15 (p<0.006) -0.11 (p<0.03)
5 -0.33 (p<0.001) 0.14 (p<0.01) -0.05 (p<0.3)
6 0.03 (p<0.6) -0.40 (p<0.001) -0.60 (p<0.001)
7 -0.05 (p<0.3) 0.70 (p<0.001) 0.60 (p<0.001)
8 0.49 (p<0.001) -0.43 (p<0.001) -0.60 (p<0.001)
Computer Science & Information Technology (CS & IT) 129
9 0.88 (p<0.001) 0.82 (p<0.001) 0.88 (p<0.001)
10 0.23 (p<0.001) 0.60 (p<0.001) -0.39 (p<0.001)
11 -0.06 (p<0.2) -0.61 (p<0.001) -0.38 (p<0.001)
12 -0.34 (p<0.001) 0.02 (p<0.7) -0.28 (p<0.001)
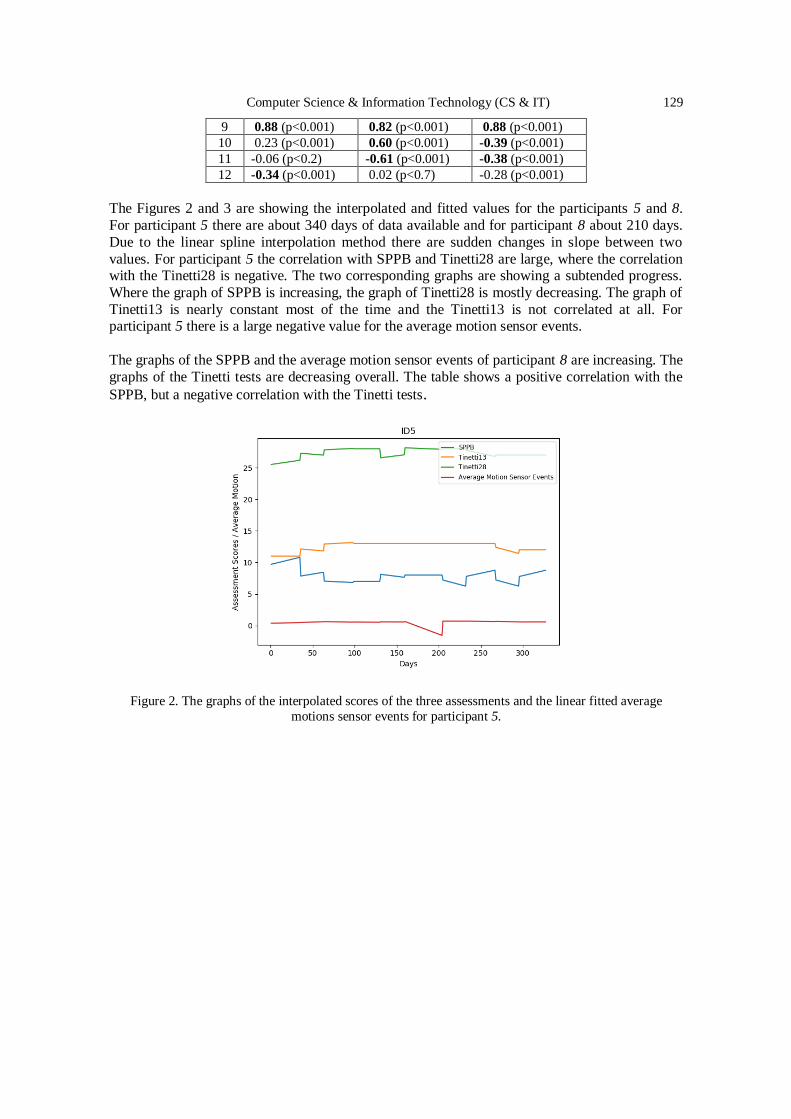
The Figures 2 and 3 are showing the interpolated and fitted values for the participants 5 and 8.
For participant 5 there are about 340 days of data available and for participant 8 about 210 days.
Due to the linear spline interpolation method there are sudden changes in slope between two
values. For participant 5 the correlation with SPPB and Tinetti28 are large, where the correlation with the Tinetti28 is negative. The two corresponding graphs are showing a subtended progress.
Where the graph of SPPB is increasing, the graph of Tinetti28 is mostly decreasing. The graph of
Tinetti13 is nearly constant most of the time and the Tinetti13 is not correlated at all. For participant 5 there is a large negative value for the average motion sensor events.
The graphs of the SPPB and the average motion sensor events of participant 8 are increasing. The
graphs of the Tinetti tests are decreasing overall. The table shows a positive correlation with the
SPPB, but a negative correlation with the Tinetti tests.
Figure 2. The graphs of the interpolated scores of the three assessments and the linear fitted average
motions sensor events for participant 5.
130 Computer Science & Information Technology (CS & IT)
Figure 3. The graphs of the interpolated scores of the three assessments and the linear fitted average
motions sensor events for participant 8.
Correlating the scores achieved in the three domains of the SPPB leads to the results shown in Table 2. A moderate to large correlation is found for the participants 2,3,4,6,8 and 12. Participant
9 has a large positive correlation for all three domains. The domain balance correlates with the
average motion sensor events for the participants 6,8,9, the domain gait and 4 metres correlate for
the participants 2,4,9, and the domain assessing the strength of the lower limbs correlates for participants 3,9, and 12. There is no moderate correlation found for participants 1,5,7,10, and 11.
There is a correlation of 0.0 for participant 1 with 5CRT, participant 7 for 5CRT as well and for
participant 10 for balance and 4 metres.
Table 2. The correlation of the three domains assessed by the SPPB. 5 times chair rise and 4m gait test.
Correlations that are moderate at least are in bold font.
ID SPPB Item Correlation
Balance 4m 5CRT
1 -0.22 (p<0.001) -0.21 (p<0.001) 0.00 (p<0.0)
2 0.01 (p<0.7) -0.63 (p<0.001) -0.21 (p<0.001)
3 -0.10 (p<0.05) 0.26 (p<0.001) 0.36 (p<0.001)
4 0.20 (p<0.001) -0.62 (p<0.001) -0.23 (p<0.001)
5 -0.25 (p<0.001) -0.20 (p<0.001) -0.22 (p<0.001)
6 -0.58 (p<0.001) 0.17 (p<0.007) -0.13 (p<0.04)
7 -0.01 (p<0.83) -0.15 (p<0.008) 0.00 (p<0.0)
8 0.52 (p<0.001) -0.21 (p<0.002) 0.14 (p<0.04)
9 0.82 (p<0.001) 0.82 (p<0.001) 0.82 (p<0.001)
10 0.00 (p<0.0) 0.00 (p<0.0) -0.06 (p<0.2)
11 0.13 (p<0.01) -0.02 (p<0.6) 0.26 (p<0.001)
12 -0.25 (p<0.001) 0.24 (p<0.001) -0.78 (p<0.001)
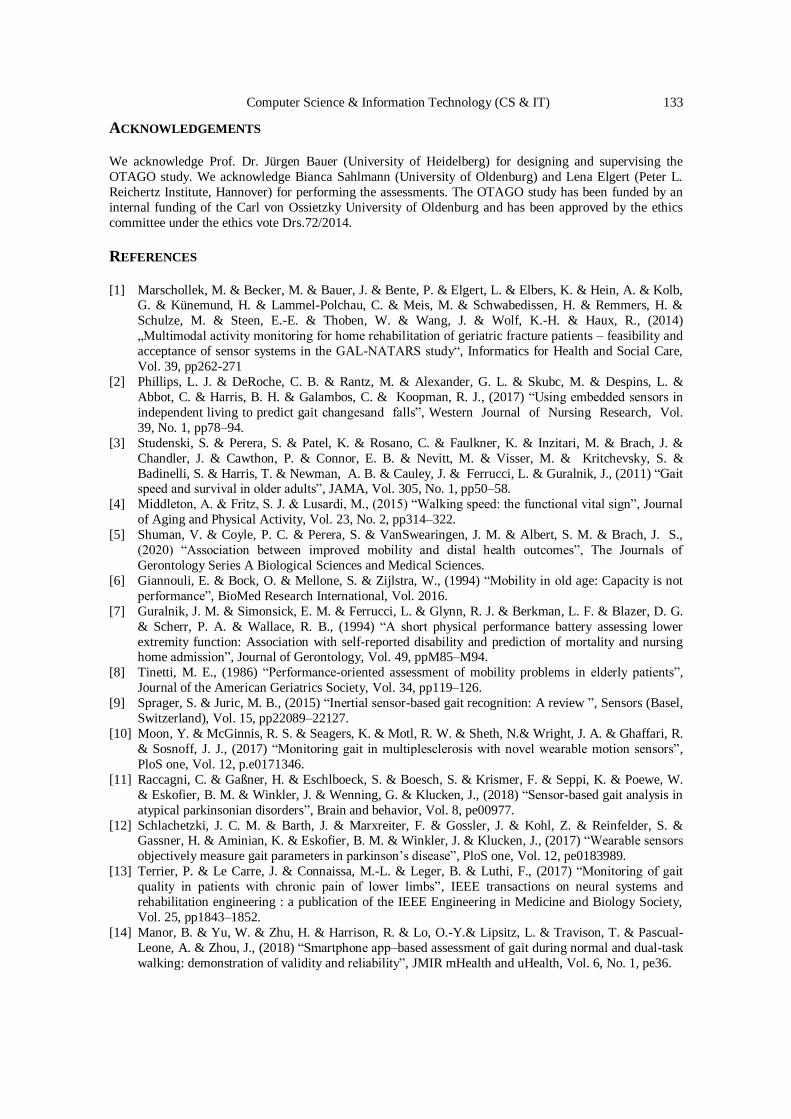
The Figures 4 and 5 are showing the graphs of each domain item and the average motion sensor
events. The scores for Balance and 5CRT of participant 5 are showing a similar progress and
after the 5-th assessment the scores have the same value. The graph of the 4m gait test is more
variable and is continuously increasing and decreasing.
Computer Science & Information Technology (CS & IT) 131
Figure 4. The graphs of the interpolated item scores and the linear fitted
average motions sensor events of participant 5.
Figure 5. The graphs of the interpolated item scores and the linear fitted
average motions sensor events of participant 8.
5. DISCUSSION
Table 1 shows some interesting findings. Even though the three assessments are assessing similar domains the correlations are different. The reason why SPPB and Tinetti13 have a different
correlation is that Tinetti13 is comprised of gait items only while the SPPB includes additional
parameters that cover balance and lower limb muscle-strength. A good example for such
variational effect is participant 12. For this participant, the correlation of SPPB is moderate and there is no correlation with Tinetti13 and a weak correlation with Tinetti28. Looking at Table 2
the balance which is assessed in Tinetti28 and the gait which is assessed in Tinetti13 and
Tinetti28 shows a weak correlation only, but the 5CRT which is assessing the lower limb strength has a large correlation.
132 Computer Science & Information Technology (CS & IT)
With participant 9 showing the highest correlation overall, the general validity of the ambient
motion sensors to detect functional decline can be confirmed. It is worthwhile, to investigate the
individual history of this case: Two month in the study, the participant got a cytotoxic therapy.
Therefore, the physical and psychological conditions of this participant became worse rapidly. Due to the frequent treatments in the hospital the quality of the data is worse compared to the
other participants. While the corresponding decline is well given in this case, others slighter
trajectories as well have been present:
For participant 2 there is moderate correlation for SPPB and Tinetti13. The explanation is that
only the 4m gait test has large correlation and the other two items have no and a weak correlation respectively. The SPPB takes all three domains into account equally and the Tinetti13 is
comprised of items for assessing gait only. The Tinetti28 is slightly imbalanced towards the
balance items because the maximum balance score is higher than the maximum gait score.
Even considering Table 2 there is no explanation for some combination of correlations. For
participants 1,5,7,10, and 11 there is no significant correlation for the SPPB items, but there are
moderate to strong correlations found for the assessments themselves. The reason might be a combination of the items of the assessments. To verify this further investigation is needed.
The unclear results could be traced back to the study as well. The sensors were installed in the
domestic environments and could not be controlled. Some sensors were relocated by the dweller so that the sensing area changed. That might led to a blind spot, where a lot of activities were
done. That would have changed the number of events and the cause is not a change in mobility,
but in sensor relocation.
6. CONCLUSION AND FUTURE WORK
The results show that the approach using motion sensor data for assessing the mobility of elderly
people is feasible for continuous long-term monitoring and provides valuable information for physicians. The correlations found with SPPB and Tinetti are moderate (≤0.3) at least and
statistically significant (p<0.001).
There are two ways to further investigate the relation between the motion sensor data and the assessment scores. The first way is to improve the interpolation, regression and analytical
methods. Artificial intelligence algorithms show promising results in ubiquitous computing and
analysing data from distributed sensor systems. So, the second way is to add more information to the data and additional data from other sensors. Power consumption sensors can add valuable
information about activities for further analysis. The current data does not take the entropy of a
sensor event into account. For example, a motion sensor which is attached near the door to the
backyard might not have as many events as a motion sensor in the living room, but the information that the participant left the flat is more important than the participant is in the living
room. Moreover, the sequence of the events could be taken into account. Those sequences can
give information about the ways of the participant in the flat. The ratio between unnecessary ways in the flat and necessary ones like going to the toilet, may proof to be a good feature to
improve the correlation.
In addition, there are unclear correlation combinations, maybe due to special combinations of
assessment items might be the cause. To find an explanation the correlations of the items must be
explored further by correlating every single Tinetti item with the average motion sensor events.
Computer Science & Information Technology (CS & IT) 133
ACKNOWLEDGEMENTS We acknowledge Prof. Dr. Jürgen Bauer (University of Heidelberg) for designing and supervising the
OTAGO study. We acknowledge Bianca Sahlmann (University of Oldenburg) and Lena Elgert (Peter L.
Reichertz Institute, Hannover) for performing the assessments. The OTAGO study has been funded by an
internal funding of the Carl von Ossietzky University of Oldenburg and has been approved by the ethics
committee under the ethics vote Drs.72/2014.
REFERENCES [1] Marschollek, M. & Becker, M. & Bauer, J. & Bente, P. & Elgert, L. & Elbers, K. & Hein, A. & Kolb,
G. & Künemund, H. & Lammel-Polchau, C. & Meis, M. & Schwabedissen, H. & Remmers, H. &
Schulze, M. & Steen, E.-E. & Thoben, W. & Wang, J. & Wolf, K.-H. & Haux, R., (2014)
„Multimodal activity monitoring for home rehabilitation of geriatric fracture patients – feasibility and
acceptance of sensor systems in the GAL-NATARS study“, Informatics for Health and Social Care,
Vol. 39, pp262-271
[2] Phillips, L. J. & DeRoche, C. B. & Rantz, M. & Alexander, G. L. & Skubc, M. & Despins, L. &
Abbot, C. & Harris, B. H. & Galambos, C. & Koopman, R. J., (2017) “Using embedded sensors in
independent living to predict gait changesand falls”, Western Journal of Nursing Research, Vol.
39, No. 1, pp78–94.
[3] Studenski, S. & Perera, S. & Patel, K. & Rosano, C. & Faulkner, K. & Inzitari, M. & Brach, J. &
Chandler, J. & Cawthon, P. & Connor, E. B. & Nevitt, M. & Visser, M. & Kritchevsky, S. &
Badinelli, S. & Harris, T. & Newman, A. B. & Cauley, J. & Ferrucci, L. & Guralnik, J., (2011) “Gait speed and survival in older adults”, JAMA, Vol. 305, No. 1, pp50–58.
[4] Middleton, A. & Fritz, S. J. & Lusardi, M., (2015) “Walking speed: the functional vital sign”, Journal
of Aging and Physical Activity, Vol. 23, No. 2, pp314–322.
[5] Shuman, V. & Coyle, P. C. & Perera, S. & VanSwearingen, J. M. & Albert, S. M. & Brach, J. S.,
(2020) “Association between improved mobility and distal health outcomes”, The Journals of
Gerontology Series A Biological Sciences and Medical Sciences.
[6] Giannouli, E. & Bock, O. & Mellone, S. & Zijlstra, W., (1994) “Mobility in old age: Capacity is not
performance”, BioMed Research International, Vol. 2016.
[7] Guralnik, J. M. & Simonsick, E. M. & Ferrucci, L. & Glynn, R. J. & Berkman, L. F. & Blazer, D. G.
& Scherr, P. A. & Wallace, R. B., (1994) “A short physical performance battery assessing lower
extremity function: Association with self-reported disability and prediction of mortality and nursing home admission”, Journal of Gerontology, Vol. 49, ppM85–M94.
[8] Tinetti, M. E., (1986) “Performance-oriented assessment of mobility problems in elderly patients”,
Journal of the American Geriatrics Society, Vol. 34, pp119–126.
[9] Sprager, S. & Juric, M. B., (2015) “Inertial sensor-based gait recognition: A review ”, Sensors (Basel,
Switzerland), Vol. 15, pp22089–22127.
[10] Moon, Y. & McGinnis, R. S. & Seagers, K. & Motl, R. W. & Sheth, N.& Wright, J. A. & Ghaffari, R.
& Sosnoff, J. J., (2017) “Monitoring gait in multiplesclerosis with novel wearable motion sensors”,
PloS one, Vol. 12, p.e0171346.
[11] Raccagni, C. & Gaßner, H. & Eschlboeck, S. & Boesch, S. & Krismer, F. & Seppi, K. & Poewe, W.
& Eskofier, B. M. & Winkler, J. & Wenning, G. & Klucken, J., (2018) “Sensor-based gait analysis in
atypical parkinsonian disorders”, Brain and behavior, Vol. 8, pe00977.
[12] Schlachetzki, J. C. M. & Barth, J. & Marxreiter, F. & Gossler, J. & Kohl, Z. & Reinfelder, S. & Gassner, H. & Aminian, K. & Eskofier, B. M. & Winkler, J. & Klucken, J., (2017) “Wearable sensors
[13] Terrier, P. & Le Carre, J. & Connaissa, M.-L. & Leger, B. & Luthi, F., (2017) “Monitoring of gait
quality in patients with chronic pain of lower limbs”, IEEE transactions on neural systems and
rehabilitation engineering : a publication of the IEEE Engineering in Medicine and Biology Society,
Vol. 25, pp1843–1852.
[14] Manor, B. & Yu, W. & Zhu, H. & Harrison, R. & Lo, O.-Y.& Lipsitz, L. & Travison, T. & Pascual-
Leone, A. & Zhou, J., (2018) “Smartphone app–based assessment of gait during normal and dual-task
walking: demonstration of validity and reliability”, JMIR mHealth and uHealth, Vol. 6, No. 1, pe36.
134 Computer Science & Information Technology (CS & IT)
[15] Erdem, N. S. & Ersoy, C. & Tunca, C., (2019) “Gait analysis using smart-watches”, Proc. Indoor and
Mobile Radio Communications (PIMRC Workshops) IEEE 30th Int. Symp. Personal, pp1–6.
[16] Floegel, T. A. & Florez-Pregonero, A. & Hekler, E. B. & Buman, M. P., (2017) “Validation of
consumer-based hip and wrist activity monitors in older adults with varied ambulatory abilities”, The
journals of gerontology Series A Biological sciences and medical sciences, Vol. 72, pp229–236. [17] Tirosh, O. & Begg, R. & Passmore, E. & Knopp-Steinberg, N., (2013) “Wearable textile sensor sock
for gait analysis”, Proc. Seventh Int. Conf. Sensing Technology (ICST), pp618–622.
[18] Saidani, S. & Haddad, R. & Mezghani, N. & Bouallegue, R., (2018) “A survey on smart shoe insole
systems”, International Conference on Smart Communications and Networking (SmartNets) IEEE,
pp1–6.
[19] CIR Systems (USA), (2020) “GAITRite®walkways” https://www.gaitrite.com/gait-analysis-
https://www.bertec.com/products/instrumented-treadmills, online; last accessed: 2020-02-23.
[21] Future-Shape GmbH (Germany), (2020) “Sensfloor”, https://future-shape.com/en/system, online; last
accessed: 2020-02-23.
[22] Dubois, A. & Bresciani, J.-P., (2018) “Validation of an ambient system for the measurement of gait parameters”, Journal of biomechanics, Vol. 69, pp175–180.
[23] Springer, S. & Yogev Seligmann, G., (2016) “Validity of the kinect for gait assessment: A focused
[24] Vicon Motion Systems Ltd. (UK), (2020) “Vicon nexus”, https://www.vicon.com/software/nexus,
online; last accessed: 2020-02-23.
[25] Northern Digital Inc. (Canada), (2020) “Optotrak certus”,
https://www.ndigital.com/msci/products/optotrak-certus, online; last accessed: 2020-02-23.
[26] Frenken, T. & Steen, E.-E. & Brell, M. & Nebel, W. & Hein, A., (2011) “Motion pattern generation
and recognition for mobility assessments in domestic environments”, AAL 2011 - Proceedings of the
1st International Living Usability Lab Workshop on AAL Latest Solutions, Trends and Applications,
pp3–12. [27] Hein, A. & Steen, E.-E. & Thiel, A. & Hülsken-Giesler, M. & Wist, T. & Helmer, A. & Frenken, T.
& Isken, M. & Schulze, G. C. & Remmers, H., (2014) “Working with a domestic assessment system
to estimate the need of support and care of elderly and disabled persons: results from field studies”,
Informatics for Health and Social Care, Vol. 39, No. 3-4, pp210–231.
[28] Hagler, S. & Austin, D. & Hayes, T. L. & Kaye, J. & Pavel, M., (2010) “Unobtrusive and ubiquitous
in-home monitoring: A methodology for continuous assessment of gait velocity in elders”, IEEE
transactions on biomedical engineering, Vol. 57, No. 4, pp813–820.
[29] Aicha, A. N. & Englebienne, G. & Kröse, B., (2017) “Continuous measuring of the indoor walking
speed of older adults living alone”, Journal of ambient intelligence and humanized computing, pp1–
11.
[30] Hellmers, S. & Steen, E.-E. & Dasenbrock, L. & Heinks, A. & Bauer, J. M. & Fudickar, S. & Hein,
A., (2017) “Towards a minimized unsupervised technical assessment of physical performance in domestic environments”, Proceedings of the 11th EAI International Conference on Pervasive
Computing Technologies for Healthcare, pp207–216.
[31] Rana, R. & Austin, D. & Jacobs, P. G. & Karunanithi, M. & Kaye, J., (2017) “Gait velocity
estimation using time-interleaved between consecutive passive ir sensor activations”, IEEE Sensors
Journal, Vol. 16, No. 16, pp6351–6358.
[32] Rui, L. & Chen, S. & Ho, K. C. & Rantz, M. & Skubic, M., (2017) “Estimation of human walking
speed by doppler radar for elderly care”, JAISE, Vol. 9, No. 2, pp181–191.
[33] Wang, F. & Skubic, M. & Rantz, M. & Cuddihy, P. E., (2014) “Quantitative gait measurement with
pulse-Doppler radar for passive in-home gait assessment”, IEEE Transactions on Biomedical
Engineering, Vol. 61, No. 9, pp2434–2443.
[34] Fudickar, S. & Stolle, C. & Volkening, N. & Hein, A., (2018) “Scanning laser rangefinders for the unobtrusive monitoring of gait parameters in unsupervised settings”, Sensors (Basel, Switzerland),
Vol. 18.
[35] Iwai, M. & Koyama, S. & Tanabe, S. & Osawa, S. & Takeda, K. & Motoya, I. & Sakurai, H. &
Kanada, Y. & Kawamura, N., (2019) “The validity of spatiotemporal gait analysis using dual laser
range sensors: a cross-sectional study”, Archives of physiotherapy, Vol. 9, p3.
Computer Science & Information Technology (CS & IT) 135
[36] Ferre, X. & Villalba-Mora, E. & Caballero-Mora, M.-A. & Sanchez, A. & Aguilera, W. & Garcia-
Grossocordon, N. & Nunez-Jimenez, L. & Rodriguez-Manas, L. & Liu, Q. & del Pozo-Guerrero, F.,
(2017) “Gait speed measurement for elderly patients with risk of frailty”, Mobile Information
Systems, Vol. 2017, p11.
[37] Qi, Y. & Soh, C. B. & Gunawan, E. & Low, K.-S. & Thomas, R., (2016) “Assessment of foot trajectory for human gait phase detection using wireless ultrasonic sensor network”, IEEE
transactions on neural systems and rehabilitation engineering: a publication of the IEEE Engineering
in Medicine and Biology Society, Vol. 24, pp88–97.
[38] Mahoney, F. & Barthel, D., (1965) “Functional evaluation: The Barthel index”, Maryland State
Medical Journal, Vol. 14, pp56–61.
[39] Podsiadlo D. & Richardson, S., (1991) “The Timed Up & Go: A test of basic functional mobility for
frail elderly persons”, Journal of the American Geriatrics Society, Vol. 32, pp142–148.
[40] Searle, S. D. & Mitnitski, A. & Gahbauer, E. A. & Gill, T. M. & Rockwood, K., (2008) “A standard
procedure for creating a frailty index”, BMC Geriatrics, Vol. 8.
[41] Lawton, M. P. & Brody, E. M., (1969) “Assessment of older people: Self-maintaining and
instrumental activities of daily living”, The Gerontologist, Vol. 9, pp179–186.
[42] Spearman, C., (1904) “The proof and measurement of association between two things”, The American Journal of Psychology, Vol. 15, No. 1, pp72–101.
[43] Cohen, J., (1988) “Statistical Power Analysis for the Behavioral Sciences”, Lawrence Erlbaum
Associates.
[44] Campbell, A. J. & Robertson, C., (2010) “Comprehensive Approach to Fall Prevention on a National
Level: New Zealand”, Clinics in Geriatric Medicine, Vol. 26, No. 4, pp719-731