152
Part 1: Ranger – current operations 1
| Date post: | 21-May-2018 |
| Category: |
Documents |
| Upload: | nguyencong |
| View: | 213 times |
| Download: | 0 times |

Part 1: Ranger – current operations
1

KKN 1.2.1 Ecological risks via the surface water pathway
Conceptual models of contaminant transport pathways for the operational phase of the
Ranger mineS Parker, RE Bartolo & RA van Dam
BackgroundConceptual models of potential contaminant pathways associated with uranium mining in the ARR have been developed as part of the evolving ecological risk assessment framework that was started by the Supervising Scientist in the early 1980s. In response to recommendations by the World Heritage Commission Independent Scientific Panel and ARRTC, a specific project was initiated to produce a comprehensive conceptual model of contaminant pathways associated with the operational phase of the Ranger mine.
Development of a new conceptual model of contaminant pathways associated with the operational mining phase was commenced in 2004. The primary purpose of the conceptual model was to place off-site environmental impact issues associated with the operational phase of mining at Ranger into a risk management context. Although an overall tabular and diagrammatic form of the main elements of the conceptual model was produced, sub-models for the multiple contaminant pathways identified in the conceptual model were not finalised at the time. Much of this work was completed in 2009–10 (see 2009–10 Supervising Scientist annual report), resulting in a total of 32 stressor/contaminant pathway sub-models identified and reviewed. Efforts in 2010–11 focused on finalising an assessment of the relative importance of each pathway in terms of its potential to cause adverse ecological effects to the off-site environment.
MethodsAn internal expert panel approach was used to produce a total importance score for each contaminant pathway. A standard 3 3 scoring matrix (Table 1) was developed with the magnitude of the assigned score being based on (a) the size/potential maximum generating capacity of the relevant contaminant source (high, medium or low); and (b) the potential maximum capacity (load and rate) of the relevant pathway to transport contaminants from the mine site to the surrounding environment (high, medium or low). The current level of scientific certainty (for knowledge pertaining to pathways, excluding impact) based on existing research and monitoring (high, medium or low) information and the current level of adverse ecological impact on receptors based on results from monitoring (yes, no or unknown) associated with each contaminant pathway was also determined and reported.
Table 1 scoring matrix for assessment of relative importance of contaminant pathways
Maximum size/generating capacity of source
Max
imum
ca
paci
ty o
f pa
thw
ay
Low Medium High
Low Low Low Medium
Medium Low Medium Medium
High Medium Medium High
2

Conceptual models of contaminant transport pathways for the operational phase of the Ranger mine (S Parker, RE Bartolo & RA van Dam)
ResultsSix of the 32 stressor/contaminant pathway sub-models were assessed as being of high importance during the operational phase of mining (Table 2). For five of these six pathways the available comprehensive monitoring data indicates no detectable impact on the environment outside of the mining lease. For the case of the remaining pathway (inorganic stressors- airborne emissions) it was judged that there was insufficient evidence to say that there was no measurable environmental impact.
The main mine-derived inorganic contaminants involved in the inorganic stressors- airborne emissions pathway are sulfur (as sulfur dioxide) and nitrogen (as nitrogen oxides) released from the power station stack, nitrogen oxides from the product calciner stack, ammonia released as fugitive emissions from storage tanks and pipes or the water treatment plant, and other inorganic emissions from vehicles and mining plant or equipment. Whilst point source monitoring of stacks on the mine site is conducted by the mine operator, not all of these data have been assessed in an environmental impact context. In the case of sulfur, emissions of sulfur dioxide from the power station are unlikely to be an issue since measurements that were made when the acid plant was also operating, indicated that the mine site made an insignificant contribution to the total load of S being deposited from the atmosphere in the local region.
Of the remaining sub-models, 21 were assigned medium importance and 6 low importance (details not presented here).
Three of the six pathways assessed as being of high importance relate to the transport of contaminants via the surface water to surface water pathway. This is not unexpected given that the surrounding surface water systems are the primary potential receptors of contaminants released in runoff from the mine site.
Table 2 Contaminant pathways for Ranger uranium mine assessed as being of high importance based on size/maximum capacity of sources and maximum capacity of pathway
Pathway Size/max generating capacity of
source (H,M,L)
Max capacity of
pathway (H,M,L)
Scientific certainty (H,M,L)
ImpactNo = N
Unknown = U
Importance in
operational phase
Inorganic stressors – surface water to surface water pathway
H H H N High
Inorganic stressors – airborne emissions pathway (released from stacks and pipes)
H H H U High
Radionuclides – surface water to surface water pathway
H H H N High
Radon-222 attached/unattached radon progeny pathway
H H M N – HumanU – Biota
High
Radon-222 exhalation pathway
H H H N High
Suspended sediments – surface water to surface water pathway
H H H N High
3

Conceptual models of contaminant transport pathways for the operational phase of the Ranger mine (S Parker, RE Bartolo & RA van Dam)
The relative importance of each pathway was assigned based on the unmitigated potential of the pathway to transport contaminants from the mine site into the surrounding environment. However, this does not mean that high importance pathways are resulting in, or are likely to result in, impact on receptors within the ARR environment. The actual volume (load) and concentration of contaminants transported by these pathways at any time (and therefore the level of potential risk to receptors) depends on a range of chemical, biological, physical, and radiological factors and the effectiveness of existing management controls. These latter control measures are designed to reduce risks to the environment to acceptable levels either by containing contaminants on the mine site or minimising the volume, concentration and availability of contaminants that may be transported via the various pathways. Given the importance of these controls, details about the risk mitigation measures applicable for each contaminant pathway have been included in the model narratives produced for each of these pathways.
The assessment identified some knowledge gaps which may be fed into the ARRTC Key Knowledge Needs (KKN) framework following further consideration. Key amongst these was a lack of knowledge about the fate of organic contaminants, for example, hydrocarbons and pesticides used on site; and inorganic contaminants from the mine site stacks, storage tanks and pipes. The specific issue for the organics is that these species have not been analysed, even at a screening level, in the water that exits the site. Hence no specific assessment can be made about potential for impact, despite this likely being a no or low impact issue. In the case of the inorganic contaminants, emissions from the stacks are monitored by ERA. One additional factor that could also warrant closer attention is the potential for transport of weeds off site, despite the existence of an active weed identification and control program.
Conclusions and future workWhile knowledge gaps exist for some pathways and contaminants, there is no evidence to suggest that any of these pathways are currently resulting in adverse biological impacts on the environment within the ARR. Results of ongoing chemical, radiological and biological monitoring undertaken by the Supervising Scientist continue to show that the environment of the ARR remains protected from uranium mining related impacts via the aquatic pathway (the dominant potential vector) and from airborne radionuclides in the case of human health protection.
The contaminant pathways conceptual models developed by this project, and the associated screening level risk analysis, will assist in communicating the actual level of significance of these pathways to key stakeholders.
A related but separate task will be to develop models of the contaminant pathways uniquely associated with the mine closure and rehabilitation phases of mine life. This closure pathways conceptual model will inform and assist the development of closure criteria and the specifying of the monitoring framework needed to address them.
4

KKN 1.2.2 Land irrigation
Characterisation of contamination at land application areas at Ranger (collaborative
project with ERA)R Akber1, A Bollhöfer & P Lu0
IntroductionDue to the location of Ranger uranium mine in the wet-dry tropics, where up to 2.5 m of rain can fall in a single wet season, water management at the mine is a major challenge. A series of retention ponds (RP1with relatively clean water and RP2, which receives run-off from the low grade ore and waste rock stockpiles and from the general mine area) has been established to manage the release of water from the mine site into the environment during the wet season. Water is also disposed of on-site during the dry season using land application methods. These methods rely on the fact that radionuclides and most metals have a tendency to bind to the organic rich surface horizons of soil profiles (Davis 1983, Akber & Marten 1992, Willett et al 1993, Hollingsworth et al 2005). The bound metals and radionuclides have a low leachability and will therefore be unlikely to be released from the site to the aquatic environment downstream of Ranger. However, there has been some stakeholder concern about the radiological status of the Ranger land application areas (LAAs), in particular with regards to soils in the Magela LAA and their capacity to continue to adsorb radionuclides at the current rate of application.
The Magela A LAA was the first to be established in 1985 and has received untreated RP2 water throughout its entire operational life up until 2008. Additional LAAs were developed (Table 1) as the amount of water to be disposed of rose through time as a result of the increasing footprint of the mine site. From 2006 onwards increasing volumes of pond water have been treated by MF/RO water treatment during the wet season, with the clean permeate being discharged into the Corridor Creek catchment. The introduction of active pond water treatment during the wet season has progressively reduced the volume needed to be disposed of by land application during the dry season.
Table 1 Sources of water for land application areas at ERA’s Ranger uranium mine
Land Application Area Source of applied water Total area (ha) Year commissioned
Magela A (MALAA) RP2 water 33 1985
Magela B (MBLAA) RP2 water 20 1994
RP1 polished RP2 water 46 1995
Djalkmara East (E. Dj) (un)polished RP2 water 18 1997
Djalkmara West (W. Dj) (un)polished RP2 water 20 1999
Jabiru East (JELAA) (un)polished RP2 water 52 2006
RP1 Extension (RP1 ext) RP2 water 8 2006
Corridor Creek (CCLAA) RP2 water 141 2007
1 Dr Riaz Akber, Safe Radiation, Brisbane (www.saferadiation.com)0 Dr Ping Lu, Manager Ecology, Energy Resources of Australia Ltd, GPO Box 2394 Darwin NT 0801
5

Characterisation of contamination at land application areas at Ranger (collaborative project with ERA) (R Akber, A Bollhöfer & P Lu
To assess the radiological status of the land application areas, develop a dose model and propose rehabilitation strategies for the LAAs, a collaborative project was started in 2007/08 between Earth Water Life Sciences (EWLS, now ERA), Dr Riaz Akber (SafeRadiation) and eriss. eriss has been involved in planning and scoping the project from the early stages. A major part of the project involved radioanalytical analyses by eriss of the different types of samples (soils, leaf litter, dust) from the Ranger LAAs and provision of assistance for the assessment of radon exhalation from the LAAs. In addition, eriss contributes through continuing review and discussion of project data and results.
MethodsThe sample collection and radioanalytical methods have been described in previous eriss research summaries (Bollhöfer et al 2010, Akber at al 2011a). Soils and leaf litter samples were collected from all LAAs on the Ranger lease for measurement of radionuclide activity concentration via gamma spectrometry at eriss. The methods are described in Murray et al (1987), Marten (1992) and Esparon & Pfitzner (2009). Radon exhalation was measured at the LAAs at various distances from the sprinkler heads and the methods are described in Spehr & Johnston (1983) and Bollhöfer et al (2005). Passive dust collection stations were also established along transects that intersect the boundary of the Magela A and Magela B land application areas to examine the dispersion of dust from the Magela LAAs.
The results of these measurements were then used to determine above background dose rates from the application of irrigation water at the Ranger land application areas via the external gamma and inhalation pathways.
Summary of resultsFive reports have been published on the radiological status of the land application areas.
The first report (Akber et al 2011b) gives an estimate of the amount of radionuclides applied through land irrigation of the various LAAs, based on monitoring results of irrigation water quality and the quantities of water applied. These results are supplemented by results from actual soil and leaf litter radionuclide activity concentration measurements in Akber et al (2011c), which also investigates the spatial distribution of radioactivity in the LAAs. The results from these two studies are then used to determine the external gamma radiation dose rates in the land application areas (Akber et al 2011d). As expected, average above background external gamma dose rates from irrigation are highest for the Magela A (0.14 µSv·hr-1) and Magela B (0.10 µSv·hr-1) LAAs. On average, assuming that the entire 338 ha of LAAs at Ranger were accessed for equal amounts of time, the additional external gamma dose rate due to land application is approximately 0.03 µSv·hr-1. Generally, the dose rate is higher close to the location of the sprinklers than further away.
The results of airborne radon concentration measurements using passive devices (track etch detectors) and real time measurements with a Durridge Rad7 radon detector are published in report 4 (Akber et al 2011e). The results of the study were used to determine the increase in dose rate received via the inhalation of radon decay products from land application. Generally, the increase due to land application is small and only 0.003 µSv·hr -1 above background averaged over the entire 338 ha. Increases are higher in the Magela A (0.03 µSv·hr-1) and Magela B (0.02 µSv·hr-1) LAAs.
A fifth report (Safe Radiation 2011) was issued to ERA in 2011, investigating the dose rate through inhalation of resuspended radioactivity during future occupancy of the land
6

Characterisation of contamination at land application areas at Ranger (collaborative project with ERA) (R Akber, A Bollhöfer & P Lu
application areas at Ranger Uranium Mine. Generally, the report shows that inhalation of radioactivity in or on dust will deliver an above background radiation dose slightly higher than the external gamma and radon decay product inhalation pathways combined, due to the retention and high activity concentration of uranium in the soil surface at the LAAs, resuspension of this material and subsequent inhalation.
A preliminary dose assessment for the Magela A and B LAAs for all pathways is presented in Akber et al (2011a). There it has been highlighted that the above background doses depend on, both the pre-mining radiological conditions and the nature of future use of the area by indigenous people and the general public. In particular the ingestion pathway will vitally depend on future land use activities and likely occupancy of the area. A major review has been conducted by R Akber (2011, draft report) on available information about traditional Aboriginal diet in the Kakadu and Arnhem Land regions, food gathering habits, and flora and fauna (including home ranges) in the vicinity of Ranger Uranium Mine, to establish traditional diet categories and quantities that may be hunted and gathered post rehabilitation at Ranger mine. A model for the ingestion pathway is currently being developed and preliminary results indicate that the contribution from applied radioactivity to ingestion doses will be small.
Various rehabilitation options could be used to reduce exposure of people potentially accessing the footprint of the LAAs. These options include removal of the surface 10 cm of contaminated soil and placing it into the pit, tilling of the soil, or a mixture of both. A rehabilitation trial was initiated in late September 2011 at the Magela B LAA (Figure 1) in order to investigate whether predicted reductions in dose rates can be achieved. It consists of four different treatments.
Treatment 1: Baseline – No soil removal or redistribution within the area.
Treatment 2: Soil redistribution – tilling to 30–50 cm depth within 7 m radial distance from the sprinkler heads.
Treatment 3: Soil removal – removal of surface 10 cm of soil within 5 m radius of location of the sprinkler head.
Treatment 4: Soil removal (as per treatment 3) and redistribution – removal of 10 cm of soil followed by tilling.
Figure 1 Mixing of the soil at one of the Magela B LAA rehabilitation plots
7

Characterisation of contamination at land application areas at Ranger (collaborative project with ERA) (R Akber, A Bollhöfer & P Lu
Before the area was disturbed by heavy machinery, radon flux densities were measured across the footprints of the four treatments to establish the baseline conditions. Soil samples were also collected at this time. The measurements of soil radionuclide activity concentrations have been completed for these samples. A post earthworks radiological survey was undertaken in late October 2011, after the four areas had been treated according to the schedule above. Radon exhalation rates were also measured at this time.
Outstanding workSoil samples collected in late October 2011 are being processed and will be analysed at eriss via gamma spectrometry for soil radionuclide activity concentrations. Radon exhalation rates will be measured again about one year after the initial earthworks to determine the changes in radon flux densities as a result of the four different treatments.
ReferencesAkber RA & Marten R 1992. Fate of radionuclides applied to soil in Ranger Uranium Mine
land application area. In Proceedings of the Workshop on Land Application of Effluent Water from Uranium Mines in the Alligator Rivers Region. Ed Akber RA, Jabiru 11–13 September 1991, Supervising Scientist for the Alligator Rivers Region, AGPS, Canberra, 139–165.
Akber R, Bollhöfer A & Lu P 2011a. Radiological characterisation of Ranger mine land application areas. In eriss research summary 2009–2010. eds Jones DR & Webb A, Supervising Scientist Report 202, Supervising Scientist, Darwin NT, 6–12.
Akber R, Lu P, Bollhöfer A & Gellert C 2011b. Radioactivity in Land Application Areas estimated from historic water monitoring data. Energy Resources of Australia Ltd, Darwin.
Akber R, Lu P & Bollhöfer A 2011c. Distribution of radioactivity in the land application areas assessed via direct measurement; Energy Resources of Australia Ltd, Darwin.
Akber R, Lu P & Bollhöfer A 2011d. External radiation dose in the land application areas; Energy Resources of Australia Ltd, Darwin.
Akber R, Lu P & Bollhöfer A 2011e. 222Rn in the land application areas; Energy Resources of Australia Ltd, Darwin.
Bollhöfer A, Storm J, Martin P & Tims S 2005. Geographic variability in radon exhalation at a rehabilitated uranium mine in the Northern Territory, Australia. Environmental Monitoring and Assessment 114. 313–330.
Bollhöfer A, Akber R, Lu P, Ryan B & Passmore G 2010. Characterisation of contamination at land application areas at Ranger. In eriss research summary 2008–2009. eds Jones DR & Webb A, Supervising Scientist Report 201, Supervising Scientist, Darwin NT, 5–11.
Davies BE 1983. Heavy metal contamination from base metal mining and smelting: implications for man and his environment. In Applied Environmental Geochemistry. ed Thornton I, Academic Press Geology Series, London, 425–462.
Esparon A & Pfitzner J 2010. Visual gamma: eriss gamma analysis technical manual. Internal Report 539, December, Supervising Scientist, Darwin.
Hollingsworth I, Overall & Puhalovich A 2005. Status of the Ranger Irrigation Areas – Final Report. EWL Sciences Pty Ltd, Darwin, Australia.
8

Characterisation of contamination at land application areas at Ranger (collaborative project with ERA) (R Akber, A Bollhöfer & P Lu
Marten R 1992. Procedures for routine analysis of naturally occurring radionuclides in environmental samples by gamma-ray spectrometry with HPGe detectors. Internal report 76, Supervising Scientist for the Alligator Rivers Region, Canberra. Unpublished paper.
Murray AS, Marten R, Johnston A & Martin P 1987. Analysis for naturally occurring radionuclides at environmental concentrations by gamma spectrometry. Journal of Radioanalytical and Nuclear Chemistry, Articles 115, 263–288.
Safe Radiation 2011. Dose rate through inhalation of resuspended radioactivity during future occupancy of the land application areas at Ranger Uranium Mine. Safe Radiation Pty Ltd Report Number SR 0168 N. September 2011.
Spehr W & Johnston A 1983. The measurement of radon exhalation rates using activated charcoal. Radiation Protection in Australia 1(3), 113–116.
Willett IR, Bond WJ, Akber RA, Lynch DJ & Campbell GD 1993. The fate of water and solutes following irrigation with retention pond water at Ranger Uranium Mine. Research report 10, Supervising Scientist for the Alligator Rivers Region, AGPS, Canberra.
9

KKN 1.2.4 Ecotoxicology
Dissolved organic carbon ameliorates aluminium toxicity to three tropical
freshwater organismsMA Trenfield, SJ Markich,0 JC Ng,0 B Noller,0 & RA van Dam
BackgroundWaters draining from legacy, closed and operating mine sites with sulfidic ores and/or waste rock are often acidic and, as a consequence, can contain highly elevated concentrations of metals, including aluminium (Al) (Johnson & Hallberg 2005). Examples of such acid mine drainage conditions in the tropics of Australia include the legacy Rum Jungle, Mt Morgan, Mount Todd and Cosmo Howley mine sites (Parker et al 1996, Harries 1997, van Dam et al 2008). In this region, concentrations of dissolved Al in slightly acidic fresh surface waters are generally low (~10 to 30 µg L-1, Noller 1985, Trenfield et al 2011), but acidic mine waters have been found to contain concentrations of up to 480 mg L-1 Al (Parker et al 1996).
In waters of pH ≤5, Al is predominantly present in its most bioavailable and toxic forms; the free ion (Al3+) and hydroxyl species AlOH2+ and Al(OH)2
+ (Driscoll & Schecher 1990, Lazerte et al 1997, Gensemer & Playle 1999). Under these acidic conditions, Al concentrations as low as 30 µg L-1 and 80 µg L-1 (in temperate studies) have been found to result in 50% reductions of algal growth and fish survival, respectively (Helliwell et al 1983, Roy & Campbell 1995). While natural occurrences of acidic Al-rich water (up to 500 µg L -1
Al) in tropical northern Australia have resulted in large fish kills (Brown et al 1983), there is only one study the authors are aware of that has investigated Al toxicity to tropical aquatic organisms (Camilleri et al 2003).
The bioavailability of Al is known to be reduced through strong complexation with dissolved organic carbon (DOC) at pH 4 to 7 (Perdue et al 1976, Vance et al 1996, Tipping 2002). Temperate studies have shown Al toxicity is greatly reduced when Al in solution is complexed by organic matter (Driscoll et al 1980, Gundersen et al 1994, Peuranen et al 2003). However, to our knowledge there are no existing data on the influence of DOC on Al toxicity to tropical aquatic organisms. In order to accurately predict the toxicity of Al in natural systems, the nature of DOC within the system in question, and its influence on Al bioavailability must be considered.
MethodsThe present study assessed the influence of DOC from two sources on the toxicity of Al in soft, acidic freshwater to three Australian tropical species – the cladoceran, Moinodaphnia macleayi, the green alga, Chlorella sp. and the green hydra, Hydra viridissima. A natural in situ source of DOC present in soft, tropical billabong freshwater (SBW DOC), was compared with a standard freshwater DOC reference material (Suwannee River Fulvic Acid; SRFA) to determine if the
0 Aquatic Solutions International, Dundas, New South Wales, 2117, Australia.0 The University of Queensland, National Research Centre for Environmental Toxicology, Coopers Plains,
Queensland, 4108, Australia.0 The University of Queensland, Centre for Mined Land Rehabilitation, St Lucia, Queensland, 4067, Australia.
10

Dissolved organic carbon ameliorates aluminium toxicity to three tropical freshwater organisms (MA Trenfield, SJ Markich, JC Ng, B Noller, & RA van Dam)
standard DOC could be used as a surrogate for a site-specific DOC in assessing the likely effect of DOC concentration on Al toxicity. Test durations and endpoints were as follows: H. viridissima, green hydra - 7 d population growth rate, Chlorella sp, green algae – 72 h cell division rate and M. macleayi, cladoceran – 24 h survival. Concentration-response relationships were reported for each of the organisms in the presence of each DOC source. The influence of the two DOC sources on the speciation of Al at relatively constant pH (5.0–5.4), alkalinity (2–14 mg L-1) and hardness (1–4 mg L-1), was inferred using geochemical speciation modelling (HARPHRQ and WHAM 6.0 models; results from WHAM not shown here).
For each organism and DOC source, non-linear (three-parameter sigmoidal or logistic) regressions were used to generate Al concentration-response curves for each DOC concentration (SigmaPlot 11.0). Aluminium concentrations at which there was 10% and 50% inhibition of growth rate (IC10 and IC50, respectively) of H. viridissima and Chlorella sp, or 50% reduction in survival (LC50) of M. macleayi (and their 95% confidence limits, CLs), were determined. Comparisons of Al toxicity were primarily based on differences in IC50 or LC50 values. Relationships between DOC, key Al species (as calculated by HARPHRQ) and Al toxicity were examined for each organism, by incorporating all toxicity data into a generalised linear model (glm) with a gaussian response distribution and associated logit link function (http://cran.ms.unimelb.edu.au/). Predictive toxicity models based on the glms were generated for each organism, with the relationship between the response predicted by the model and the observed response expressed in terms of r2.
ProgressThe (decreasing) order of sensitivity of the test organisms to Al (0.1µm fraction) was Hydra viridissima > Moinodaphnia macleayi > Chlorella sp, with DOC reducing dissolved Al toxicity most for Hydra viridissima (Table 1). However, it was found that colloidal or precipitated Al may contribute indirectly to the toxicity for M. macleayi and Chlorella sp (results not shown here). The toxicity of Al (0.1µm fraction) was up to six times lower in test waters containing 10 mg L-1 DOC in the form of SRFA, relative to toxicity observed at 1 mg L-1 DOC (Table 1). In contrast, the toxicity of Al was only up to two times lower in SBW containing 10 mg L-1 DOC, relative to water containing 1 mg L-1 DOC (Table 1). The increased ability of SRFA to reduce Al toxicity (Figure 1), was linked to its greater affinity for complexing Al compared with the in situ DOC. This has important implications for studies which use commercial standards of humic substances to predict Al toxicity in local environments. Speciation modelling demonstrated that Al3+, AlOH2+ and AlSO4
+ provided the best relationship with toxicity. Finally, empirical relationships were derived for each organism that can be used to predict Al toxicity at a given Al and DOC concentration (Table 2).
ConclusionsAl-DOC complexation has important consequences for reducing Al toxicity to tropical freshwater organisms. Al toxicity to aquatic biota could be overestimated where assessments do not incorporate this complexation. Less reduction in Al toxicity in the presence of SBW DOC compared with that of the pure FA standard, was attributed to less Al-FA complexation occurring with SBW DOC. These results suggest it would be more appropriate, where possible, for toxicity studies addressing the influence of DOC, to use a site-specific/local DOC source.
11

Dissolved organic carbon ameliorates aluminium toxicity to three tropical freshwater organisms (MA Trenfield, SJ Markich, JC Ng, B Noller, & RA van Dam)
Steps for completionThis work has been completed and published: Trenfield MA, Markich SJ, Ng JC, Noller BN & van Dam RA. 2012. Dissolved organic carbon reduces the toxicity of aluminium to three tropical freshwater organisms. Environ Toxicol Chem 31, 427–436.
a) Hydra viridissima
Fulvic acid (M)0 5 10 15 20 25
% re
duct
ion
in to
xici
ty
0
100
200
300
400
500
600
700
SRFAy = 27x +37r2 = 0.99
SBWy = 3x + 108r2 = 0.98
b) Chlorella sp.
Fulvic acid (M
0 5 10 15 20 25
% re
duct
ion
in to
xici
ty0
100
200
300
400
500
600
700
800
900
SRFAy = 31x + 135r2 = 0.99
SBWy = 12x + 149r2 = 0.91
c) Moinodaphnia macleayi
Fulvic acid (M)
0 5 10 15 20 25
% re
duct
ion
in to
xici
ty
0
200
400
600
800
1000
1200
SRFA in DMCW SBW diluted with SMCW
SRFAy = 34.5x + 259r2 = 0.96
SBWy = 15x - 39r2 = 0.88
Figure 1 Percent reduction in aluminium toxicity at 2, 5 and 10 mg L-1 dissolved organic carbon (DOC, shown as µM fulvic acid) compared to toxicity at 1 mg L-1 DOC for a) H. viridissima, b) Chlorella sp and c) M. macleayi. Reduction in toxicity is calculated based on the difference in IC50 or LC50 at each DOC
concentration with that at 1 mg L-1 DOC (based on 0.1 µm filtered Al for H. viridissima and total Al for Chlorella sp and M. macleayi). SRFA: Suwannee River fulvic acid, SBW: Sandy Billabong water.
12
Table 1 Aluminum (Al) toxicity to three tropical freshwater species with increasing dissolved organic carbon (DOC)
Water type Species Al fraction
Al LC50 or IC50 (µg L-1)a
DOCb
1 mg L-1 2 mg L-1 5 mg L-1 10 mg L-1
SRFAc in DMCWd Hydra viridissima 0.10 µme 35 (29–39)f 60 (40–70) 119 (91–138) 226 (205–240)
Totalg 56 (38–76) 90 (60–120) 173 (110–262) 208 (100–344)
Chlorella sp 0.10 µm 167 (108–235) 320 (287–350) 482 (427–537) 588 (525–630)
Total 275 (190–380) 613 (513–700) 1342 (1180–1490) 2076 (1752–2515)
Moinodaphnia macleayi 0.10 µm 78 (61–100) 244 (218–273) 332 (299–388) NC
Total 160 (123–200) 690 (610–760) 1160 (970–1390) 1580 (1280–1930)
SBWh + SMCWi Hydra viridissima 0.10 µm 40 (<10–86) 61 (49–72) 69 (55–82) 87 (67–106)
Total 152 (65–239) 166 (88–244) 215 (21–412) 243 (133–406)
Chlorella sp 0.10 µm 301 (195–468) 282 (190–418) 265 (247–290) 363 (280–480)
Total 437 (275–595) 801 (520–1077) 1251 (820–1667) 1635 (1410–1860)
Moinodaphnia macleayi 0.10 µm 189 (182–191) 199 (125–310) 180 (137–250) 234 (212–257)
Total 950 (940–980) 910 (610–1290) 1210 (870–1510) 2110 (2080–2140)a LC50: the concentration that results in 50% mortality (for M. macleayi), IC50: the concentration that results in 50% inhibition of the test response relative to the control response
(for H. viridissima and Chlorella sp.); b DOC: dissolved organic carbon; c SRFA: Suwannee River fulvic acid; d DMCW: dilute Magela Creek water; e 0.10 µm filtered Al concentrations; f 95% confidence limits; g total Al concentrations; h SBW: Sandy Billabong water; i SMCW: Synthetic Magela creek water.
13

Dissolved organic carbon ameliorates aluminium toxicity to three tropical freshwater organisms (MA Trenfield, SJ Markich, JC Ng, B Noller, & RA van Dam)
Table 2 Model equations describing the influence of aluminium (Al) concentration and dissolved organic carbon (DOC) on toxicity
Organism DOC Al modela Fit
Hydra viridissima SRFAb 0.0134 - 0.0007[Al] + 0.016[DOC] r2= 0.50
SBWc 0.20 -0.0012[Al] + 0.0096[DOC] r2= 0.67
Chlorella sp SRFAd 0.922 + 0.000313[Al] + 0.05[DOC] r2= 0.67
SBWe 1.244 -0.00045[Al] + 0.037[DOC] r2= 0.78
Moinodaphnia macleayi SRFAf 6.927 -0.0045[Al] + 0.455[DOC] r2= 0.47
SBWg 8.079 -0.002[Al] + 0.107[DOC] r2= 0.64a Models based on 0.1 µm filtered Al for H. viridissima and total Al for Chlorella sp and M. macleayi (so as not to discount the
contribution of colloidal fraction to toxicity for the latter two organisms), b n = 182, c n = 136, d n= 215, e n = 180, f n = 282, g n = 210
ReferencesBrown TE, Morleyn AW, Sanders T & Tau RD. 1983. Report of a large fish kill resulting
from natural acid water conditions in Australia. J Fish Biol 22, 335–350.
Camilleri C, Markich SJ, Noller BN, Turley CJ, Parker G & van Dam RA 2003. Silica reduces the toxicity of aluminium to a tropical freshwater fish (Mogurnda mogurnda). Chemosphere 50, 355–364.
Driscoll CTJ, Baker JP, Bisogni JJJ & Schofield CL. 1980. Effect of aluminium speciation on fish in dilute acidified waters. Nature 284, 161–164.
Driscoll CT & Schecher WD. 1990. The chemistry of aluminum in the environment. Environ Geochem Hlth 12, 28–49.
Gensemer RW & Playle RC 1999. The bioavailability and toxicity of aluminum in aquatic environments. Crit. Rev. Environ Sci Technol 29, 315–450.
Gundersen D, Bustaman S, Seim W & Curtis L 1994. pH, hardness, and humic acid influence aluminum toxicity to rainbow trout (Oncorhynchus mykiss) in weakly alkaline waters. Can J Fish Aquat Sci 51, 1345–1355.
Harries J 1997. Acid mine drainage in Australia: Its extent and potential future liability . Supervising Scientist Report 125, Supervising Scientist, Canberra.
Helliwell S, Batley G, Florence T, Lumsden, B. 1983. Speciation and toxicity of aluminum in a model freshwater. Environ Technol Lett 4, 141–144.
Johnson DB, Hallberg KB. 2005. Acid mine drainage remediation options: a review. Sci Total Environ 338, 3–14.
Lazerte BD, van Loon G, Anderson, B. 1997. Aluminum in water. In Research issues in aluminum toxicity. eds Yokel RA & Golub MS, Taylor & Francis, Washington DC, USA, 17–45.
Noller BN, Cusbert PJ, Currey NA, Bradley PH, Tuor M. 1985. Analytical scheme for speciation of aluminium in natural waters. Environ Technol Lett 6, 381–390.
Parker GP, Noller BN & Woods PH. 1996. Water quality and its origin in some mined-out pits of the monsoonal zone of the Northern Territory, Australia. Proceedings of the 3rd International 21st Annual Minerals Council of Australia Environmental Workshop, Minerals Council of Australia, Canberra, Australia, October 14–18, 1996.
14

Dissolved organic carbon ameliorates aluminium toxicity to three tropical freshwater organisms (MA Trenfield, SJ Markich, JC Ng, B Noller, & RA van Dam)
Perdue EM, Beck KC & Helmet Reuter J 1976. Organic complexes of iron and aluminium in natural waters. Nature 260, 418–420.
Peuranen S, Keinanen M, Tigerstedt C & Vuorinen PJ. 2003. Effects of temperature on the recovery of juvenile grayling (Thymallus thymallus) from exposure to Al + Fe. Aquat Toxicol 65, 73–84.
R software version 2.10.1. 2009. The R project for statistical computing. Vienna, Austria.
Roy R & Campbell P 1995. Survival time modeling of exposure of juvenile Atlantic salmon (Salmo salar) to mixtures of aluminium and zinc in soft water at low pH. Aquat Toxicol 33, 155–176.
Tipping E 2002. Cation binding by humic substances. Cambridge University Press, New York, USA.
Trenfield MA, Ng JC, Noller BN, Markich SJ & van Dam RA 2011. Dissolved organic carbon reduces uranium bioavailability and toxicity. 2. Uranium[VI] speciation and toxicity to three tropical freshwater organisms. Environ Sci Technol 45, 3082–3089.
Vance G, Stevenson F & Sikora F 1996. Environmental chemistry of aluminum-organic complexes. In The Environmental chemistry of aluminum, 2nd ed, ed Sposito G, Lewis Publishers, New York, USA, 169–220.
van Dam RA, Hogan A, Harford A & Markich SJ 2008. Toxicity and metal speciation characterisation of waste water from an abandoned gold mine in tropical northern Australia. Chemosphere 73, 305–313.
15

Ecotoxicological assessment of distillate from a pilot brine concentrator plant
AJ Harford & RA van Dam
BackgroundSteadily increasing process water inventory at the Ranger uranium mine has become a major operational issue for Energy Resources of Australia Ltd (ERA). Following an assessment of potential technology options ERA decided that brine concentration was the most viable route to reduce the inventory. A brine concentrator would produce large volumes of a purified water product (distillate) and a waste stream containing the salts present in the process water (brine concentrate). The distillate will be released into the environment via a yet to be determined method, while the brine concentrate will be returned to the tailings storage facility (TSF). Rio Tinto – Technology and Innovation (RT-TI, Bundoora, Victoria) were engaged by ERA to conduct trials on a pilot-scale brine concentrator plant. Two key aims of RT-TI trial were to (i) demonstrate that the distillate does not pose risks to operator health or the environment, and (ii) provide data to assist with designing water management and disposal systems. To assist with addressing the aquatic environment protection aspect, eriss undertook a comprehensive toxicity testing program of the pilot plant distillate. The aims of the toxicity test work were to: (i) detect and quantify any residual toxicity of the distillate and, (ii) in the event effects were observed, to identify the toxic constituent(s) of the distillate.
MethodsInitial toxicity screening of the distillate was conducted with a limited range of dilutions of the distillate using three aquatic species which had previously displayed sensitivity to treated process water permeate from the Ranger Treatment Water Plant (van Dam et al 2011). Specifically, Chlorella sp (72-h cell division rate), Hydra viridissima (96-h population growth rate) and Moinadaphnia macleayi (3-brood reproduction) were exposed to Magela Creek water (MCW) control and three dilutions of the distillate (ie 0, 25, 50 and 100% distillate). Further testing was conducted on a second batch of distillate using the same concentration range and two additional species, Lemna aequinoctialis (96-h growth rate) and Mogurnda mogurnda (96-h larval survival). The toxicity of the second batch of distillate was also assessed using Chlorella sp, H. viridissima and M. macleayi, although only at 0 (MCW) and 100% distillate, in order to assess the inter-batch reproducibility of the test methods.
In order to identify the toxic constituents of the distillate, a range of Toxicity Identification Evaluation (TIE) toxicity tests were conducted using the sole sensitive species, H. viridissima. The TIE tests involved assessing the relative toxicity of distillate samples produced by specific physical and chemical manipulations to change its composition or the speciation of specific constituents of potential concern. The results enable conclusions about potential primary toxicants. Six TIE tests were conducted to identify the cause of adverse effects on H. viridissima (Table 1).
16

Ecotoxicological assessment of distillate from a pilot brine concentrator plant (AJ Harford & RA van Dam)
Table 1 Toxicity Identification Evaluation toxicity tests using H. viridissima
TIE test Test solution manipulation Reason for manipulation
Graduated pH MCW and Distillate adjusted to pH (nominal) 5.5 and 7.5
Differentially alters speciation and toxicity of chemicals
EDTA a addition 0, 2.8, 5.5 and 11.0 mg/L EDTA added to MCW and distillate
EDTA binding reduces cationic metal bioavailability and toxicity
Calcium addition 0, 0.25, 0.50 mg/L calcium concentrations tested in synthetic soft water (SSW) and distillate
Reintroduction of an essential nutrient
Ammonia stripping MCW and distillate adjusted to pH (nominal) 11 and aerated for 18 h. pH re-adjusted to 6.5 prior to testing.
Removes toxicity due to ammonia
C18 Solid Phase Extraction (SPE)
MCW and distillate post-C18 column water tested. Eluate of distillate tested in MCW
Tests for toxicity of organic compounds
Major ion addition 0, 50 and 100% proportions (compared to SSWb) of sodium, calcium and potassium added to SSW and distillate
Reintroduction of an essential nutrients
a Ethylenediaminetetraacetic acid; b Synthetic Soft Water contains 0.4, 1.0 and 0.4 mg L-1 of calcium, sodium and potassium, respectively.
Results and discussionChemistryThe compositions (selected components) of the distillate and the process water feed are presented in Table 2. The distillation process reduced all major ions, ammonia and metals to near detection limits. Some organic compounds that were not detected in the feed water were detected at low µg L-1 concentrations in the distillate. In this context it is important to note that the sub-sampling of the second distillate batch for organic compounds was not ideal (ie plastic was used instead of glass), and some of the compounds are known to leach from plastics (Table 2). The decane, measured at 2 µg L-1, may have been misidentified nonane because they are both aliphatic hydrocarbons with 10 and 9 carbons, respectively. Nonane is a major component of Shellsol, which is used for the solvent extraction of U. Since some Shellsol does report to the tailings stream, nonane was identified as a specific organic chemical of interest for this work. Despite organics being detected, aliphatic hydrocarbons are not toxic at the concentrations measured in the distillate.
Toxicity test resultsThe toxicity tests results showed that the distillate was of low toxicity to four of the five organisms tested (Table 3; Figure 1). However, the population growth rate of H. viridissima was reduced by ~50% following exposure to 100% distillate (Figure 1). The second batch of distillate was found to be higher in toxicity to H. viridissima, with a full toxic effect observed following exposure to 100% distillate (Table 3). In contrast the second batch of distillate was of lower toxicity to M. macleayi and Chlorella sp.
17

Ecotoxicological assessment of distillate from a pilot brine concentrator plant (AJ Harford & RA van Dam)
Table 2 Composition of the process water before and after treatment with the brine concentrator
Analyte Process water (feed) a First distillate batch Second distillate batch
pH 4.1 – 4.5 5.8 6.7
Electrical Conductivity (µS cm-1) 20 900 – 29 700 17 12
Manganese (mg L-1) 1367 – 1551 0.23 0.13
Calcium (mg L-1) 300 – 341 0.11 <0.1
Magnesium (mg L-1) 3607 – 4123 0.6 0.4
Ammonia (mg L-1 N) 550 – 756 0.7 0.8
Biocarbonate (mg L-1 CaCO3) <1 7 6
Uranium (µg L-1) 9600 – 25 300 1.1 1.5
DOC (mg L-1) <1 – 6 0.6 NMC
Decane (µg L-1) Not detected NMc 2 d
Phenol, 3,5-bis (1,1-dimethylethyl) (µg L-1) b Not detected NMc 6 d
Phenol, 2,4-bis (1,1-dimethylethyl) (µg L-1) b Not detected NMc 12 d
1,2-Benzenedicarboxylic acid, buty (µg L-1) b Not detected NMc 10 d
a Value ranges based on numerous composite samples of the feed taken from 10 July – 9 August 2011 (data provided by ERA); b Known to leach from plastics; c NM: Not measured; d Not a definitive measurement as concentration estimated from closest chemical surrogate
Table 3 Toxicity of the pilot brine concentrator distillate
Species EndpointPercentage effect following exposure to 100% distillate
First batch Second batch
Chlorella sp. (unicellular alga) 72-h cell division rate 11 0
Lemna aequinoctialis (duckweed) 96-h growth rate N.T.a 0
Hydra viridissima (green hydra) 96-h population growth rate 53 100
Moinodaphnia macleayi (cladoceran) 3 brood (6 day) reproduction 13 6
Mogurnda mogurnda (fish) 96-h survival N.T. 7
a N.T. = Not tested
Figure 1 Concentration-response plots of the five species to the pilot brine concentrator distillate (batch 1 for alga, hydra and cladoceran; batch 2 for duckweed and fish)
18

Ecotoxicological assessment of distillate from a pilot brine concentrator plant (AJ Harford & RA van Dam)
Toxicity Identification Evaluation (TIE) resultsInitial chemical analysis of the distillate indicated that ammonia, manganese (Mn) and an organic component were potential candidate constituents for causing a toxic response. However, initial TIE results suggested none of these constituents were causing or contributing to the observed negative effect on H. viridissima (Table 3). Specifically, pH manipulation (raising pH) and stripping to remove ammonia that was present indicated that ammonia was not causing the effect. Whilst the pH manipulation suggested Mn may be contributing to the effect, the effect of addition of Ethylenediamine tetraacetic acid (EDTA, a chelating agent) indicated that this was unlikely. Removal of the organic component did not change the toxicity of the distillate, discounting organics as a cause of toxicity.
Table 3 Results of Toxicity Identification Evaluation toxicity tests using H. viridissima
TIE test Result Interpretation
Graduated pH 38% increase in growth rate at higher pH Ammonia toxicity not significant but metals may be implicated
EDTA addition No reduced toxicity with EDTA addition Metal toxicity not significant
Ammonia stripping No increase in growth rate following removal of ammonia
Effect not due to ammonia
C18 Solid Phase Extraction
No change in growth rate following SPE treatment
Effects not due to organic compounds
Calcium addition ~70% recovery with the addition of 0.5 mg L-1 Ca Majority of effects due to Ca deficiency
Major ion addition 87 and 96% recovery with the addition of 50 and 100% major ions, respectively
All effects due to major ion deficiency
In light of the above negative findings, the issue of major ion deficiency was specifically investigated as a potential cause of the effect on H. viridissima. Firstly, Ca addition was investigated due to its importance for nematocyst function and other physiological processes in Hydra (Gitter et al 1994, Kawaii et al 1999, Zalizniak et al 2006). The addition of 0.25 and 0.5 mg L-1 Ca to the distillate resulted in a 64% and 71% recovery relative to the Synthetic Soft Water (SSW) control, suggesting Ca deficiency as a reason for the effect of distillate on H. viridissima. An additional test was conducted that involved the addition of sodium (Na), potassium (K) and Ca at concentrations that were 0, 50 and 100% that of SSW (SSW contains 0.4, 1.0 and 0.4 mg L-1 of calcium, sodium and potassium, respectively). These major cations were targeted because they were below detection limit in the distillate, while magnesium was at concentrations similar to SSW. The results showed an 87% and 96% recovery of H. viridissima population growth rates with the addition of 50 and 100% major ions, respectively (Figure 2). This strongly indicates that the majority of the adverse effect from the distillate on Hydra was due to major ion deficiency issue rather than a chemical toxicity.
Despite the substantive removal of toxic effect by replacement of major cations, the concentrations of Mn in the distillate (110–220 µg L-1) remained a concern as they were higher than the IC10 of 70 µg L-1 previously reported for H. viridissima in circumneutral pH (6.0–7.0) soft waters (Harford et al 2009). Additionally, the lack of major ions in the distillate had the potential to exacerbate Mn toxicity. Therefore, the effects of Mn in the presence of reduced concentrations of major ions were examined using modifed SSW (ie with 0, 50 and 100% Na, K and Ca concentrations). In all SSW types Mn reduced the growth rate of hydra relative to the relevant SSW type control. The effect was most noticeable in the SSW with half the Na, K and Ca concentrations where growth rate was reduced by 9 and 20% in the 110 and 220 µg L-1 treatments (Figure 3). A two-way ANOVA of the results showed that the
19

Ecotoxicological assessment of distillate from a pilot brine concentrator plant (AJ Harford & RA van Dam)
growth rates of hydra in the 220 µg L-1 Mn treatments were statistically lower than the controls but there was no interaction between major ion concentration and Mn toxicity. Thus, Mn caused a similar reduction in the growth rate of hydra despite the SSW type. Consequently, despite the recognised issue with deficiencies of major ions in the distillate, a specific toxic response to Mn was identified. In this context, it is recommended that the concentration of Mn in the distillate not exceed ~100 µg L-1.
Figure 2 Effect of major ion (Ca, K, Na) addition on the toxicity of pilot brine concentrator distillate to H. viridissima, relative to growth rate in normal synthetic soft water, ie 0.34 day-1. Data represent the
mean ± se (n = 3).
SSW (no Ca, K and Na) SSW (1/2 Ca, K and Na) SSW (unmodified)0
0.05
0.1
0.15
0.2
0.25
0.3
0.35
0110220
Sythetic Soft Water (SSW) type
Spec
ific
grow
th ra
te (d
ay-1
)
Manganese (µg/L)
Figure 3 Effect of manganese on Hydra viridissima in modified Synthetic Soft Waters (SSW). Data represent the mean ± se (n = 3).
Steps for completionThe work done to date will be published. The toxicity of distillate produced following the addition of anti-scalant and anti-foaming chemicals to the feed process water will need to be specifically assessed prior to the brine concentrator at the Ranger mine becoming operational.
20

Ecotoxicological assessment of distillate from a pilot brine concentrator plant (AJ Harford & RA van Dam)
ReferencesGitter AH Oliver D & Thurm U 1994. Calcium- and voltage-dependence of nematocyst
discharge in Hydra vulgaris. Journal of Comparative Physiology A 175, 115–122.
Harford A, Hogan A, Cheng K, Costello C, Houston M & van Dam R 2009. Preliminary assessment of the toxicity of manganese to three tropical freshwater species. In eriss research summary 2007–2008. eds Jones DR & Webb A, Supervising Scientist Report 200, Supervising Scientist, Darwin NT, 12–19.
Kawaii S, Yamashita K, Nakai M, Takahashi M & Fusetani N 1999. Calcium dependence of settlement and nematocyst discharge in actinulae of the Hydroid Tubularia mesembryanthemum. Biological Bulletin 196, 45–51.
van Dam R, Hogan A, Harford A, Cheng C & Costello C 2011. Toxicity testing of Ranger process water permeate. In eriss research summary 2009–2010. eds Jones DR & Webb A, Supervising Scientist Report 202, Supervising Scientist, Darwin NT, 28–31.
Zalizniak L, Kefford BJ & Nugegoda D 2006. Is all salinity the same? I. The effect of ionic compositions on the salinity tolerance of five species of freshwater invertebrates. Marine and Freshwater Research 57, 75–82.
21

Effects of magnesium pulse exposures on aquatic organisms
MA Trenfield, AC Hogan, AJ Harford & RA van Dam
BackgroundAcquisition of continuous water quality monitoring data in Magela Creek downstream of Ranger since the 2005–06 wet season has enabled quantification of the magnitude, duration and frequency of transient magnesium (Mg) concentrations resulting from mine water discharges. The mine discharge signal is tracked using Electrical Conductivity (EC) as a surrogate for Mg concentration (see KKN 131 Surface water, groundwater, chemical, biological, sediment, radiological monitoring: Results of the stream monitoring program in Magela Creek and Gulungul Creek catchments, 2010–11 for full details). These monitoring data have shown that peak Mg concentrations associated with pulse events arising from mine site discharges, at times, exceed the provisional site-specific trigger value (TV) for Mg (3 mg L-1; van Dam et al 2010) in Magela Creek, and have, on one occasion, reached a maximum value of approximately 16 mg L-1. The ecotoxicity data upon which the Mg site-specific trigger value was derived were based on continuous exposures over three to six days (depending on the test species). Given that the majority of the Mg concentration pulses occur over timescales of only minutes to hours, it was unknown if these shorter duration exceedances could have the potential for adverse effects on aquatic biota. To address this important issue, an assessment of the toxicity of Mg under a pulse exposure regime was initiated in late 2008.
Previous analysis of the continuous monitoring EC data (converted to Mg concentration) indicated that more than 95% of the exceedences (51 of 53) occurred for 24 h or less. Consequently, pulse exposure durations of up to 24 h were considered of relevance. As such, this study assessed the effects of 4, 8 and 24-h Mg pulses on six local aquatic species. The experiments were done at a constant Mg:Ca ratio of 9:1, as determined by van Dam et al (2010). The aim is to establish a quantitative relationship between the TVs and exposure durations such that TVs can be derived for any given pulse duration. In 2010–11, testing was completed for all six species, and the results are summarised below.
MethodsThe effects of a single Mg pulse of 4, 8 and 24-h duration to six local species were assessed using the following test durations and endpoints: green alga (Chlorella sp) – 72-h cell division rate; duckweed (Lemna aequinoctialis) – 96-h growth inhibition; green hydra (Hydra viridissima) – 96-h population growth rate; cladoceran (Moinodaphnia macleayi) – ~6-d, 3-brood reproduction; gastropod (Amerianna cumingi) – 96-h reproduction; and fish (Mogurnda mogurnda) – 96-h survival. In most cases, test species were exposed to the Mg pulse over a range of Mg concentrations. Exceptions to this were M. mogurnda (all pulse durations) and Chlorella sp (4-h and 8-h pulses), which, due to their relative insensitivity, were only exposed to a control and very high (~4 g L-1) Mg concentration. Pulses were administered from the commencement of the test, after which time the organisms were returned to natural Magela Creek water (MCW) for the remainder of the standard test period (three to six days).
22

Effects of magnesium pulse exposures on aquatic organisms (MA Trenfield, AC Hogan, AJ Harford & RA van Dam)
Chlorella sp presented specific challenges related to the difficulties in recovering a sufficient proportion of cells from the Mg exposure solutions and returning them to control water. Following unsuccessful trials using centrifugation, cells were successfully isolated from the pulse water using a 1.2 µm polycarbonate filter. Cells were then rinsed in MCW (with 80-100% recovery) before resuspensing into MCW.
For M. macleayi, it was possible to investigate the influence of pulse timing with respect to the developmental stage of the test organism. There is evidence to suggest the sensitivity of crustaceans to toxicants is dependent on developmental stages and the molt cycle (Lee & Buikema 1979, Wright & Frain 1981, McCahon & Pascoe 1988). Consequently, for M. macleayi, pulses were administered both at the commencement of the test and also at the onset of reproductive maturity ie, when the juvenile cladocerans were 27-h old and developing their first brood offspring (approximately 24 h into the experiment).
The results from all tests were compared with those from tests where the organisms were continuously exposed to Mg throughout the standard test period.
ProgressTable 1 presents the Mg concentrations that caused a 10% (IC10) and 50% (IC50) inhibition in the organism response relative to a control (unexposed) response. Magnesium toxicity typically decreased with a reduction in exposure duration. As an example, the 4-h, 8-h, 24-h and continuous exposure concentration-response relationships for H. viridissima are provided in Figure 1. This graph clearly shows the reduction in toxicity as the pulse duration decreases. Based on the IC50 values, where available, the reduction in Mg toxicity of a 4-h exposure duration compared with a continuous (72, 96 or 120 h) exposure duration ranged from two-fold (H. viridissima) to almost 50-fold (Amerianna cumingi).
Magnesium (mg L-1)
0 500 1000 1500
Perc
ent o
f con
trol
resp
onse
(pop
ulat
ion
grow
th ra
te)
0
20
40
60
80
100
Continuous4h pulse8h pulse 24h pulse
Figure 1 Effect of exposure duration on the toxicity of magnesium to H. viridissima. Data points represent means (n = 3) standard error. Data expressed as a percentage of control growth rate which ranged from 0.3-0.4 day-1. Concentration-response curve models (3 parameter sigmoid) for the data can
be identified as follows: solid line – continuous exposure; short dashed line – 4 h pulse exposure; dashed-dotted line – 8 h pulse exposure; and long dashed line – 24 h pulse exposure.
23

Effects of magnesium pulse exposures on aquatic organisms (MA Trenfield, AC Hogan, AJ Harford & RA van Dam)
Table 1 Toxicity of pulse exposures of magnesium (mg L-1) to six tropical aquatic organisms
Species 4-h pulse 8-h pulse 24-h pulse Continuous exposure1
IC10 IC50 IC10 IC50 IC10 IC50 IC10 IC50
Chlorella sp (unicellular alga) >39002 >39002 >41002 >41002 3940 >43002 818(169-1268)3
3435(2936-3934)
Lemna aequinoctialis (duckweed) 4212
(3491-NC)4
>42202 1495
(720-2394)
3781
(3412-NC)
79.6
(NC-677)
2851
(2367-3310)
36
(13-68)
629
(413-956)
Hydra viridissima (green hydra) 1213
(1124-1268)
1351
(1321-1454)
1001
(961-1094)
1045
(1014-1111)
709
(532-828)
900
(820-966)
246
(139-322)
713
(646-780)
Moinodaphnia macleayi (cladoceran)
Exposed at test commencement 1017(707-1354)
1461(1192-1569)
612(303-900)
1043(867-1316)
216(91-346)
502(439-604)
39(17-54)
122(99-151)
Exposed at onset of reproductive maturity
212(NC-335)
358(264-420)
61.8(NC-162)
296(231-362)
128(77-179)
247(218-278)
n/a n/a
Amerianna cumingi (gastropod) 3031
(NC)
>41702
(2572-NC)
387
(NC-1972)
2743
(1739-3851)
301
(NC-1260)
1937
(1343-2633)
5.6
(0.6-14)
96
(61-150)
Mogurnda mogurnda (fish) >41002 >41002 >41002 >41002 >41002 >41002 4008
(3850-4025)
4054
(4046-4063)
1 Continuous exposure data reproduced from van Dam et al (2010) 2 Values were reported as ‘greater than’ values where the model could not predict the relevant IC value within the Mg concentration range tested, the
maximum of which approximately corresponded to the maximum Mg concentration that could be tested at the specified Mg:Ca ratio of 9:1 without exceeding the solubility limit of CaSO4 (ie ~4200 mg L-1 Mg)
3 95% Confidence limits 4 NC not calculable
24

Effects of magnesium pulse exposures on aquatic organisms (MA Trenfield, AC Hogan, AJ Harford & RA van Dam)
M. macleayi was more sensitive to Mg when exposed at the onset of reproduction compared with exposure to first instar neonates (ie at test commencement) (Table 1, Figure 2). Regardless of pulse duration, pulses administered around the onset of reproductive maturity resulted in higher toxicity than the same pulse duration applied at the start of the test. This finding differs from a common assumption in ecotoxicology that early life stages of species (ie neonates) are more sensitive than later life stages. However, as noted earlier, sensitivity in crustaceans has been reported to also be dependent on the timing of exposure in relation to the molting cycle. The exact mechanism by which exposures around the onset of reproductive maturity result in more toxic effects is not yet known, but could be related to: (i) a lack of energy resources available for reproduction, due to the increased energy requirements for maintenance (associated with the added stress of coping with Mg exposure); and/or (ii) increased permeability to ions of the exoskeleton immediately after molting.
A. B.
0 500 1000 1500 2000 2500 3000 3500
Perc
ent o
f con
trol
resp
onse
(Offs
prin
g pe
r adu
lt)
0
20
40
60
80
100
120
At test commencement (0-4 h)At onset of reproduction (25-29 h)
4-h pulse
Magnesium (mg L-1)
0 500 1000 1500 2000 2500 3000 3500
Perc
ent o
f con
trol
resp
onse
(Offs
prin
g pe
r adu
lt)
0
20
40
60
80
100
120At test commencement (0-8 h)At onset of reproduction (23-31 h)
8-h pulse
Magnesium (mg L-1)
C.
Magnesium (mg L-1)
0 500 1000 1500 2000 2500 3000 3500
Perc
ent o
f con
trol
resp
onse
(Offs
prin
g pe
r adu
lt)
0
20
40
60
80
100
120
At test commencement (0-24 h)At onset of reproduction (15-39 h)
24-h pulse
Figure 2 Effect of the timing of exposure on the toxicity of magnesium to M. macleayi (A – 4-h pulse; B – 8-h pulse; C – 24-h pulse). Data points represent means (n = 10) standard error. Concentration-
response curve models (3 parameter sigmoid) for the data can be identified as follows: solid line – Mg exposure at test commencement; dashed line – exposure bracketing the onset of reproductive maturity.
See Table 1 for corresponding toxicity estimates.
The concentrations of Mg that resulted in toxic effects for these organisms were much greater than the maximum concentration that has been reported in Magela Creek downstream of the mine (16 mg L-1 Mg). Even in the most sensitive test, where M. macleayi was exposed at the onset of reproductive maturity, the concentrations of Mg that caused a 10% inhibition of the test endpoint (IC10; generally considered an ‘acceptable’ level of effect) ranged from 62–212 mg L-
1, which was 4–13 times higher than the reported maximum Mg concentration.
25

Effects of magnesium pulse exposures on aquatic organisms (MA Trenfield, AC Hogan, AJ Harford & RA van Dam)
ConclusionsResults show that pulse exposures of Mg of ≤24 h are generally substantially less toxic than continuous exposures over 3 to 6 days. However, the degree to which this is the case depends on the species and, for at least one species (ie M. macleayi), the life stage that is exposed. The Mg concentrations at which (sub-lethal) toxic effects have been observed are well in excess of those measured during pulse events in Magela Creek. However, ultimately, Mg concentrations in Magela Creek will need to be compared to pulse exposure trigger values derived from data for all the tested species, rather than toxicity values for individual species.
Steps for completionReliable toxicity estimates could not be obtained for L. aequinoctialis (4-h pulse), M. mogurnda (4-h, 8-h, 24-h pulses) and Chlorella sp (4-h, 8-h, 24-h pulses) up to the maximum Mg concentration tested (~4.2 g L-1 Mg), due to the need to maintain the Mg:Ca ratio at 9:1 and the solubility limit of CaSO4 (~0.42 g L-1). In order to improve the toxicity estimates for these organisms, tests will need to be conducted using MgCl2 and CaCl2, the latter of which has a higher solubility than CaSO4, thus, enabling a higher Mg concentration to be tested. van Dam et al (2010) showed that the toxicity of Mg was similar when added as the SO4 or Cl salt. Hence, the change in Mg salt should not confound the test data. Once these data have been obtained, a quantitative relationship will be derived between Mg water quality trigger values and exposure duration, to be applied to the monitoring and assessment framework for the Ranger mine. This will enable the environmental significance of any periodic excursions of Mg in Magela Creek to be quickly determined.
ReferencesLee DR & Buikema AL 1979. Molt-related sensitivity of Daphnia pulex in toxicity testing.
Journal of Fisheries Research Board of Canada 36, 1129–1133.
McCahon CP & Pascoe D. 1988. Cadmium toxicity to the freshwater amphipod Gammarus pulex (L.) during the moult cycle. Freshwater Biology 19, 197–203.
van Dam RA, Hogan AC, McCullough CD, Houston MA, Humphrey CL & Harford AJ 2010. Aquatic toxicity of magnesium sulphate, and the influence of calcium, in very low ionic concentration water. Environmental Toxicology and Chemistry 29 (2), 410–421.
Wright DA & Frain JW 1981. The effect of calcium on cadmium toxicity in the freshwater amphipod, Gammarus pulex (L.). Archives of Environmental Contamination and Toxicology 10, 321–328.
26

Development of a reference toxicity testing program for routine toxicity test species
KL Cheng, AJ Harford & RA van Dam
BackgroundOver the past six years, in response to recommendations by van Dam (2004) and Dr Jenny Stauber at ARRTC’s 14th meeting (September 2004), the eriss ecotoxicology laboratory has been progressively implementing a program of reference toxicant testing, using uranium, for its routine suite of test species. The methods were developed in accordance with formal guidance on reference toxicant testing (Environment Canada 1990). Since 2004–05, reference toxicant control charts have been developed for four of the five routine testing species. This summary captures the reference toxicity testing progress for two years, 2009–10 and 2010–11. The aims for this period were to:
1 continue with the established reference toxicity testing programs for Moinodaphnia macleayi, Chlorella sp, Hydra viridissima and Mogurnda mogurnda; and
2 continue to investigate identified difficulties with the Lemna aequinoctialis (duckweed) reference toxicity test, with the objective of establishing an acceptable and consistent control growth and a consistent concentration-response relationship.
MethodsDescriptions of the testing procedures are provided in Riethmuller et al (2003).
ProgressIn total, 33 reference toxicants tests (Chlorella – 7; Hydra – 6; Moinodaphnia – 8; Mogurnda – 5 and Lemna aequinoctialis – 7) were completed during 2009–10 and 2010–11. Of these tests, 31 provided valid results, as summarised in Table 1. The associated control charts for Chlorella sp, H. viridissima , M. macleayi, and M. mogurnda are presented in Figure 1. L. aquinoctialis control chart is shown in Figure 4.
A summary of the issues identified during the period for each component of the reference toxicity test program is provided below.

A. Chlorella sp.
0 2 4 6 8 10 12 14 16 18 20-20
0
20
40
60
80
100
Test number
EC50
(µg
L-1
U)
B. Moinodaphnia macleayi
0 2 4 6 8 10 12 14 16 18 20-100
0
100
200
300
400
Test number
EC50
(µg
L-1
U)
C. Hydra viridissima
0 2 4 6 8 10 12 14 16 18 200
40
80
120
160
Test number
EC50
(µg
L-1
U)
D. Mogurnda mogurnda
0 2 4 6 8 10 12 14 16 18 200
500
1000
1500
2000
2500
Test numberEC
50 (µ
g L-
1 U)
Figure 1 Reference toxicant control charts for A. Chlorella sp, B. M. macleayi, C. H. viridissima and D. M. mogurnda, as of Oct 2011. Data points represent EC50 (µg L-1 U) toxicity estimates and their 95% confidence limits (CLs). Reference lines represent the following: broken lines – upper and lower 99%
confidence limits ( 3 standard deviations) of the whole data set; dotted lines – upper and lower warning limits ( 2 standard deviations); unbroken line – running mean.
28


Development of a reference toxicity testing program for routine toxicity test species (KL Cheng, AJ Harford & RA van Dam)
Table 1 Summary of uranium reference toxicity test results for 2009–10 and 2010–11
Species & endpoint Test Code EC50 (g L-1 U) Valid test? Comments
Chlorella sp(72-h cell division rate)
1064G1080G1091G1106G1144G1163G1178G
10 (7, 13)15 (11, 17)30 (26, 38)32 (26, 37)20 (15, 26)33 (27, 37)23 (17, 28)
YesYesYesYes YesYesYes
Hydra viridissima(96-h population growth)
1029B1077B1099B1136B1164B1198B
68 (65, 71)45 (32, 59)77 (72, 81)a
98 (86, 109)90 (71, 103)103 (96, 109)
YesYesYesYesYesYes
Moinodaphnia macleayi(48-h immobilisation)
1023I1078I
1103I1129I1156I1174I1190I1191I
95 (93, 98)NCb
14 (11, 17)55 (47, 64)
47 (NC)225 (NC)
90 (78, 103)NC
YesNo
YesYesYesYesYesNo
No effect at highest concentrationa
No effect at highest concentrationa
Mogurnda mogurnda(96-h sac fry survival)
1060E1098E1123E1157E1175E
1202 (1043, 1349)1252 (1108, 1373)1582 (1469, 1689)1640 (1590, 1660)1636 (1523, 1687)
YesYesYesYesYes
Lemna aquinoctialis (96-h population growth)
1049L 1065L 1089L 1093L 1141L 1167L 1183L
10000 (7800 12000)11650 (10300, 12300)
9480 (9080, 10530)10370 (9900, 10900)13030 (11500, 16000)10900 (10300, 11340)10450 (9180, 11840)
YesYesYesYesYesYesYes
Values in parentheses represent 95% confidence limits
a See text for discussionb Not calculable
Chlorella spAll seven Chlorella sp tests were valid, with control growth rates within the acceptability criterion of 1.4 0.3 doublings/day (Riethmuller et al 2003). There are no issues associated with this protocol. The running mean (n=20) tests EC50 is 36 µg L-1 U, with all results within the upper and lower warning limits ( 2 standard deviations) of 68 and 5 µg L-1 U, respectively.
Hydra viridissima (green hydra)All six reference toxicity tests for H. viridissima were valid. There are no issues associated with this protocol. The running mean (n=20) EC50 is 75 µg L-1 U, with all results within the upper and lower warning limits ( 2 standard deviations) of 113 and 40 µg L -1 U, respectively.
30

Development of a reference toxicity testing program for routine toxicity test species (KL Cheng, AJ Harford & RA van Dam)
Moinodaphnia macleayi (water flea)The current running mean (n=19) EC50 (lower, upper warning limits) is 56 (-33, 146) µg L -1 U. Of the eight reference toxicity tests for M. macleayi, six were valid. The two invalid tests experienced failures due to a lack of observed effects at the highest concentrations tested, which does not allow for an EC50 to be calculated. The first invalid test (1078I) produced an unusual result, whereby there was 100% survival of M. macleayi exposed to the highest concentration tested of ~140 µg L-1 U. In response to this, U concentrations over a broader range were investigated (control, 4, 18, 75, 147 and 300 µg L-1) to determine an effect concentration. Mortality was observed at 18 µg L-1 U with 100% mortality to M. macleayi exposed to 75, 147 and 300 µg L-1 U, resulting in a EC50 of 14 µg L-1 U. This test was repeated resulting in significant mortality at 80, 160 and 320 µg L-1 U, and a LC50 of 55 µg L-1 U.It was suspected that the fermented food provided to M. macleayi during testing (fermented food with vitamins, FFV) was contributing to the variable response observed across cladoceran tests, as FFV is prepared approximately every 3 months and the fermentation process may lead to variable microbial communities, particulate sizes and organic carbon. Every effort is made to achieve similar FFV (ie ingredients, quantity, temperature, colour and smell). A side by side comparison using regular unfiltered FFV and 0.1 µm filtered FFV, was conducted. This aimed to determine if the filtered or particulate fraction of FFV was more nutritionally important for M. macleayi, and whether U toxicity would be affected, noting that such factors might explain the variable toxicity results produced by this test. All other aspects of the test conditions were the same (ie diluent water, algal food density, light intensity and temperature).
There was 100% mortality in fleas exposed to 320 µg L-1 U with unfiltered FFV, while all the individuals survived following exposure to the same U concentrations with the filtered FFV (Figure 2a). The results suggested that U bound to particulate organic matter may be a significant source of U to M. macleayi than dissolved U, at least under the conditions used here.
Toxicity tests were also conducted using two different batches of FFV to determine if reproducibility could be achieved and to compare toxicity results between the two. One FFV was used in a previous test that produced an EC50 of 225 µg L-1 U with no significant mortality to individuals exposed to 150 µg L-1 U. A repeat test with the same batch off FFV (preserved by freezing) resulted in no effect to M. macleayi exposed to 140 µg L-1 U. Moreover, there was no significant mortality of individuals exposed to 270 µg L -1 U. This test was run concurrently with a test using a new batch of FFV to determine if different batches of FFV had any influence on toxicity (all other test conditions were the same). The test with newer FFV had very different toxicity effects, with significant mortality to individuals exposed to 69, 140 and 270 µg L-1 U (Figure 2b). These results suggested that the composition of FFV (organic carbon, microbial community, particulate size) varies enough between batches to potentially affect U toxicity and that preservation by freezing for long periods (>3 months) may contribute to a reduction in toxicity.
A reproductive test (3 brood) was conducted to compare unfiltered, 0.45µm and 0.1µm filtered FFV. This trial showed that fleas in both of the filtered treatments had significantly less neonates than fleas with the unfiltered FFV. The filtered treatments, however, were not significantly different from one another.
These tests will be repeated in the near future (ie batch vs batch and filtered vs unfiltered FFV) to determine the reproducibility of the results. In addition, the chronic U toxicity effects of filtered versus unfiltered FFV on M. macleayi will also be assessed. This work will also inform the project that plans to determine the effect of DOC on U toxicity to M. macleayi.
31

Development of a reference toxicity testing program for routine toxicity test species (KL Cheng, AJ Harford & RA van Dam)
(a) (b)
Figure 2 Effect of (a) unfiltered and 0.1 m filtered FFV (food source) and (b) different batches of FFV on the toxicity of uranium to M. macleayi. Data points represent means ± standard error.
Mogurnda mogurndaAll five reference toxicity tests for M. mogurnda were valid, with all EC50 values within the warning limits. There were no problems associated with this protocol. The running mean (n=20) EC50 was 1449 µg L-1 U and all results within the upper and lower warning limits of 2169 and 969 µg L-1 U, respectively.
Reference toxicity test development for Lemna aequinoctialisThe reference toxicant test method for L. aequinoctialis has been finalised. Previous growth trials using 2.5% CAAC plant growth medium (the medium used to culture this species; see Riethmuller et al 2003) have shown that it supported good growth and generally met the growth criteria. However, due to the very high concentrations of nutrients and essential elements in the CAAC medium, very high reference toxicant (U) concentrations were required to elicit a toxic response. A test using 2.5% CAAC (control, 642, 1200, 2520, 5160, 11200 and 19600 µg L-1 U) had no effect at any of these concentrations. The key challenge has been optimising the test medium so as to enable adequate control growth whilst still enabling a response to be observed at uranium concentrations that are not excessively high.
Subsequently, six tests were conducted using 1% CAAC, with control growth in all tests above the protocol’s minimum acceptable growth rate of 0.35 day-1 (ie four-fold increase in frond numbers after 96 h). There were good concentration-response relationships using 1% CAAC over a 1500-25000 µg L-1 U concentration range.
A second test endpoint, based on frond surface area, was investigated in three tests. Surface area (mm2), measured from photographs using the image analysis freeware package, ImageJ (1.4q, National Institue of Health, USA), was based on the greenness of leaves using Hue (pure colour), saturation (intensity of colour) and brightness (amount of grey). When comparing the data (ie growth rate based on frond number versus growth rate based on surface area), surface area appears to be a more sensitive endpoint (Figure 3). This is because it measures ‘greenness’ (compared to the control), whereas counts of frond numbers include all fronds whether they are healthy or pale/patchy (ie dead or near-dead), giving a slightly less sensitive result. These initial results suggest that surface area represents a suitable and measurable endpoint, although additional testing will be undertaken to confirm reproducibility.
A reference toxicity control chart has been generated and, at this stage, control chart data are based on frond number growth rate. The current running mean (n=7) EC50 is 10840 µg L-1 U and all results within the upper and lower warning limits of 14380 and 7290 µg L-1 U, respectively (Figure 4).
32

Development of a reference toxicity testing program for routine toxicity test species (KL Cheng, AJ Harford & RA van Dam)
Figure 3 Comparison of growth rate based on frond number and surface area as endpoints to assess the toxicity of U to L. aequinoctialis
1 2 3 4 5 6 7 80
4000
8000
12000
16000
Test number
EC
50 (µ
g L-
1 U
)
Figure 4 Reference toxicant control chart for L. aequinoctialis. Data points represent EC50 (µg L-1 U) toxicity estimates and their 95% confidence limits (CLs). Reference lines represent the following: broken
lines – upper and lower 99% confidence limits ( 3 standard deviations) of the whole data set; dotted lines – upper and lower warning limits ( 2 standard deviations); unbroken line – running mean
Planned testing in 2011–12The reference toxicity testing programs for all five species will continue in 2011–12, with the aim of completing at least four tests per species. For M. macleayi, additional tests will focus on the role of FFV in influencing reproductive output as well as chronic U toxicity. Testing with 1% CAAC will continue for L.aequinoctialis. Frond surface area measurement and Standard Operating Protocols for this test will be documented in an Internal Report.
ReferencesEnvironment Canada 1990. Guidance document on control of toxicity test precision using
reference toxicants. Environmental Protection Series (EPS) Report 1/RM/12, Method Development and Application Section, Environmental Technology Centre, Environment Canada, Ontario, Canada.
Riethmuller N, Camilleri C, Franklin N, Hogan AC, King A, Koch A, Markich SJ, Turley C & van Dam R 2003. Ecotoxicological testing protocols for Australian tropical freshwater ecosystems. Supervising Scientist Report 173, Supervising Scientist, Darwin NT.
van Dam R 2004. A review of the eriss Ecotoxicology Program. Supervising Scientist Report 182, Supervising Scientist, Darwin NT.
33

KKN 1.2.4 Ecotoxicology
The toxicity of uranium (U) to sediment biota of Magela Creek backflow billabong environments
AJ Harford, RA van Dam, CL Humprey, DR Jones, S Simpson,0 AA Chariton,1 KS Gibb0 & JL Stauber1
BackgroundThere is currently an international paucity of quality data concerning the toxicity of uranium (U) in sediments to benthic biota. Consequently, there are no reliable toxicity trigger values for U in sediment. This is a significant issue for both the operational (sediment quality management triggers) and closure (sediment quality closure criteria) aspects of the environmental management of U mines. In the local context quality sediment U toxicity data are specifically required to determine if observed differences in populations of benthic biota in billabongs adjacent to the Ranger uranium mine are due to U in sediments or to other mining or non-mining related factors. For mine closure, sediment quality criteria are needed for downstream receptor wetlands, as well as for on-site sentinel wetlands which will serve to capture and ‘polish’ seepage and runoff waters from the rehabilitated mine site. Thus, a major eriss research project is underway, in collaboration with the CSIRO Centre for Environmental Contaminants Research (CECR) and Charles Darwin University (CDU), to address the knowledge gaps concerning this issue and to determine a site-specific sediment quality guideline for U in billabongs and creeks in the ARR. Further background and context for this project has been given in van Dam et al (2010) and Harford et al (2011).
The field sediment U toxicity study commenced in Gulungul Billabong in 2009. Gulungul Billabong is a largely undisturbed waterbody located just upstream of the confluence of Gulungul and Magela Creeks. It was planned that at least one pilot experiment would be undertaken to provide essential background information for the design of a subsequent full scale experiment. The initial chemical and biological characterisation of the study site was undertaken in April 2009 and the results summarised in van Dam et al (2010). During the 2009-2010 wet season, a pilot-scale experiment (Pilot 1) was undertaken. This study aimed to determine the most appropriate sediment spiking and deployment methods, U concentration range and replication required for a full scale experiment. It involved a 3 month U spiking and equilibration procedure, which was done to both ensure complete binding of the U and to minimise the possibility of elevated pore-water concentrations of U confounding the interpretation of the in field deployment results. The U-spiked sediments were deployed in the field over the duration of the wet season in retrievable containers. At the end of the exposure period, the extent of colonisation of macroinvertebrate, microinvertebrate and microbial communities was measured in the control and test replicates. Details of the methods are given in Harford et al (2011).
Chemical analysis of spiked sediments from Pilot 1 showed that the initial binding of U to the sediment was rapid and complete. There also was very little loss of U over the course of the wet season and the U was evenly distributed through the depth of the test containers.
0 Centre for Environmental Contaminants Research, CSIRO Land & Water, Locked Bag 2007, Kirrawee, NSW 2232
0 School of Environmental and Life Sciences, Charles Darwin University, Darwin, NT 0909.
34

The toxicity of uranium (U) to sediment biota of Magela Creek backflow billabong environments (AJ Harford, RA van Dam, CL Humprey, DR Jones, S Simpson, AA Chariton, KS Gibb & JL Stauber)
However, the biological recolonisation component of the was potentially confounded by the inadvertent creation of highly compacted ‘mud bricks’ that were not representative of the condition of the natural sediment, and which appeared to be physically non-conducive to colonisation by macroinvertebrate and possibly other fauna. There was generally low abundance and species richness of macroinvertebrates in both the control and U-spiked sediments. In contrast, preliminary (multivariate analysis) data for the microbial communities showed an apparent effect at 4000 mg U/kg, but not at 400 mg U/kg, compared to the control. The microzoobenthos samples were not assessed as originally planned, due to the difficulties in sorting very small and often cryptic organisms from the fine sediment. Instead, microzoobenthos samples were later analysed (by CSIRO CECR) using a similar ecogenomic approach as used at CDU for the microbes.
The Pilot 1 study results showed that although biological effects of sediment-bound U may be apparent at least at the highest U concentrations (4000 mg/kg) the sediment spiking method needed to be further refined to minimise the confounding physical disruption of the sediment structure. Thus a second pilot study (Pilot 2) was undertaken on the 10/11 wet season to investigate the effects of minimising (i) the amount of sediment manipulation, in particular, the sieving and the extent of mixing, and (ii) aerial exposure prior to wet season inundation. As for the first pilot, detailed chemical analyses were conducted to ensure that there was an acceptably homogeneous distribution of U throughout the sediment profile in the deployed spiked sediment.
MethodsThe Pilot 2 study was undertaken during the 2010–11 wet-season, and focused on evaluating an alternative method for sediment spiking, the objective of which was to minimise both disturbance of the physical characteristics of the sediment and the duration of the storage period prior to deployment. The method involved the gentle pouring of a solution of uranyl sulfate over the surface of the sediment, allowing the solution to infiltrate through the largely undisturbed sediment profile and finally to drain through the mesh base of the container into a collecting vessel. The solution, along with any incidentally elutriated sediment, was then re-poured over the sediment surface, after the bulk material had been gently mixed to facilitate the even distribution of U through the profile. Initial chemical analyses confirmed that the majority of the U (90%) was removed from the original U spiking solution after only two pourings (ie two recyle steps) of the collected permeate through the sediment. An additional benefit of this method was that the sulfate introduced with the U (as uranyl sulfate) could be flushed out of the sediment bed by washing it with deionised water, which removed the sulfate but not the U bound to the sediment. This contrasts with pilot 1 where the sulfate was not washed out and remained as a potentially confounding factor.
The method described above was used to produce a control and three U treatments (0, 500, 1000 and 2000 mg kg-1). Prior to deployment, sub-samples of the sediments were taken for chemical and ecogenomic analysis to define the starting chemical and biological condition. An extra (6th) replicate for each treatment was used to conduct comprehensive chemical analysis of the vertical and horizontal distribution of the U in the treatments. A site-control was also included as per Pilot 1.
The sediments (five replicates of each concentration treatment) were deployed on 25 November 2010 and retrieved on 11 April 2011 after being submerged in the billabong for 5 months. Conditions at the study site were significantly different to the preceding year due to early rain and very high total rainfall for the season. The sediments were deployed when the
35

The toxicity of uranium (U) to sediment biota of Magela Creek backflow billabong environments (AJ Harford, RA van Dam, CL Humprey, DR Jones, S Simpson, AA Chariton, KS Gibb & JL Stauber)
site was wet (in contrast to the preceding year, and thus obviating the baked mud brick condition), and the water overlying the site was ~1 m deeper when the sediments were retrieved compared with Pilot 1.
Following retrieval of the sediment, four cores of sediment (30–50 mm depth 15 mm diameter, three for ecogenomics and one for chemical analysis) were obtained from each container for detailed chemical, microbial and microinvertebrate analysis. The remaining sediment in each container was then elutriated through a 500 m mesh sieve and the material remaiming on the mesh retained for macroinvertebrate characterisation.
ResultsChemistryChemical analysis of the pre-deployed spiked sediment cores indicated that the U was evenly distributed (horizontally and vertically) throughout the test containers, ie 87–92% of the nominal concentration. However, one sub-sample from the 1000 mg kg-1 treatment contained U at only 53% of the nominal concentration, which may suggest some patchiness within the containers. The ratio of dilute (1M HCl) Acid Extractable Metal (AEM) to Total Recoverable Metals (TRM) was close to one (Table 1), which was similar to the previous year. This demonstrated that the longer spiking method of Pilot 1 had not increased the amount of U that was tightly bound to the sediment particle and that it was potentially bioavailable. Uranium pore water concentrations in the spiked sediments were only ver low for all the treatments (Table 1).
Table 1 Chemical analysis of spiked sediments prior to and following deployment
TreatmentNominal
U (mg kg-1)
Pre-deployment Post-deployment
TRMa U
(mg kg-1)AEMb:TRM
ratio% of
Nominal
Porewater U
(µg L-1) c
TRM U
(mg kg-1) d
AEM:TRMratio
% loss
Porewater U
(µg L-1)
Gulungul Control (GC)
0 6 ± 0.7 N.A.e N.A. N.A. 4 ± 0.2 N.A. N.A. N.A.
Control (C) 0 8 ± 0.2 N.A. N.A. N.A. 7 ± 0.6 N.A. N.A. N.A.
Low uranium (UL)
500 461 ± 18 0.91 92.3 51 372 ± 22 1.0 19 35
Medium uranium (UM)
1000 875 ±18 0.98 87.5 99 802 ± 23 0.95 8 72
High uranium (UH)
2000 1740 ± 54 1.01 87.0 118 1533 ± 24 0.91 12 148
a TRM = Total Recoverable Metals. Data represents mean ± se of n = 5; b AEM = Acid Extractable Metals (1M hydrochloric acid); c Data represents mean of n = 2; d Data represents mean ± se of n = 6; e N.A. = Not applicable.
Comparison of the chemical analyses of the sediments following retrieval of the sediments, with the pre-deployment values showed that the chemical composition of the sediments had changed little over the duration of the wet-season. The measured U concentrations were 11, 0 and 7% less than the pre-deployment samples for the 500, 1000 and 2000 mg kg -1 treatments, respectively.
36

The toxicity of uranium (U) to sediment biota of Magela Creek backflow billabong environments (AJ Harford, RA van Dam, CL Humprey, DR Jones, S Simpson, AA Chariton, KS Gibb & JL Stauber)
MacroinvertebratesDiversity and abundances of benthic macroinvertebrates in billabong sedimentsThere is a potential problem with any biological assessment method if indicator abundance and diversity occurring naturally in the habitat or experimental colonising environment are sufficiently low that these responses are unlikely to provide adequate discrimination amongst treatments. From the 2009–10 Pilot 1 study (Harford et al 2011), low benthic macroinvertebrate abundances and diversity were observed amongst the experimental treatments and this initiated a broader comparison of macroinvertebrate community structure in sediments and other habitats in Gulungul Billabong and Creek to assess the usefulness of this assemblage for future experimental study. Macroinvertebrate data that have been collected for different habitat types of Gulungul Creek and Billabong since 1996 were compiled, and abundance and diversity (taxa number) compared amongst habitats. All samples for the comparison had been collected in the period April to June (corresponding to the time window for sediment retrieval) in any given year. Macroinvertebrate data from three habitats were compared: (i) littoral billabong macrophytes – essentially surface-water-dwelling organisms; (ii) macrophyte and sand habitat, occurring in flowing waters along the edges of the creek upstream of Gulungul Billabong – a mix of sediment- and surface-water-dwelling organisms; and (iii) sediment habitat comprising the fine grained sediments found in the littoral zones of the billabong – essentially sediment-dwelling organisms. Abundance and taxa (mostly family-level) number data for habitats (ii) and (iii), where samples were collected from quadrats, were standardised to an area of 0.06 m2 corresponding to the surface area of each experimental sediment container. Samples taken from macrophyte habitat represent sweep samples not readily standardised to area and for this habitat, the data represent averages from the five replicate sweep samples collected from Gulungul Billabong on any particular occasion. While abundances from macrophyte habitat are not directly comparable to the other habitats represented, taxa number estimates are regarded as comparable. Results are plotted in Figure 1.
Benthic macroinvertebrates from Gulungul Billabong sediment occur in similar abundances to those occurring in other habitats in the creek system (Figure 1, top). However, taxa number is greatly reduced over that found in other habitats, indicative of the narrow and specialised niche available for colonising organisms (small grain size, relatively compacted, low oxygen availability). While similar abundances of animals are found in the billabong sediments compared to other habitats, the laboratory processing and retrieval of these animals from the preserved fine-grained residues is tedious and difficult as a result of the turbid slurries that arise when samples are examined over a microscope. An assessment of the suitability of macroinvertebrates for use as an indicator of biological impact in the sediments of the billabong is made below.
Diversity and abundances of benthic macroinvertebrates exposed to a gradient of U concentrations in the Pilot 2 studyTo date, benthic macroinvertebrates (>500 µm in size) have been processed from the control and ‘high-uranium’ treatments from the Pilot 2 study (five replicate samples per treatment). Taxa number and abundances for each replicate are shown in Figure 2.
37

The toxicity of uranium (U) to sediment biota of Magela Creek backflow billabong environments (AJ Harford, RA van Dam, CL Humprey, DR Jones, S Simpson, AA Chariton, KS Gibb & JL Stauber)
Figure 1 Taxa number and abundance of aquatic macroinvertebrates from different habitat of Gulungul Creek and Gulungul Billabong
0
100
200
300
400
500
600
700
800
C1 C2 C3 C4 C5 UH1 UH2 UH3 UH4 UH5
Tota
l ab
unda
nce
0123456789
10
C1 C2 C3 C4 C5 UH1 UH2 UH3 UH4 UH5
Taxa
num
ber
Treatment
Figure 2 Taxa number and abundance of benthic macroinvertebrates collected from the control (C, 0 mg/kg)) and ‘high-uranium’ (UH, 2000 mg kg-1 U) treatments
38

The toxicity of uranium (U) to sediment biota of Magela Creek backflow billabong environments (AJ Harford, RA van Dam, CL Humprey, DR Jones, S Simpson, AA Chariton, KS Gibb & JL Stauber)
Student t-tests found no significant difference in total abundances between control and high-uranium treatments (P = 0.07) but significantly lower taxa number in the high-uranium treatment compared with the control group (P = 0.02).
Multivariate analyses using PRIMER and add-on software (Clarke & Gorley 2006) were applied to the macroinvertebrate data, including (i) Multi-dimensional scaling (MDS) ordination, (ii) SIMPER (taxa contributing to differences in ordination groupings) and (iii) PERMANOVA (PERmutational Multivariate ANalysis Of Variance hypothesis testing of the treatment groups). The MDS ordination is shown in Figure 3. Replicate samples for the two treatments show some interspersion (or lack of complete separation) and reflecting this, PERMANOVA hypothesis testing showed no significant difference (P = 0.14) between the community structures. Any separation between the replicates of the two treatments was associated with higher abundances of caenid mayflies, oribatid mites, chironomid (blood worm) larvae and copepods in the control treatment and higher abundances of oligochaete worms and Acarina mites in the high-uranium treatment.
TreatmentControlHigh-U
2D Stress: 0.1
Figure 3 MDS ordination of macroinvertebrate community structure data arising from the 2011 Pilot 2 study, for control and ‘high-uranium’ (0 and 2000 mg kg-1 U) treatments
The collective results from the 2011 Pilot study indicate macroinvertebrate assemblages are likely to be responsive to the high uranium exposure. Power analyses would be required to estimate the replication required to detect with confidence, significant differences between treatments in future experiments. To this end, the natural low diversity of the macroinvertebrate fauna occurring in these sediments is unlikely to be an impediment to successful assessment of this assemblage group. Further processing of samples from the low-uranium treatment from 2011 will also be undertaken to aid in this assessment and planning for future experimentation.
MicrozoobenthosDelays in the sequencing and post-sequencing (bioinformatic) processing of the microzoobenthos samples meant that the data were not available at the time of writing this report. A major delay in the bioinformatics processing of the samples was due to a higher than expected diversity in the samples, which led to weeks of processing being needed. Extensive bioinformatics processing of the dataset is needed to ensure the ecogenomic dataset is free from sequencing errors.
39

The toxicity of uranium (U) to sediment biota of Magela Creek backflow billabong environments (AJ Harford, RA van Dam, CL Humprey, DR Jones, S Simpson, AA Chariton, KS Gibb & JL Stauber)
BacteriaBacterial community diversity was measured for each treatment (Figure 4) and one-way ANOVA analysis showed that there was no significant impact of the treatments on the number of unique OTUs, ie taxa richness.
0
200
400
600
800
1000
1200
1400
Gulungul control
Control Low U Medium U High U
Num
ber o
f uni
que
OTU
s
Treatment
Figure 4 Bacteria taxa richness in the treatments from Pilot 2
However, an MDS ordination of bacteria community structure showed two very distinct clusters (Figure 5a). The first cluster (Figure 5b) contained all the samples from the Gulungul (site) control, low and medium U treatments, eight of the fifteen control samples and five of the fifteen high U samples. A second cluster (Figure 5c) contained all the pre-deployment samples, the remaining ten high U treatments and seven control samples. PERMANOVA with pairwise comparisons showed that the most similar treatments were the control and high U treatments (P = 0.038). All other treatments were very dissimilar (P = 0.001). This analysis however did not include environmental parameters which may explain the association between the zero (control) and high uranium treatments. The bacterial data derived from this 16S rRNA tag sequencing approach gave 34 000 sequence reads across all samples. This represents a rich resource of bacterial community diversity that will require much further critical analysis before robust conclusions can be reached. For example, reads that occur infrequently could be removed and the remaining taxa could be identified to compare community composition between sites. These taxa could also be allocated functional roles and compared. This further refinement along with integration of environmental parameters such as temperature, DO, pH nutrients, elemental analysis could provide greater insight into the nature of the responses to the U treatments.
Steps for completionThe main experiment planned for the coming (2011–12) wet-season has been postponed until the 2012–13 wet season. This will provide to time to fully analyse, integrate and publish the enormous amount of ecogenomic and other information collected from the two Pilot studies, and to properly inform the design of the main experiment. Some of the key activities required in the next year include: 1) counting of the low and medium U treatment macroinvertebrate samples; 2) determining the most suitable method for processing and analysing the ecogenomics datasets; 3) statistical integration of the all the datasets; and 4) testing of other DNA profiling techniques, eg DGGE and N-cycling microarrays.
40

The toxicity of uranium (U) to sediment biota of Magela Creek backflow billabong environments (AJ Harford, RA van Dam, CL Humprey, DR Jones, S Simpson, AA Chariton, KS Gibb & JL Stauber)
a) All data shownTransform: Presence/absenceResemblance: S7 Jaccard
TreatmentCGCUHULPDCPDGCPDUHPDULPDMUUM
3D Stress: 0.01
b) Cluster 1 c) Cluster 2Transform: Presence/absenceResemblance: S7 Jaccard
TreatmentCGCUHULPDCPDGCPDUHPDULPDMUUM
3D Stress: 0.01
Transform: Presence/absenceResemblance: S7 Jaccard
TreatmentCGCUHULPDCPDGCPDUHPDULPDMUUM
3D Stress: 0.01
Figure 5 MDS ordination of bacteria community structure data arising from the Pilot 2 study. A) All data shown B) Magnified cluster 1 C) Magnified cluster 2. C = control, GC = Gulungul (site) control, UL = Low (500 mg kg-1) U, UM = Medium (1000 mg kg-1), UH = High (2000 mg kg-1) U and PD = represent
pre-deployment samples.
Referencesvan Dam R, Humphrey C, Harford A, Simpson S, Gibb K & Stauber J 2010. The toxicity of
uranium to sediment biota of Magela Creek backflow billabong environments. In eriss research summary 2008–2009, eds Jones DR & Webb A, Supervising Scientist Report 201, Supervising Scientist, Darwin NT, 27–31.
Harford A, van Dam R, Humphrey C, Jones D, Simpson S, Stauber J, Gibb K & C Streten-Joyce, 2011. The toxicity of uranium to sediment biota of Magela Creek backflow billabong environments. In eriss research summary 2009–2010, eds Jones DR & Webb A, Supervising Scientist Report 202, Supervising Scientist, Darwin NT, 32–36.
41
Cluster 1

KKN 1.2.4 Ecotoxicology
Towards revising the Limit for uranium in Magela Creek: standardisation of toxicity data
and incorporation of the effect of dissolved organic carbon
RA van Dam, AJ Harford, MA Trenfield, AC Hogan, SJ Markich0 & JL Stauber0
Introduction The current Limit for uranium (U) in Magela Creek of 6 µg/L was derived at least eight years ago using data for five species local to the Alligator Rivers Region (ARR) (Hogan et al 2003). However, in addition to the data used to derive the Limit, there have been an additional seven chronic toxicity studies published in the peer-reviewed literature that report U concentration-response relationships based on ecologically relevant endpoints for species local to the ARR. In total, peer-reviewed U chronic toxicity data are now available for seven ARR species representing seven genera from six taxonomic groups (microalgae, macrophytes, molluscs, microcrustaceans, cnidarians and fish). The substantial additional data acquired since 2003 suggest that it is time to re-derive the U Limit. However, there has been little consistency in the reporting of no/low effect toxicity measures for U, with five types of measures (NOECs, BEC10s, MDECs, low ICxs and IC50s0) being reported. Although soon-to-be-implemented rules in Australia and New Zealand for the derivation of water quality trigger values will allow the use of multiple types of toxicity measures (as a means of increasing sample size), the use of a single agreed toxicity measure is, nonetheless, ideal.
A feature of the existing U toxicity dataset is that considerable data exist for some species on the influence of key physico-chemical variables, including dissolved organic carbon (DOC), water hardness, pH and alkalinity, on U toxicity. These data provide the opportunity to search for key predictors of U toxicity and, potentially, to incorporate such predictors into the derivation of the U Limit (and other U water quality trigger values).
Thus, the additional U toxicity data and associated information on toxicity modifying factors provides the basis for a comprehensive revision of the U Limit. The first step in this process involved substantial manipulation and re-analysis of existing data, namely:
i Re-analysis of existing toxicity datasets for four freshwater species (Chlorella sp 1 and 20, Hydra viridissima and Moinodaphnia macleayi) using a consistent method in order to derive consistent measures of low/acceptable toxicity, in this case, the IC10;
0 Aquatic Solutions International, 5 Perry St, Dundas Valley NSW 2117, Australia0 CSIRO Land and Water, Locked Bag 2007, Kirrawee, NSW 2232, Australia0 NOEC – No-Observed-Effect-Concentration; BEC10 – 10% bounded effect concentration, MDEC – minimum
detectable effect concentration; low ICx; concentration inhibiting the response by a small/acceptable percentage relative to the control response (eg 10% – IC10); IC50 – concentration inhibiting the response by 50% relative to the control response.
0 Two strains of Chlorella have been included in the analysis, although one of the strains (Chlorella sp 2) is from Papua New Guinea and is believed to be a different species (J Stauber pers comm). It is included because the work presented here also forms part of a larger body of work that will be relevant to the revision of the ANZECC/ARMCANZ (2000) default national trigger values for U.
42

Towards revising the Limit for uranium in Magela Creek: standardisation of toxicity data and incorporation of the effect of dissolved organic carbon (RA van Dam, AJ Harford, MA Trenfield, AC Hogan, SJ Markich & JL Stauber)
ii Interrogation of U toxicity and corresponding water quality datasets for the Chlorella spp and H. viridissima to search for significant relationships between U toxicity and key physico-chemical variables;
iii based on the findings from (ii), above, development of algorithms that will enable the modification of individual species’ toxicity values and a revised U Limit in response to the concentration of dissolved organic carbon, a key modifier of U toxicity.
MethodsData collationUranium chronic toxicity data from the following studies were re-analysed: (i) Chlorella sp 1 – Franklin et al (2000), Hogan et al (2005) and Trenfield et al (2011); (ii) Chlorella sp 2 – Charles et al (2002); (iii) H. viridissima – Hyne et al (1992), Markich and Camilleri (1997), Riethmuller et al (2000) and Trenfield et al (2011); and (iv) M. macleayi – Hyne et al (1993), Semaan et al (2001) and four unpublished tests from 1992 (eriss, unpublished data). For all the tests, available data for pH, water hardness, alkalinity (or electrical conductivity, where hardness and alkalinity data were not reported), DOC and temperature were also collated and reported together with the re-analysed toxicity data.
Data analysisFor each dataset, non-linear regression was undertaken to derive a concentration-response relationship with associated 95% confidence limits (CLs). The IC10 and IC50 concentrations for U were then calculated using the fitted relationship.
Standard stepwise multiple linear regressions were undertaken on the combined toxicity and physico-chemical data for both Chlorella species (n = 20) and for H. viridissima (n = 16) to determine which of the key physico-chemical variables were the best predictors of U toxicity, as expressed by the IC10 and IC50 values0. The following independent variables were included in the stepwise regressions: Chlorella spp – pH, hardness and DOC; and H. viridissima – hardness, alkalinity and DOC. Variables (eg pH, water temperature) that were omitted from the regressions were done so on the basis that their ranges were considered too small to provide adequate resolution in terms of their influence on U toxicity.
Depending on the results of the stepwise regressions, further analyses were to be undertaken to determine an algorithm that will enable the modification of U hazard estimates / water quality guidelines based on the significant physico-chemical variable/s.
Progress to dateForty six existing U concentration-response relationships were re-analysed – 20 for Chlorella spp, 16 for H. viridissima and 10 for M. macleayi. As an example of the output, Table 1 represents the original physico-chemical and toxicity measures, as well as the re-analysed toxicity measures and associated regression model statistics, for the Chlorella spp datasets. Linear regression of the re-calculated IC10 values against the original toxicity estimates (NOECs or BEC10s) showed that the IC10 values were more similar to the NOEC values than the BEC10 values, and were less conservative than the BEC10 values (regression details not shown here).
0 Physico-chemical influences on U toxicity to M. macleayi could not be explored due to the lack of (i) reported physico-chemical data, and (ii) studies specifically addressing such effects.
43

Towards revising the Limit for uranium in Magela Creek: standardisation of toxicity data and incorporation of the effect of dissolved organic carbon (RA van Dam, AJ Harford, MA Trenfield, AC Hogan, SJ Markich & JL Stauber)
The 95% CLs for the IC10 values were often quite wide and, in a number of cases, the lower 95% CL was not calculable (Table 1). This uncertainty can be primarily attributed to relatively high variability observed between concentrations in the vicinity of the low effect estimates. Additionally, a few of the original experiments were not specifically designed for the purpose of concentration-response modelling and, hence, included too few concentrations to enable a robust estimate of low effect concentrations.
Of the mix of water quality variables examined, DOC was consistently the best predictor variable for the IC10 and IC50 datasets for the algae and hydra (ie DOC versus IC10: Chlorella spp – r2 = 0.68, P <0.001; H. viridissima – r2 = 0.48, P = 0.004; DOC versus IC50: Chlorella spp – r2 = 0.74, P <0.001; H. viridissima – r2 = 0.59, P <0.001). For the IC50 datasets only, water hardness was also a significant predictor variable, with models incorporating both DOC and water hardness explaining approximately an additional 10% of the variation in the IC50 values (ie DOC and hardness versus IC50: Chlorella spp – r2 = 0.82; H. viridissima – r2 = 0.72). Alkalinity and pH were not significant predictor variables although are known to play a role in U speciation and, potentially, toxicity (Markich 2002). More studies, particularly focusing on pH, are needed.
Given the strength of the association between DOC and U toxicity, focus was placed on the derivation of an algorithm to adjust U hazard estimates as a function of aquatic DOC concentrations. To do this, linear regressions were performed on DOC versus IC50/LC50 datasets for all four species for which the influence of DOC on U toxicity has been assessed (ie Chlorella sp 1, H. viridissima, Velesunio angasi and Mogurnda mogurnda). Uranium IC50/LC50 data were first normalised by expressing them as the proportional reduction in IC50/LC50 from the background (<0.1 mg/L) DOC level IC50/LC50. The regression slopes were similar, between 0.1 and 0.3, for most of the species (Table 2). The exception was for Chlorella sp 1, as assessed by Trenfield et al (2011), where the slopes were markedly higher (0.69 and 1.3), indicating a stronger effect of DOC on U toxicity to this species in this study. The pooled (geometric) mean slope for all the species was 0.22.
A slope for the DOC versus U toxicity relationship was also calculated using the pooled dataset for all four species (Table 2). However, the relationship was relatively poor (r2 = 0.45), and the resultant slope of 0.4, when compared with the individual species’ slopes, clearly represented an overestimate of the protective effects of DOC on U toxicity for at least three of the four species. Consequently, the regression was repeated for a censored pooled dataset that excluded the Chlorella sp 1 data from Trenfield et al (2011), which had the unusually high slopes. The resultant regression model (Table 2) represented a much stronger fit (r2 = 0.75), and the slope of 0.24 was very similar to the pooled (geometric) mean slope. Therefore, a final slope of 0.23 was derived, representing the mean of the pooled (geometric) mean slope of the individual species (0.22) and the censored pooled dataset slope (0.24).
44

Towards revising the Limit for uranium in Magela Creek: standardisation of toxicity data and incorporation of the effect of dissolved organic carbon (RA van Dam, AJ Harford, MA Trenfield, AC Hogan, SJ Markich & JL Stauber)
Table 1 Physico-chemical and original and re-calculated uranium toxicity data for Chlorella sp 1 and 2 (based on 72-h cell division rate)
Original study pH Hardness (mg/L as CaCO3)
Alkalinity (mg/L as CaCO3)
Dissolved organic carbon
(mg/L)
Temp. (C)
Original toxicity measures
(g U/L)
Re-calculated toxicity measures
(95% CLs) (g U/L)
Model type1 (r2, n, P)
Nil/low effect IC50 IC10 IC50
Chlorella sp 1
Franklin et al (2000) 5.7 3.9 2.62 0 27 21 (BEC10) 78 45 (35-55) 87 (82-92) 3-p sig (0.976, 21, <0.0001)
6.5 3.9 2.62 0 27 11 (BEC10) 44 15 (10-20) 48 (41-55) 3-p log (0.961, 25, <0.0001)3
Hogan et al (2005) 6.5 3.6 2.62 0 29 38 (NOEC) 74 52 (38-64) 74 (65-91) 3-p log (0.920, 24, <0.0001)
6.74 4.1 11 4.1 29 150 (NOEC) 177 135 (120-148) 176 (168-185) 3-p log (0.926, 24, <0.0001)3
6.34 3.2 nr (low)5 3.4 29 109 (NOEC) 166 134 (130-140) 161 (156-166) 3-p log (0.995, 21, <0.0001)3
6.54 4.7 7 8.1 29 157 (NOEC) 238 176 (169-190) 237 (233-242) 3-p sig (0.963, 24, <0.0001)
6.54 nr (low) <5 2.6 29 72 (NOEC) 137 100 (89-108) 134 (130-140) 3-p sig (0.985, 21, <0.0001)6
Trenfield et al (2011) 6.2 3.6 4.1 0 28.5 nr 38 14 (nc7-23) 38 (32-43) 3-p sig (0.943, 12, <0.0001)
6.2 3.6 4.1 1.0 28.5 nr 124 58 (nc-90) 98 (68-123) 3-p log (0.694, 12, 0.0020)
6.2 3.6 4.1 5.1 28.5 nr 256 129 (nc-173) 237 (215-259) 3-p sig (0.931, 12, <0.0001)
6.2 3.6 4.1 10.2 28.5 nr 468 196 (nc-278) 396 (323-487) 3-p log (0.891, 12, <0.0001)
6.2 3.6 4.1 20.4 28.5 nr 744 197 (nc-400) 515 (310-726) 3-p log (0.699, 12, 0.0018)
6.0 4.6 4.5 0 28.5 nr 13 3.8 (nc-7.3) 11 (7.5-11) 3-p log (0.921, 10, <0.0001)
6.0 4.6 4.5 1.0 28.5 nr 35 18 (16-20) 34 (33-35) 3-p log (0.997, 10, <0.0001)
6.0 4.6 4.5 4.7 28.5 nr 82 57 (45-66) 80 (75-86) 3-p log (0.977, 10, <0.0001)
6.0 4.6 4.5 9.5 28.5 nr 150 108 (88-127) 149 (136-159) 3-p log (0.978, 10, <0.0001)
Chlorella sp 2
Charles et al (2002) 7.0 8 8 <0.2 27 0.7 (BEC10) 56 9 (nc-33) 66 (29-108 3-p log (0.901, 10, 0.0001)
7.0 40 8 <0.2 27 0.7 (BEC10) 72 11 (nc-19) 74 (55-103) 3-p log (0.960, 10, <0.0001)
7.0 100 8 <0.2 27 2.3 (BEC10) 150 32 (nc-79) 137 (77-205) 3-p log (0.889, 10, 0.0002)
7.0 400 8 <0.2 27 4.5 (BEC10) 270 61 (nc-141) 220 (125-303) 3-p log (0.895, 10, <0.0001)
1 Model type: 3-p log – 3-parameter logistic; 3-p sig – 3-parameter sigmoid; 2 Based on reported nominal concentration of HCO3- in the test medium; 3 Assumption of homoscedasticity not met;
4 Represents mid-point of a reported range; 5 nr (low): not reported, but known to be low in value; 6 Assumptions of normality and homoscedasticity not met; 7 nc: not calculable.
45

Towards revising the Limit for uranium in Magela Creek: standardisation of toxicity data and incorporation of the effect of dissolved organic carbon (RA van Dam, AJ Harford, MA Trenfield, AC Hogan, SJ Markich & JL Stauber)
Table 2 Regression statistics for linear regressions of dissolved organic carbon (DOC; mg/L) versus the proportion reduction in IC50/LC50 value
Species Study n Slope r2 P value
Chlorella sp 1 Hogan et al (2005) 5 0.30 0.95 0.003
Trenfield et al (2011) – SRFA1 5 0.69 0.86 0.014
Trenfield et al (2011) – SBW DOC2 4 1.3 0.99 0.0033
Geometric Mean 0.65
Hydra viridissima Trenfield et al (2011) – SRFA 5 0.35 0.95 0.003
Trenfield et al (2011) – SBW DOC 4 0.14 0.99 <0.0013
Geometric Mean 0.22
Velesunio angasi Markich et al (2000) – pH 5.0 3 0.11 0.87 0.173
Markich et al (2000) – pH 5.5 3 0.21 0.89 0.153
Markich et al (2000) – pH 6.0 3 0.10 0.97 0.083
Geometric Mean 0.13
Mogurnda mogurnda Trenfield et al (2011) – SRFA 5 0.19 0.99 <0.001
Trenfield et al (2011) – SBW DOC 4 0.08 0.97 0.0113
Geometric Mean 0.12
Pooled Geometric mean 0.22
All species / data 41 0.40 0.45 <0.0013
All species / data except Trenfield et al (2011) Chlorella sp. 1 data 32 0.24 0.74 <0.0013
1 SRFA: Suwannee River fulvic acid; 2 SBW DOC: Sandy Billabong water dissolved organic carbon; 3 Assumption of homoscedasticity not met.
As the toxicity data were presented as a proportional reduction in toxicity, the final slope factor can be interpreted to signify that the toxicity of U will decrease by 23% for every 1 mg/L increase in DOC concentration (over the range 0–20 mg/L). Using this relationship, U toxicity (eg. in the form of an IC10 or IC50 value) to a freshwater species can be adjusted according to the aquatic DOC concentration of interest, using the following equation:
U toxf = U toxi / (1 + DOCi * 0.23) * (1 + DOCf * 0.23) (1)
where U toxf is the final adjusted U toxicity (eg in the form of an IC10 or IC50 value) in µg/L, U toxi is the corresponding initial toxicity value in µg/L, DOC i is the DOC concentration in mg/L at which U toxi was calculated, and DOCf is the aquatic DOC concentration of interest in mg/L.
A next step will be to revise existing site-specific (Hogan et al 2003) and default Australia and New Zealand U water quality guidelines (ANZECC & ARMCANZ 2000) to enable adjustment based on aquatic DOC concentration. To achieve this, the guidelines can be derived at a standard DOC concentration of 0 mg/L and accompanied by the following algorithm:
DOC modified guideline value (DOCMGV) = GV0 + (GV0 * DOCf * 0.23) (2)
where GV0 is the guideline value at 0 mg/L DOC and DOC f is the aquatic DOC concentration of interest.
46

Towards revising the Limit for uranium in Magela Creek: standardisation of toxicity data and incorporation of the effect of dissolved organic carbon (RA van Dam, AJ Harford, MA Trenfield, AC Hogan, SJ Markich & JL Stauber)
Steps for completionThe next step is to correct existing U toxicity data to a DOC of 0 mg/L for species where such data do not already exist. Following this, a U trigger value at 0 mg/L DOC will be derived, for which the above equation (2) will be applicable. A new U trigger framework for Magela Creek will then be able to be developed, which incorporates the DOC concentration prevailing at the time that a U concentration value is measured. It should be noted that the application of the DOC algorithm will be of most use in relation to the derivation of U surface water closure criteria for mine-impacted billabongs (eg. Coonjimba, Georgetown Billabongs, and any on-site sentinel wetlands), where DOC concentrations will at times be substantially higher than in the stream channel.
ReferencesANZECC & ARMCANZ 2000. Australian and New Zealand guidelines for fresh and marine
water quality. National Water Quality Management Strategy Paper No 4, Australian and New Zealand Environment and Conservation Council & Agriculture and Resource Management Council of Australia and New Zealand, Canberra.
Charles A, Markich S, Stauber J & de Filippis L 2002. The effect of water hardness on the toxicity of uranium to a tropical freshwater alga (Chlorella sp). Aquat Toxicol 60, 61–73.
Franklin NM, Stauber JL, Markich SJ & Lim RP 2000. pH-dependent toxicity of copper and uranium to a tropical freshwater alga (Chlorella sp). Aquat Toxicol 48, 275-289.
Hogan AC, van Dam RA, Markich SJ & Camilleri C 2003. Chronic toxicity of uranium to the tropical green alga Chlorella sp. for the derivation of a site specific Trigger Value for Magela Creek. Internal Report 412, December, Supervising Scientist, Darwin. Unpublished paper.
Hogan AC, van Dam RA, Markich SJ & Camilleri C 2005. Chronic toxicity of uranium to a tropical green alga (Chlorella sp) in natural waters and the influence of dissolved organic carbon. Aquat Toxicol 75, 343–353.
Hoekstra JA & van Ewijk PH 1993. The bounded-effect-concentration as an alternative to the NOEC. Sci Total Environ Supplement 705, 711.
Hyne RV, Rippon GD & Ellender G 1992. pH-dependent uranium toxicity to freshwater hydra. Sci Total Environ 125, 159–173.
Hyne RV, Padovan A, Parry DL & Renaud SM 1993. Increased fecundity of the cladoceran Moinodaphnia macleayi on a diet supplemented with a green alga, and its use in uranium toxicity tests. Aust J Mar Fresh Res 44, 389–399.
Markich SJ 2002. Uranium speciation and bioavailability in aquatic systems: An overview. Sci World J 2, 707–729.
Markich SJ & Camilleri C 1997. Investigation of metal toxicity to tropical biota: Recommendations for revision of the Australian water quality guidelines. Supervising Scientist Report, Supervising Scientist, Department of Sustainability, Environment, Water, Population and Communities, Darwin, Australia.
Markich SJ, Brown PL, Jeffree RA & Lim RP 2000. Valve movement responses of Velesunio angasi (Bivalvia: Hyriidae) to manganese and uranium: an exception to the free ion activity model. Aquat Toxicol 51, 155–175.
47

Towards revising the Limit for uranium in Magela Creek: standardisation of toxicity data and incorporation of the effect of dissolved organic carbon (RA van Dam, AJ Harford, MA Trenfield, AC Hogan, SJ Markich & JL Stauber)
Riethmuller N, Markich S, Parry D & van Dam R 2000. The effect of true water hardness and alkalinity on the toxicity of Cu and U to two tropical Australian freshwater organisms. Supervising Scientist Report 155. Supervising Scientist, Department of Sustainability, Environment, Water, Population and Communities, Darwin, Australia.
Semaan M, Holdway DA & van Dam R 2001. Comparative sensitivity of three populations of the cladoceran Moinodaphnia macleayi to acute and chronic uranium exposure. Environ Toxicol 16, 365–376.
Trenfield MA, Ng JC, Noller BN, Markich SJ & van Dam RA 2011. Dissolved organic carbon reduces uranium bioavailability and toxicity. 2. Uranium[VI] speciation and toxicity to three tropical freshwater organisms. Environ Sci Technol 45, 3082–3089.
48

Toxicity of uranium to Euglena gracilis and the influence of DOC
MA Trenfield, JC Ng0, B Noller0, SJ Markich0 & RA van Dam
BackgroundAlthough a considerable amount of data exist for the toxicity of uranium (U) to aquatic biota, there is only sparse information regarding the mechanisms of U toxicity. The limited published material indicates that U can inhibit ATPase and induce oxidative stress in animal tissue (Ribera et al 1996, Barillet et al 2007, Periyakaruppan et al 2007) and may disrupt gill, muscle and gonadal tissue in fish (Barillet et al 2010). Induction of reactive oxygen species (ROS) in lung cells of rats (Periyakaruppan et al 2007) and in fish exposed to U (Barillet et al 2007) has been linked to the failure of cellular antioxidant mechanisms that normally act to suppress a rise in oxidative species.
The unicellular eukaryote Euglena gracilis is found commonly in freshwaters worldwide and grows optimally at 20–30C. Euglena gracilis is known to be sensitive to metal contaminants (Hg, Cd, Cr, Ni; Gadjdosova and Reichrtova 1996) and can be an effective biological model for the study of metal toxicity in eukaryotic cells (Einicker-Lamas et al 2002; Watanabe & Suzuki 2002). With its highly developed subcellular organelles being equivalent to those of higher plants (Watanabe & Suzuki 2002), the photosynthetic Z strain of E. gracilis can be used to provide insight into the mechanisms of, and influences on, U toxicity in higher plants. However, much of the research with Euglena has been conducted in nutrient-enriched growth media that bear little resemblance to natural waters. Hence, the associated toxicity data are not useful for predicting environmental effects in natural media. This study aimed to:
i Optimise an existing Euglena toxicity test method to make it more environmentally relevant;
ii Assess the influence of dissolved organic carbon (DOC) on the toxicity and speciation of U to E. gracilis in a soft, acidic, low-nutrient medium; and
iii Undertake a preliminary investigation into the influence of U on the generation of ROS in E. gracilis.
MethodsEuglena gracilis culture and development of low nutrient test mediumEuglena gracilis (Z strain) was cultured in Koren Hutner (KH; Koren & Hutner 1967) medium at pH 6 ± 0.1, 28±1°C and with a 12:12h day/night cycle (36 W cool white triphosphor lighting; 100-140 µmol m-2s-1). KH medium is a high nutrient medium with a high DOC concentration (10 g L-1), containing elevated levels of glucose and organic acids, which can potentially bind metals and reduce their toxicity to test organisms. Exposure trials were conducted with the aim of establishing a test medium that was more environmentally relevant (ie less nutrient-rich), but
0 The University of Queensland, National Research Centre for Environmental Toxicology, Coopers Plains, Queensland, 4108, Australia
0 The University of Queensland, Centre for Mined Land Rehabilitation, St Lucia, Queensland, 4067, Australia0 Aquatic Solutions International, Dundas, New South Wales, 2117, Australia

Toxicity of uranium to Euglena gracilis and the influence of DOC (MA Trenfield, JC Ng B Noller, SJ Markich & RA van Dam)
which still supported a suitable growth rate of E. gracilis (ie 0.4 ± 0.2 doublings d-1). Media containing minimal concentrations of a single carbon source, such as glucose or citric acid, in addition to vitamin B1 and B12 (essential for growth of E. gracilis) were trialled (Table 1) following the test procedure outlined below. 2-N-morpholinoethanesulfonic acid sodium salt (MES) buffer was used to maintain the test media at pH 6.0 ± 0.1, as this buffer is considered to have minimal binding to metals (Good et al 1966), and was predicted (by speciation modeling) to have negligible binding to U (<0.2% of U).
General toxicity test methodA standard number of E. gracilis cells (1 104 cells mL-1; in 5 ml) was exposed to a control (1 µg L-1 U) or one of six U concentrations in 150 µM aspartic acid medium for 96 h at 28 ± 1C. Tests were conducted using exponentially growing cells from a 4-day old culture (density ~3 105 cells mL-1). Prior to testing, cells were rinsed twice in aspartic acid medium (pH 6 ± 0.15 and 28 ± 1C) and concentrated using centrifugation (780 g for 1 minute) in order to remove the nutrient-enriched KH culture medium. Growth of E. gracilis was measured by counting cells at 48 h and 96 h using a compound microscope (160× mag) and calculating the cell division rate (growth rate – doublings d-1) using linear regression analysis. Growth rates of E. gracilis exposed to U were expressed as a percentage of the control growth rate. A test was considered valid if the cell division rate in controls was 0.4 0.2 doublings d-1, with CV of less than 20%.
Euglena gracilis was tested on three separate occasions at a range of U concentrations in the unmodified test medium, and then on two separate occasions in medium containing 20 mg L-1
DOC (as Suwannee River Fulvic Acid). Uranium concentration ranges of up to 7 mg L-1 were selected in order to obtain a full toxic response for E. gracilis. Uranium adsorbed to/taken up by E. gracilis was measured in each medium at 24, 48 and 96 h. The difference in the response of growth rate to U between the unmodified medium and medium containing additional DOC was analysed using an ANCOVA (α = 0.05; Minitab 16.0).
Detection of reactive oxygen speciesOn two separate occasions, following exposure to U for 96 h, controls and various U treatments were selected to assess E. gracilis for oxidative stress. Dihydrofluorescein diacetate (HFLUOR-DA also known as CM-H2DCFDA) was used as the probe for detecting the presence of intracellular oxidants. The method used to detect ROS was adapted from manufacturer guidelines (Invitrogen 2006) and previous work (Watanabe & Suzuki 2002; Periyakaruppan et al 2007). Briefly, E. gracilis cells were exposed to the probe for 1 h at ~28C in the dark. A positive control (consisting of organisms pre-exposed to 0.1 mM H2O2) confirmed the CM-H2DCFDA was effective in detecting ROS in E. gracilis. A Leica Letiz Laborlux S fluorescence microscope with an I2 filter cube (450-490 nm excitation wavelength and 505 nm emission) was used to observe the fluorescence of the fluorescein dye. Photographic images were captured with a Canon Powershot S70 camera.
Table 1 Various test media trialled for 96 h uranium exposures with Euglena gracilis at pH 6
Medium 1.5% KHa 0.5% KHa 333 M Glucoseb 150 M Aspartic acidc
DOC (mg L-1)d 150 55 60 10
IC50 (µg L-1 U)e 8900 3500 >4000 300
Control doublings d-1 f 1.2 (1.1-1.3) 0.70 (0.60-0.80) 0.60 (0.45-0.70) 0.55 (0.54-0.56)
a KH: Koren Hutner medium diluted with milli-Q and 2.5 mg L-1 Vit B1 and 0.005 mg L-1 Vit B12 added, b Medium contained 60 mg L-1 glucose, 10 mg L-1 NH4CO3, 10 mg L-1 KH2PO4, 2.5 mg L-1 Vit B1 and 0.005 mg L-1 Vit B12, c Medium ingredients shown in Table 2, d DOC: dissolved organic carbon prior to addition of MES buffer, e IC50: U concentration at which there was 50% reduction in growth over 96 h, representing total U unadjusted for adsorption to glass test tubes, f Mean (range) 96 h doublings, n=2
50

Toxicity of uranium to Euglena gracilis and the influence of DOC (MA Trenfield, JC Ng B Noller, SJ Markich & RA van Dam)
ResultsTable 1 shows the growth rates and sensitivity of E. gracilis to U (IC50) for each medium tested and DOC content. Growth rates were acceptable across all media (ie 0.4 ± 0.2 doublings d-1). The DOC concentration was lowest, and U toxicity highest, in the aspartic acid medium. Aspartic acid medium was predicted (through speciation modelling, HARPHRQ) to have minimal complexation with U (complexing ~6-36% of U over the total U range 0.03–7 mg L-1) and was selected as the test medium (Table 1). The use of this medium is of significance as it means the U toxicity data from this study can be considered to have environmental relevance.
A concentration of 57 µg L-1 U (95% CLs: 40–82 µg L-1 U) resulted in 50% inhibition of growth (IC50) of E. gracilis in the background aspartic acid medium (Figure 1, Table 2). However, as little as 5 µg L-1 U (95% CLs: 1–12 µg L-1 U) resulted in a 10% decline in growth (IC10). In background medium, growth was completely inhibited at ~ 700 µg L-1 U. The sensitivity of E. gracilis to U appeared to be equivalent to that of the most sensitive species previously studied (sub-lethal IC50s range from 30–1200 µg L-1 U for a cladoceran, green alga, fish, hydra and mussel species; Markich et al 2000; Hogan et al 2005; Zeman et al 2008; Trenfield et al 2011) under similar physicochemical conditions.
In the presence of 20 mg L-1 DOC, which is typical of higher DOC concentrations found in floodplain environments, there was a marked reduction in U toxicity to E. gracilis (Figure 1), with the IC50 of E. gracilis increasing 4 to 5-fold to 254 µg L-1 U (95% CLs: 100-670 µg L-1
U). The IC10 increased 3 to 4-fold from that of the background medium; 17 µg L-1 U (95% CLs: 1–77 µg L-1 U). An ANCOVA found there to be a significant difference in the (ln) growth rate response of E. gracilis (growth rate) to U between the unmodified medium and medium containing additional DOC (p < 0.0001).
a) Background medium
Uranium (g L-1)
0 200 400 600 800
Perc
enta
ge g
row
th ra
te (a
s %
of c
ontr
ol)
0
20
40
60
80
100 b) 20 mg L-1 DOC (as SRFA)
Uranium (g L-1)
0 2000 4000 6000
Perc
enta
ge g
row
th ra
te (a
s %
of c
ontr
ol)
0
20
40
60
80
100
Figure 1 Concentration response plots for Euglena gracilis exposed to uranium (0.45 µm filtered) for 96-h in a) 150 M aspartic acid medium at background dissolved organic carbon (DOC: 10 mg L-1) and
b) medium containing an additional 20 mg L-1 DOC (as Suwannee River fulvic acid - SRFA). Curves represent 3-parameter logistic fits with 5 pooled tests for background DOC (r2 = 0.84, n = 27, p<0.0001) and 2 pooled tests for 20 mg L-1 DOC (r2 = 0.75, n = 14, p = 0.0001). Each point is the mean ± standard
error of 2 replicates.
The proportions of the major U species predicted to be present at the IC50 concentration for each of the DOC treatments are shown in Table 2. Of the total added U, 84% (the equivalent of ~160 µg L-1 U) was predicted to complex with FA in the presence of 20 mg L -1 SRFA. Speciation calculations show a 6 to 7-fold decrease in the proportion of inorganic U species with the addition of SRFA. The similarity in concentration of UO2
2+ present at the IC50
51

Toxicity of uranium to Euglena gracilis and the influence of DOC (MA Trenfield, JC Ng B Noller, SJ Markich & RA van Dam)
concentration in the presence and absence of SRFA (2.2 µg L-1 and 3.1 µg L-1 respectively, Table 2), provided support that toxicity is linked to this U species, in particular, and that the amelioration of toxicity is a result of complexation of U by SRFA. This reduction in the toxicity of U corresponded with a decrease in the cellular uptake/adsorption of U by 11-to 14-fold, as measured by the U bound by the cell mass during the test.
Stepwise multiple linear regression analyses, incorporating the inorganic U species shown in Table 2, indicated that only UO22+ had a significant (p≤0.01) relationship with E. gracilis growth, explaining 51% of the variation in U toxicity. By comparison, total U explained 38% of U toxicity.
Based on the response using CM-H2DCFDA as the probe, cells did not appear to exhibit any fluorescence (oxidative stress) until they were exposed to U concentrations of 60 µg L -1 or greater. Generally, the proportion of fluorescing cells was quite low even in treatments where cell proliferation had ceased. For example, at 1 mg L-1 U (in medium without SRFA), only 23% of cells exhibited fluorescence.
ConclusionsE. gracilis is relatively sensitive to uranium and the addition of 20 mg L-1 DOC (as SRFA) reduced the toxicity of U to E. gracilis by three- to five-fold. This reduction in toxicity was linked to the majority of U in the 20 mg L-1 DOC (as SRFA) medium being complexed by SRFA. The concentration of free UO22+ ion provided the best relationship with toxicity (r2 = 0.51). While exposure to ≥ 60 µg L-1 U induced oxidative stress in E. gracilis, this was not considered to be a sensitive endpoint. This suggests U toxicity to E. gracilis may not be primarily related to oxidative stress.
Steps for completionThis work has been completed and accepted for publication Jan 2012 in Ecotoxicology DOI: 10.1007/s10646-012-0855-x
Table 2 Predicted speciation and toxicity (IC50) of uranium (U) to E. gracilis in background medium (150 µM aspartic acid) and medium containing dissolved organic carbon (DOC) in the form of Suwannee River Fulvic acid (SRFA). Species comprising <1% of total U have been excluded for clarity.
Unmodified mediuma Medium + 20 mg L-1 DOC
DOC (mg L-1) 10 30
IC50 (µg L-1 U)b 57 254
Speciation (% of total U)
UO22+ 5.5 <1.0
UO2OH+ 32 5.0
UO2(OH)2 3.6 <1.0
UO2SO4 8.8 1.4
UO2HPO4 6.0 1.0
UO2ASP 7.3 1.2
UO2OHASP 32 5.1
UO2SRFA nac 84
a See Table 2 for details of medium compositionb U concentration at which there was 50% reduction in growth of E. gracilis over 96 hc na: Not applicable
52

Toxicity of uranium to Euglena gracilis and the influence of DOC (MA Trenfield, JC Ng B Noller, SJ Markich & RA van Dam)
ReferencesBarillet S, Adam C, Palluel O & Devaux A 2007. Bioaccumulation, oxidative stress, and
neurotoxicity in Danio rerio exposed to different isotopic compositions of uranium. Environ Toxicol Chem 26, 497–505
Barillet S, Larno V, Floriani M, Devaux A & Adam-Guillermin C 2010. Ultrastructural effects on gill, muscle, and gonadal tissues induced in zebrafish (Danio rerio) by a waterborne uranium exposure. Aquatic Toxicology 100, 295–302
Einicker-Lamas M, Soares MJ, Soares MS & Oliveira MM 1996. Effects of cadmium on Euglena gracilis membrane lipids. Braz J Med Biol Res 29, 941–948
Hogan AC, van Dam RA, Markich SJ & Camilleri C 2005. Chronic toxicity of uranium to a tropical green alga (Chlorella sp.) in natural waters and the influence of dissolved organic carbon. Aquatic Toxicology 75, 343–353.
Invitrogen 2006. Reactive Oxygen Species (ROS) Detection Reagents. Available at: http://probes.invitrogen.com/media/pis/mp36103.pdf. Accessed Jan 2011
Koren LE & Hutner SH 1967. High-yield media for photosynthesizing Euglena gracilis Z. J. Protozool. (suppl.) 14, 17.
Markich SJ, Brown PL, Jeffree RA & Lim RP 2000. Valve movement responses of Velesunio angasi (Bivalvia: Hyriidae) to manganese and uranium: an exception to the free ion activity model. Aquatic Toxicology 51, 155–175.
Periyakaruppan A, Kumar F, Sarkar S, Sharma CS & Ramesh GT 2007. Uranium induces oxidative stress in lung epithelial cells. Archives of Toxicology 81, 389–395.
Ribera D, Labrot, F, Tisnerat G & Narbonne JF 1996. Uranium in the environment: occurrence, transfer and biological effects. Rev. Environ Contamin Toxicol 146, 53–89.
Trenfield MA, Ng JC, Noller BN, Markich SJ & van Dam RA 2011. Dissolved organic carbon reduces uranium bioavailability and toxicity. 2. Uranium[VI] speciation and toxicity to three tropical freshwater organisms. Environ Sci Technol 45, 3082–3089.
Watanabe M, Suzuki T 2002. Involvement of reactive oxygen stress in cadmium-induced cellular damage in Euglena gracilis. Comp Biochem Phys C 131, 491–500.
Zeman FA, Gilbin R, Alonzo F, Lecomte-Pradines C, Garnier-Laplace J, Aliaume C 2008. Effects of waterborne uranium on survival, growth, reproduction and physiological processes of the freshwater cladoceran Daphnia magna. Aquatic Toxicology 86, 370–378.
53

KKN 1.3.1 Surface water, groundwater, chemical, biological, sediment, radiological monitoring
Recent developments in Magela Creek solute loads
K Turner, DR Jones & WD Erskine
The Supervising Scientist Division (SSD) undertakes comprehensive water quality monitoring to ensure the protection of the Ramsar-listed Magela Creek wetlands and the people living semi-traditional livelihoods, downstream of the Ranger uranium mine (RUM). This leading practice program has been developed over a number of years, progressively incorporating improved methods and state-of-the-art technology. The most recent improvement has involved the implementation of routine continuous water quality monitoring. During the five year period of development of this method (Turner et al 2008, Turner & Jones 2009, 2010, Frostick et al 2011) there was regular engagement with stakeholders to communicate the results, and to develop a shared understanding of the power of continuous monitoring compared with discrete, weekly grab sampling. Starting with the 2010–11 wet season, continuous monitoring, incorporating event-based collection of water samples (fully automated using programmed pump samplers), has replaced grab sampling as the primary method of measuring water quality in Magela and Gulungul Creeks. The validated monitoring data are posted weekly in arrears on the SSD website for viewing by both stakeholders and the general community.
As well as providing primary water quality data (electrical conductivity, turbidity and pH) in Magela and Gulungul Creeks for impact assessment and community assurance purposes, the continuous monitoring data have been used to develop an annual mine ‘solute budget’ (Turner & Jones 2009, 2010). In principle, this enables tracking and comparison from one year to the next of annual solute loads transported by Magela Creek upstream and downstream of the mine, allowing an assessment of the annual performance of the site’s mine water management system. The calculation of a robust and internally consistent solute budget depends on detailed analysis of the data from SSD’s upstream and downstream monitoring stations, used in conjunction with data from sites that are monitored by ERA.
The anabranching Magela Creek channel (Nanson et al 1993) splits into three channels a short distance upstream of the location of SSD’s downstream site, with SSD’s monitoring station being located on the west anabranch. The west anabranch receives flow at all times with the central and east anabranches conveying water only during medium to high flows. Over the last three wet seasons the issue of flow splitting was systematically addressed by carrying out a number of stream gauging measurements to determine the relationship between total stream discharge and that which is conveyed by the west anabranch in which SSD’s monitoring pontoon is located.
Unfortunately at the time of writing this report, SSD had not received the required on-site tributary data from ERA. As a result, reporting of the most recent solute loads from the mine site itself, and comparison with previous years, will not be able to be completed until 2012. This update will therefore focus on the overall solute loads transported by Magela Creek, with comparison between the total loads upstream and downstream of the mine.

Recent developments in Magela Creek solute loads (K Turner, DR Jones & WD Erskine)
Electrical conductivity – magnesium relationshipsRelationships between electrical conductivity (EC) and magnesium (Mg) in Magela Creek have been derived by correlating Mg concentrations in grab water samples with concurrent measurements of in situ EC. Such relationships and the technical rationale for them have been reported previously for the upstream (MCUGT) and downstream (MCDW) sites on Magela Creek (Supervising Scientist 2009). See Map 2 for the locations of these sites.
The previously reported relationships between EC and Mg have been revised by adding the most recent data from the 2009–10 and the 2010–11 wet seasons. A quadratic relationship was reported previously for MCDW (Turner & Jones 2010). However, with the addition of the data from the more recent wet seasons the relationship is now better defined by a linear equation (Figure 1). This change in the relationship is due to the increased number of samples collected during high EC (and hence high Mg) events since the introduction of event-based automatic sampling, increasing the number of points in the upper end of the relationship where EC > 50 µS/cm. The relationship in Figure 1 for MCUGT is similar to that reported previously.
Figure 1 Best fit relationships between electrical conductivity (EC) and magnesium (Mg) concentration for the upstream (R2 = 0.84, P<0.0001) and downsteam (R2 = 0.96, P<0.0001) monitoring stations on
Magela Creek, with the upper and lower 95% confidence limits shown
The uniform distribution of the residuals about the linear regression equation supports the use of the linear relationship for estimating Mg concentrations at the downstream site (Figure 2). The updated relationships shown in Figure 1 have been used to re-derive Mg concentration data from the continuous EC data measured at MCUGT (upstream) and MCDW (downstream) for all wet seasons between 2005–06 and 2010–11.
55

Recent developments in Magela Creek solute loads (K Turner, DR Jones & WD Erskine)
Figure 2 Residual plot for the relationship between electrical conductivity (EC) and magnesium (Mg) for the downstream site on Magela Creek. Least squares linear regression equation is y = 0.083x – 0.47.
Magnesium loadsPreviously, Mg loads downstream of the mine have been calculated using the continuous Mg concentration data estimated at MCDW and the total flow discharge (Q) for Magela Creek measured at the G8210009 gauging station (located ~400 m upstream of MCDW) The approach is described in detail in the Supervising Scientist annual report for 2008–09 (Supervising Scientist 2009). However, this method overestimates the actual Mg load at the downstream site because it assumes that the EC measured in the western anabranch at the MCDW site is the same across the three anabranches, independent of flow conditions. This is incorrect, because the EC in the western anabranch is higher compared with the other two anabranches as a result of solutes from the minesite, which is located on the western side of Magela Creek, being preferentially conveyed down the west anabranch, especially by low flows. To more accurately calculate Mg load downstream of the minesite, the relative proportions of solutes and total stream discharge passing through each anabranch at the MCDW site at any given stream height must be determined.
The EC in each anabranch (eastern, central and western) at the cross section at G8210009 was measured during the 2010–11 wet season by ERA, using continuous monitoring stations deployed in each anabranch. The hourly mean EC values for each anabranch at the downstream site and for the Magela Creek upstream site ( MCUGT) for reference, are plotted against hourly mean discharge values measured at G8210009 (Figure 3).
Figure 3 shows that the EC in the eastern anabranch is equivalent to the upstream EC under all flow conditions, with the high EC events (> 20µS/cm) being confined to the central and western anabranches. These higher EC events only occur when the total stream discharge measured at G8210009 is < 200 m3/s which is greater than bankfull discharge (Nanson et al 1993). At higher discharges, the EC in each anabranch moves towards values that are measured at the upstream site. This is largely due to the fact that mine inputs to Magela Creek occur via Coonjimba and Georgetown creeks which become backwater affected during high flows in the main channel, effectively restricting outflow of higher EC mine-derived water from the tributaries (see Supervising Scientist 2009).
56

Recent developments in Magela Creek solute loads (K Turner, DR Jones & WD Erskine)
Figure 3 Plots showing mean hourly electrical conductivity for Magela Creek upstream (grey) and downstream sites (east, central and western anabranches at G821009, black) versus mean hourly
discharge measured at G8210009. The dotted line indicates an EC value of 20µS/cm.
The proportion of the total stream discharge conveyed by the western anabranch at MCDW can be determined using the relationship between the discharge measured in the west anabranch alone and the total discharge measured concurrently at G8210009. These relationships for the 2008–09, 2009–10 and 2010–11 wet seasons are shown in Figures 4a, b and c, respectively. The data from the three wet seasons were combined to derive an average relationship (Figure 4d) which can be used to estimate the west anabranch discharge as a function of total flow for seasons prior to 2008–09.
Figure 4 Discharge (Q) in m3/s measured in the western anabranch at MCDW versus total Magela Creek discharge measured at G8210009 for the 2008–09 (a), 2009–10 (b), and 2010–11 (c) wet seasons with the
averages for the three seasons plotted in (d). The dashed lines are confidence limits for the fitted relationship.
57

Recent developments in Magela Creek solute loads (K Turner, DR Jones & WD Erskine)
The data show that as the total Magela Creek discharge increases, the proportion of the discharge conveyed by the western anabranch at MCDW decreases exponentially (reported previously in Supervising Scientist 2009). This occurs due to the steep sloping west bank of Magela Creek compared with the very low slope towards the east bank allowing the majority of overbank flow to spread to the east for up to 1 km under high flow conditions.
The Mg loads since the 2005–06 wet season have been recalculated using a new method that takes into consideration the cross channel gradient in EC. The total Mg load at the downstream site is estimated by combining the Mg load transported in the western anabranch and the Mg load transported in the central and eastern anabranches. The western anabranch Mg load was calculated using the Mg concentrations derived from the MCDW continuous EC trace and the west channel discharge estimated using the equations in Figure 4. The Mg loads in the central and eastern anabranches were calculated by using the Mg concentrations derived from the upstream MCUGT EC data together with the residual discharge (ie total Magela Creek discharge measured at G8210009 minus the western anabranch discharge). It should be noted that this method will result in a slight underestimation of the total load conveyed by the central anabranch for discharges < 200 m3/s (see Figure 4). The newly derived loads are compared to loads calculated using the original method in Table 1.
These data suggest that over the past six wet seasons, between 30–40% of the total Mg load transported by Magela Creek has been contributed by the mine site and that this seasonal contribution has (in proportional terms) been consistent over the years. There is certainly no evidence of an increase through time in loads of Mg being exported from the mine site. The low difference value in 2008–09 was the result of a relatively low rainfall year, with reduced loads coming from both upstream, and from the mine site.
Table 1 Mg loads (t) measured in Magela Creek upstream and downstream of the Ranger mine
Loads calculated using the old method (overestimated)
Loads calculated using the new method (slightly underestimated)
Season Upstream
Downstream
Minesite contribution (%)
Downstream
Minesite contribution (%)
2005–06 184 404 +55% 274 +33%
2006–07 152 531 +71% 236 +36%
2007–08 150 364 +59% 244 +39%
2008–09 78 175 +55% 111 +30%
2009-10 131 276 +53% 194 +33%
2010–11 188 398 +53% 267 +30%
The improved method for determining the downstream Mg loads in Magela Creek produced lower annual load estimates compared with the method used previously. Whilst the actual seasonal Mg load at the downstream site will fall somewhere between the loads calculated using these two methods, this will not change the conclusion that there is no evidence for an increase in annual loads coming from the mine site over the past five years of the continuous monitoring record. Additional flow gaugings are needed at flow rates greater than 250 cumecs (greater than bankfull discharge) to reduce the uncertainty in the upper regions of the regressions used to estimate the contribution of the west anabranch at MCDW to the total discharge.
58

Recent developments in Magela Creek solute loads (K Turner, DR Jones & WD Erskine)
Summary and future workDuring the 2011 dry season, detailed cross section surveys of the channel will be carried out at both G8210009 and MCDW. These measurements will enable better characterisation of the distribution of flows between anabranches on Magela Creek under high flows. The ERA discharge and EC data for Georgetown and Coonjimba creeks have been sought. When received they will be used to independently derive the mine solute contribution to Magela Creek for each wet season over the past six years. These data will then be compared with the overall upstream/downstream differences reported in Table 1.
ReferencesFrostick A, Turner K, Tayler K & Jones D 2011. Water chemistry monitoring program. In
eriss research summary 2009–2010. eds Jones DR & Webb A, Supervising Scientist Report 202, Supervising Scientist, Darwin NT, 48–55.
Nanson GC, East TJ & Roberts RG 1993. Quaternary stratigraphy, geochronology and evolution of the Magela Creek catchment in the monsoon tropics of northern Australia. Sedimentary Geology 83, 277–302.
Supervising Scientist 2009. Annual Report 2008–2009. Supervising Scientist, Darwin.
Turner K & Jones D 2009. Development of Magela Catchment area solute budget using continuous monitoring systems. In eriss research summary 2007–2008. eds Jones DR & Webb A, Supervising Scientist Report 200, Supervising Scientist, Darwin NT, 75–85.
Turner K & Jones D 2010. Surface water transport of mine-related solutes in the Magela Creek catchment using continuous monitoring techniques. In eriss research summary 2008–2009. eds Jones DR & Webb A, Supervising Scientist Report 201, Supervising Scientist, Darwin NT, 58–65.
Turner K, Moliere D, Humphrey C & Jones D 2008. Continuous monitoring of water quality in Magela Creek. In eriss research summary 2006–2007. eds Jones DR & Webb A, Supervising Scientist Report 196, Supervising Scientist, Darwin NT, 37–42.
59

KKN 1.3.1 Surface water, groundwater, chemical, biological, sediment, radiological monitoring
Atmospheric radioactivity monitoring in the vicinity of Ranger and Jabiluka
C Doering, R Cahill, J Pfitzner & A Bollhöfer
IntroductionUranium mining has the potential to release radon (a radioactive gas) and particulate-bound radionuclides to the atmosphere at levels above the natural background through ground disturbance and other activities. The inhalation of radon decay products (RDP) in air and long-lived alpha activity (LLAA) radionuclides contained in or on dust contributes to the radiation dose received by the public in the vicinity of a uranium mine.
The Ranger uranium mine (RUM) in northern Australia is a planned exposure situation in the context of current recommendations of International Commission on Radiological Protection (ICRP) (ICRP 2007). The ICRP recommended dose limit for public exposure in planned exposure situations is 1 mSv in a year. This limit applies to the sum of doses received by a member of the public from all exposure pathways and relevant practices. The same dose limit for public exposure has been prescribed in national radiation protection recommendations and standards (ARPANSA 2002 & 2011).
In addition to dose limitation, the ICRP recommends that the level of protection should be optimised so that the likelihood of incurring exposures, the number of people exposed and the magnitude of individual doses are kept as low as reasonably achievable, taking into account economic and societal factors (ICRP 2007). The concept of dose constraint is used in the optimisation process to provide an upper bound on the annual doses that people should receive from an individual practice. For planned situations involving public exposure, the ICRP recommends that the dose constraint should be less than 1 mSv in a year and a value of no more than about 0.3 mSv in a year would be appropriate (ICRP 2007).
The main areas of habitation in the vicinity of RUM and Jabiluka are Jabiru, Jabiru East and Mudginberri. eriss undertakes atmospheric monitoring of RDP and LLAA concentrations at these locations (Figure 1) to provide independent assurance that there is no unacceptable radiation risk to the public from inhalation of radionuclides. This paper summarises the results of this monitoring.
MethodsEnvironmental Radon Daughter Monitors (ERDMs) acquired from Radiation Detection Systems in Adelaide have been used since 2009 for continuous monitoring of the potential alpha energy concentration (PAEC) of RDP in air. The ERDMs operate at a nominal flow rate of 0.3 l/min and draw air through a Whatman GF/C filter positioned above an alpha counter. Hourly PAEC data is logged in the internal memory of the unit, which was downloaded at approximately monthly intervals.

Atmospheric radioactivity monitoring in the vicinity of Ranger and Jabiluka (C Doering, R Cahill, J Pfitzner & A Bollhöfer)
EcoTech MicroVol-1100 low flow-rate air samplers fitted with Whatman GF/C glass fibre filters have been used for dust collection since 2007. Filters were changed at approximately monthly intervals and analysed in eriss laboratories for total alpha activity using Daybreak 582 alpha counters. Count times were typically three to four days to ensure reasonable counting statistics. Measurement of the background alpha activity of the counting system was made prior to analysis of each filter. The background count rate was subtracted from the filter count rate to determine the net count rate, with a correction factor for counter efficiency applied to determine the alpha activity on the filter.
Figure 1 eriss atmospheric radioactivity monitoring sites in the vicinity of RUM
61

Atmospheric radioactivity monitoring in the vicinity of Ranger and Jabiluka (C Doering, R Cahill, J Pfitzner & A Bollhöfer)
ResultsRDP concentrationsFigure 2 shows eriss quarterly averaged RDP concentration data from Jabiru, Jabiru East and Mudginberri for measurements made since early 2003. The general trend in the data across the sites was for RDP concentrations to be higher in the dry season and lower in the wet season. Radon exhalation flux density from soils decreases with increasing soil moisture content (Lawrence et al 2009).
Figure 2 eriss quarterly averaged RDP concentration data from Jabiru, Jabiru East and Mudginberri for measurements made since early 2003
Two sample t-test analysis of the eriss quarterly averaged RDP concentration data was used to test for statistically significant differences (95% confidence level) in the mean values between Jabiru and Mudginberri and between Jabiru East and Mudginberri. The reason for testing both the Jabiru and Jabiru East results against the Mudginberri results is that the Mudginberri site is considered to be a background site due to its distance from the operational areas at RUM. The overall mean RDP concentrations at Jabiru, Jabiru East and Mudginberri were 0.043, 0.066 and 0.041 µJ m-3, respectively. Whereas the difference in mean values between Jabiru and Mudginberri was not statistically significant (p>0.05), there was a statistically significant difference in the mean values between Jabiru East and Mudginberri (p<0.05). Measured RDP concentrations at Jabiru East are generally higher than the other two sites and show more variation due to the closer proximity of the monitoring site to the RUM pit and ore stock piles, which are the largest localised sources of radon in the area.
In 2010, the dry season average RDP concentrations at all sites showed the suppressing effect of an unusually wet year (Figure 2). In the 12-month period from July 2010 to June 2011 northern Australia experienced one of the wettest years on record. Heavy and consistent rainfall kept the soil waterlogged for extended periods which inhibited radon exhalation from the ground surface, even during the dry season.
Figure 3 shows continuous measurements of RDP concentration and daily rainfall at Mudginberri for the first quarter of 2011. In general, RDP concentrations were low when daily rainfall amount was high and vice-versa, indicating the suppressing effect of rainfall on radon exhalation from the ground surface. The influence of other factors on radon exhalation such as soil 226Ra activity concentration, soil morphology and vegetation cover have been investigated previously (Lawrence et al 2009).
62

Atmospheric radioactivity monitoring in the vicinity of Ranger and Jabiluka (C Doering, R Cahill, J Pfitzner & A Bollhöfer)
Figure 3 RDP concentration and rainfall at Mudginberri in the first quarter of 2011
Table 1 gives the annual averages of RDP concentrations measured by eriss and those measured by the RUM operator (ERA 2009, 2010, 2011) in the past three years. It also gives the total annual dose to a member of the public at Jabiru from inhalation of RDP calculated by eriss.
Table 1 Annual average RDP concentrations at Jabiru, Jabiru East and Mudginberri and total annual doses to the public from RDP inhalation at Jabiru from 2008 to 2010. The values in parantheses are those reported by the RUM operator (ERA 2009; 2010; 2011).
2008 2009 2010
RDP concentration (µJ m-3) Jabiru 0.038 (0.037) 0.039 (0.066) 0.028 (0.038)
Jabiru East 0.046 (0.033) 0.057 (0.100) 0.030 (0.040)
Mudginberri 0.029 0.037 0.024
RDP total annual dose (mSv) at Jabiru 0.37 0.38 0.27
The total annual dose comprises both the natural background and mine-related components of the RDP dose. The calculation uses the annual average RDP concentration at Jabiru, a dose conversion factor of 0.0011 mSv per μJ hr m-3 and an occupancy of 8760 hours. The eriss calculated total annual dose to the public at Jabiru from RDP in 2010 was approximately 0.27 mSv. Previous work by eriss (Martin 2002) suggests that the mine-related component of the RDP dose to the public at Jabiru is probably an order of magnitude less than the total annual dose value, though this estimate of the mine-related component was for a smaller mine footprint than the present situation.
LLAA radionuclide concentrationsFigure 4 shows eriss quarterly averaged LLAA concentration data from Jabiru, Jabiru East and Mudginberri for measurements made since early 2003. Similar to the general trend in RDP concentrations, LLAA concentrations across the three sites tended to be higher in the dry season and lower in the wet season due to the higher soil moisture content in the wet season that suppresses dust generation.
63

Atmospheric radioactivity monitoring in the vicinity of Ranger and Jabiluka (C Doering, R Cahill, J Pfitzner & A Bollhöfer)
Figure 4 eriss quarterly averaged LLAA concentration data from Jabiru, Jabiru East and Mudginberri for measurements made since early 2003
Two sample t-test analysis of eriss quarterly averaged LLAA concentration data was used to test for statistically significant differences (95% confidence level) in the mean values between Jabiru and Mudginberri and between Jabiru East and Mudginberri. The overall mean LLAA concentrations at Jabiru, Jabiru East and Mudginberri were 0.00019, 0.00030 and 0.00016 Bq m-3, respectively. Whereas the difference in mean values between Jabiru and Mudginberri was not statistically significant (p>0.05), there was a statistically significant difference in the mean values between Jabiru East and Mudginberri (p<0.05). Similar to the RDP results, measured LLAA concentrations at Jabiru East are generally higher than the other two sites, particularly in the dry season, and show more variation due to the closer proximity of the monitoring site to operational areas at RUM.
Table 2 gives the annual averages of LLAA radionuclide concentrations measured by eriss and those reported by the RUM operator (ERA 2009; 2010; 2011) in the past three years. It also gives the total annual dose to a member of the public at Jabiru from inhalation of LLAA radionuclides calculated by eriss. The total annual dose comprises both the natural background and mine-related components of the LLAA dose. The calculation uses the annual average LLAA concentration at Jabiru, a dose conversion factor of 0.0057 mSv per alpha decays per second (Zapantis 2001) and a breathing rate of 7300 m3 per year for adults (UNSCEAR 2000). The eriss calculated total annual dose to the public at Jabiru from LLAA radionuclides in 2010 was approximately 8 µSv. However, only a small fraction of that dose is considered to be mine-related (Bollhöfer et al 2006).
Table 2 Annual average LLAA radionuclide concentrations at Jabiru, Jabiru East and Mudginberri and total annual dose to a member of the public at Jabiru from inhalation of LLAA radionuclides from 2008 to 2010. The values in parantheses are those reported by the RUM operator (ERA 2009; 2010; 2011).
2008 2009 2010
LLAA concentration (Bq m-
3)Jabiru 0.00026 (0.00014) 0.00033 (0.00019) 0.00019 (0.00010)
Jabiru East 0.00039 (0.00073) 0.00042 (0.00099) 0.00039 (0.00066)
Mudginberri 0.00020 0.00026a 0.00019
LLAA total annual dose at Jabiru (mSv) 0.011 0.014 0.008
aData for first quarter 2009 not available for annual average calculation due to equipment malfunction
64

Atmospheric radioactivity monitoring in the vicinity of Ranger and Jabiluka (C Doering, R Cahill, J Pfitzner & A Bollhöfer)
ConclusionsThe mine-related inhalation dose to the public at Jabiru from RDP and LLAA is likely to be a few tens of micro Sieverts (µSv) per year. In the context of recommended dose limits and dose constraints for planned exposure situations, this level of dose does not represent an unacceptable radiation risk to the public. Nevertheless, atmospheric radioactivity monitoring of RDP and LLAA should continue over the operational life of the RUM and afterwards to provide the evidence base needed to reassure the public that radiation risks via the inhalation pathway remain low.
ReferencesARPANSA 2002. Recommendations for limiting exposure to ionizing radiation (1995) and
national standard for limiting occupational exposure to ionizing radiation. Radiation Protection Series No. 1, republished March 2002, Australian Radiation Protection and Nuclear Safety Agency.
ARPANSA 2011. National directory for radiation protection. Radiation Protection Series No. 6, republished July 2011 including amendments 1–5, Australian Radiation Protection and Nuclear Safety Agency.
Bollhöfer A, Honeybun R, Rosman KJR & Martin P 2006. The lead isotopic composition of dust in the vicinity of a uranium mine in northern Australia and its use for radiation dose assessment. Science of the Total Environment 366, 579–589.
ERA 2009. Radiation protection and atmospheric monitoring program report for the year ending 31 December 2008. RSRP-0903-01, Energy Resources of Australia Ltd.
ERA 2010. Radiation protection and atmospheric monitoring program report for the year ending 31 December 2009. RSRP-1003-02, Energy Resources of Australia Ltd.
ERA 2011. Radiation protection and atmospheric monitoring program report for the year ending 31 December 2010. RSRP-1103-02, Energy Resources of Australia Ltd.
ICRP 2007. The 2007 Recommendations of the International Commission on Radiological Protection. ICRP Publication 103. Annals of the ICRP 37 (2–4).
Lawrence CE, Akber RA, Bollhöfer A and Martin P 2009. Radon-222 exhalation from open ground on and around a uranium mine in the wet-dry tropics. Journal of Environmental Radioactivity 100, 1–8.
Martin P 2002. Development of a moving-grid dispersion model for radon and radon progeny. In Environmental Research Institute of the Supervising Scientist research summary 1995–2000. eds Rovis-Hermann J, Evans KG, Webb AL & Pidgeon RWJ, Supervising Scientist Report 166, Supervising Scientist, Darwin NT, 13–17.
UNSCEAR 2000. Source and effects of ionising radiation, vol 1–2. United Nations Scientific Committee on the Effects of Atomic Radiation. United Nations, New York.
Zapantis A 2001. Derivation of the dose conversion factor for the inhalation of uranium ore dust considering the effects of radon loss. Radiation Protection in Australasia 18, 35–41.
65

KKN 1.3.1 Surface water, groundwater, chemical, biological, sediment, radiological monitoring
Results of the stream monitoring program in Magela Creek and Gulungul Creek catchments,
2010–11C Humphrey, A Bollhöfer & D Jones
Progress under this KKN for the stream monitoring program in the Magela Creek and Gulungul Creek catchments is reported by way of (i) results of the routine monitoring program conducted for the 2010–11 period, and (ii) monitoring support tasks for the same period, including research and development, reviews and reporting. The latter tasks are reported separately (ARRTC paper KKN 1.3.1 Ranger stream monitoring research).
Since 2001, routine water quality monitoring and ecotoxicity programs have been deployed by the SSD for environmental assessment of aquatic ecosystems in the ARR. The objective of this work has been to provide independent assurance that the aquatic environment remains protected from current and past mining-associated activities in the region. The monitoring program incorporates chemical, physical and biological components.
The techniques and ‘indicators’ used in the monitoring program satisfy two important needs of environmental protection: (i) the early detection of potential significant effects to avoid ecologically important impacts; and (ii) information on the ecological importance of any likely impact (biodiversity assessment). Monitoring techniques adopted by the SSD that meet these requirements are:
(i) Early detection of short or longer-term changes Water physico-chemistry:
– Continuous monitoring: through the use of multi-probe loggers, continuous measurement of pH, electrical conductivity (EC), turbidity and temperature in Magela Creek, and EC, turbidity and termperature in Gulungul Creek;
– Event-based automatic sampling: The downstream monitoring sites in both Magela and Gulungul Creeks are equipped with auto-samplers, programmed to collect a 1 L water sample in response to the occurrence of pre-specified EC or turbidity conditions. The samples are analysed for total concentrations of uranium, magnesium, calcium, manganese and sulphate.
– Ongoing quality control sampling: Routine site visits for spot in situ measurement of pH, EC, turbidity and temperature (fortnightly), periodic grab sampling for measurement of uranium, magnesium, calcium, manganese and sulfate (monthly) and radium (samples collected fortnightly but combined to make monthly composites).
Toxicity monitoring of reproduction in freshwater snails (four-day tests conducted in situ, at fortnightly intervals);
Bioaccumulation – concentrations of chemicals (including radionuclides) in the tissues of freshwater mussels in Mudginberri Billabong to detect far-field effects including those arising from any potential accumulation of mine-derived contaminants in sediments (mussels sampled every late-dry season).

(ii) Assessment of changes in biodiversity Benthic macroinvertebrate communities at stream sites (sampled at end of each wet season);
Fish communities in billabongs (sampled at the end of each wet season).
In accordance with the concepts of best practice and optimisation, the routine monitoring program has evolved through time as technologies (eg continuous physicochemical monitoring using datasondes and telemetry) have evolved, and improved methodologies for biological assessment (eg in situ monitoring using snails) have been developed under the SSD research program.
The results from the stream chemical and biological monitoring program for 2010–11 are summarised below.
67

KKN 1.3.1 Surface water, groundwater, chemical, biological, sediment, radiological monitoring
Chemical and physical monitoring of Magela Creek
A Frostick, K Turner, L Curtis, S Fagan, L Chandler & WD Erskine
IntroductionDuring 2010–11, SSD modified its routine wet season monitoring program by replacing weekly grab sampling and analysis of dissolved constituents,with continuous monitoring of stream height, electrical conductivity (EC), turbidity, pH and water temperature coupled with event-based automatic water sampling and analysis of total constituents as the primary water quality monitoring method (Turner 2009, Turner & Jones 2010, Frostick et al 2011). This change substantially enhanced SSD’s ability to independently detect changes in water quality through time. In addition to continuous monitoring, manual grab samples were taken every two weeks from Magela Creek for radium analysis. Map 2 shows the location of the upstream and downstream monitoring sites and key Ranger Mine features.
Implications of event-based samplingAnalysis of event-based samples for total metal concentrations (dissolved metals plus those weakly bound to suspended particulate matter) contrasts with the previous weekly grab sample program where all samples were filtered in the field immediately after collection, and analysed for filterable (dissolved) metals only. The event-based samples will experience a variable period of standing (mostly less than 24 hours) before they are collected and processed in the laboratory. By analysing the total metal concentration as distinct from dissolved metal concentration, the proportion of dissolved metals that would typically become ‘lost’ due to adsorption to the surface of particulate matter during the standing period, will be determined.
Over two wet seasons (2008–09 and 2009–10), the SSD analysed event-based water samples collected over a range of EC and turbidity values for both the total (dissolved metals as well as those weakly bound to suspended particulate matter) and filterable (dissolved metals only) metal concentrations. The results showed that concentrations of magnesium and sulfate were predominantly associated with the dissolved fraction, which is consistent with their chemically non-reactive nature. For uranium, approximately 30% was associated with the particulate fraction and approximately 70% with the dissolved fraction. During the 2010-11 wet season, grab samples were collected and analysed for dissolved and total concentrations of key analytes (Table 1). The results were compared to assess the percentage of each analyte that was present in dissolved form and these results are in close agreement with the results from the 2008–09 and 2009–10 wet season (Frostick et al 2011). Consequently, from the comparisons carried out between dissolved and total analyses it is possible to infer the approximate values for dissolved concentrations using the total concentration data.
Summary of wet season water qualityFrom early November 2010 until mid December, discharge in Magela Creek was intermittent with a peak of 3.4 cumecs on 29 November 2010. During this period the probes at the Magela Creek upstream station (MCUGT) were periodically out of the water resulting in no data for the period between 11 and 24 November 2010. The probes at the Magela Creek downstream

Chemical and physical monitoring of Magela Creek (A Frostick, K Turner, L Curtis, S Fagan, L Chandler & WD Erskine)
station (MCDW) were inundated for the whole of this period but were frequently in stagnant water resulting in a stepped response in EC to individual flushing events (Figure 1).
Table 1 Average percentage of total Mg, SO4 and U concentration that was present in dissolved form in samples collected from the upstream and downstream monitoring sites at Magela and Gulungul Creeks during the 2010–11 wet season. The standard deviation is shown in brackets.
SitePercentage of total concentration in dissolved (<0.45 µm filtered) form
Mg SO4 U
MCUGT (n = 7) 100 (± 8) 93 (± 37) 70 (± 24)
MCDW (n = 7) 96 (± 9) 92 (± 12) 74 (± 20)
GCUS (n = 5) 96 (± 6) 85 (± 27) 80 (± 6)
GCDS (n = 5) 97 (± 4) 95 (± 7) 64 (± 17)
0
20
40
60
80
100
1-Nov-10 1-Dec-10 31-Dec-10 30-Jan-11 1-Mar-11 31-Mar-11 30-Apr-11 30-May-11 29-Jun-11
Date
EC (μ
S/cm
)
0
200
400
600
800
Wat
er D
isch
arge
at M
G00
9 (c
umec
s)
MCUGTMCDWWater Discharge
Figure 1 Electrical conductivity and discharge at the upstream (MCUGT) and downstream (MCDW) sites on Magela Creek between November 2010 and July 2011
Discharge remained very low until mid-December 2010 when it increased due to rainfall events, which resulted in several peaks in turbidity at both upstream and downstream stations (Figure 2) typical of first flush conditions. During December 2010, EC remained < 20 μS/cm at both monitoring stations, except for a small peak of 23.3 μS/cm at MCDW on 31 December 2010. Several more small EC peaks were recorded during early January 2011, but these were all below the statistically derived EC guideline value for grab samples.
On 15–16 January, EC peaked at 50 μS/cm during a 12 hour event, with EC remaining above the guideline of 43 μS/cm for 2.5 hours. Uranium concentrations in automatic samples collected during this event remained below 0.3 μg/L, less than 5% of the 6.0 μg/L uranium limit (Figure 3). Manganese peaked at 19.3 μg/L during the beginning of this event (Figure 4), which lies within the historic grab sample range for this site (2.08–48.1 μg/L), and is below the guideline of 26 μg/L. Magnesium and sulfate concentrations closely followed the EC continuous monitoring peak with concentrations peaking at 3.4 mg/L and 12.6 mg/L, respectively. These concentrations are slightly higher by no more 0.5mg/L than the maximum concentrations previously recorded during the grab sample monitoring program at this site. EC levels were stable at the upstream monitoring site through late January and early February, and showed some minor fluctuations at MCDW with a maximum EC of around 30 μS/cm.
69

Chemical and physical monitoring of Magela Creek (A Frostick, K Turner, L Curtis, S Fagan, L Chandler & WD Erskine)
On 13–14 February, EC peaked at 46 μS/cm during a 14 hour period with EC remaining above the guideline of 43 μS/cm for 1.7 hours. Two samples were collected by autosampler, which contained uranium and manganese concentrations of up to 0.498 μg/L and 26.3 μg/L, respectively. Concentrations of magnesium (3.4 mg/L) and sulfate (11.8 mg/L) closely follow EC (Figures 5 & 6). As EC declined on 14 February before a discharge peak in Magela Creek of 709 cumecs there was a turbidity peak of 42 NTU at MCDW (Figure 2).
0
20
40
60
80
100
120
1-Nov-10 1-Dec-10 31-Dec-10 30-Jan-11 1-Mar-11 31-Mar-11 30-Apr-11 30-May-11 29-Jun-11
Date
Turb
idity
(NTU
)
0
200
400
600
800
Dis
char
ge a
t MG
009
(cum
ecs)
MCUGTMCDWWater Discharge
Figure 2 Turbidity and discharge at the upstream (MCUGT) and downstream (MCDW) sites on Magela Creek between November 2010 and July 2011
0
20
40
60
80
100
1-Nov-10 1-Dec-10 31-Dec-10 30-Jan-11 1-Mar-11 31-Mar-11 30-Apr-11 30-May-11 29-Jun-11
Date
Elec
tric
al C
ondu
ctiv
ity (μ
S/cm
)
0
0.25
0.5
0.75
1
1.25
Ura
nium
(μg/
L)
MCDW ECMCUGT ECMCDW UraniumMCUGT Uranium
Figure 3 Electrical conductivity and total uranium concentrations at the upstream (MCUGT) and downstream (MCDW) sites on Magela Creek between November 2010 and July 2011
70
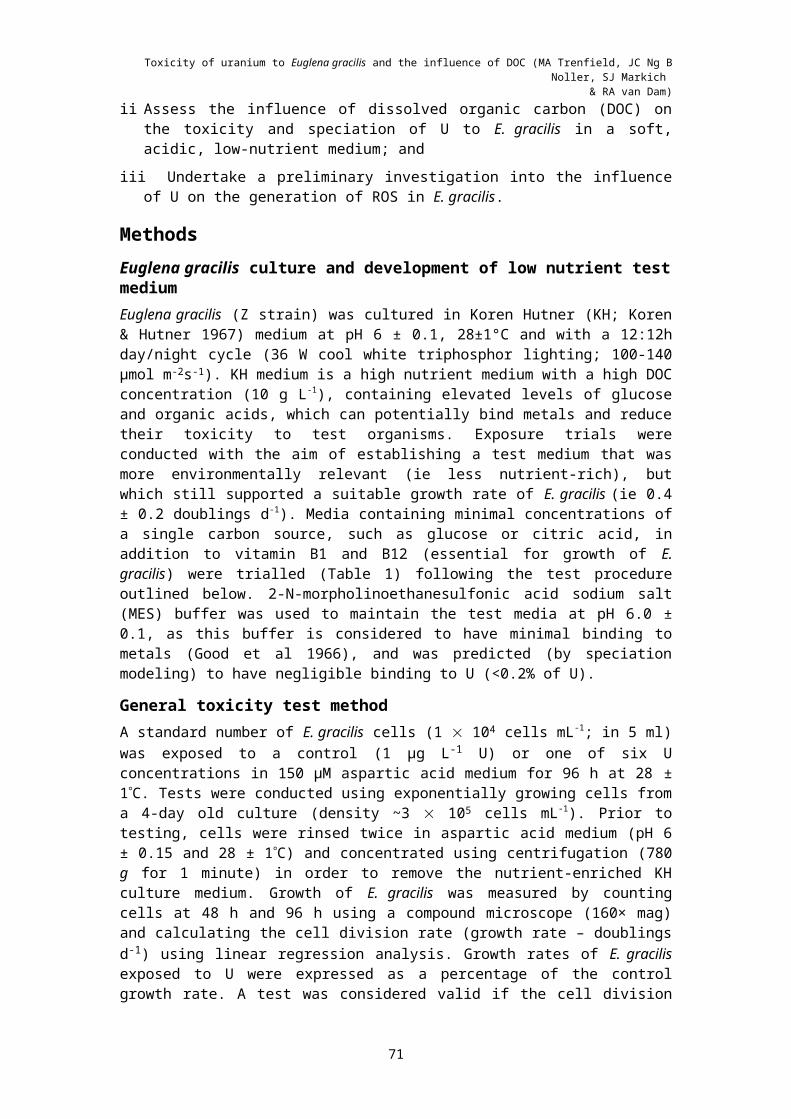
Chemical and physical monitoring of Magela Creek (A Frostick, K Turner, L Curtis, S Fagan, L Chandler & WD Erskine)
Figure 4 Electrical conductivity and total manganese concentrations at the upstream (MCUGT) and downstream (MCDW) sites on Magela Creek between November 2010 and July 2011
0
20
40
60
80
100
1-Nov-10 1-Dec-10 31-Dec-10 30-Jan-11 1-Mar-11 31-Mar-11 30-Apr-11 30-May-11 29-Jun-11
Date
Elec
tric
al C
ondu
ctiv
ity (μ
S/cm
)
0
2
4
6
8
Mag
nesi
um (m
g/L)
MCDW ECMCUGT ECMCDW MagnesiumMCUGT Magnesium
Figure 5 Electrical conductivity and total magnesium concentrations at the upstream (MCUGT) and downstream (MCDW) sites on Magela Creek between November 2010 and July 2011.
0
20
40
60
80
100
1-Nov-10 1-Dec-10 31-Dec-10 30-Jan-11 1-Mar-11 31-Mar-11 30-Apr-11 30-May-11 29-Jun-11
Date
Elec
tric
al C
ondu
ctiv
ity (μ
S/cm
)
-4
0
4
8
12
16
20
Sulfa
te (m
g/L)
MCDW ECMCUGT ECMCDW SulfateMCUGT Sulfate
Figure 6 Electrical conductivity and total sulfate concentrations at the upstream (MCUGT) and downstream (MCDW) sites on Magela Creek between November 2010 and July 2011
71

Chemical and physical monitoring of Magela Creek (A Frostick, K Turner, L Curtis, S Fagan, L Chandler & WD Erskine)
On 22 February, EC at MCDW peaked at 57 μS/cm during a 4 hour event with EC remaining above the guideline of 43 μS/cm for 1.75 hours. Two autosamples were triggered, which contained uranium and manganese concentrations up to 1.01 μg/L and 16.5 μg/L, respectively. This would equate to a filtered uranium value of between 0.6–0.8 μg/L, given that approximately 70% of the total concentration appears to be present in dissolved form (Table 1). While there is a level of uncertainty surrounding this estimate the total concentration of U is well below the the limit of 6 μg/L. Concentrations of the major ions magnesium and sulfate were 4.2 mg/L and 15.8 mg/L, respectively.
As EC decreased at MCDW due to an increase in flow, there was a peak in turbidity. The turbidity peak occurred following a 190 mm rainfall event and was caused by surface runoff from areas both on and off the mine site.
Water levels decreased during March, with EC and turbidity being relatively stable. This continued through April with EC remaining below 30 μS/cm. A brief increase in flow was noted on 6 April in response to a 22 mm rainfall event. Another local rainfall event on 23 April caused minor peaks in EC and turbidity at both monitoring sites.SSD completed an investigation into a low magnitude EC spike recorded at the upstream site in the early hours of 22 February 2011 (Figure 7), which was not detected at the ERA site further upstream (data not shown). Such an occurrence had not been observed before and it was important to investigate the source of the EC in the context of the robustness of our upstream reference site and the integrity of the data collected.
Figure 7 Magela Creek continuous monitoring data at the upstream (MCUGT) and downstream (MCDW) sites for the period 21–23 February 2011
A field inspection showed that discharge from Georgetown Billabong had overtopped the sand-bar separating the billabong and Magela Creek, thereby causing an elevated EC response at the upstream monitoring station. This was generated by an unusual localised high intensity rainfall event which delivered approximately 170 mm in just over 2 hours. This caused a rapid increase in discharge from the Georgetown Creek catchment before the water level rose in Magela Creek. Overbank flows from Georgetown Billabong reached the Magela central anabranch.
Given that such incidents are very rare, and their occurrence readily identified, SSD does not consider relocation of the upstream monitoring station to be warranted. The ability of the upstream monitoring site to detect these types of unusual events is considered to be advantageous and should assist with future interpretations of extreme conditions in Magela Creek.
72

Chemical and physical monitoring of Magela Creek (A Frostick, K Turner, L Curtis, S Fagan, L Chandler & WD Erskine)
Recessional flow conditions commenced in Magela Creek in late April. These conditions are typified by a falling hydrograph, with EC stabilising and then rising slowly as groundwater input becomes the dominant source of flow. Continuous monitoring was maintained until cease-to-flow was agreed by stakeholders on 15 August 2010.
Overall, the water quality measured in Magela Creek for the 2010–11 wet season was comparable to previous wet seasons (Figure 8).
-60
-40
-20
0
20
40
60
80
100
14-Nov-07 12-May-08 8-Nov-08 7-May-09 3-Nov-09 2-May-10 29-Oct-10 27-Apr-11
Date
EC (μ
S/cm
)
0
300
600
900
1200
1500
1800
Wat
er D
isch
arge
at M
G00
9 (c
umec
s)
MCUGTMCDWWater Discharge
Figure 8 Electrical conductivity measurements at the upstream (MCUGT) and downstream (MCDW) sites and discharge (lower trace) in Magela Creek between December 2007 and July 2011 (this chart
uses 1 hour mean values)
ReferencesFrostick A, Turner K, Tayler K & Jones D 2011. Water chemistry monitoring program. In
eriss research summary 2009–2010. eds Jones DR & Webb A, Supervising Scientist Report 202, Supervising Scientist, Darwin NT, 48–55.
Turner K 2009. Continuous monitoring of water quality in Magela Creek. In eriss research summary 2007–2008. eds Jones DR & Webb A, Supervising Scientist Report 200, Supervising Scientist, Darwin NT, 71–74.
Turner K & Jones D 2010. Surface water transport of mine-related solutes in the Magela Creek catchment using continuous monitoring techniques. In eriss research summary 2008–2009. eds Jones DR & Webb A, Supervising Scientist Report 201, Supervising Scientist, Darwin NT, 58–65.
73

KKN 1.3.1 Surface water, groundwater, chemical, biological, sediment, radiological monitoring
Chemical and physical monitoring of Gulungul Creek
A Frostick, K Turner, L Curtis & WD Erskine
Flow was first observed at the Gulungul Creek downstream monitoring station (GCDS) on 14 December 2010. Continuous monitoring commenced on 15 December 2010 because water depths were sufficient for deployment of the monitoring probes. Water levels gradually increased due to successive rainfall events, which resulted in peaks in turbidity at both monitoring stations during late December 2010 and early January 2011.
Electrical conductivity (EC) increased from the end of December and peaked at the upstream (GCUS) and GCDS monitoring stations at 27.7 μS/cm on 4 and 5 January 2011, respectively. EC peaks were recorded at both the upstream and downstream sites between 7 and 11 January 2011 (see insert in Figure 1). However, the magnitude of the EC increase was much greater at GCDS. Continuous monitoring data from SSD’s Gulungul Creek G8210012 station (not shown) indicates the source of the increased EC lies between G8210012 and GCDS.
0
10
20
30
40
50
60
16-Dec-10 15-Jan-11 14-Feb-11 16-Mar-11 15-Apr-11 15-May-11 14-Jun-11Date
EC (μ
S/cm
)
0
1
2
3
4
Wat
er le
vel a
t GC
DS
(m)
GCUSGCDSWater Level
Figure 1 Electrical conductivity at the upstream (GCUS) and downstream (GCDS) sites and water level on Gulungul Creek between December 2010 and July 2011
Uranium concentrations from samples collected by the autosampler at GCDS during these EC events remained below 0.6 μg/L, one order of magnitude less than the 6.0 μg/L uranium limit for Magela Creek (Figure 2). Manganese concentration peaked at 17.8 μg/L (Figure 3), which lies within the historic grab sample range for this site (0.68–18.1 μg/L). Magnesium and sulfate concentrations closely followed the EC continuous monitoring peak (Figures 4 & 5). Investigations by ERA suggest the source of the increased EC is salts leached from the fresh rock used in recent Tailings Storage Facility (TSF) wall raises. Recent improvements that have been made to the water management system around the base of the TSF mean that water shed from the western and southern walls of the TSF is now being contained in constructed ponds and pumped back to the pond water system.
A rise in EC levels at both monitoring sites occurred in late January and early February as water levels decreased. Turbidity peaks which occurred at the upstream site on 15 and 24 January

Chemical and physical monitoring of Gulungul Creek (A Frostick, K Turner, L Curtis & WD Erskine)
2011 were also observed at the downstream site but at a much lower magnitude. On 14 February, there was a turbidity peak of 84 NTU at GCUS before a peak in water level due to heavy rainfall (Figure 6). At GCDS, the turbidity remained relatively low, peaking at 15 NTU. During this time EC decreased at both monitoring points to <10 μS/cm. During late February and March EC gradually increased as discharge decreased.
0
10
20
30
40
50
60
16-Dec-10 15-Jan-11 14-Feb-11 16-Mar-11 15-Apr-11 15-May-11 14-Jun-11Date
EC (μ
S/cm
)
0
0.25
0.5
0.75
1
Ura
nium
(μg/
L)
GCUS ECGCDS ECGCDS UraniumGCUS Uranium
Figure 2 Electrical conductivity and total uranium concentrations at the upstream (GCUS) and downstream (GCDS) sites on Gulungul Creek between December 2010 and July 2011.
0
10
20
30
40
50
60
16-Dec-10 13-Jan-11 10-Feb-11 10-Mar-11 7-Apr-11 5-May-11 2-Jun-11Date
EC (μ
S/cm
)
0
10
20
30
40
Man
gane
se (μ
g/L)
GCUS ECGCDS ECGCDS ManganeseGCUS Manganese
Figure 3 Electrical conductivity and total manganese concentrations at the upstream (GCUS) and downstream (GCDS) sites on Gulungul Creek between December 2010 and July 2011.
75

Chemical and physical monitoring of Gulungul Creek (A Frostick, K Turner, L Curtis & WD Erskine)
0
10
20
30
40
50
60
16-Dec-10 15-Jan-11 14-Feb-11 16-Mar-11 15-Apr-11 15-May-11 14-Jun-11Date
EC (μ
S/cm
)
0
2
4
6
8
Mag
nesi
um (m
g/L)
GCUS ECGCDS ECGCDS MagnesiumGCUS Magnesium
Figure 4 Electrical conductivity and total magnesium concentrations at the upstream (GCUS) and downstream (GCDS) sites on Gulungul Creek between December 2010 and July 2011.
0
10
20
30
40
50
60
16-Dec-10 13-Jan-11 10-Feb-11 10-Mar-11 7-Apr-11 5-May-11 2-Jun-11Date
EC (μ
S/cm
)
0
4
8
12
16
20
Sulfa
te (m
g/L)
GCUS ECGCDS ECGCDS SulfateGCUS Sulfate
Figure 5 Electrical conductivity and total sulfate concentrations at the upstream (GCUS) and downstream (GCDS) sites on Gulungul Creek between December 2010 and July 2011
0
50
100
150
200
16-Dec-10 15-Jan-11 14-Feb-11 16-Mar-11 15-Apr-11 15-May-11 14-Jun-11Date
Turb
idity
(NTU
)
0
1
2
3
4
Wat
er le
vel a
t GC
DS
(m)
GCUSGCDSWater Level
Figure 6 Turbidity at the upstream (GCUS) and downstream (GCDS) sites and water level on Gulungul Creek between December 2010 and July 2011
76

Chemical and physical monitoring of Gulungul Creek (A Frostick, K Turner, L Curtis & WD Erskine)
During early April, EC at GCDS remained comparable with the upstream site at less than 20 μS/cm. Turbidity also remained relatively low and stable. A local rainfall event on 23 April caused minor peaks in EC and turbidity at both monitoring sites.
Recessional flow conditions commenced on Gulungul Creek in late April. These conditions are typified by a falling hydrograph with EC stabilising and then rising slowly as groundwater input becomes the dominant source of flow. Monitoring ceased in Gulungul Creek in the week of the 22 June because the sensors were exposed.
Overall, the water quality measured in Gulungul Creek for the 2010–11 wet season (Figure 7) was comparable with results from previous wet seasons (Frostick et al 2011).
-60
-40
-20
0
20
40
60
80
100
14-Nov-07 12-May-08 8-Nov-08 7-May-09 3-Nov-09 2-May-10 29-Oct-10 27-Apr-11
Date
EC (μ
S/cm
)
1
2
3
4
5
Wat
er L
evel
at G
CD
S (m
)
GCUSGCDSWater Level
Figure 7 Electrical conductivity measurements at the upstream (GCUS) and downstream (GCDS) sites and discharge (lower trace) on Gulungul Creek between December 2007 and July 2011 (this chart uses
1 hour mean values)
ReferencesFrostick A, Turner K, Tayler K & Jones D 2011. Water chemistry monitoring program. In
eriss research summary 2009–2010. eds Jones DR & Webb A, Supervising Scientist Report 202, Supervising Scientist, Darwin NT, 48–55.
77

KKN 1.3.1 Surface water, groundwater, chemical, biological, sediment, radiological monitoring
Surface water radiological monitoring in the vicinity of Ranger and Jabiluka
P Medley, F Evans & A Bollhöfer
IntroductionSurface water samples in the vicinity of the Ranger project area are routinely collected and measured for their radium-226 (226Ra) activity concentrations to check for any significant increase in 226Ra levels downstream of the impacted areas. This is due to the potential risk of increased exposure to radiation via the biophysical pathway due to mining activities. Mussels, in particular, bioaccumulate 226Ra, which may then be incorporated into the human body upon consumption (Martin et al 1998, Bollhöfer et al 2011). Water samples are collected weekly in Magela Creek (Ranger) from both upstream and downstream sites. Samples are not collected during periods of no contiguous surface water flow (ie during the dry season). Water samples have also been collected monthly from the Ngarradj Creek (Jabiluka) downstream site, but sampling has now ceased with the last samples collected in the 2008–09 wet season. Jabiluka has been in long-term care and maintenance since 2003 and sufficient baseline data have been accrued.
Measuring the activity concentrations of 226Ra does not by itself identify the source of radium in the environment. However, the activity concentration ratio of 226Ra and 228Ra can potentially be used as a signature to pinpoint the source of radium (Bollhöfer & Martin 2003, Medley et al 2011). This is the case since 226Ra is a member of the 238U decay series while 228Ra comes from the decay of thorium-232 (232Th). Consequently, increases in the 226Ra/228Ra activity concentration ratios could imply that relatively more radium is derived from a uraniferous (uranium rich) source, such as a uranium mine or ore body, although differences in this ratio also exist between clays and natural sands, with sands exhibiting relatively low 226Ra/228Ra activity concentration ratios (Bollhöfer & Martin 2003).
The differences in 226Ra/228Ra activity concentration ratios between upstream and downstream sites in Magela Ck can potentially also be used to indicate the proportion of 226Ra at the downstream site that is coming from the Ranger mine. This will be especially important in the event that elevated downstream levels are detected. Some results from 228Ra determination in Magela Creek samples collected during March to July 2007, including 226Ra/228Ra activity concentration ratios, are presented here. Further analysis is being undertaken on remaining samples.
MethodsPrior to the 2006–07 wet season, weekly samples obtained from Magela Creek were combined to provide monthly averages. From the 2006–2007 wet season to the 2009–2010, wet season the weekly samples collected from Magela Creek have been increased in size from 1 L to 5 L. This was done to improve the detection capability and to enable higher precision in measurement of 228Ra on four combined weekly samples (20L) giving a monthly average. Collection of the higher volume samples was discontinued for the 2010–2011 wet season and 1 L samples were collected fortnightly from Magela Creek and combined to provide the monthly averages. The 4 year collection period from the 2006–2007 wet season to the 2009–

Surface water radiological monitoring in the vicinity of Ranger and Jabiluka (P Medley, F Evans & A Bollhöfer)
2010 wet season is considered sufficient to produce a baseline dataset for 228Ra in Magela Creek and to determine the usefulness of the 226Ra/228Ra activity concentration ratios as a signature to pinpoint sources of radium in Magela Creek.
Since 2011, radium analyses of composites from samples collected by autosampler during EC-triggered events have also been included in the radium analysis. The higher radium concentrations seen in Figure 1 are a consequence of the new automated sampling method which allows the capture of specific EC events. These events are short-lived and their impact on seasonal 226Ra loads is likely to be small. Composite samples from MCDW were collected by autosampler during EC-triggered events on 10 and 15 April 2010, and on 15–16 January, 14 and 22 February 2011.
Samples are analysed for total 226Ra (ie dissolved plus particulate phase) via alpha spectrometry in the eriss environmental radioactivity laboratory using a method described in Medley et al (2005). Alpha spectrometry is also used for 228Ra determination after allowing for ingrowth of the 228Th daughter (Medley 2010). In low-level samples it can take several years for sufficient 228Th activity to accumulate for a reliable determination of 228Ra activity concentration. However, 228Ra activity concentrations can be determined retrospectively in all samples prepared for analysis for 226Ra.
-2
0
2
4
6
8
10
12
Tota
l act
ivity
con
cent
ratio
n (m
Bq/
L)
Date
Radium-226 in Magela Creek 2001-2011Routine Upstream Routine DownstreamEvent Downstream Wet Season median difference
Dry S
eaon -N
o Flow
Dry S
eaon -N
o Flow
Dry S
eaon -N
o Flow
Dry S
eaon -N
o Flow
Dry S
eaon -N
o Flow
Limit =10 mBq/L wet season median difference
Dry S
eaon -N
o Flow
Dry S
eaon -N
o Flow
Dry S
eaon -N
o Flow
Dry S
eaon -N
o Flow
Figure 1 Total Radium-226 in Magela Creek for the 2001–2011 wet seasons
ResultsThe 226Ra activity concentration data in Magela Creek for the 2009–10 wet season are compared with the previous wet seasons in Figure 1. In addition the wet season median values for each location and the wet season median differences between locations are reported in Table 1.
Each wet season, the difference value is calculated by subtracting the downstream median from the upstream median. This difference is called the wet season median difference (shown by the solid black lines in Figure 1) and should not be more than the limit of 10 mBq/L. This limit has been defined for the purpose of human radiological protection (Klessa 2001) and was inferred from the potential dose received from the ingestion of 226Ra in the freshwater
79

Surface water radiological monitoring in the vicinity of Ranger and Jabiluka (P Medley, F Evans & A Bollhöfer)
mussel Velesunio angasi, taking into account the uptake factor for radium from the water column (Martin et al 1998).
The data for Magela Creek show that not only are the levels of 226Ra very low, both upstream as well as downstream of the Ranger mine, but there is also no statistically significant difference between average 226Ra activity concentrations at the upstream and downstream sites in the 2010–11 wet season (two sample t-test; p = 0.42). In addition, ANOVA (using a general linear model) was performed on the measured upstream-downstream 226Ra activity concentrations over the past 10 wet seasons. The analysis shows that there is no statistically significant difference between individual wet seasons (p = 0.19), between the 2010–2011 wet season and the previous years (p = 0.15) and between sites (p = 0.68), respectively.
Table 1 Median and standard deviations of the 226Ra activity concentration in Magela Creek (mBq/L) for individual wet seasons (2001–11)
Wet season Median and standard deviation Median difference
Upstream Downstream
2001–2002 2.3 ± 1.0 2.5 ± 0.6 0.2
2002–2003 2.0 ± 0.5 1.8 ± 0.5 -0.2
2003–2004 1.8 ± 0.4 2.0 ± 0.5 0.2
2004–2005 1.7 ± 2.1 1.6 ± 0.7 -0.2
2005–2006 2.0 ± 0.8 2.3 ± 0.6 0.3
2006–2007 1.7 ± 0.4 1.9 ± 0.7 0.2
2007–2008 1.8 ± 0.4 1.8 ± 0.4 0.1
2008–2009 1.5 ± 0.6 1.9 ± 0.6 0.4
2009–2010 1.6 ± 0.5 1.9 ± 0.6 0.3
2010–2011 1.6 ± 0.3 1.8 ± 0.4 0.2
All years 1.8 ± 0.9 1.9 ± 0.6 0.1
228Ra and 226Ra/228Ra activity concentration ratios in Magela Creek228Ra analyses were started in 2009–10 using alpha spectrometric measurement after allowing a suitable time for ingrowth of the 228Th daughter in the samples prepared for 226Ra analyses (Medley 2010). The dataset is still incomplete, but some results are shown in Table 2.
The data presented for filtered 228Ra (Table 2) consistently show a lower activity concentration than for 226Ra but no significant difference in 228Ra activity concentration between upstream and downstream sites (two sample t-test; p = 0.19). Although downstream 226Ra/228Ra activity ratios are slightly higher than upstream ratios, this difference is not statistically significant difference (two sample t-test; p = 0.97).
More data are required to improve the signal to noise ratio, and to complete an investigation of the usefulness of 226Ra/228Ra activity concentration ratio measurements to pinpoint sources of radium in Magela Creek water. Sufficient samples were collected to produce a baseline dataset for 226Ra/228Ra activity concentration ratios in Magela Creek over four wet seasons. However, the relatively high uncertainty associated with the measurement of the very low levels of 228Ra in typcial 1 L routine grab samples (compared to 20 L samples used for this project) and the long time required for the ingrowth of 228Th for 228Ra analysis, may preclude the ratio method from being used to reliably detect any change in conditions other than a major downstream excursion. Should a major downstream excursion occur, an increase will
80

Surface water radiological monitoring in the vicinity of Ranger and Jabiluka (P Medley, F Evans & A Bollhöfer)
immediately be detected in water 226Ra activity concentration, and the 226Ra/228Ra activity concentration ratio may give an indication of the source of this radium, after sufficient time has been allowed for the ingrowth of 228Th.
Table 2 Results of 226Ra, 228Ra activity concentration and 226Ra/228Ra activity concentration ratios for composite samples collected from March to July 2007. Data for both dissolved and particulate fractions are shown where available.
Site Collection dates 226Ra (mBq/L) 228Ra (mBq/L) 226Ra: 228RaUpstream (Particulate) 22/03/2007–04/04/2007 0.69 ± 0.04 0.33 ± 0.04 2.1 ± 0.1
Downstream (Particulate) 22/03/2007–04/04/2007 1.03 ± 0.05 0.56 ± 0.04 1.8 ± 0.1
Upstream (Filtrate) 12/04/2007–03/05/2007 0.86 ± 0.05 0.49 ± 0.04 1.8 ± 0.1
Downstream (Filtrate) 12/04/2007–03/05/2007 1.03 ± 0.04 0.59 ± 0.05 1.7 ± 0.1
Upstream (Filtrate) – dup 12/04/2007–03/05/2007 1.03 ± 0.07 0.65 ± 0.05 1.6 ± 0.1
Downstream (Filtrate) - dup 12/04/2007–03/05/2007 1.00 ± 0.06 0.52 ± 0.03 1.9 ± 0.1
Upstream (Filtrate) 10/05/2007–31/05/2007 1.20 ± 0.04 0.61 ± 0.05 2.0 ± 0.1
Downstream (Filtrate) 10/05/2007–31/05/2007 1.20 ± 0.04 0.57 ± 0.05 2.1 ± 0.1
Upstream (Filtrate) 08/06/2007–28/06/2007 1.00 ± 0.05 0.60 ± 0.07 1.7 ± 0.1
Downstream (Filtrate) 08/06/2007–28/06/2007 1.27 ± 0.08 0.57 ± 0.04 2.2 ± 0.1
Downstream (Filtrate) 06/07/2007–26/07/2007 1.12 ± 0.07 0.50 ± 0.04 2.2 ± 0.1
Mean (filtrate only) 1.08 ± 0.02 0.57 ± 0.01 1.9 ± 0.2
Mean (u/s, filtrate only) 1.02 ± 0.14 0.59 ± 0.07 1.7 ± 0.2
Mean (d/s, filtrate only) 1.12 ± 0.11 0.55 ± 0.04 2.0 ± 0.2
NOTE: For individual results, associated uncertainties given are one standard deviation based on counting statistics only.
ReferencesBollhöfer A & Martin P 2003. Radioactive and radiogenic isotopes in Ngarradj (Swift Creek)
sediments: a baseline study. Internal Report 404, February, Supervising Scientist, Darwin. Unpublished paper.
Bollhöfer A, Brazier J, Ryan B, Humphrey C & Esparon A 2011. A study of radium bioaccumulation in freshwater mussels, Velesunio angasi, in the Magela Creek catchment, Northern Territory, Australia. Journal of Environmental Radioactivity 102, 964–974.
Klessa D 2001. Water quality in Magela Creek upstream and downstream of Ranger: A summary of performance for 2000–2001 and derived triggers and limits for 2001–2002. Internal Report 380, Supervising Scientist, Darwin. Unpublished paper.
Martin P, Hancock GJ, Johnston A & Murray AS 1998. Natural-series radionuclides in traditional north Australian Aboriginal foods. Journal of Environmental Radioactivity 40, 37–58.
Medley P, Bollhöfer A, Iles M, Ryan B & Martin P 2005. Barium sulphate method for radium-226 analysis by alpha spectrometry, Internal Report 501, Supervising Scientist, Darwin, Unpublished paper.
Medley P 2010. Barium sulphate method for consecutive determination of radium-226 and radium-228 on the same source. Internal Report 544, April, Supervising Scientist, Darwin.
Medley P, Bollhöfer A, Parry D, Ryan B, Sellwood J & Martin P 2011. Radium concentration factors in passionfruit (Passiflora foetida) from the Alligator Rivers Region, Northern Territory, Australia. Submitted to Radiation and Environmental Biophysics.
81

KKN 1.3.1 Surface water, groundwater, chemical, biological, sediment, radiological monitoring
Toxicity monitoring in Magela and Gulungul creeks
C Humphrey, C Davies, M Ellis & D Buckle
BackgroundIn this form of monitoring, effects of waters dispersed from the Ranger minesite on receiving waters are evaluated using responses of aquatic animals exposed in situ to creek waters. The response measured is reproduction (egg production) by the freshwater snail, Amerianna cumingi. Each test runs over a four-day exposure period. This species has been shown to be among the most sensitive, to both uranium and magnesium, of SSD’s suite of six local species as determined using standardised laboratory toxicity test protocols.
For the 1990–91 to 2007–08 wet seasons, toxicity monitoring was carried out using the ‘creekside’ methodology. This involved pumping a continuous flow of water from the adjacent Magela Creek through tanks containing test animals located under a shelter on the creek bank. In the 2008–09 wet season, this method was replaced by an in situ testing method in which test animals are placed in floating (flow-through) containers located in the creek itself (see Humphrey et al 2009 for details). The most recent refinement to this program has been the extension of toxicity monitoring to Gulungul Creek, with testing commencing in the 2009–10 wet season. Results of testing conducted in Gulungul Creek in the 2009–10 wet season were reported by Humphrey et al (2011) while results for the 2010–11 wet season are described below.
Fortnightly testing was conducted in each creek in the 2010–11 wet season, alternating each creek on a weekly basis (as such, testing was never conducted in both creeks in the same week).
The first of ten toxicity monitoring tests commenced in Magela Creek on 17 December 2010, once moderate creek flows were established. Tests were then conducted every other week over the 2010–11 wet season with the final test commencing on 29 April 2011. In Gulungul Creek, a total of nine tests were conducted, alternating with the Magela tests. The first Gulungul test commenced on 20 December 2010 and the final test was started on 5 May 2011. Results for both creeks are plotted in Figure 1 with egg production at upstream and downstream sites, and differences in egg production between the sites, being displayed.
Analysis of Magela Creek resultsAfter each wet season, the toxicity monitoring results for the tests are analysed, with differences in egg numbers (the ‘response’ variable) between the upstream (control) and downstream (exposed) sites tested for statistical change between the wet season just completed and previous wet seasons. For wet seasons from 1991–92 to 2008–09, egg numbers at the downstream site have been slightly greater than those measured at the upstream control site with a mean upstream-downstream difference value of -5.8 (Figure 1A&B). This contrasts to the 2009–10 wet season when for the first time, Analysis Of Variance (ANOVA) testing found a significant difference between the difference data for that year (mean difference value of -22.3) and that from previous wet seasons, because of the unusually higher downstream egg production (see Figure 1B).

Toxicity monitoring in Magela and Gulungul creeks (C Humphrey, C Davies, M Ellis & D Buckle)
A
mean
Wet season
Diff
eren
ce
Mea
n no
. of e
ggs
per s
nail
pair
-100
-50
0
50
100
150
200
250
300
350
400
450
500
1991
/92
1992
/93
1993
/94
1994
/95
1995
/96
1996
/97
1997
/98
1998
/99
1999
/00
2000
/01
2001
/02
2002
/03
2003
/04
2004
/05
2005
/06
Difference
Control site (upstream of mine)Exposed site (downstream of mine)
B
Wet season
Diff
eren
ce
Mea
n no
. of e
ggs
per s
nail
pair
-100
-50
0
50
100
150
200
250
300
350
4002006/07 2007/08 2008/09 2009/10 2010/11
2006/07 2007/08 2008/09 2009/10 2010/11
In situ toxicity monitoring Magela and Gulungul Creeks
Diff
eren
ce
Mea
n no
. of e
ggs
per s
nail
pair
-100
-50
0
50
100
150
200
250
300
350
400
Magela Difference (upstream - downstream)Magela Mean difference value
Magela Control site (upstream)Magela Exposed site (downstream)
Gulungul Control site (upstream) Gulungul Exposed site (downstream) Gulungul Difference (upstream - downstream) Gulungul Mean difference value
Figure 1 Time-series of snail egg production data from toxicity monitoring tests conducted inA: Magela Creek using creekside tests, and B Magela and Gulungul creeks using in situ tests
An assessment of the 2009–10 data (see Humphrey et al 2011) was not able to attribute any specific cause for this result and it remains the subject of ongoing investigation (see ‘Ranger stream monitoring research: Further analysis of toxicity monitoring data for Magela and Gulungul Creek’ pp 96–106, in this volume). The results for the 2010–11 season showed that, on average, egg numbers at the downstream site were again greater than those measured at the upstream control site (Figure 1B), with a mean upstream-downstream difference value of -12.8, a value intermediate between that observed in previous wet seasons and the value reported in 2009–10 (Figure 1A&B).
83

Toxicity monitoring in Magela and Gulungul creeks (C Humphrey, C Davies, M Ellis & D Buckle)
Given the statistically significant result observed in 2010 for Magela test results, a number of different statistical tests were applied to the 2010–11 wet season test results. These are described in Table 1, together with results of ANOVA testing.
Table 1 Results of ANOVA testing comparing upstream-downstream difference values for mean snail egg number for different ‘before versus after’ wet season scenarios
Statistical comparison Probability value (P) Significance
2009–10 compared with all previous seasons 0.046 at 5% level
2010–11 compared with all previous seasons 0.408 NS
2010–11 compared with previous seasons excl 2009-10 0.299 NS
2010–11 + 2009–10 compared with previous seasons 0.043 at 5% level
NS – not significant
The results indicate that the 2011 data continue the trend towards relatively higher downstream egg production that was also observed in 2010 (also evident in Figure 1B). Thus, when combined with 2010 data, the 2010 and 2011 seasons’ data are significantly different from previous seasons (Table 1). However, and as noted above, the magnitude of higher downstream egg production found in 2011 is not as marked as that observed in 2010. When the 2011 data are compared with previous seasons with the omission of 2010 data, there is no significant difference between the test results for the two time periods (Table 1). As noted above, detailed analyses are in progress to examine the possible causes of any recent trends towards higher downstream egg production in Magela Creek and these results are reported in the accompanying Ranger stream monitoring research paper.
Analysis of Gulungul Creek resultsResults for Gulungul Creek also show snail egg production at the downstream site was consistently higher than at the upstream site in 2010–11, with eight of the nine tests producing a negative difference value (Figure 1B). These results are in contrast to those observed during the previous (2009–10) season, when four out of the five tests conducted in Gulungul Creek resulted in positive difference values (indicating higher upstream egg production). Confirming this observation, ANOVA testing found a significant difference between the upstream-downstream difference data for 2011 compared with difference data for 2010 (P <0.05). In the accompanying Ranger stream monitoring research paper, the higher variability of egg production in Gulungul Creek, compared with that in Magela Creek, is noted. This higher variability appears to be associated with similar and higher (natural) variability in water quality observed between sites and between years in Gulungul Creek compared with water quality variation in Magela Creek.
The toxicity monitoring dataset for Gulungul Creek is currently too small to attribute any mine-related cause of the significant difference in between-site egg production observed between 2011 and 2010. Gulungul Creek toxicity monitoring data are being used with those from Magela Creek to develop an improved understanding of the contributions of different environmental factors to variations in snail egg production in the two creek systems. This understanding will improve the ability to distinguish between natural and mine-related contributions to the toxicity monitoring results.
84

Toxicity monitoring in Magela and Gulungul creeks (C Humphrey, C Davies, M Ellis & D Buckle)
ReferencesHumphrey C, Buckle D & Davies C 2009. Development of in situ toxicity monitoring
methods for Magela Creek. In eriss research summary 2007–2008. eds Jones DR & Webb A, Supervising Scientist Report 200, Supervising Scientist, Darwin NT, 86–90.
Humphrey C, Buckle D & Davies C 2011. In situ biological monitoring in Gulungul Creek. In eriss research summary 2009–2010. eds Jones DR & Webb A, Supervising Scientist Report 202, Supervising Scientist, Darwin NT, 79–80.
85

KKN 1.3.1 Surface water, groundwater, chemical, biological, sediment, radiological monitoring
Bioaccumulation of uranium and radium in freshwater mussels from Mudginberri Billabong
A Bollhöfer, B Ryan, C Humphrey & T Fox
IntroductionLocal indigenous people harvest aquatic food items, in particular mussels, from Mudginberri Billabong, 12 km downstream of the Ranger mine. Hence it is essential that they are fit for human consumption and that concentrations of metals and/or radionuclides in tissue and organs of aquatic biota attributable to mine-derived inputs from Ranger remain within acceptable safe levels. Enhanced concentrations (in µg·g-1 and Bq·g-1 , respectively) or loads (in µg or Bq per mussel) of mine-derived solutes in biota could also potentially reach limits that may harm the organisms themselves, as well as provide early warning of bioavailability of these dispersed constituents to the creek system. Hence the bioaccumulation monitoring program serves an ecosystem protection role in addition to the human health aspect.
Uranium and radium bioaccumulation data were obtained intermittently from Mudginberri Billabong between 1980 and 2000. Between 2000 and 2008, mussels were collected annually and fish every two years, respectively, from Mudginberri (the potentially impacted site, sampled from 2000 onwards) and Sandy Billabongs (the control site, sampled from 2002 onwards) (Ryan et al 2005; Brazier et al 2009). Results from monitoring and two research projects conducted in 2007 and 2008 and reported in previous ARRTC reports showed that radionuclide loads in mussels from Mudginberri Billabong were generally about twice as high compared with mussels from the reference site, Sandy Billabong. However, of all sites investigated along the Magela channel, Mudginberri Billabong mussels exhibit the lowest radium loads, age-for-age. These results have been published and it has been concluded that the differences in mussel radionuclide activity loads between Mudginberri and Sandy Billabong mussels are due to natural catchment rather than any mining influence (Bollhöfer et al 2011). Metal, in particular lead, uptake has been studied in mussels from the Magela catchment as well. The investigation has shown that the percentage of uranogenic lead relative to total lead concentrations in mussels in Mudginberri Billabong is small (< 2%) and overwhelmed by an additional source of industrial lead contributing via Corndorl and Gulungul creeks, or local sources within the Billabong itself (Bollhöfer 2011).
Nine years of monitoring of the levels of radionuclides and metals in fish had not shown any issues of potential concern with regards to bioaccumulation (Brazier et al 2009). Consequently, the effort on the bioaccumulation component of the monitoring program has been reduced to analysing annually a bulk sample of mussels for radionuclides and metals, while the two yearly fish sampling program has been discontinued. The fish bioaccumulation program will be restarted in the event it is shown that levels of metals being input from the mine (via the water quality monitoring program) increase above the current condition.
ResultsA summary of uranium concentrations in freshwater mussels, water and sediment samples collected from Mudginberri and Sandy Billabongs between 2000 and 2010 are shown in Figure 1. The mean concentrations of uranium in mussels from both Mudginberri and Sandy

Bioaccumulation of uranium and radium in freshwater mussels from Mudginberri Billabong (A Bollhöfer, B Ryan, C Humphrey & T Fox)
Billabongs are similar, with no evidence of an increasing trend in concentration in Mudginberri mussels over time.
0
0.25
0.5
0.75
1
1.25
Oct-2000
Oct-2001
Oct-2002
Oct-2003
Oct-2004
Oct-2005
Oct-2006
Oct-2007
Oct-2008
Oct-2009
Oct-2010
Collection date
U -
sedi
men
ts a
nd m
usse
l sof
t par
ts
mg
kg-1
(dry
wei
ght)
0
0.01
0.02
0.03
0.04
0.05
U -
wat
er µ
g L-1
Mean U conc. in mussel soft parts from Mudginberri Mean U conc. in mussel soft parts from control siteAcid leachable [U] in sediments MudginberriMean [U] in water Mudginberri
Figure 1 Mean concentrations of U measured in mussel soft-parts, sediment and water samples collected from Mudginberri and Sandy Billabongs from 2000 to 2010
The lack of any increase in concentration of U in mussel tissues through time, with essentially constant levels observed between 1989 and 1995 (as reported in previous reports), and consistently low levels from 2000 to the last sample taken in October 2010, indicates absence of any significant mining influence.
The average annual committed effective dose from radiation due to mussel consumption is calculated for a 10-year old child who eats 2 kg (wet weight) of mussel flesh from Mudginberri Billabong, using the activity concentrations of 226Ra and 210Pb measured in mussel flesh. The average of all collections from 2000 to 2010 is 0.18 mSv. Figure 2 shows the doses estimated for the individual years, and the median, 80 and 95 percentiles for all collections.
0.00
0.05
0.10
0.15
0.20
0.25
0.30
0.35
0.40
Oct-2000
Oct-2001
Oct-2002
Oct-2003
Oct-2004
Oct-2005
Oct-2006
Oct-2007
Oct-2008
Oct-2009
Oct-2010
collection date
com
mitt
ed e
ffect
ive
dose
[mSv
]
Figure 2 Annual committed effective doses from 226Ra and 210Pb for a 10 year old child eating 2 kg of mussels collected at Mudginberri Billabong. The median for all the data (solid line), the 80th percentile
(dashed line) and 95th percentile (dotted line) are shown for reference.
87

Bioaccumulation of uranium and radium in freshwater mussels from Mudginberri Billabong (A Bollhöfer, B Ryan, C Humphrey & T Fox)
Activity concentrations of 226Ra and 210Pb in mussels are age-dependent and are also related to growth rates and in particular seasonal soft body weights (Johnston et al 1984; Ryan et al 2008; Bollhöfer et al 2011). Consequently, 226Ra and 210Pb activity concentrations in mussels can vary depending on the timing of collection. As can be seen, annual committed effective doses from the consumption of mussels collected in 2010 are higher than in the previous 6 years, but still lower than the 95th percentile. This higher value is caused by higher concentrations of 226Ra in mussel flesh, potentially due to lower soft body weights of the mussels collected in 2010. Despite the higher value in 2010, committed effective doses due to ingestion of mussels continue to be of no concern to human health. The 226Ra in mussels originates from natural catchment sources, rather than any mining influence, as confirmed by the wet season median difference for 226Ra activity concentrations measured in Magela Creek (downstream minus upstream) over 10 wet seasons being close to zero (see discussion above). The average ingestion dose for the same scenario for Sandy Billabong mussels collected between 2002 and 2008 is approximately 0.1 mSv.
Future workStarting in the 2008/09 dry season bulk samples of mussels were collected annually from Mudginberri Billabong for re-assurance purposes, and the sampling at Sandy Billabong was discontinued. Back then it was proposed that the sampling program be reviewed every three years, a comparative study be conducted and the data from aged mussels compared with the historical record. Consequently, mussels have been collected from Mudginberri and Sandy Billabongs in October 2011, and mussels will be aged and then analysed for 226Ra and 210Pb activity and metal concentrations as per previous protocols.
ReferencesBollhöfer A 2011. Stable lead isotope ratios and metals in freshwater mussels from a uranium
mining environment in Australia’s wet-dry tropics. Applied Geochemistry, doi:10.1016/j.apgeochem.2011.10.002.
Bollhöfer A, Brazier J, Ryan B, Humphrey C & Esparon A 2011. A study of radium bioaccumulation in freshwater mussels, Velesunio angasi, in the Magela Creek catchment, Northern Territory, Australia. Journal of Environmental Radioactivity 102, 964–974.
Brazier J, Bollhöfer A, Ryan B & Humphrey C 2009. Bioaccumulation in fish and freshwater mussels from Mudginberri Billabong. In eriss research summary 2007–2008. eds Jones DR & Webb A, Supervising Scientist Report 200, Supervising Scientist, Darwin NT, 53–56.
Johnston A, Murray AS, Martin P & Leighton S 1984. Radium concentrations in freshwater mussels in the Alligator Rivers Region. Annual conference of the Australian Radiation Protection Society, Darwin, July 1984.
Ryan B, Martin P, Humphrey C, Pidgeon R, Bollhöfer A, Fox T & Medley P 2005. Radionuclides and metals in fish and freshwater mussels from Mudginberri and Sandy Billabongs, Alligator Rivers Region, 2000–2003. Internal Report 498, November, Supervising Scientist, Darwin. Unpublished paper.
88

KKN 1.3.1 Surface water, groundwater, chemical, biological, sediment, radiological monitoring
Monitoring using macroinvertebrate community structure
C Humphrey, L Chandler, C Camilleri & J Hanley
BackgroundMacroinvertebrate communities have been sampled from a number of sites in Magela Creek at the end of significant wet season flows, each year from 1988 to the present. The design and methodology have been gradually refined over this period (changes are described in the 2003–04 Supervising Scientist Annual Report, section 2.2.3). The present design is a balanced one comprising upstream and downstream sites on two ‘exposed’ streams (Gulungul and Magela Creeks) and two control streams (Burdulba and Nourlangie Creeks).
Samples are collected from each site at the end of each wet season (between April and May). For each sampling occasion and for each pair of sites for a particular stream dissimilarity indices are calculated. These indices are a measure of the extent to which macroinvertebrate communities of the two sites differ from one another. A value of ‘zero%’ indicates macroinvertebrate communities identical in structure while a value of ‘100%’ indicates totally dissimilar communities, sharing no common taxa.
Disturbed sites may be associated with significantly higher dissimilarity values compared with undisturbed sites. The extent of dissimilarity in community structure is the basis for the model that is used for impact detection.
ResultsCompilation of the full macroinvertebrate dataset from 1988 to 2011 has been completed. Figure 1 shows the paired-site dissimilarity values using family-level (log-transformed) data, for the two ‘exposed’ streams and the two ‘control’ streams.
For statistical analysis, dissimilarity values for each of the five possible, randomly-paired, upstream and downstream replicates within each stream were derived. These replicate dissimilarity values were then used to test, using ANOVA,whether or not macroinvertebrate community structure had altered significantly at the exposed sites for the previous wet season of interest compared to previous wet seasons. For this multi-factor ANOVA, only data gathered since 1998 were used. (Data gathered prior to this time were based upon different and less rigorous sampling and sample processing methods, and/or absence of sampling in three of the four streams).
Inferences that may be drawn from the time series data shown in Figure 1 are weakened because there are no pre-mining baseline (pre-1980) data upon which to assess whether or not significant changes have occurred as a consequence of mining. Notwithstanding, a four-factor ANOVA based upon replicate, paired-site dissimilarity values and using the factors Before/After (BA; fixed), Control/Impact (CI; fixed), Year (nested within BA; random) and Site (nested within CI; random) showed no significant difference between the control and exposed streams in the before (1998 to 2010) and after (2011) comparison (ie the BA x CI interaction is not significant). However, the BA x Site (CI) interaction for the same before-after comparisons was significant (p = 0.01) for the first time, which indicates the change in

Monitoring using macroinvertebrate community structure (C Humphrey, L Chandler, C Camilleri & J Hanley)
magnitude of paired-site dissimilarity in either, or both, exposure types (exposed and control streams) is not consistent within or between the before and after periods. This was further investigated to assess whether one of the exposed sites was responding differently to all other sites (and thereby indicate possible mining impact). Pair-wise tests conducted on the same data showed that the significant difference in the change in dissimilarity was associated with the Gulungul sites. This is examined in more detail below.
The Year (BA) x Site (CI) interaction was also significant in the same analysis (p = 0.024); this interaction has been shown to be significant in previous years as well and simply indicates that dissimilarity values for the different streams – regardless of their status (Before, After, Control, Impact) – show natural differences through time. This is evident in the upward and downward trends over time (eg a current downward trend in the Nourlangie paired-site dissimilarity, Figure 1).
For the 2011 dissimilarity data (Figure 1), a sharp rise in dissimilarity for Gulungul Creek can be observed. Closer examination of the data is required to assess whether or not this result may be associated with the Gulungul downstream site, and thereby indicate possible mining impact. Firstly, Multi-Dimensional Scaling (MDS) ordination was conducted to depict the relationship of the community sampled at any one site and sampling occasion with all other possible samples. The ordination can assist in determining whether the upstream and/or downstream Gulungul communities have changed or are aberrant compared to the other communities sampled over time. Secondly and to support the ordination, abundances of the numerically-dominant taxa were compared between the upstream and downstream sites over time to determine what types of shifts in taxa abundances may have occurred recently.
Figure 2 depicts the ordination derived using replicate within-site macroinvertebrate data. Data points are displayed in terms of the sites sampled in Magela and Gulungul Creeks downstream of Ranger for each year of study (to 2011), relative to Magela and Gulungul Creek upstream (control) sites for 2011, and all other control sites (Magela and Gulungul upstream sites, all sites in Burdulba and Nourlangie). Samples close to one another in the ordination indicate a similar community structure. The ordination indicates that Gulungul Creek communities collected from the upstream site in 2011 differ from communities from other sites and times (Figure 2). Conversely, data-points associated with the 2011 Gulungul and Magela downstream sites are generally interspersed among the points representing the control sites, indicating that these ‘exposed’ sites have macroinvertebrate communities that are similar to those occurring at control sites.
The aberrant 2011 Gulungul upstream result was further examined using PERMANOVA (PERmutational Multivariate ANalysis Of Variance) (Anderson et al 2008), a new multivariate statistical approach used to determine if a priori groups, exposure type (‘exposed’ Magela and Gulungul Creeks versus control Burdulba and Nourlangie Creeks) and site location (upstream versus downstream), and the interaction between these two factors, show significant differences.
PERMANOVA conducted on all replicate data from all available years and sites showed a significant difference for BA x Stream (CI) x Upstream/Downstream (p = 0.022). This indicates that differences between sites for streams within either, or both, exposure types are not consistent within or between the before and after periods. This might indicate that one exposed downstream site (Magela or Gulungul) is responding differently to all other downstream sites, and thus requires further investigation. A pair-wise comparison was undertaken to determine the nature of the significant difference. It indicated that of the exposed stream sites Gulungul Creek upstream had the only significant difference from the
90

Monitoring using macroinvertebrate community structure (C Humphrey, L Chandler, C Camilleri & J Hanley)
before to after periods and this supported the MDS plot (Figure 2). As Gulungul Creek upstream is not influenced by minesite activity, the changes at this site must be associated with natural or non-mine-related conditions. This result was further supported by examination of the taxa abundance information, as discussed below.
0
50
100
Year
Dis
sim
ilarit
y va
lue
(%)
0
50
100
0
50
100
0
50
100
Burdulba Creek
Nourlangie Creek
Magela Creek
Gulungul Creek
Figure 1 Paired upstream-downstream dissimilarity values (using the Bray-Curtis measure) calculated for community structure of macroinvertebrate families in several streams in the vicinity of the Ranger mine for the period 1988 to 2011. The dashed vertical lines delineate periods for which a different sampling and/or sample processing method was used. Dashed horizontal lines indicate mean dissimilarity across years. Dissimilarity values represent means (± standard error) of the 5 possible (randomly-selected) pairwise
comparisons of upstream-downstream replicate samples within each stream.
91

Monitoring using macroinvertebrate community structure (C Humphrey, L Chandler, C Camilleri & J Hanley)
3D stress = 0.2
Control sites Magela downstream Gulungul downstream
Magela control 2011 Gulungul control 2011
Magela downstream 2011 Gulungul downstream 2011
Figure 2 Ordination plot of macroinvertebrate community structure data from sites sampled in several streams in the vicinity of Ranger mine for the period 1988 to 2011. Data from Magela and Gulungul
Creeks for 2011 are indicated by the enlarged symbols.
Abundances of numerically-dominant taxa were examined between Gulungul upstream and downstream sites over time. This analysis found that, historically and typically, there are a greater proportion of taxa at the Gulungul upstream site with a preference for high velocity waters associated with this location in the creek (ie so-termed ‘flow-dependent’ taxa). While this remained the pattern in 2011, the abundances of these taxa at the upstream site in 2011 were unusually high compared with values found in previous years and were about three times the abundances observed at the downstream site in 2011 (Figure 3).
Year
1993
1994
1995
1996
1997
1998
1999
2000
2001
2002
2003
2004
2005
2006
2007
2008
2009
2010
2011
2012
Abu
ndan
ce (p
er m2 )
0
2000
4000
6000
8000
10000
12000
14000
16000
DownstreamUpstream
Figure 3 Total abundance of flow-dependent taxa collected from upstream and downstream Gulungul Creek sites over time. Flow dependent taxa include Simuliidae, Leptophlebiidae, Pyralidae,
Hydropsychidae and Philopotamidae.
92

Monitoring using macroinvertebrate community structure (C Humphrey, L Chandler, C Camilleri & J Hanley)
Given that dissimilarity values are sensitive to taxa abundances, this discrepancy in macroinvertebrate abundances between the Gulungul sites in 2011 can explain the increase in mean dissimilarity observed in the paired-site dissimilarity plot (Figure 1) and the separation of Gulungul upstream sample points observed in the ordination (Figure 2).
The habitat and flow conditions prevailing at the upstream Gulungul site in 2011 have yet to be examined closely to better interpret these results. However, given that rainfall for the 2010–11 wet season was the second highest on record, it would appear that the flow characteristics at the upstream Gulungul site in 2011 reflected correspondingly high flows favouring flow-dependant taxa, relative to both the downstream site and previous years.
Collectively, these graphical and statistical results provide good evidence that changes to water quality downstream of Ranger as a consequence of mining activities between 1994 and 2011 have not adversely affected macroinvertebrate communities.
ReferencesAnderson MJ, Gorley RN & Clarke KR 2008. PERMANOVA+ for PRIMER: Guide to
software and statistical methods. Primer-E: Plymouth, Plymouth Marine Laboratory, UK.
Clarke KR & Gorley RN 2006. Primer v6: User Manual/Tutorial, Primer E: Plymouth. Plymouth Marine Laboratory, Plymouth, UK.
Humphrey C, Chandler L & Hanley J 2009. Monitoring using macroinvertebrate community structure. In eriss research summary 2007–2008. eds Jones DR & Webb A, Supervising Scientist Report 200, Supervising Scientist, Darwin NT, 57–59.
Supervising Scientist 2004. Annual Report 2003–2004. Supervising Scientist, Darwin NT.
93

KKN 1.3.1 Surface water, groundwater, chemical, biological, sediment, radiological monitoring
Monitoring using fish community structureD Buckle, C Davies & C Humphrey
Assessment of fish communities in billabongs is conducted between late April and July each sampling year using non-destructive sampling methods applied in ‘exposed’ and ‘control’ locations. Two billabong types are sampled: deep channel billabongs studied every year, and shallow lowland (mostly backflow) billabongs dominated by aquatic plants which are studied every two years. Details of the sampling methods and sites were provided in the 2003–04 Supervising Scientist annual report (Supervising Scientist 2004, chapter 2, section 2.2.3). These programs were reviewed in October 2006 and the refinements to their design, respectively, are detailed in Buckle and Humphrey (2008, 2009).
For both deep channel and shallow lowland billabongs, comparisons are made between a directly-exposed billabong (Mudginberri) in the Magela Creek catchment downstream of Ranger mine versus control billabongs from an independent catchment (Nourlangie Creek and Wirnmuyurr Creek). The similarity of fish communities in exposed sites to those in control sites is determined using multivariate dissimilarity indices, calculated for each sampling occasion. The use of dissimilarity indices has been described and defined in ‘Monitoring using macroinvertebrate community structure’ section (above). A significant change or trend in the dissimilarity values over time could imply mining impact.
Channel billabongsThe similarity of fish communities in Mudginberri Billabong (directly exposed site downstream of Ranger in Magela Creek catchment) to those of Sandy Billabong (control site in the Nourlangie Creek catchment) was determined using multivariate dissimilarity indices calculated for each annual sampling occasion. A plot of the dissimilarity values from 1994 to 2011 is shown in Figure 1.
Year1993 1995 1997 1999 2001 2003 2005 2007 2009 2011
Dis
sim
ilarit
y va
lue
(%)
0
20
40
60
80
100
mean
Figure 1 Paired control-exposed dissimilarity values (using the Bray-Curtis measure) calculated for community structure of fish in Mudginberri (‘exposed’) and Sandy (‘control’) Billabongs in the vicinity of the Ranger Mine over time. Values are means ( standard error) of the 5 possible (randomly-selected)
pairwise comparisons of transect data between the two waterbodies.

Monitoring using fish community structure (D Buckle, C Davies & C Humphrey)
In previous reports, possible causes of trends in the annual paired-site dissimilarity measure over time have been advanced and assessed. Because the dissimilarity measure is most influenced by numerically-abundant fish species, it was possible to demonstrate that fluctuations in the measure over time were directly associated with longer-term changes in abundance in Magela Creek of the chequered rainbowfish (Melanotaenia splendida inornata), the most common fish species in this creek system (Supervising Scientist 2004, chapter 2, section 2.2.3). Thus, effort has been directed at understanding the possible causes of interannual variations in the abundance of this fish species in Magela Creek.
In Buckle et al (2010), a negative correlation between annual rainbowfish abundance in Mudginberri Billabong and the magnitude of wet season discharge (total for the wet season, January total and February total, GS8210009) was observed in Magela Creek. The negative relationship between rainbowfish in Mudginberri Billabong and wet season discharge identified in 2008–09 has been tested and remains significant (total for the wet season p=0.014, January total p=0.009 and February total p=0.014). This is supported by an examination of Figure 2 which shows the relatively low abundances of rainbowfish in Mudginberri Billabong in 2011 in relation to well-above annual discharge in Magela Creek for that wet season. It is possible that the reduced rainbowfish abundances after larger wet season flows indicates greater upstream migration of rainbowfish past Mudginberri Billabong, thereby reducing the concentration of fish in Mudginberri Billabong during the recessional flow period.
The paired-billabong dissimilarity value for 2011 is consistent with the range of values reported since 2001, a period over which there has been no evidence of mine-associated changes to fish communities in Mudginberri Billabong downstream of Ranger (Buckle et al 2010).
Ann
ual f
low
(G
L)
0
200
400
600
800
1000Total annual flow volume in Magela Ck
Mea
n fis
h nu
mbe
r per
tran
sect
Year
1988 1990 1992 1994 1996 1998 2000 2002 2004 2006 2008 2010 2012
100
300
500
1400 Chequered rainbowfish
Average
Mudginberri 1989 - 1993Mudginberri 1994 - 2011Sandy 1994 - 2011
Figure 2 Relative abundance of chequered rainbowfish in Mudginberri and Sandy billabongs from 1989 to 2011 with associated total discharge in Magela Creek (gauging station G8210009)
95

Monitoring using fish community structure (D Buckle, C Davies & C Humphrey)
Shallow lowland billabongsMonitoring of fish communities in shallow billabongs has usually been conducted every other year (see Buckle & Humphrey 2008). The last assessment of fish communities in shallow lowland billabongs was conducted in May 2009 with results reported in Buckle et al (2010). The scheduled sampling of fish communities in 2011 was postponed to enable staff resources to be dedicated towards an intensive sampling of other biota (phytoplankton, zooplankton and macroinvertebrate communities) in these shallow billabong habitats.
ReferencesBuckle D & Humphrey C 2008. Monitoring of Ranger mine using fish community structure.
In eriss research summary 2006–2007. eds Jones DR, Humphrey C, van Dam R & Webb A, Supervising Scientist Report 196, Supervising Scientist, Darwin NT, 56–59.
Buckle D & Humphrey C 2009. Monitoring of Ranger mine using fish community structure. In eriss research summary 2007–2008. eds Jones DR & Webb A, Supervising Scientist Report 200, Supervising Scientist, Darwin NT, 60–63.
Buckle D, Humphrey C & Davies C 2010. Monitoring using fish community structure. In eriss research summary 2008–2009. eds Jones DR & Webb A, Supervising Scientist Report 201, Supervising Scientist, Darwin NT, 88–92.
Supervising Scientist 2004. Annual Report 2003–2004. Supervising Scientist, Darwin NT.
96

KKN 1.3.1 Surface water, groundwater, chemical, biological, sediment, radiological monitoring
Ranger stream monitoring research: Further analysis of toxicity monitoring data
for Magela and Gulungul creeksC Humphrey, D Buckle & C Davies
BackgroundPrior to reading this summary, it is advisable to read both the introduction and results sections of the accompanying routine toxicity monitoring for the 2010–11 wet season paper to provide context for the research and development project outlined below.
Toxicity monitoring evaluates the responses of aquatic animals exposed in situ in Magela and Gulungul creeks to diluted runoff water from the Ranger minesite. Egg production by the freshwater snail, Amerianna cumingi, over a four day deployment period, has been the method used in Magela Creek since 1990–91 and in Gulungul Creek since 2009–10. Results of the tests have been reported in each of the Supervising Scientist’s annual reports (see ‘Toxicity monitoring in Magela and Gulungul Creeks’ pp 81–84, in this volume). After each wet season, the toxicity monitoring results for the tests are analysed, with differences in egg numbers (the ‘response’ variable) between the upstream (control) and downstream (exposed) sites tested for statistical change between the wet season just completed and previous wet seasons.
An atypically increased egg production at the downstream site relative to the upstream site was observed during the 2009-10 wet season. Specifically in this season, and unlike previous and the subsequent (2010–11) wet seasons, snail egg production in Magela Creek was found to be consistently (8 out of 9 tests; Figure 1) and significantly higher at the downstream site compared with the upstream site. The positive difference was particularly marked in the 3 rd
test and to a lesser extent in the 4th and 5th tests. An assessment of the 2009–10 data (see Humphrey, Davies & Buckle 2011), in the context of the physical and chemical variables being measured concurrently in Magela Creek, was not able to attribute any specific cause for this variance in test behaviour.
As a result of the above findings, a systematic program of work was initiated for the 2010–11 wet season to improve our understanding of environmental conditions affecting the production of snail eggs during the toxicity monitoring tests. This work was necessary to ensure that it is possible to clearly distinguish between natural and mine-induced effects on egg numbers between upstream and downstream sites. Three lines of work have been contributing to this improved understanding:
1 The extension of toxicity monitoring to Gulungul Creek: The different environmental conditions to which snails are exposed to in this relatively small catchment (compared to Magela Creek) enhances the information base of environment-response data available to identify likely correlates, and possibly causes, of differences in egg numbers at a given time and location in both creek systems.
2 The availability of four (Gulungul) and six (Magela) wet seasons of continuous data for electrical conductivity (EC), water temperature and turbidity at upstream and downstream monitoring sites (see ‘Toxicity monitoring in Magela and Gulungul Creeks’ pp 81–84, in
97

Ranger stream monitoring research: Further analysis of toxicity monitoring data for Magela and Gulungul creeks (C Humphrey, D Buckle & C Davies)
this volume). The continuous water quality data track in real time key physical and chemical conditions over the full four-day exposure period of each toxicity monitoring test, in contrast to the limited grab sample data (at beginning and end of each four-day deployment) that was previously available.
3 The availability of one wet season (2010–11) of quantitative data for the masses of inorganic and organic material deposited in snail test containers over the duration of each test at upstream and downstream monitoring sites in Magela and Gulungul creeks. These data are being used to assess whether organic (detrital) matter suspended in creek waters, and potentially able to become trapped in the test containers, could be enhancing the supply of food to snails during the test (noting that the current protocol involves supply of a quantum of food only at the beginning of the test), and hence increasing egg production at one creek site more than the other site.
This report examines progress made in applying the toxicity monitoring test to Gulungul Creek and in identifying from the continuous water quality record and from results of settled organic matter measurements for both Magela and Gulungul creeks, key environmental correlates of the snail egg production response.
Wet season
Diff
eren
ce
Mea
n no
. of e
ggs
per s
nail
pair
-100
-50
0
50
100
150
200
250
300
350
4002006/07 2007/08 2008/09 2009/10 2010/11
2006/07 2007/08 2008/09 2009/10 2010/11
In situ toxicity monitoring Magela and Gulungul Creeks
Diff
eren
ce
Mea
n no
. of e
ggs
per s
nail
pair
-100
-50
0
50
100
150
200
250
300
350
400
Magela Difference (upstream - downstream)Magela Mean difference value
Magela Control site (upstream)Magela Exposed site (downstream)
Gulungul Control site (upstream) Gulungul Exposed site (downstream) Gulungul Difference (upstream - downstream) Gulungul Mean difference value
Figure 1 Time-series of snail egg production data from toxicity monitoring tests conducted in Magela and Gulungul creeks using in situ tests
98

Ranger stream monitoring research: Further analysis of toxicity monitoring data for Magela and Gulungul creeks (C Humphrey, D Buckle & C Davies)
Comparison of toxicity monitoring results in Magela and Gulungul CreeksResults from the first season (2009–10) of the trial deployment of toxicity monitoring in Gulungul Creek were reported by Humphrey, Buckle and Davies (2011) while results for the 2010–11 season are reported in the routine stream monitoring paper associated with this report. The collective 2009–10 and 2010–11 results are further examined below.
Results (mean egg count per snail pair at upstream and downstream sites, and upstream-downstream difference values) for the snail reproduction tests conducted in both Magela and Gulungul creeks for the 2009–10 and 2010–11 wet seasons are plotted in Figure 1.
Analysis of variance (ANOVA) testing of the data from both creeks for the two years showed: (i) for egg count data, no significant differences in egg counts between years, streams or amongst sites; and (ii) for difference data, no significant differences between streams or years, but a significant Year × Stream interaction (P<0.001). This significant interaction was due to the higher difference values (or greater upstream egg production) observed in Gulungul Creek in 2009–10 compared with difference data from Gulungul Creek in 2010–11 and from Magela Creek for both seasons, and is discussed further in ‘Toxicity monitoring in Magela and Gulungul Creeks’ pp 81–84, in this volume.
The toxicity monitoring results from Figure 1 indicate greater variability between upstream and downstream sites in the egg counts from Gulungul Creek compared with the same response measured in Magela Creek. To further investigate this result, the snail egg data were compared with values for various water quality parameters. Water quality (temperature, EC, turbidity) differences were calculated from the medians of upstream and downstream values measured at a 10 minute frequency over each of the four-day tests conducted over the two wet seasons. The standard deviation of the four-day upstream-downstream difference values for the continuously monitored water quality variables and snail egg numbers in both Gulungul and Magela Creek were then derived. The results are shown in Table 1. The generally more variable (compared with Magela Creek) water quality in Gulungul Creek, caused by the greater proportional influence of runoff to the stream from catchment sources between the upstream and downstream sites in this relatively small drainage basin, may be responsible for the more variable biological response observed.
Table 1 Standard deviations (SD) of upstream-downstream difference values for water quality variables and snail eggs numbers in both Magela and Gulungul Creek for 2009–10 and 2010–11 wet seasons
Wet season Difference variable Magela SD Gulungul SD
2009–10
Snail egg numbers 23.6 32.5
Temperature (°C) 0.14 0.34
Conductivity (μS/cm) 3.14 2.81
Turbidity (NTU) 1.07 12.29
2010–11
Snail egg numbers 18.9 23.1
Temperature (°C) 0.09 0.48
Conductivity (μS/cm) 1.33 2.42
Turbidity (NTU) 1.21 3.36
99

Ranger stream monitoring research: Further analysis of toxicity monitoring data for Magela and Gulungul creeks (C Humphrey, D Buckle & C Davies)
Statistical power in this toxicity monitoring technique (ie the probability that a statistical test will correctly reject a false null hypothesis) is increased when, in the absence of human-related disturbance downstream of potential sources of impact, the upstream-downstream difference (response) values display low variability over time, ie concordance (or ‘tracking’) in egg number between upstream and downstream sites. This concordance is the typical pattern in Magela Creek (Figure 1) but appears to be less the case (based on an initial two years of data) for the pattern in Gulungul Creek. Identifying the factors responsible for differences in egg production between sites is important so that such variation may be accounted for and inferences about possible mining impact correctly attributed. This aspect is considered in the following two sections.
Relationships between the snail egg response and suspended inorganic and organic matterIt was suggested in Humphrey, Davies and Buckle (2011) that the increased downstream egg numbers observed in the 2009–10 wet season (see Background section 1 above) could have been due to additional organic matter being deposited in the snail test containers at the downstream location (see Humphrey, Davies & Buckle 2011). Such material could provide an additional source of food for the snails. This organic matter could come from inflows from Georgetown and Coonjimba Billabongs and/or from material eroded from recently-disturbed land adjacent to Magela Creek and associated with exploration activities. To assess if organic matter could be a contributing factor, the detrital material accumulating in the snail containers in both Magela and Gulungul Creeks during the 2010–11 wet season was collected and analysed for its content of inorganic and organic matter.
Relative measures of suspended inorganic (SIM) and organic (SOM) matter were obtained for each of the nine tests conducted in Magela Creek and for the final five (out of nine) tests conducted in Gulungul Creek. The test procedure involved placing replicate plastic jars, upright and without lids, at the base of each duplicate floating snail container (upstream and downstream) for the four day duration of the test. Material that had been deposited in a container was collected by filtering the dilute slurry through a glass fibre filter in the laboratory. The filter was then sequentially dried and ashed to estimate the inorganic and organic contributions to the total. The summary statistics for the measured data are shown in Figure 2.
Statistical analysis of the data summarised in Figure 2 indicated:
1 Across both creeks and all sites, SIM and SOM were highly (positively) correlated with one another (P<0.01);
2 While the amount of SIM did not differ significantly between creeks or sites (upstream vs downstream) (P>0.05), there was a tendency for SIM to be higher at the upstream sites compared with the downstream sites); and
3 SOM differed significantly (P<0.05) between creeks (higher in Magela) and was significantly higher at upstream sites compared to the downstream sites.
The best (positive) correlates of SOM and SIM with stream discharge variables (not shown) were with the maximum fall in water level in one continuous time period and the standard deviation (SD) of water level measured at 15 minute intervals. High variability in water level would reflect conditions that maximise turbulence and, hence, act to keep particulate matter in suspension in the creek and be available for deposition in the snail test containers. Apart from water level, SOM and SIM were also found to be correlated with other water quality variables, including EC and water temperature.
100

Ranger stream monitoring research: Further analysis of toxicity monitoring data for Magela and Gulungul creeks (C Humphrey, D Buckle & C Davies)
Inorganic
Sus
pend
ed M
atte
r (m
g/L)
0.0
0.2
0.4
0.6
0.8
1.0
1.2
Organic
0.00
0.05
0.10
0.15
0.20
0.25
0.30
Upstream Downstream Upstream
n = 5
n = 5
n = 10
n = 10
n = 10
n = 10
n = 5
n = 5
Gulungul Magela
Downstream
Figure 2 Boxplots of maximum and minimum values, lower and upper quartiles, and the median for suspended matter settling in floating snail containers located in Magela and Gulungul creeks for 2010–11 wet season. For sample size (n) ≥ 10, statistical outliers are indicated by closed circles.
No strong relationships were found between SOM and SIM and mean snail egg number measured in Magela and Gulungul creeks. All correlations between SIM and mean snail egg number were negative while most between SOM and mean snail egg number were positive. However, it is unlikely that this result indicates possible inhibition and enhancement by SIM and SOM, respectively, upon snail reproduction given that SOM values were actually higher at the upstream sites, whereas snail egg numbers were generally lower at the upstream sites. Thus, the hypothesis that SOM contributes to higher downstream egg production is not supported by the data obtained to date.
Notwithstanding the above apparently negative (ie no relationship between trapped SOM and increased egg numbers) outcome, collection of data for settled suspended matter will continue in ensuing wet seasons and will be used with the other continuous water quality data to better understand the environmental relationships of the snail egg response.
Identifying environmental correlates of snail egg production using continuous water quality dataContinuous monitoring data for the past five (Magela) or two (Gulungul) wet seasons (ie spanning the period of toxicity monitoring shown in Figure 1) were acquired for EC, water temperature and turbidity. Median values were calculated for upstream and downstream sites in both creeks from 10 minute readings measured over each of the four-day toxicity monitoring tests. Cross-correlations were sought between mean snail egg number per site and
101

Ranger stream monitoring research: Further analysis of toxicity monitoring data for Magela and Gulungul creeks (C Humphrey, D Buckle & C Davies)
each of the water quality variables. Correlations between upstream-downstream difference values and water quality variables are more difficult to interpret than those found for actual snail egg number because the difference values subsume variation that may be occurring at one or both sites. For this reason, subsequent analysis did not consider conditions affecting the difference values.
Snail egg number data for Magela Creek for the first two tests in the 2006–07 wet season (Figure 1) were unusually high when plotted together with egg number data from other years and with Gulungul Creek data, relative to EC, water temperature and turbidity. Combined egg number data (years and creeks) are plotted against EC in Figure 3, where the four egg number values >300 represent egg number at upstream and downstream sites for the first two 2007 tests. These values are clear outliers in the trend of increasing egg number with increasing EC. Possible causes of the high egg production in the early period of the 2006–07 wet season are discussed in section 6 below. As the egg production data for these tests were clearly unrelated to the water quality variables being investigated, they were omitted from further data analysis.
A number of significant correlations were observed between mean egg number and both EC and water temperature, but not turbidity. Details of the regression equations using pooled site, stream and year data for egg number and the two water quality variables (EC &T), alone or (from stepwise regression) in various combinations, are provided in Table 3. Scatter and summary box and histogram plots displayed a positive (but not significant) linear relationship between EC and egg number (Figure 3) and a quadratic relationship between water temperature and egg number, with a peak in egg number observed near 29°C (see Table 3, and the significant T2 term of regression (3) indicating a quadratic egg number-temperature relationship, evident in Figure 3). Because of the relationships evident between snail egg number and both EC and water temperature, there was potential for interaction between EC and water temperature and their effect upon snail egg production. This aspect was further examined experimentally, and statistically using (i) Analysis of Covariance testing (ANCOVA) to examine possible interaction between EC and water temperature, and (ii) subsequent multiple regression.
Table 3 Correlation coefficients and significance of independent variables for regression equations used to describe the relationship between mean snail egg count and key water quality variables in Magela and Gulungul creeks
Independent variable(s) Significance of independant variable (P value)
Significance of regression equation (P)
R2 value
(1) Electrical conductivity (EC) EC 0.08 0.078 0.03(2) Water temperature (T) T 0.362 0.362 0.008(3) T, T2 T 0.003 0.008 0.089
T2 0.003(4) EC, T, T2 EC 0.073 0.005 0.118
T 0.007
T2 0.006(5) EC, EC x T EC 0.015 0.017 0.076
EC*T 0.025(6) EC, T, EC x T EC 0.001 0.0029 0.136
EC*T 0.002T 0.009
(7) EC, T, T2, EC x T EC 0.021 0.0013 0.161
EC*T 0.024 T 0.048
T2 0.084
T2 = T squared or T x T
102

Ranger stream monitoring research: Further analysis of toxicity monitoring data for Magela and Gulungul creeks (C Humphrey, D Buckle & C Davies)
Since water temperature can be easily manipulated, a laboratory study was carried out to examine snail egg production using three temperatures (26, 29 and 32°C) spanning a range relevant to Magela and Gulungul Creeks. This experiment, conducted in the eriss Darwin ecotoxicology laboratory in October 2011, used an in-house protocol (Houston et al 2007, similar to the field protocol. This involves, exposing replicate pairs of snails for four days to Magela Creek water collected from upstream of the Ranger mine. Results of the laboratory experiment are provided in Figure 4. ANOVA showed significant difference in snail egg number between water temperature treatments. Tukey’s multiple comparison test showing no significant difference between egg numbers at 29 and 32°C, but significant differences in egg numbers between these two temperatures and 26°C.
Electrical conductivity (µS/cm)
Mea
n sn
ail e
gg n
umbe
r per
sna
il pa
ir
Figure 3 Box plots of mean snail egg number observed in in situ toxicity monitoring tests in Gulungul and Magela Creeks, 2007–2011, grouped according to ambient electrical conductivity in creek waters. Box plots show median, range, 25th and 75th percentiles. Points at a greater distance from the median
than 1.5 times the Inter-Quartile Range are plotted individually as asterisks (‘outliers’).
0
50
100
150
200
250
26 27 28 29 30 31 32
Mea
n eg
g nu
mbe
r pe
r sna
il pa
ir
Water temperature (°C)
Laboratory
Field
Figure 4 Effect of temperature on Amerianna cumingi egg production in laboratory and field (in situ) experiments (2006–07 to 2010–11 wet seasons). Data represent mean ± SE where N for laboratory
tests is 6 replicates per treatment.
103

Ranger stream monitoring research: Further analysis of toxicity monitoring data for Magela and Gulungul creeks (C Humphrey, D Buckle & C Davies)
Snail egg response data from the in situ toxicity monitoring tests were separated into groups for which the four-day median water temperature differed by one degree increments. Mean egg numbers for the field and laboratory tests are plotted against temperature, in Figure 4. The field results shown in Figure 4 confirm the optimum temperature for reproduction reached near 29°C, in accordance with the laboratory results. For the field results, egg number is not a smooth unimodal response over the temperature range and that variability is likely to be associated with the variability in water temperature itself observed over the four-day exposure periods (unlike the constant water temperatures maintained in the laboratory), and potential interaction with EC, median values for which varied amongst the different tests.
ANCOVA testing confirmed the observations above, finding a significant quadratic water temperature relationship with mean egg number (P<0.01). While the linear EC relationship with mean egg number was not significant (P = 0.078), a significant interaction was found between EC and water temperature (P<0.01) in the effect of these water quality variables upon mean egg number. Other important ANCOVA results included:
i Significant interaction between water temperature (Te) and year (Yr) (P<0.05) in their effect upon mean egg number, indicating the unimodal response between water temperature and egg number shifted or varied in intensity amongst years.
ii No significant interaction between either EC or Te and creek (Ck) or location (Loc) (upstream-downstream), indicating the EC and temperature effects were consistent for all (four) creek sites.
iii No significant interaction for EC x Te x Yr, EC x Te x Ck or EC x Te x Loc indicating the significant EC x Te effect was consistent amongst years, between the two creeks and between upstream-downstream locations.
The consistency of the EC x Te interaction amongst years, creeks and locations (from above) enabled pooling of the data to better characterise the EC x temperature effect. For this, plots of EC and snail egg number were prepared using one degree increments in median water temperature (Figure 5). The changing relationship of the snail reproduction response to EC with rising water temperature is evident, with enhanced effect with increasing EC at lower water temperatures (27–29°C), an increasingly neutral effect at intermediate temperature (~30) and an increasingly reduced/negative effect at higher water temperatures (>30). The possible physiological mechanism underpinning these observations is not considered further here. As the higher EC values (>20 µS/cm) are typically associated with the downstream sites (Figure 5), and are indicative of exposure to mine runoff waters containing MgSO4, then it can be concluded that mine water discharges are contributing to the differences in snail response at the downstream sites compared to the upstream sites, in addition to temperature and other natural environmental variables. However, over the commonly-observed temperature range observed in creek waters (28 to 31°C), representing 79% of the tests conducted in the 2007–2011 period, such effects (enhancement or suppression) are subtle and not significant (Figure 5).
Various multiple regression equations were calculated using stepwise regression on the pooled creek, location and year data to best account for the variation in mean egg number. These relationships are summarised in Table 3. The best multiple regression model for which all independent variables were significant (P<0.05) included the terms EC, T and EC x T (the third parameter representing the EC x temperature interaction). Even so, the amount of variation in egg number accounted for by the environmental factors included in this model was only 14% (see R2 values in Table 3), leaving a large amount of variation in egg number unaccounted for. Nevertheless, a conceptual understanding of the snail egg response is greatly enhanced with this regression approach.
104

Ranger stream monitoring research: Further analysis of toxicity monitoring data for Magela and Gulungul creeks (C Humphrey, D Buckle & C Davies)
The utility of this newly-acquired information on the snail egg response to EC and water temperature for assessing toxicity monitoring results is considered further below (section 5).
50
100
150
200
250
300Upstream
Downstream
29-30°C
Mea
n eg
g nu
mbe
r per
sna
il pa
ir
Electrical conductivity (µS/cm)
50
100
150
200
250
300
5 10 15 20 25 30
Upstream, 31-32
Downstream, 31-32
Upstream, 32-33
Downstream, 32-33
31-33°C
50
100
150
200
250
300UpstreamDownstream
27-28°C Upstream
Downstream
28-29°C
5
5
5 10 15 20 25 30
Upstream
Downstream
30-31°C
3
3
4
4
R2 = 0.39 P < 0.05
Figure 5 Relationship between mean snail egg number and median electrical conductivity for the field tests, conducted in both Magela and Gulungul creeks, 2007 to 2011, grouped by increasing (one-
degree) median water temperature increments from 27 degrees to 33 degrees . Significant trend line indicated by solid line and non-significant trend lines by dashed lines. Data from the 3rd, 4th and 5th tests of the 2009–10 season for Magela Creek are indicated by numbers 3, 4 and 5 respectively, adjacent to
the relevant data points.
Assessment of toxicity monitoring results from 2009–10 wet season using snail egg number-environment relationshipsUsing the enhanced conceptual understanding of the response of snail reproduction to EC and water temperature described above, and the results to date that indicate the amounts of SIM and SOM trapped in the test containers do not enhance egg numbers, the results of toxicity monitoring results for which significant disparities have been observed in snail egg number between upstream and downstream sites, can be reassessed. Such disparities were identified above (see Background section 1) for the 3rd, 4th and 5th tests of the 2009–10 season, where mean egg number was markedly higher (especially test 3) at the downstream site compared with the upstream site (Figure 1). Median EC and mean egg number values for the upstream and downstream sites for the three tests are marked (numbers 3, 4, 5) in their respective water temperature groups in Figure 4.
105

Ranger stream monitoring research: Further analysis of toxicity monitoring data for Magela and Gulungul creeks (C Humphrey, D Buckle & C Davies)
In general, the water quality conditions observed at the sites during the three tests are characterised by either lower EC and/or relatively higher water temperature which, according to the EC-egg number relationships (Figure 4), are conducive to a relative suppression in snail reproductive activity. The warmer waters observed during the third and fourth tests, in particular, were associated with either low flow conditions or the generally warmer conditions associated with a wet season of relatively low rainfall. The mine-related higher EC recorded at the downstream site over the same period of testing, may have reduced the extent of suppression that would otherwise have occurred for Test 5. Otherwise, the upstream values for Tests 3 and 4 appear to be further from the trend lines (lower than expected) than are the corresponding downstream values for the particular temperature regimes, indicating the disparity in egg number between the sites may be largely associated with conditions at the upstream control site.
ConclusionsThe results reported above contribute significantly to an improved understanding of the environmental factors affecting snail egg response in local creek waters. However, the relatively low predictive power of the regression equations relating egg number to EC and water temperature clearly indicate, apart from variation in the egg laying response itself, that other unmeasured factors are contributing to snail reproductive response. Wet seasons of relatively low rainfall (such as 2009–10), for example, are also associated with relatively lower catchment runoff and delivery of nutrients and suspended organic matter to receiving waters. Measurement of variables that reflect such food availability for stream organisms will be pursued further, noting the lack of correlation between egg number and SIM and SOM found during the 2010–11 wet season suggests that dissolved nutrients may also need to be investigated. In this context freshwater snails elsewhere have been shown to be able to utilise dissolved organic carbon as a food source (Thomas & Kowalczyk 1997).
The loadings of dissolved and suspended organic matter in receiving waters will likely vary considerably between wet seasons. In particular, for seasonally-flowing streams subject to alternating high and low rainfall periods (see Figure 2.1 in Supervising Scientist 2011), it could be expected that there would be a very significant pulse flush of landscape-derived nutrients and organic matter to streams when switching from a low to a high rainfall period. This has been described as the ‘flood pulse concept’ (Junk et al 1989).
The comparatively high egg counts observed for the first three in situ tests conducted in the 2006–07 wet season (Figure 1) may be an indication of such a pulse effect (ie a high rainfall year following several below-average rainfall years), given that the EC and water temperature data associated with these tests no not account for the high egg numbers observed. It is likely that time series analysis of long-term flow data will provide a more fruitful line of investigation in explaining and accounting for such variation. In addition more detailed data will be recorded on snail health and physical characteristics (eg body weights) in the aquaculture facility to see if additional influencing environmental variables can be identified with potential direct relevance to the field condition.
A watching brief will be maintained with ongoing annual assessment and analysis of the long-term data series, in the context of water quality and stream flow variables. It is anticipated that collection of of trapped suspended matter will continue for at least one more wet season. Consideration will also be given to establishing a test program to investigate the effects of specific dissolved nutrients (including major ions) following the outcome of a review of what is currently known about the dependence of freshwater snails on dissolved nutrient concentrations.
106

Ranger stream monitoring research: Further analysis of toxicity monitoring data for Magela and Gulungul creeks (C Humphrey, D Buckle & C Davies)
ReferencesHouston M, Hogan A, van Dam R & Nou S 2007. Procedure for the 96 hour gastropod
reproduction toxicity test using Amerianna cumingi. Internal Report 525, June, Supervising Scientist, Darwin. Unpublished paper.
Humphrey C, Buckle D & Davies C 2011. In situ biological monitoring in Gulungul Creek. In eriss research summary 2009–2010. eds Jones DR & Webb A, Supervising Scientist Report 202, Supervising Scientist, Darwin NT, 79–80.
Humphrey C, Davies C & Buckle D 2011. Toxicity monitoring in Magela Creek. In eriss research summary 2009–2010. eds Jones DR & Webb A, Supervising Scientist Report 202, Supervising Scientist, Darwin NT, 56–65.
Junk WJ, Bayley PB & Sparks RE 1989. The flood pulse concept in river floodplain systems. In Proceedings of the International Large River Symposium (LARS), ed P Dodge. Canadian Special Publication of Fisheries and Aquatic Sciences, Ottawa, Canada, 110–127.
Supervising Scientist 2011. Annual report 2010–2011. Supervising Scientist, Darwin.
Thomas JD & Kowalczyk C 1997. Utilization of dissolved organic matter (DOM), from living macrophytes, by pulmonate snails: Implications to the ‘food web’ and ‘module’ concepts. Comparative Biochemistry & Physiology 117A, 105–119.
107


