ST 305: Final Exam By handing in this completed exam, I state that I have neither given nor received assistance from another person during the exam period. I have not copied from another person’s paper. I have used no resources other than the exam itself and the basic mathematical functions of a calculator (ie, no notes, electronic communication, notes stored in calculator memory, etc.). I have not used my calculator to compute values from statistical functions such as the standard normal or t. I understand that the penalty if I am found guilty of any such cheating will include failure of the course and a report to the NCSU Office of Student Conduct. I understand that I must show all work/calculations, even if they seem trivial, to get credit for my answers. Answers without proper justification/defense will get no or reduced credit. Name: ID#: x = 1 n x i ∑ s 2 = ( x i − x ) 2 ∑ n − 1 Z = X − μ σ r = x i − x s x ⎛ ⎝ ⎜ ⎞ ⎠ ⎟ ∑ y i − y s y ⎛ ⎝ ⎜ ⎞ ⎠ ⎟ n − 1 b 1 = r s y s x b 0 = y − b 1 x residual = y − ˆ y PA or B ( ) = P( A) + P( B) PA C ( ) = 1 − PA ( ) PA and B ( ) = P( A) × P( B) μ X = x i p i ∑ μ a + bX = a + bμ X μ X +Y = μ X + μ Y σ X 2 = x i − μ X ( ) 2 p i ∑ σ a + bX 2 = b 2 σ X 2 σ X +Y 2 = σ X 2 + σ Y 2 σ X −Y 2 = σ X 2 + σ Y 2 σ X +Y 2 = σ X 2 + σ Y 2 + 2 ρσ X σ Y σ X −Y 2 = σ X 2 + σ Y 2 − 2 ρσ X σ Y PA or B ( ) = P( A) + P( B) − PA and B ( ) PA and B ( ) = P( A)P( B | A) P( B | A) = PA and B ( ) P( A) μ X = np σ X = np 1 − p ( ) ˆ p = X / n μ ˆ p = p σ ˆ p = p 1 − p ( ) n P( X = k ) = n! k !(n − k )! p k (1 − p) n − k μ X = μ σ X = σ n m = z * σ n x ± m z = x − μ 0 σ n n = z * σ m ⎛ ⎝ ⎜ ⎞ ⎠ ⎟ 2
Transcript
ST 305: Final Exam
By handing in this completed exam, I state that I have neither given nor received assistance from another person during the exam period. I have not copied from another person’s paper. I have used no resources other than the exam itself and the basic mathematical functions of a calculator (ie, no notes, electronic communication, notes stored in calculator memory, etc.). I have not used my calculator to compute values from statistical functions such as the standard normal or t. I understand that the penalty if I am found guilty of any such cheating will include failure of the course and a report to the NCSU Office of Student Conduct. I understand that I must show all work/calculations, even if they seem trivial, to get credit for my answers. Answers without proper justification/defense will get no or reduced credit.
Name:
ID#:
x =1n
xi∑
s2 =(xi − x )2∑n −1
Z =X − µσ
r =
xi − xsx
⎛⎝⎜
⎞⎠⎟∑ yi − y
sy
⎛
⎝⎜⎞
⎠⎟
n −1
b1 = rsysx
b0 = y − b1xresidual = y − yP A or B( ) = P(A) + P(B)
P AC( ) = 1− P A( )P A and B( ) = P(A) × P(B)
µX = xi pi∑µa+bX = a + bµX
µX+Y = µX + µY
σ X2 = xi − µX( )2 pi∑
σ a+bX2 = b2σ X
2
σ X+Y2 = σ X
2 +σY2
σ X−Y2 = σ X
2 +σY2
σ X+Y2 = σ X
2 +σY2 + 2ρσ XσY
σ X−Y2 = σ X
2 +σY2 − 2ρσ XσY
P A or B( ) = P(A) + P(B) − P A and B( )P A and B( ) = P(A)P(B | A)
P(B | A) =P A and B( )
P(A)
µX = np
σ X = np 1− p( )p = X / nµ p = p
σ p =p 1− p( )
n
P(X = k) = n!k!(n − k)!
pk (1− p)n− k
µX = µ
σ X = σ n
m = z*σ nx ± m
z =x − µ0σ n
n =z*σm
⎛⎝⎜
⎞⎠⎟
2
Simple Linear Regression
b1 = rsysx
; b0 = y − b1x
ei = yi − yi; s2 =ei
2∑n − 2
bj ± t*SEbj
; t =bjSEbj
df = n − 2
µy ± t*SEµ; y ± t*SEy
SST = yi − y( )∑ 2
SSM = yi − y( )∑ 2
SSE = yi − yi( )∑ 2
SEb1=
s
xi − x( )2∑
SEb0= s
1n+
x 2
xi − x( )2∑
SEµ = s1n+
x* − x( )2
xi − x( )2∑
SEy = s 1+ 1n+
x* − x( )2
xi − x( )2∑Multiple regression changes:
s2 =ei
2∑n − p −1
df = n − p −1
x ± t* sn
, df = n −1
x1 − x2( ) ± t* s12
n1
+s2
2
n2
, df = min(n1,n2 ) −1
t =x − µ0
sn
, df = n −1
t =x1 − x2
s12
n1
+ s22
n2
, df = min(n1,n2 ) −1
x1 − x2( ) ± t*sp1n1
+1n2
, df = n1 + n2 − 2
t =x1 − x2
sp1n1
+ 1n2
, df = n1 + n2 − 2
sp2 =
(n1 −1)s12 + (n2 −1)s2
2
n1 + n2 − 2
ψ = aiµi , c =∑ aixi∑
SEc = spai
2
ni∑
Definitions. (1 point each) Clearly define each of the following terms. 1. Distribution: 2. Correlation: 3. Parameter:
4. Unbiased estimate:
5. Margin of Error:
6. Double blind experiment:
7. Simple Random Sample: 8. Power (of a test): 9. Central Limit Theorem: 10. Type I Error:
Pick the Procedure. (2 points each) Select the procedure that would be the best approach to answer each of the following questions. You only need to give the letter of the answer (please write it clearly to the left of each question, or lose 1 point). CI: confidence interval, HT: hypothesis test
a. CI for a single mean b. HT for a single mean c. CI for a difference in two means d. HT for a difference in two means e. Matched Pairs CI f. Matched Pairs HT g. Simple linear regression h. Multiple linear regression i. 1-Way ANOVA - CI j. 2-Way ANOVA- HT
11. Are there differences in the number of hours per week freshmen, sophomores,
juniors, and seniors spend working at part-time jobs?
12. Do Congressional committees with more members propose more laws? 13. How well does a collection of six measures of health predict a person’s lifespan? 14. Does the number of drug side effects decrease after a patient starts an exercise
program? 15. What is the average number of people who travel on I-40 between Raleigh and
Durham each day? 16. Do Democrats tend to have lower salaries than Republicans? 17. In a typical day, how many more people visit Amazon.com than Target.com? 18. Do companies that advertise on more web sites tend to have higher profits? 19. Are cholesterol levels impacted by the number of servings of meat one eats per week? 20. Is the average final exam grade higher for classes with exams on the last day of the
finals period than it is for those with exams on the first day?
Multiple Choice. (2 points each) 21. A 95% prediction interval based on n = 20 observations will be a. narrower than a 95% CI for mean response based on the same data b. narrower than a 90% prediction interval based on the same data c. wider than a 90% CI for mean response based on the same data 22. If X and Y are independent with standard normal distributions, Z = X +Y has mean a. 0 b. 1 c. 2 23. A multiple regression analysis with a value of R2 near 0 indicates a. that at least one of the explanatory variables are useful for predicting y. b. that none of the explanatory variables are statistically significant c. that the explanatory variables explain little of the variation of y 24. The null hypothesis tested by the ANOVA F-test in 1-Way ANOVA is a. All the slopes are zero b. At least one mean is different from the others c. All treatments have the same mean 25. If X ~ N(10,2) , the standard deviation of a sample mean computed from a SRS of
that population a. Is greater than 2 b. Is less than 2 c. We can’t say- it depends on the sample size. 26. When doing an ANOVA analyses where we don’t have any prior knowledge about
which groups are likely to have the highest response values, we are most likely to use a. Contrasts b. Multiple comparison procedures c. Pooled t procedures 27. If we increase the sample size of a test using significance level 0.05, then a. The probability of a Type I error will increase b. The probability of a Type I error will decrease c. The probability of a Type I error will remain the same
28. The Law of Large Numbers tells us that a. Large samples have normal distributions b. In large samples, the sample mean will be close to the population mean c. In large samples, estimates tend to be unbiased.
29. Stemplots would be most useful in conjunction with a. Analyses of a single population b. Simple linear regression analyses c. 1-Way ANOVA analyses
30. In the SAS output above, the explanatory variable a. has a statistically significant effect on the response variable b. explains almost all of the variation in the response variable c. appears to have a nonlinear relationship with the response variable 31. In the SAS output above, the Total Mean Squares (MST) is a. 286.66 b. 13.35 c. 36.22
32. The output above is from an analysis investigating the linear relationship between the heights of mothers and daughters. Use it to answer all of the following: a) What was the name of the explanatory variable? (1 point)
b) What was the name of the response variable? (1 point)
c) What was the statistical model used for this analysis (show the math, not just a name)? (2 points)
d) Provide numerical estimates for all three of the model parameters (2 points)
e) What is the predicted value of the response variable when the explanatory variable has a value of 10? (2 points)
f) Give a 95% confidence interval for the slope of the line relating these two variables. (3 points)
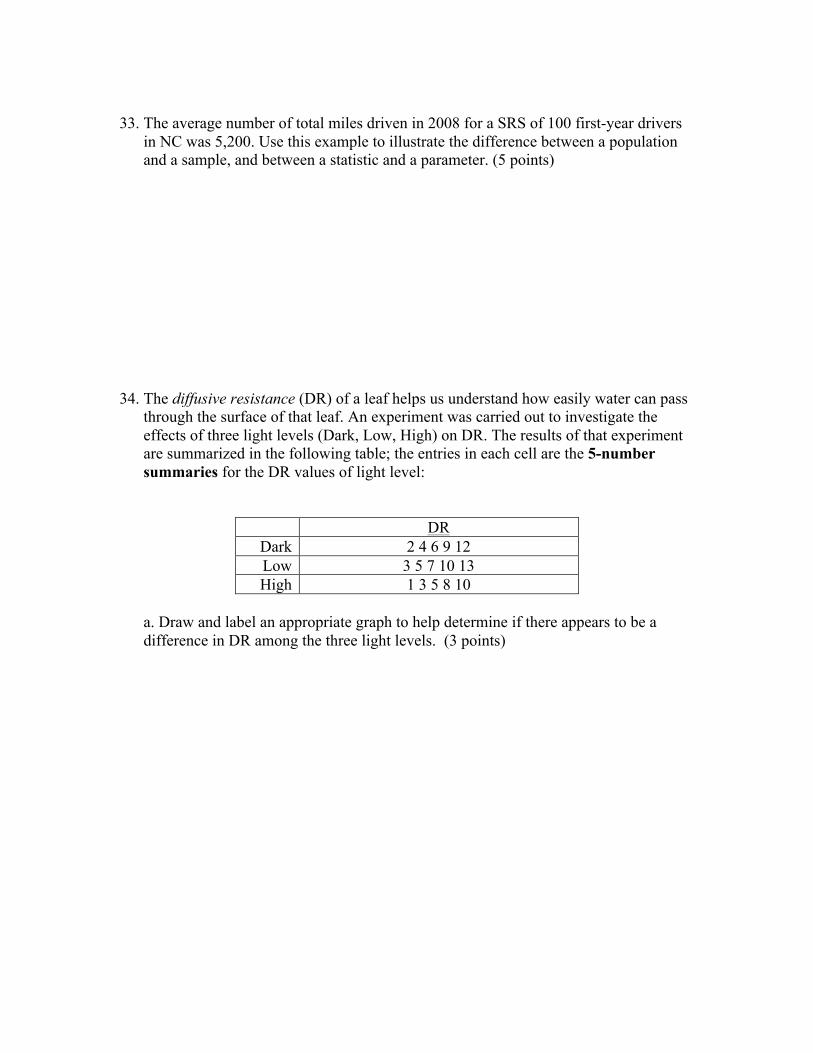
33. The average number of total miles driven in 2008 for a SRS of 100 first-year drivers
in NC was 5,200. Use this example to illustrate the difference between a population and a sample, and between a statistic and a parameter. (5 points)
34. The diffusive resistance (DR) of a leaf helps us understand how easily water can pass through the surface of that leaf. An experiment was carried out to investigate the effects of three light levels (Dark, Low, High) on DR. The results of that experiment are summarized in the following table; the entries in each cell are the 5-number summaries for the DR values of light level:
DR Dark 2 4 6 9 12 Low 3 5 7 10 13 High 1 3 5 8 10
a. Draw and label an appropriate graph to help determine if there appears to be a difference in DR among the three light levels. (3 points)
(34-continued) Here is the ANOVA Table for analyzing the data above.
Source df SS MS F P-value Model 2 30 15 (III) 0.0015 Error (I) 90 (II) Total 47 120
b. What are the missing values labeled (I), (II), and (II) above? (1 point each)
I: II: III:
c. What is the factor(s) in this study? What are the levels of each factor? (2 points)
d. Are there statistically significant differences among the three light levels? Justify your answer. (2 points)
e. Do differences in light level do a good job of explaining the observed variation in dispersive resistance? Justify your answer (3 points)
35. The following data are 15 consecutive measures of monthly CO2 levels at the Mauna Loa Observatory in Hawaii. The sample standard deviation for CO2 level is 1.98.
Month CO2 Month CO2 Month CO2 1 33 6 36 11 32 2 33 7 35 12 33 3 35 8 33 13 34 4 36 9 31 14 35 5 37 10 31 15 37 a. Display the distribution of CO2 levels. (3 points) b. Make a plot to look for a relationship between Month and CO2 level. (3 points)
(35 continued) c. Provide a numerical summary of the distribution of CO2 levels. (2 points)
Assume that CO2 levels at Mauna Loa are known to follow a normal distribution. d. Compute a 95% CI for the mean monthly CO2 level. (3 points)
e. Is there strong evidence that the mean monthly CO2 level is greater than 33? Justify your answer with a rigorous statistical calculation. (4 points)
36. Advil, Motrin, and Nuprin are all name brand versions of the drug Ibuprofen. Design an experiment using 120 subjects to determine if the three drugs are effective in reducing fever in children, and whether there are differences between the drugs. Explain what treatments you would use, how you would allocate subjects to treatments, and point out how you use good principles of experimental design. Finally, tell which statistical methods you would use to analyze the resulting data, and what specific questions they would address. (5 points)