25
St. Augustine Grass Phosphorus Requirement Min Liu Advisor: J. B. Sartain Soil and Water Science The University of Florida May 27, 2005
| Date post: | 03-Jan-2016 |
| Category: |
Documents |
| Upload: | prudence-blake |
| View: | 214 times |
| Download: | 0 times |

St. Augustine Grass
Phosphorus RequirementMin Liu
Advisor: J. B. Sartain
Soil and Water Science
The University of Florida
May 27, 2005
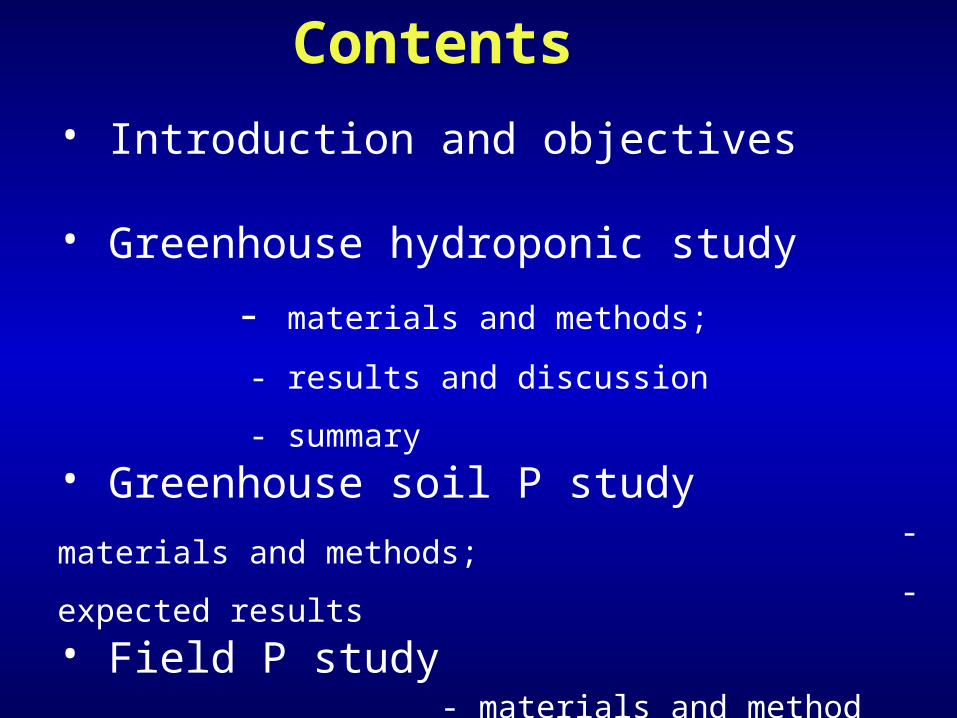
• Introduction and objectives
• Greenhouse hydroponic study - materials and methods; - results and discussion - summary
• Greenhouse soil P study - materials and methods; - expected results
• Field P study - materials and method - expected results
Contents
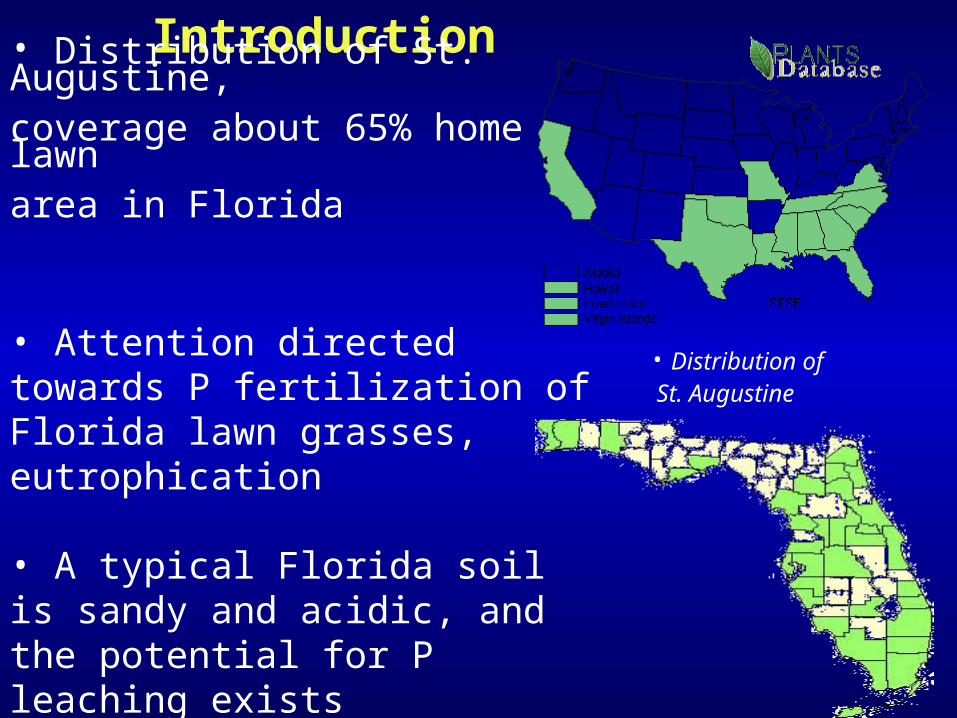
Introduction
• Distribution of St. Augustine,coverage about 65% home lawnarea in Florida
• Attention directed towards P fertilization of Florida lawn grasses, eutrophication
• A typical Florida soil is sandy and acidic, and the potential for P leaching exists
• Distribution of St. Augustine

• P requires to be scrutinized and monitored to reduce the amount of P that ends up as runoff or leachate
• P fertilization of Florida lawn grasses is based on soil tests
• Little information exists relative to the exact P requirement of Florida lawn grasses and fertilization levels
Introduction
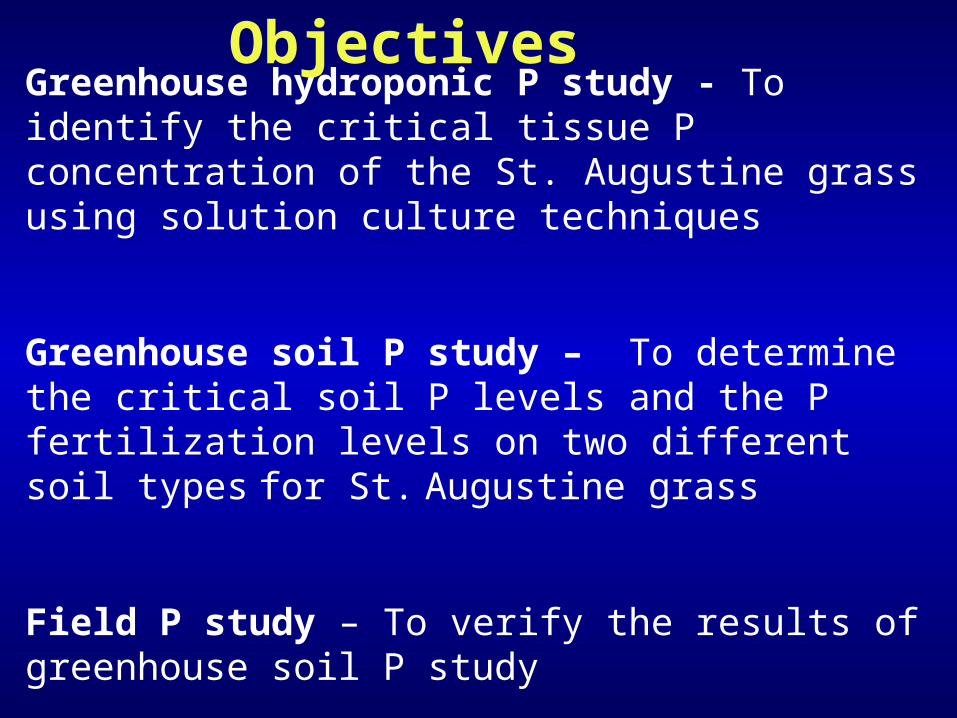
Greenhouse hydroponic P study - To identify the critical tissue P concentration of the St. Augustine grass using solution culture techniques
Greenhouse soil P study – To determine the critical soil P levels and the P fertilization levels on two different soil types for St. Augustine grass
Field P study – To verify the results of greenhouse soil P study
Objectives

Greenhouse hydroponic study Materials and methods
• Six starting levels of P in solution (0, 1.24, 6.2, 31, 155 and 775 ppb ), replicated 5 times
• A total of 30 experimental units
• Study period: June 27, 2004 -- March 14, 2005
• Sods were taken from Hort. Unit, the initial tissue P was high
• Soils washed away from roots, then grass cut into size of the solution tub and put onto the screen of the solution tub
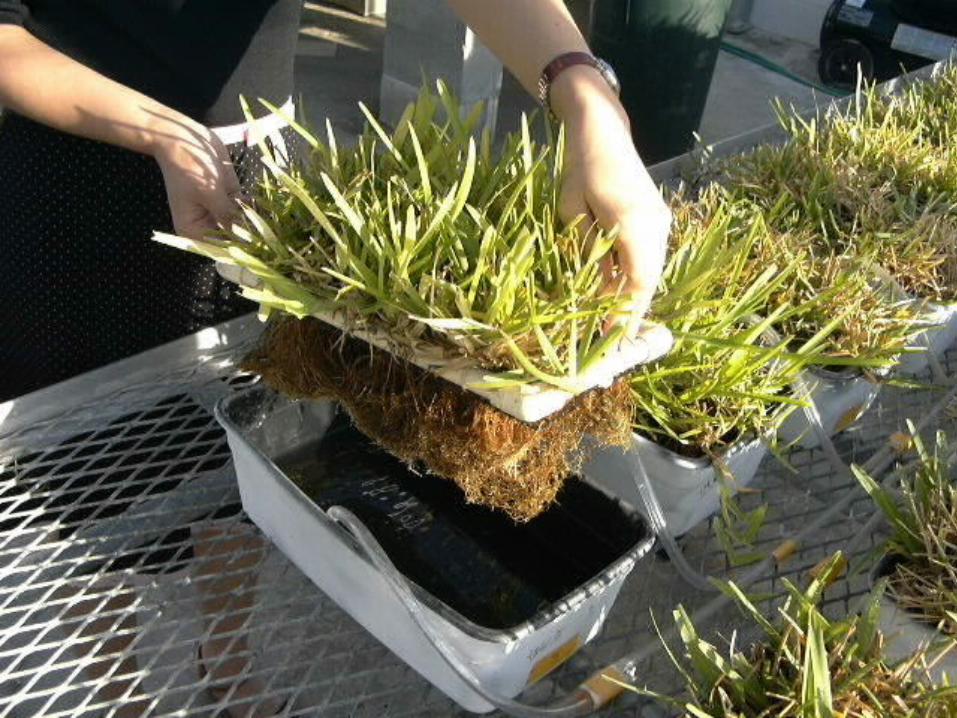

Experiment Design: CRD
Greenhouse hydroponic study

Solution Culture Techniques Reference Nutrient Conc.
Micro-Micro-nutrientsnutrients sourcesource mgmg dmdm-3-3
FeFeSequestrene Sequestrene Fe330Fe330 0.060.06
BB HH33BOBO33 0.050.05
MnMn MnClMnCl22.4H.4H
22OO 0.050.05
CuCu CuClCuCl22.2H.2H
22OO 0.0020.002
ZnZn ZnClZnCl22 0.0050.005
MoMo NaNa22MoOMoO
44.2H.2H22OO 0.0050.005
ClCl MnClMnCl22.4H.4H
22OO 0.0720.072
CuClCuCl22.2H.2H
22OO
ZnClZnCl22
Macro-Macro-nutrientsnutrients sourcesource mmol mmmol m-3-3
KK+ + KK22SOSO44 13 13 (0.5ppm)(0.5ppm)
CaCa2+2+ Ca(NOCa(NO33))22.4H.4H
22OO 9+?9+?
Ca(HCa(H22POPO
44))22.H.H22OO
MgMg2+2+ MgSOMgSO44.7H.7H
22OO 1010
NONO33
-- Ca(NOCa(NO33))22.4H.4H
22OO 18+8.518+8.5
NHNH44NONO
33
NHNH44
++ NHNH44NONO
33 8.58.5
SOSO44
2-2- MgSOMgSO44.7H.7H
22OO 10+6.510+6.5
kk22SOSO44
HH22POPO44
-- Ca(HCa(H22POPO
44))22.H.H22OO 0.04 -- 250.04 -- 252 Times of References are used

Data to be collected:
• Tissue Growth Rates
• Tissue P Levels
• Turfgrass Quality
• Root Growth Rates

0
1
2
3
4
5
6
7/19 8/18 9/17 10/17 11/16 12/16 1/15 2/14 3/16 4/15
Month/Day (2003-2004)
Tis
sue
P (
g kg
-1)
0
1.24
6.2
31
155
775
Solution P
(ppb)
Results and Discussion
Results and Discussion
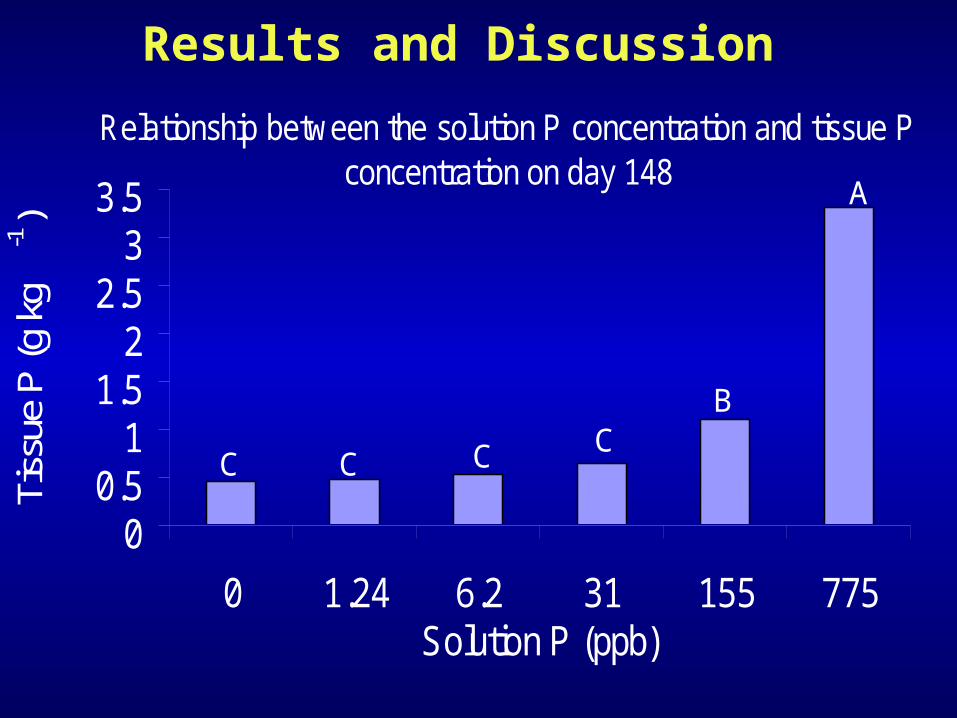
Relationship between the solution P concentration and tissue Pconcentration on day 148
00.5
11.5
22.5
33.5
0 1.24 6.2 31 155 775Solution P (ppb)
Tiss
ue P
(g k
g-1
)
C C C CB
A
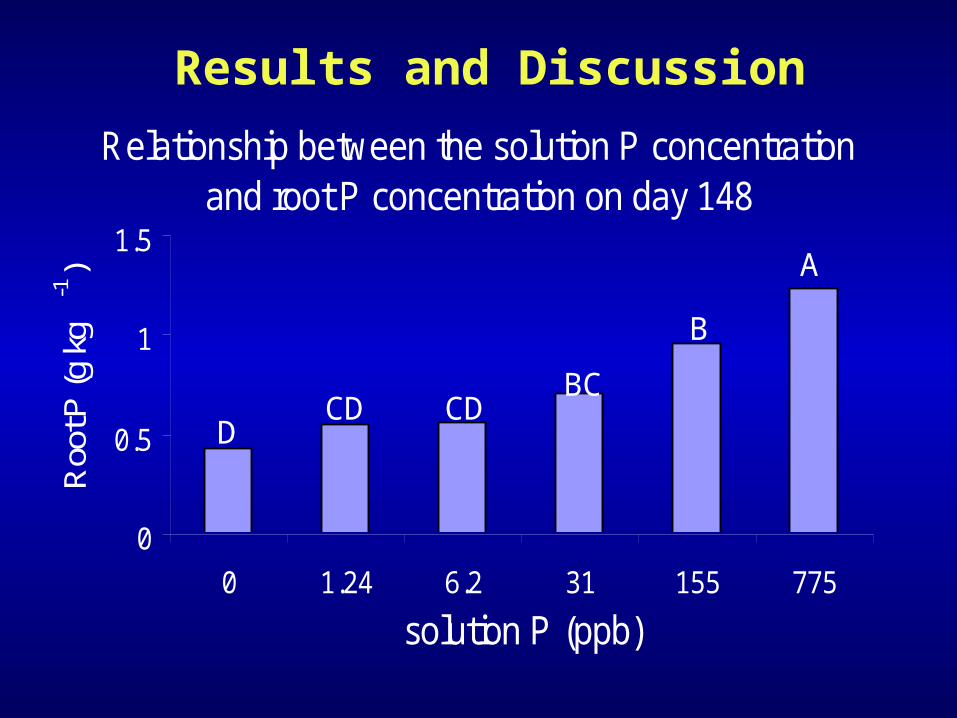
Relationship between the solution P concentrationand root P concentration on day 148
0
0.5
1
1.5
0 1.24 6.2 31 155 775
solution P (ppb)
Roo
t P (g
kg
-1)
Results and Discussion
DCD CD
BC
B
A

Results and Discussion
1
1.5
2
2.5
3
3.5
0 1.24 6.2 31 155 775
Solution P (ppb)
Ro
ot
gro
wth
ra
te
(g m
-2 d
ay-1
)
A
B B
AB AB AB

Results and Discussion
1
2
3
4
5
6
7
8
9
0 1.24 6.2 31 155 775
Solution P (ppb)
Mea
n t
urf
qu
alit
y (1
-9)
AB
CD
EF

Results and Discussion
Tissue P (g kg-1)
0.5 1.0 1.5 2.0 2.5 3.0Tis
sue
gro
wth
rat
e (g
m-2
day
-1)
0.4
0.6
0.8
1.0
1.2
y = -0.3168 + 1.9427x - 0.7186x2
r2 = 0.96**, CV = 15.4
plateau = 1 critical x = 1.4

Results and Discussion
Solution P (ppb)
0 100 200 300 400 500 600 700 800
Tis
sue
gro
wth
rat
e (g
m-2
day
-1)
.2
.4
.6
.8
1.0
1.2
y = 0.5043 + 0.00643x - 0.0000209x2
r2 = 0.93*, CV = 15.5
plateau = 1 critical x =153

• Phosphorus treatments increased tissue and root P levels
• The best turf quality was achieved by the highest P treatment
• Turfgrass receiving 31 ppb P gained the highest root growth rate
Greenhouse hydroponic study Summary
• The critical solution P concentration was 153 ppb
• The critical tissue P level was 1.4 g kg-1 on dry weight basis for the optimum growth
• It needs further research in soil to determine the minimum fertilization level of St. Augustine grass
Greenhouse hydroponic study Summary

• Five P fertilization levels (0, 1/16, 1/8, 1/4, and 1/2 lbs P/1000sqft (about 24 ppm)), concentrated superphosphate,run 16 wks
• Two soils: deep sand low in P and flatwood soil with moderate P levels; replicate 5 times and total of 50 exp. units
• Take tissue harvest every 2 wks, analyze for tissue P
• Take visual quality rating every 2 wks
• Take soil samples 8 and16 wks after P is applied, analyze for M-1 and WEP
• Take leachate samples on 1, 2, 4, 8, 12, 16 wks, analyze for P
• Take root sample at the determination day
Greenhouse soil P study

Expected Results
--- Determine critical soil P levels
Soil P levels
Tis
sue
P le
vels critical tissue P conc.
critical Soil P conc. • Meclich-1 P
• WEP

Expected Results --- Determine P fertilization rates to reach critical soil P levels
P application rates
Soi
l tes
t P
leve
ls
• Meclich-1 P
• WEP
critical Soil P conc.
minimum P rate

• Five P fertilization levels (0, 1/16, 1/8, 1/4, and 1/2 lbs P/1000sqft) concentrated superphosphate, run 16 wks after P treatments applied
• Two locations: deep sand low in P and flatwood soil with moderate P levels; replicate 5 times and total of 50 exp. units
• Take tissue harvest every 2 wks, analyze for tissue P
• Take visual quality rating every 2 wks
• Take soil samples 4, 8 and 16 wks after P is applied, analyze for M-1 and WEP for soil depth of 0-10 and 10-20cm
• Take root sample at the determination day
Field P study Materials and methods

Field P studyExpected Results
Essentially the same as greenhouse soil P study
since the field study is just a verification
Impacts: St. Augustine grass can be grown with and fertilized with P with minimum environmental impact.

QUESTIONS?QUESTIONS?


![Augustine: City of God [1] St. Augustine (354-430 A.D.)](https://static.documents.pub/doc/80x56/56649d385503460f94a1120f/augustine-city-of-god-1-st-augustine-354-430-ad.jpg)