Session Number: Parallel Session 7D Time: Friday, August 27, AM Paper Prepared for the 31st General Conference of The International Association for Research in Income and Wealth St. Gallen, Switzerland, August 22-28, 2010 Does Class Count? Class Structure and Worsening Inequality in China and India Vamsi Vakulabharanam Wei Zhon Xue Jinjun For additional information please contact: Name: Vamsi Vakulabharanam Affiliation: University of Hyderabad Email address: [email protected]This paper is posted on the following website: http://www.iariw.org
Transcript
Session Number: Parallel Session 7D
Time: Friday, August 27, AM
Paper Prepared for the 31st General Conference of
The International Association for Research in Income and Wealth
St. Gallen, Switzerland, August 22-28, 2010
Does Class Count? Class Structure and Worsening Inequality in China and India
This paper is posted on the following website: http://www.iariw.org
Does Class Count? Class Structure and Worsening Inequality in
China and India1
Vamsi Vakulabharanam2
Wei Zhong3
Xue Jinjun4
(Early Draft. Please do not cite without authors‟ permission. Comments are welcome.)
Abstract
In this paper, we investigate the question of whether class structure matters in
understanding the increasing inequality in China and India. We argue that almost the entire
increase in the overall Indian inequality between 1993-94 and 2004-05 is explained by the rising
inequality between classes rather than within them, whereas in the case of China, the entire
increase in inequality between 1995 and 2002 appears to be explained by the rising inequality
within classes. The increased distance between urban and rural elites that are more stratified at
the top (such as formal sector owners, managers and professionals in urban areas and rentier
classes like moneylenders and absentee landlords in rural areas), and those classes that are
stratified at the bottom such as unskilled urban workers, agricultural workers and marginal
farmers, helps us understand the distributional dynamics of the Indian growth story. In the
Chinese case too, while the between-class inequality explains an even higher part (than in the
Indian case) of the overall inequality, we argue that the rise in overall inequality that is
seemingly explained by the rise in intra-class inequality is actually explained by the phenomenon
of “administrative urbanization.” We analyze the class structures in India and China and
decompose (using the methodology of Yitzhaki 1994) the overall inequality into inter-class and
intra-class terms while investigating the trends towards stratification. Finally we offer our policy
suggestions.
1 We thank the Economic Research Center, Graduate School of Economics, at Nagoya
University for inviting the first two authors as visiting researchers when this research was
conducted. We thank the participants of the workshop on “International Comparison of Income
Inequality” conducted at Nagoya University, Japan on June 27th
and 28th
, 2009 for their helpful
comments and suggestions in preparing this draft. We also thank Ajit Zacharias, YV Reddy,
Jayati Ghosh and Sudheer Kilaru for their useful comments on an earlier draft. 2 Corresponding Author; Assistant Professor, Economics, University of Hyderabad, India, Email:
[email protected] 3 Researcher, Institute of Economics, Chinese Academy of Social Sciences, Beijing, Email:
[email protected] 4 Professor, Graduate School of Economics, Nagoya University, Japan, Email:
(receive salaries) and the state (receives taxes) amongst others. While Marx appreciates the
heterogeneity of the working class in his writings, he does not overly dwell on the differences
within the working class as he was more focused on teasing out the distinctions between the
working class and all the other classes that live off the surplus that is produced by the working
class.
For this paper, we resort to the use of two Class schemas. The first schema uses broad
consciousness categories (applicable to China and India) to arrive at simplified class categories.
This schema identifies only two classes in the urban areas viz., elite (which includes owners,
managers and professionals) and the workers (other than professionals). In rural areas, China and
India have different class structures owing to the extensive land reform implemented in China
and its absence in India. For India, four classes are identified keeping in mind the differences
between agricultural and non-agricultural workers. These four classes are – rural elite (both the
big farmers and the non-agricultural elites that include owners, moneylenders, government
officials, professionals, and absentee landlords), rural non-agricultural workers, small farmers
and agricultural workers. The whole schema consists of six classes and relies primarily on how
society broadly views classes in terms of self-identification of status and power. In the Chinese
case, there is a total of six classes with the urban schema being identical to the Indian one.
However, in the rural areas, since the Chinese state implemented extensive land reforms, we do
not differentiate among farmers. We treat the entire farming community as one class. Among the
rural non-agricultural workers, we make a distinction between formal and informal workers and
split them into two classes. Finally, the owners and managers of rural enterprises along with civil
servants are identified as rural elite.
The second schema uses Marx‟s latter definition to define a broad distinction between the
working class and the other classes in the urban sector. The working class, which is defined by
its role in production, is quite heterogeneous in most modern societies and it is no different in
China and India. There is a widely accepted distinction between skilled and unskilled work. The
skilled are to be further sub-divided into professionals and skilled workers7. This makes for a
three-tier structure within the working class – professional, skilled and unskilled. Generally, it is
also acknowledged that there are fundamental distinctions between working people in
manufacturing and services8. Once we build this distinction into the class schema, we arrive at
six sub-classes within the working class. Of the non-workers, given the limitations of data and
7 This framework for urban areas is somewhat similar to the one employed by Wright (1997)
although a further sectoral sub-division into services and manufacturing is not done in Erik
Wright‟s work. Professionals are different from skilled workers in the sense that professionals
usually do white-collar kind of work and possess greater autonomy/control than the skilled blue-
collar workers. An example would be an engineer and a lathe worker in a factory. 8 This is not merely in the nature of labour (material vs. immaterial as Hardt and Negri (2000)
point out) but also in terms of the inequalities among different workers. It seems to be the
general case that service sector has a much greater inequality among its workers compared to
manufacturing.
5
the occupational categories available in the datasets (discussed in the next section), we arrive at
two composite classes viz., owners and managers in the formal sector, and owners and managers
in the informal sector. Managers are included alongside owners since their role in the labour
process is primarily supervisory and they live off the surplus value that productive workers
produce.
In the rural sector, the Indian class structure is primarily defined by the failure of a
crucial state policy that distinguishes India from the successful Asian economies to its east. This
is the near complete failure of land reforms as a state policy. Given this failure, the class
structure in agriculture is fundamentally split between the landed and the landless at the broadest
level. But among the landed, there are many differences but the most crucial distinction of these
is the quantum of land ownership. We divide the landed groups into four classes – Rich, Middle,
Small and Marginal/Tenant (empirical details provided in the next section). Roughly, the first
two groups hire net-labour power, the third group is balanced in its labour-power selling and
buying, and the last group is net-labour power selling9. The non-agricultural population can be
divided into five classes. First, the rentier class can be further divided into the moneylender and
absentee landlord classes. Second, the non-agricultural self-employed group (usually quite
heterogeneous) that cannot be further sub-divided due to data difficulties described below. Third,
the working class can be divided into two classes: the rural non-agricultural professionals (for
instance, the government officials and those who possess formal employment) and the other
workers. In both urban and rural sectors, there is also an unclassified section that defies further
sub-division given the data limitations.
The detailed rural Chinese class structure has to be different as mentioned above because
of the land reforms that the Chinese state implemented. The rural elite is the owner and
managerial class in rural areas usually of the non-agricultural formal enterprises. Owners in the
informal sector are identified as a separate class. Among the workers, a total of three classes are
identified: the rural non-agricultural skilled workers in the formal sector, the rural non-
agricultural unskilled workers in the formal sector, and the non-agricultural workers in the
informal sector. Farmers are identified as a unified class. Finally, the surveys possess a category
of workers called as the rural unclassified. This last one is a separate category.
III. Data, Definitions and Limitations
III.1 Indian data
The data source used for this analysis is the Indian National Sample Survey, Household
Consumer Expenditure Data, rounds 50(1993-94) and 61(2004-05). In the 50th
round, 115,354
households were selected in the sample, out of which 69,206 are from rural area, and 46,148 are
from the urban area. In the 61st round, 124,643 households were selected out of which 79,297 are
in the rural area, while 45,346 are from the urban area. The basic unit of analysis is the
household for which monthly consumer expenditure data are available. However, we use the
household size to obtain the monthly per capita expenditure levels. All the results presented
below are expressed as per capita consumption expenditure data adjusted to annual figures and
further adjusted to 2005 PPP US$.
9 Please see Utsa Patnaik‟s agrarian class schema (1987), for a similar framework. Utsa Patnaik
uses her framework in fieldwork based methodology to generate these categories, not large
surveys as presented in the current work.
6
Classes are defined using occupational data obtained from the National Classification of
Occupations (NCO 3-digit, 1968 scheme) codes of various occupations listed in the Indian
sample. Therefore, this generates a maximum of 1000 occupations, although less than 400
occupations are listed in the actual scheme. NSSO assigns an occupation to a household based on
the principal occupation of the members of the household.
For the urban data, the proprietary and managerial classes have been broadly split into
formal and informal categories based on the occupational descriptions (NCO) and nature of the
industry (National Industrial Classification Codes - NIC). These classes include the proprietary
or managerial classes directly available from the NCO descriptions as well as from the category
of self-employed (based on a survey question). Based on the NIC codes that are available in the
surveys, we assigned the workers either to manufacturing or services sectors. Further in each of
these sectors, sub-division was made among professionals, skilled workers and unskilled workers
based on the description of the occupations (NCO).
For the rural sample, using occupational data for the non-agricultural population, rural
professionals and rural moneylenders are identified. Of the remaining, the self-employed among
the non-agricultural community are defined based on one of the NSS survey based questions and
this cannot be further sub-divided. Of these and others that own more than half-acre of land,
while pursuing occupations other than agriculture, absentee landlord category is defined. Using
the NSS survey based question that identifies agriculture as the primary occupation of the
household, based on land data, the agricultural community is divided into five classes. Those that
own more than 10 acres10
are defined as rich farmers. Those that own between 5 and 10 acres are
defined as middle farmers. Those that own between 2 and 5 acres are designated as small
farmers. Those that own less than 2 acres are called marginal farmers. Those that own no land
but depend on agriculture as their primary source of livelihood, and define themselves as
workers are defined as the agricultural workers.
III.2 Chinese Data
The China Household Income Project survey was conducted by Institute of Economics,
Chinese Academy of Social Sciences. It is actually a sub-sample from the National Bureau of
Statistics. In each year, not all the provinces are included in the survey. In 1995, 11 provinces
with 6931 households in urban areas, 19 provinces with 7988 households in rural areas were
selected; in 2002, 12 provinces with 6835 households in urban areas, 22 provinces with 9194
households in rural areas were selected. All the results presented below are expressed as per
capita consumption expenditure data adjusted to annual figures and further adjusted to 2005 PPP
US$.
Classes were defined using the CHIP survey based questions on the occupations of the
members of the household. We used the occupation of the head of the household to make the
occupational classes. For the urban classes, the same procedures used in the Indian case were
adopted to make a three-tier structure of the working class and then to separate the owners and
managers of the formal and informal sectors. For rural areas, the survey based questions were
used to identify different classes of workers, farmers and owners.
10
Irrigated land is considered to be equivalent to twice the non-irrigated land. This is based on
yield per acre calculations during field research in Telangana villages.
7
III.3 Biases and Limitations
The biases in both Indian and Chinese surveys are that the upper end consumption groups
are not adequately sampled, while the owner and managerial class is under-represented. This
would most certainly understate the inequality levels in the Indian and Chinese economies.
Moreover, consumption distribution is usually more equal than income distribution.
In the Chinese case, the migrants from rural areas to urban areas are not listed as urban
residents. This is because the migrants still hold on to their rural hukou11
while living in the
urban areas. As a result of this, the Chinese urbanization process, which is discussed below is
even more intense than the household surveys that we use are able to capture. This, however, is a
limitation with all the large sample Chinese surveys. As the process of granting urban hukous to
migrants gathers pace, this limitation may be sorted out at some point in the future.
IV Results I: Class Structure
IV.1 Indian Class Structure
IV.1.1 Simplified Class Structure
From table 1, which presents the simplified class structure, we can make the following
observations. First, in terms of levels of consumption, at both points in time (1993-94 and 2004-
05), the urban classes are better off than their rural counterparts. As expected, the urban elite
(Owners, Managers and Professionals) is the best placed among the six classes presented, and the
agricultural workers are at the bottom. The ranks of different classes are as expected.
[Insert Table 1 Around Here]
In terms of change (defined as the rate of change in the ratio of class mean to the
population mean over the period), however, it can be seen from table 1 that the biggest gainers
are the urban elite. Moderate gainers are the rural elite and rural non-agricultural working class.
The biggest losers are the urban working class, small peasants and agricultural workers.
IV.1.2 Detailed Class Structure
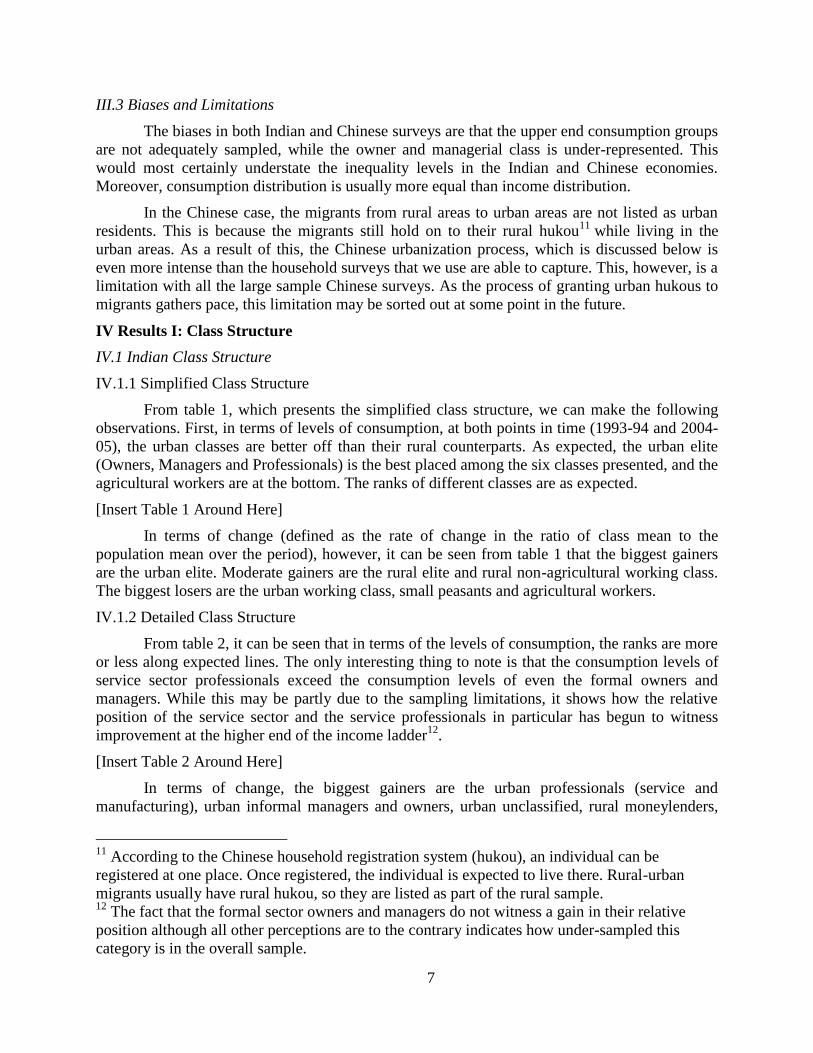
From table 2, it can be seen that in terms of the levels of consumption, the ranks are more
or less along expected lines. The only interesting thing to note is that the consumption levels of
service sector professionals exceed the consumption levels of even the formal owners and
managers. While this may be partly due to the sampling limitations, it shows how the relative
position of the service sector and the service professionals in particular has begun to witness
improvement at the higher end of the income ladder12
.
[Insert Table 2 Around Here]
In terms of change, the biggest gainers are the urban professionals (service and
manufacturing), urban informal managers and owners, urban unclassified, rural moneylenders,
11
According to the Chinese household registration system (hukou), an individual can be
registered at one place. Once registered, the individual is expected to live there. Rural-urban
migrants usually have rural hukou, so they are listed as part of the rural sample. 12
The fact that the formal sector owners and managers do not witness a gain in their relative
position although all other perceptions are to the contrary indicates how under-sampled this
category is in the overall sample.
8
rural professionals, absentee landlords, and rural unclassified. Broadly, it is the service sector
that has made rapid strides in terms of improvements in the urban areas, and the rural rentier
classes that have improved in rural areas. The biggest losers are the urban unskilled workers
(both manufacturing and service), skilled manufacturing workers, rural marginal farmers and
tenants, and agricultural workers.
Tables 1 and 2 give a broad picture wherein the elites in urban as well as rural areas have
begun to march ahead of the rest of the classes in their own sectors. The glaring gaps are
between the relative enrichment of the professionals and the relative decline of the agricultural
workers and small peasants. These results give a preview of how the detailed inequality
decomposition results would turn out.
IV.2 Chinese Class Structure
IV.1.1 Simplified Class Structure
From table 3, which presents the simplified class structure for the Chinese case, we can
make the following observations. First, in terms of levels of consumption, at both points in time
(1995 and 2002), like in the Indian case, the urban classes are better off than their rural
counterparts. As expected, the urban elite is the best placed among the six classes presented, and
the farmers are at the bottom. The ranks of different classes are as expected.
[Insert Table 3 Around Here]
In terms of change, however, it can be seen from table 3 that for all the classes the ratio
of the mean consumption of the class to the overall mean has actually declined. This is primarily
because of the rapid urbanization phenomenon in China. We can observe from the table that the
population shares of the urban classes as a whole have increased quite a bit while the farmer
class has declined in its share quite significantly. While the farming population has migrated
mainly to urban areas, and to the non-agricultural informal sector, in the survey data, only a part
of this urbanization process, what we term as “administrative urbanization” has been captured13
.
This is the process by which villages in the suburban areas of cities and towns, which do not
necessarily change their economic character, are added on to urban locales and thereby cease to
be rural. Large masses of rural population become members of urban classes/populations by
virtue of the change in their designation as part of the unfolding urban process. This is one of the
big stories in China. The reclassifications of rural places as urban have the effect of turning the
richest former rural dwellers in each class into relatively poor urban members of each urban
class. This redistribution of the population's residential status thus lowers the mean per capita
consumption of both rural and urban populations, causing both means to rise more slowly over
time than national per capita consumption. Therefore, it appears as though every class has
witnessed a decline in the ratio of its own group mean to the population mean.
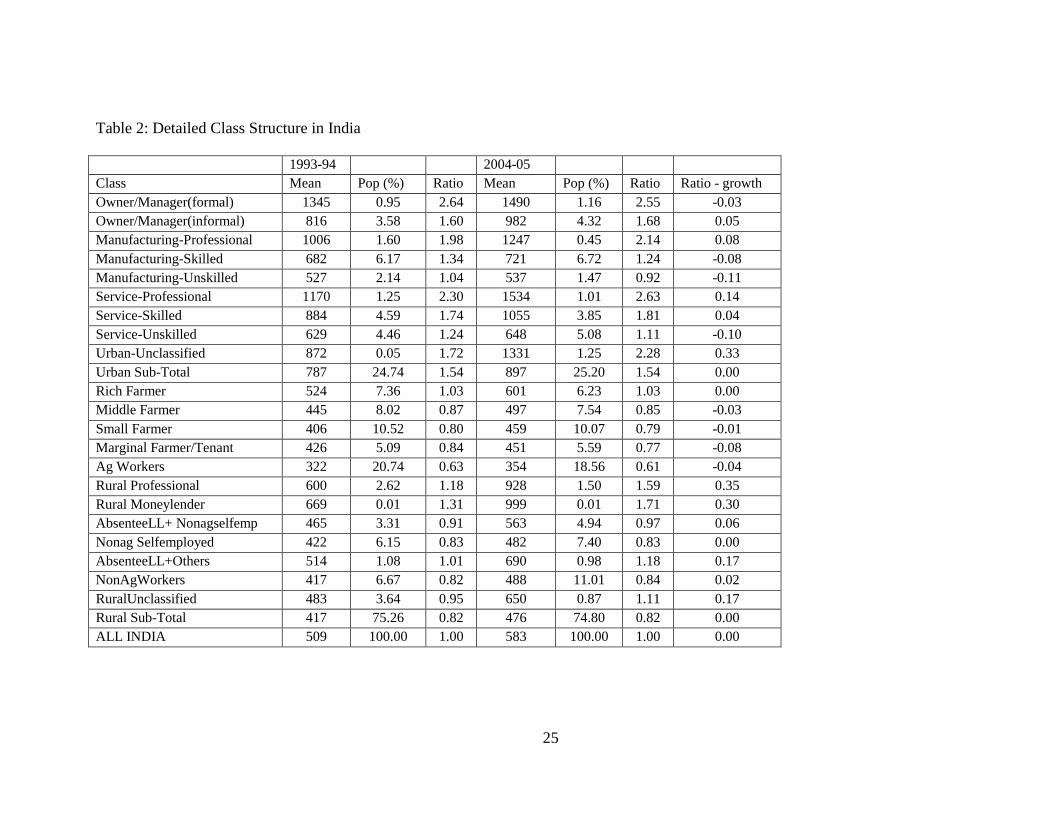
IV.1.2 Detailed Class Structure
In analyzing the detailed class structure, in table 3, we present the group ratios to the
mean in the following way. The rural class means are compared to the rural mean and the urban
class means are compared to the urban mean. Not doing this would make the results appear in a
distorted fashion. This is mainly because of the above-mentioned two phenomena - the rapid
13
Since most of the rural-urban migrants do not possess urban hukou, they are not listed as urban
residents in the CHIP surveys.
9
urbanization (mentioned above) and the fact that the national growth rate of consumption is
higher than both the rural and urban growth rates.
Once we make the above modification, the results appear as follows. In level terms,
urban professionals (both services and manufacturing), and owners and managers benefit more
than the urban average. Similarly, skilled workers in the services sector benefit quite
significantly. The unskilled workers in the services sector have both lost out relatively as well as
increased their population share significantly compared to their own earlier level. Unemployed
workers are distributed either in the informal sector or in the urban unclassified category, and it
is evident that the above two categories benefit less compared to those in the formal sector. The
most glaring result, however, is that manufacturing workers, no matter skilled or unskilled,
benefit less than the average, even though there is a large and growing manufacturing sector14
in
China. It is also quite clear that there is a big increase in the service sector population share for
urban residents, which is an interesting result in itself, as most commentators on China believe
that it is the manufacturing sector that really captures the essence of the Chinese economy. If it is
indeed the case, the results show that working class in this sector has not really made relative
gains, while the growing service sector workers in the population have done relatively better than
those in the manufacturing sector.
In the rural areas, a big change in the class structure is that the proportion of farmer class
has shrunk very rapidly: from more than half of the total population to less than one-third of the
total population. Relevant to this, the proportion of worker class in the rural informal sector has
increased rapidly. In rural areas, those who worked in the formal sector and owners in the
informal sector benefit more than the rest, while unskilled workers in the formal sector and the
workers in the informal sector have lost out in 2002 relative to 1995. Urban-rural gap is
extremely large. Urban-Rural divide is more than three to one. This gives a preview of the flavor
of the decomposition results regarding China.
[Insert Table 4 Around Here]
V. Results II: Analyzing Inequality, Does Class Count?
In terms of the overall story of changing inequality in India, the main observation is that
there is an almost 4 points (more than 10%, which is very likely an underestimate as discussed
above) increase in the Gini Coefficient between 1993-94 and 2004-05. This is a big change after
the experience of equalizing growth in the 1980s. After economic reforms have been introduced,
the story of Indian growth has been dis-equalizing. In the Chinese case too, the overall
consumption inequality has risen by more than 4 points (more than 10%) between 1995 and
2002. This shows a continuing deterioration in inequality, a trend that was clearly identified for
the 1988 to 1995 period. In the Chinese case too it has been a story of dis-equalizing growth with
both the rural as well as urban inequality taking a turn for the worse.
By decomposing this inequality along multiple axes such as rural-urban, inter-state,
simplified class structure, complex class structure and so forth, we present competing ways of
breaking down the increase in inequality into comprehensible structures. Before that, a brief note
is presented on the methodology of decomposition.
14
It is also important to note that it is a bit difficult to catch the rising share of the manufacturing
sector in the urban population, because the manufacturing sector workers are mainly composed
of migrant workers.
10
V.1 Yitzhaki Methodology of decomposing the Gini Coefficient
The method of Gini decomposition developed originally by Shlomo Yitzhaki15
offers a
unified framework for addressing certain important issues such as how much of the inequality
can be explained by the inter-group and intra-group components. Moreover, this method helps us
examine whether particular classes are stratified at a point in time and if they are getting
increasingly more stratified over time. A brief description is sketched out below.
Let G be the Gini coefficient of consumption. Using the Yitzhaki decomposition
methodology, we separate G into inter-group inequality (b
I ) and a remainder (r
I ) that can be
interpreted as intra-group inequality (Yitzhaki, 1994):
b r
G I I (1)
The amount of inter-group inequality is:
2 cov( , ( ))
,i oi
b
F yI
(2)
where y is consumption, is mean consumption for all persons, i
is mean consumption for
group i , and ( )oi
F y is the mean rank of group i , i.e., the average position of the members of a
group in the overall distribution. Thus, the amount of inter-group inequality is twice the
covariance between the mean amounts of consumption and mean ranks of groups divided by the
mean consumption for all individuals.16
The remainder term is calculated as:
,r i i i
i
I s G O (3)
where i
s is the share of group i in aggregate consumption, i
G is the Gini coefficient of the
consumption distribution within group i , and i
O is the overlapping index for group i . The
Yitzhaki decomposition provides group-specific measures of overlapping unlike the standard
decomposition of the Gini. The index of overlapping proposed by Yitzhaki is a measure of the
degree to which the range of consumption in each group overlaps with the range of consumption
for all population. Overlapping can thus be seen as the opposite of stratification: the higher the
amount of overlap between a group and the population, the less stratified they are as a group in
terms of consumption (Yitzhaki, 1994, pp.148–149). The amount to which group i overlaps with
the overall distribution is defined as:
15
As mentioned above, this framework and its description are also available in (Wolff and
Zacharias 2009) and (Zacharias and Vakulabharanam 2009) apart from the original description in
Yitzhaki (1994). 16
In contrast, in the standard decomposition, the between-group component would be equal to
twice the covariance between the consumption of each group and the rank of each group‟s mean
consumption divided by overall mean consumption. The Yitzhaki decomposition takes into
account the ranking of each individual within each group in the overall distribution.
11
cov ( , ( ))
,cov ( , ( ))
i o i
i
i i
y F yO
y F y (4)
where ( )o i
F y is the function that assigns to the members of group i their ranks in the overall
distribution,i
F is the function that assigns to the members of group i their ranks in the
consumption distribution within that group, and covi indicates that the covariance is according
to the distribution within group i . The minimum value of
iO is given by the share of group i in
the population and its maximum value is equal to 2. When the index equals the minimum
possible value, it suggests that the group in question is a perfect stratum, i.e., it occupies an
exclusive segment of the overall distribution. If a particular group has a range of consumption
that coincides with the range of consumption of all persons then the index will be equal to 1.
Finally, if the index is greater than 1, the distribution of consumption within the group is much
more polarized than in the overall distribution. This can happen if the members of the group
constitute two strata, one that has higher and the other that has lower than the average
consumption of the whole population (Milanovic and Yitzhaki, 2002, pp.162–163).
The index of overlapping defined in equation (4) is constructed from indexes that indicate
the amount by which a group overlaps with each of the other groups:
i i j ji
j i
O p p O
(5)
where i
p is the share of group i in the total population and j i
O is the index of overlapping of
group j by group i . Since the overlapping of a group by itself is equal to 1 by definition, its
contribution to i
O is equal to its relative size. The index of overlapping of the overall
distribution by a group is the weighted sum of overlapping of each of the other groups by that
group, with the relative size of each group serving as the weights.
In turn, the group-by-group overlapping indexes are calculated as:
cov ( , ( ))
,cov ( , ( ))
i ji
ji
i i
y F yO
y F y (6)
where j i
F is the function that assigns members of group i their ranks in the distribution of group
j . The index j i
O indicates the extent to which the consumption of individuals in group j falls
in the range of consumption of individuals in group i . (Yitzhaki, 1994, pp.150–152).
Using the Yitzhaki method, various decomposition results are presented below.
V.2 Decomposing Indian Inequality
V.2.1 Rural-Urban Decomposition
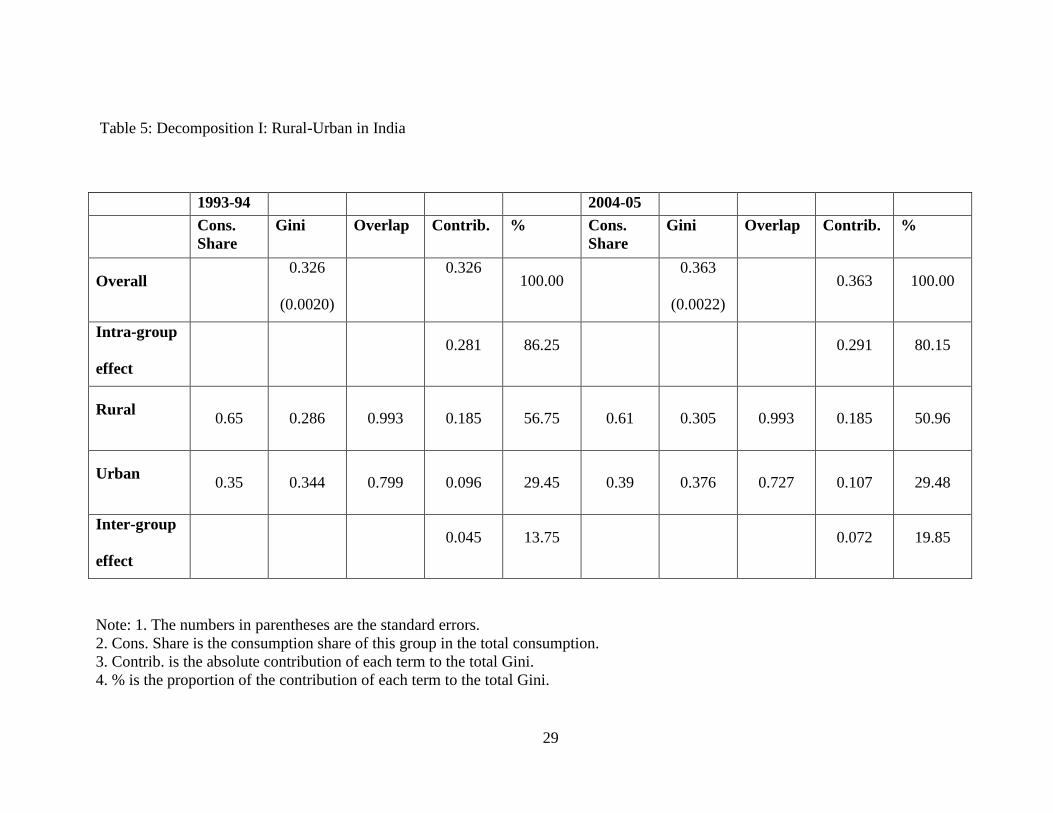
Table 5 presents the results of the rural urban decomposition using the Yitzhaki method.
First, it can be observed that a big share of the overall inequality (more than 80%) can be
explained by the intra-group component in both years, although there is a moderate increase in
the inter-group inequality, i.e. between the rural and urban areas, during the period of study.
Second, it is also evident that there is an increase in the intra-group inequality i.e. within-rural or
within-urban inequality or both. When we investigate this further, we find out that all the
12
increase in the intra-group inequality comes from the increase in the intra-urban inequality.
Third, in terms of the overlapping indexes, urban overlapping index has declined suggesting a
greater stratification of the urban vis-à-vis the rural. These results are in consonance with a lot of
studies as well as the changing overall sources of the GDP, while the employment structure does
not change readily.
[Insert Table 5 Around Here]
V.2.2 Inter-State Decomposition
Table 6 presents the summary results of the inter-state decomposition in India. According
to these results too, a bigger share of the overall inequality is explained by the intra-state
inequality (more than 85% in both years). In terms of changes across the two points in time, it is
evident that both inter-group as well as intra-group inequality rose in absolute terms, although
the proportion of the overall inequality explained by the inter-state component has risen (from
10% to about 15%). States like Gujarat, Tamil Nadu, Maharashtra, Kerala and Andhra Pradesh
have begun to grow more rapidly than other states while they have also witnessed fairly steep
increases in their inside-inequality (Based on own calculations from the NSS surveys; and for
growth rates of State Domestic Product, see Jayadev et. al. 2007; Also see Bannerjee et. al.
2009).
[Insert Table 6 Around Here]
V.2.3 Simplified Class Decomposition
Table 7 presents the results of the simplified class decomposition. Inter-Class inequality
rose quite significantly. This is self-evident from the discussion regarding the gainers in the
simplified class structure story above, with the urban elites making significant relative gains
while the urban working people and the rural working people have lagged behind. Intra-Class
component also rose somewhat but it is marginal. The main contribution to the increase in the
intra-class component comes from the urban classes and the non-agricultural working class.
Also, Gini indexes of these two classes have begun to witness steady increase. In terms of
overlapping, both urban elite and urban workers have witnessed significant declines in their
indexes, suggesting that these classes have begun to get more stratified vis-à-vis the rural classes.
The increase in the intra-group component of the rural non-agricultural working class needs
more careful examination and further investigation. However, an initial hypothesis is that there is
an increased migration from among the agricultural poor to the non-agricultural population.
[Insert Table 7 Around Here]
V.2.4 Detailed Class Decomposition
Table 8 presents the results of the detailed class decomposition. First, there is a
substantial increase in the between-class inequality. The entire increase in the overall Gini is
accounted for by the increase in the between-class inequality. This is by far the most significant
decomposition result. The details of the nature of this increase in the between class inequality
have been discussed in section IV. To summarize briefly, the urban professionals on the one side,
and the marginal farmers and agricultural workers on the other side have shown tendencies
towards stratification at the top and bottom respectively. This can also be obtained from a
discussion of the overlapping index in table 7. Substantial reductions have been noted for urban
professionals, urban informal manager/owner, manufacturing professional, skilled workers in
manufacturing, rural professionals, and rural moneylenders. All these groups have become more
13
stratified at the top and are performing better than other members of society. For some classes
such as formal managers and non-agricultural workers, the Gini coefficients show substantial
increase.
[Insert Table 8 Around Here]
A few points need to be noted regarding the within urban and within rural class inequality
(the details are not all presented in the table but can be found in Vakulabharanam (2009)). First,
the urban inequality as a whole is higher than the overall Indian inequality at both points in time.
Second, urban inequality registered an increase of almost 10% in terms of the Gini Coefficient
during the period of study. The main contributor to this seems to have been the rise in the inter-
class component. Overall inequality within the rural sector has risen moderately (about 5%).
From the results it is clear that this increase has come about mainly because of the increase in the
inequality among the non-agricultural groups and the increase in the inequality between the
agrarian and non-agrarian classes. In terms of the intra-class component, the largest increase has
come about among the non-agricultural workers, whose overlapping index has almost equaled
one, implying a process of polarization within this group. Given also the fact that this group has
witnessed a swelling in its ranks, probably an increasing number of agricultural workers and
distressed marginal farmers/tenants are joining the non-agricultural workforce.
V.3 Decomposing Chinese Inequality
V.3.1 Rural-Urban and Inter-regional Decompositions
In the Chinese case, a major part of the overall inequality is explained by the rural urban
gap i.e. the inter-group inequality (about 50% of the total inequality). Between the two years, the
absolute contribution of between group did not change much, but in relative terms there is a
decline in percentage terms of the between group effect, from 55% to 49%. This is clearly due to
the administrative urbanization impact as explained above. All the changes of overall Gini can be
explained by the rising intra-group effect in urban areas. Each component of the intra-group
effect, i.e., the consumption share, the within Gini as well as the overlapping index have shown
increase. While in rural areas, due to the shrinking of the population share as well as other
factors, the share of the consumption has declined. But the Gini coefficient has increased, and the
overlapping index increased, so that the final result is that the absolute contribution of the rural
remains unchanged.
The inter-regional decomposition shows that much of the overall inequality arises from
within regions and not between them. This fact does not change much over time as we can
observe from table 9.
[Insert Table 9 Around Here]
V.3.2 Simplified Class Decomposition
From table 10, it can be observed that the main story in China is the significant increase
in the intra-class component of the overall inequality. The inter-class component appears to be
more or less the same. The massive contribution to the increase in the intra-class component
occurs through the increase in the intra-component of the urban working class as well as the
informal non-agricultural sector in rural areas. This is clearly the result of the migration patterns
in China wherein the farmers are moving into non-agricultural pursuits willy-nilly (either
voluntary migration or administrative urbanization). Due to the migration patterns, therefore the
class structure at this point in time is in a state of flux. Due to this, while the increase in
14
inequality might have originally occurred due to the very different economic processes in the
urban and rural areas, due to administrative urbanization, it all appears as a within-urban
phenomenon as well as intra-class phenomenon. In other words, the increase in the intra-class
inequality is actually an increase in the inter-class inequality but appears differently due to the
massive urbanization phenomenon.
[Insert Table 10 Around Here]
V.3.3 Detailed Class Decomposition
From table 11, the following observations can be made. The inter-class effect appears to
be unchanged in absolute terms but declines in terms of the explaining the overall inequality.
However, the inter-class effect explains more than 50% of the overall inequality in both years
(much higher than the Indian case). The contribution of the intra-urban inequality to the overall
inequality increased in 2002 compare with 1995. In urban areas, the Gini coefficient in each
class goes up during this period, while overlapping index increases in most of the cases besides
one group (unskilled manufacturing workers), and as mentioned above, this can be explained by
the phenomenon of rapid urbanization. The rapid migration from the rural to the urban areas
results in the slowdown of the wages of all the unskilled workers in the urban sector. In rural
areas, the total population share of rural residents decreased a lot, but mainly the share of
consumption of farmer class goes down. Thus the contribution of the intra-farmer class to the
overall inequality decreased rapidly during this period. Gini coefficient in each class in rural
areas goes up, while the trends of overlapping indices vary across classes. The important point to
note is that the overlapping index of the informal workers in the rural areas has gone down
suggesting that they are getting more stratified at the bottom. This suggests distress migration
from the farming community like in the Indian case.
[Insert Table 11 Around Here]
VI Comparison of Indian and Chinese Class Structures and Inequality
From the above analysis it can be observed that inequality in China and India increased at
the national level during the period of study by about 10%. In 1995, the mean consumption in
China is about 35% higher than that of India, while in 2002, it is 87% higher. But it is also true
that overall Gini in China is much higher than that in India, in 1995 and 2002, it is 10 percentage
points higher than in India.
Inter-Class effects explain a significant part of the overall inequality in both countries.
Rural-urban divide is also extremely significant (especially in China) in explaining inequality. In
terms of the levels of consumption, elites in China and India are doing much better than the other
classes. In both countries, the service professionals (somewhat surprising for the case of China)
and skilled workers are gaining significantly relative to other classes. In India, in rural areas, the
rentier classes (moneylenders and landlords) have made huge gains. In rural China, it is mainly
those who worked in formal sectors that gained. In India, the biggest losers are the urban
unskilled workers, manufacturing skilled workers, small and marginal farmers and agricultural
workers. In China, the biggest losers are the farmers, those who worked in informal sectors in
rural areas together with manufacturing workers and the unemployed in urban areas.
While in India the rural-urban gap increased (inter-group), China witnessed the opposite
trend of decreasing inter-group inequality. The intra-group inequality in urban areas in China as
well as India has tended to increase. Urban in India became more stratified (from overlapping
15
index) while in China it became less stratified during the period of study. In 1995, overlapping
indices in every urban class in China are lower than their Indian counterpart, but in 2002, the
overlapping indices of classes that gained in urban India become lower than those of China. This
suggests tendencies towards greater stratification of urban India vis-a-vis rural India compared to
the same in China.
While in India, the inter-class inequality explains the entire increase in overall inequality,
the intra-class effect inside urban China almost completely explains the increase in the overall
Chinese Gini. We believe that the latter is an appearance that comes about mainly due to the
process of administrative urbanization as explained above. In India, classes such as service
professionals, manufacturing professionals, informal owner/manager class and rural rentier
classes (such as moneylenders and landlords) are getting more stratified at the upper end while
agricultural workers are getting more stratified at the bottom. In China, generally urban classes
are more stratified compared to rural classes although this stratification declined mildly
according to our findings during the period of this study.
VII. Explanations and Discussion
VII.1 Indian Story
The Indian growth strategy of the 1990s and this decade has led to increased economic
inequality among its population. The emerging patterns of this inequality have been discussed
above. How do we understand and explain these patterns of inequality?
Several studies have pointed to increased distress in the agrarian sector in India. More
than 100,000 farmer suicides have occurred between 1998 and now. Agricultural growth has
lagged far behind the growth in other sectors such as services and manufacturing. This has been
attributed to policies of economic liberalisation17
as well as a slowdown caused by a decline in
the returns from Green Revolution technologies (Vakulabharanam and Motiram 2007). Policies
of economic liberalisation have tended to cause a reduction in public investment in agriculture,
as well as partial withdrawal of state support to various small farming groups. Especially before
2004-05 (this study focuses on that period), the cutback in subsidies and the slow growth of
subsidized agricultural credit on the one hand, and the introduction of trade liberalisation on the
other, which caused agricultural output prices to fall for some key agricultural commodities,
caused a “double squeeze” of the farming community. Now it is well documented that this has
led to an increased dependence of the small farmers on informal moneylenders, who also
frequently combine other roles (such as that of merchant) with moneylending causing an increase
in their market power vis-à-vis small peasants (Reddy and Mishra 2009). This has led to a further
deterioration of the farmers‟ living standards as they now have to pay much higher interest rates
(compared to the institutional rates), and also sometimes lose control over the cropping pattern
decision and so forth (See Vakulabharanam 2004). All in all, the agricultural sector has suffered
the worst and this reflects in the reduced consumption shares of all the populous groups in
agriculture but especially of the marginal farmers, tenants and agricultural workers. Indian
growth strategy has tended to leave agriculture and a majority of its population behind as the
above analysis based on consumption data suggests. At the same time, it is evident that the
17
Since 2004, certain reversals in policy have come about such as the introduction of the
National Rural Employment Guarantee Scheme. The results of this act and other reversals would
have to be evaluated when the next consumption survey is released.
16
rentier classes (such as moneylenders and absentee landlords) have cashed in on the state
withdrawal to make steady gains. When the agrarian sector is in distress, does the rest of the
economy provide opportunities for migration for these peasants?
The rural non-agricultural sector has seen impressive gains at a first glance. However,
when we do a careful class analysis it is mostly the non-working groups (mentioned above) that
have witnessed improvements. The rural non-agricultural working population has seen
improvement but its ranks have almost doubled while the inequality within this group has
undergone a big increase. The latter probably results primarily from the distress that the
agricultural sector has undergone causing an outward migration. In the wake of insufficient
employment opportunities in the urban areas, this migration shows up as intra-rural. Clearly,
while there are improvements in this sector, they do not compare with the massive development
that the Chinese non-agricultural sector witnessed, especially in the 1980s and 1990s. One of the
main objectives18
of the relatively new special economic zone (SEZ) strategy implemented
mostly in rural areas for rapid industrialization is the increase in the level of non-agricultural
employment, although results are far from evident. Apart from the enormous dispossession of
peasantry that this strategy has tended to generate in states such as Maharashtra, Andhra Pradesh
and West Bengal, the positive net employment effects have not appeared on the horizon.
The urban sector has grown more rapidly than the rural sector during this period with the
growth path skewed in favour of the organized services sector. It is now well known that the
Indian government (as the rest of the world) has been seeing the Indian economy as primarily
driven by service sectors such as Information Technology, Biotechnology, Finance, Insurance,
Real Estate, Transport, Hotels and so forth. These and other similar sectors have, therefore,
received a lot of infrastructural support, as well as have benefited from easier legislation. The
main beneficiaries of this set of policies (they can also be termed policies towards globalization)
have been the upper end of formal workers (professionals) employed in these industries as well
as the capitalist and managerial cadres. These sectors have typically been export-led, skill-
intensive and dependent on overseas demand for their sustenance. In contrast, the manufacturing
sector19
in India has been witnessing impressive growth only in the recent years, although the
professionals in this sector have witnessed impressive gains through the period as the survey
results indicate.
The informal sector owners and managers within urban areas have seen impressive
growth in their consumption even as the inequality within this group has increased sharply. This
group is operating within the high-income generating arenas such as retail and wholesale, as well
as low-income generating arenas such as self-employed petty vendors. The consumption shares
of the unskilled workers have declined sharply suggesting that Indian growth trajectory has not
been a rising tide for most groups in the society. In sum, the distress in the agrarian sector has
not been countered by a rapid growth of decent employment opportunities in other sectors. The
fact that the share of informal workers (informal workers in the informal as well as the formal
sectors) in the total employment rose slightly during the first decade of reforms to more than
18
Of course, the other and more important premise for the policymakers is that it will generate
high growth along the Chinese lines. 19
It remains to be seen if this will result in employment generation like in the case of China.
17
92% of the total employment is indicative of the fact that decent employment opportunities on a
large-scale have simply not been forthcoming from the formal high-growth sectors (From NSS
report on the informal sector in India in 2004-05, Report 519).
When we analyze the macro-economic growth statistics for the Indian economy during
the period of analysis (1994-2005), Indian growth has been led largely by investment, exports
(not net exports) and private consumption initially until 2002, and after 2002, consistently by
investment and exports20
. However, consumption shares of almost all the poor groups have
witnessed declines implying that it has been luxury consumption that has driven the private
consumption growth patterns. Similarly, it is now widely documented that investment in
agriculture has not kept pace (see Reddy and Misra 2008), suggesting once again that it has been
investment in non-agricultural sectors that has seen impressive growth. With this clarity, we can
see how luxury consumption, non-agricultural investment and export-led growth sectors have
tended to become enclave-like, while the rest of the economy that contains the predominant
majority in India has not significantly benefited from the growth process. While some
economists argue about the „trickle-down‟ effects of this sort of a growth process, it has not been
visible in the Indian economy so far on any large scale. It is this skewed growth process that
explains the increase in the overall inequality after 1991 reversing the impressive record with
inequality in the 1980s decade.
The above evidence buttresses the understanding that there is a consolidation of a new
class structure in India as has been noted in other analyses (Chatterjee 2008). Until the 1980s,
literature about the pan-Indian class structure points to two ideas: an intermediate class regime
(originally proposed by Kalecki 1972 and imported to India by Raj K.N. 1973); or a loose
coalition of dominant classes (Bardhan 1984). In the intermediate regime story, the urban
intermediate class (self-employed groups, small and medium enterprise owners, and traders), and
the rural intermediate class (rich and middle peasants) played a big role in determining state
policies at the expense of the big bourgeoisie. In the dominant class story, rich peasants, public
sector bureaucracy and big bourgeoisie jostled for supremacy with none achieving it fully and
the state more or less acting in a domain of relative autonomy (See McCartney and Harriss-
White 2000 for a discussion of the variants of the intermediate class regime idea applied to
India). The state operated with an ambivalence wherein it took part in accumulation activities,
worked for the conflicting interests of the dominant classes, while also appearing to take on a
broadly developmentalist and progressive pro-poor role for itself. This class structure along with
the role of the state is supposed to explain both the tendencies towards stagnation in the economy
as well as why certain classes tended to benefit disproportionately during the phase of relative
stagnation until 1980. After 1991, as the survey results indicate, the dominant classes are the
urban elites. Urban elites have incorporated the professionals (some may use the term - upper
income middle classes) from among the working people, as well as the state in pushing through
the agenda of economic liberalisation. The state has consequently reduced its own accumulation
20
For the whole period 1994-2005, if we take the National Accounts figures, about 60% of the
cumulative growth can be attributed to private consumption, over 30% can be attributed to
investment and about 30% to exports (not net exports) making these three components the main
pillars of Indian growth (Source: Calculations from CSO Data on macroeconomic aggregates,
Ministry of Statistics, India).
18
role quite significantly. The rural intermediate classes are not quite as important in this new
scheme, although their interests are usually protected, directly or indirectly21
. Members of this
class have also unevenly moved on to urban occupations to become constituents of urban
capitalist classes (Damodaran, 2008). The working groups (the rural poor - small and marginal
farmers, agricultural workers; as well as the urban poor - unskilled urban workers) are no longer
among the main foci of the state but their interests have continued to be addressed mainly
through a populist mode in order to enlist their support during elections22
. The owners and
managers in the informal sector in urban areas are quite heterogeneous and certain groups (e.g.
wholesale and retail)23
have probably benefited (even this may not last long once liberalisation
takes deep roots in these occupations) while a large section (petty vendors) has probably not.
However, the employment numbers suggest that the informal sector as stated above plays the key
role of absorbing employment in the face of insufficient employment opportunities in the formal
sector, although this does not apparently improve the consumption levels of the informal workers
(in the unskilled category in our datasets) as the above analysis shows. This consolidation of a
new class structure comes through largely in the analysis of the levels and changes in the
consumption patterns as revealed by the NSS consumption surveys.
VII.2 Chinese Story
In the case of China, the overarching story after 1978 (when reforms were introduced) is
one of fast-paced economic growth and rapid reduction in poverty, while inequality has risen
tremendously. But if we analyze this period in different phases, it seems as though a great
amount of poverty reduction happened in the early 1980s when the agricultural sector grew
rapidly. At least after the mid-1980s, inequality levels have risen steadily.
The main cause behind Chinese inequality is that the rural classes (in particular, the
farming community) have been left behind vis-à-vis the urban classes. During the period of our
study the farmers are not only at the bottom of the consumption ladder both in 1995 and 2002,
but they also registered relatively low rates of consumption growth. The failure of implementing
a proper agricultural policy in China surely explains a big part of this. Given the slow paced
increase in agricultural incomes, we need to raise a similar question as the one raised for India.
Does the Chinese economy provide the disadvantaged farmer community other avenues to find
employment?
The main difference between the Indian and Chinese stories is precisely that the Chinese
economy has been able to provide employment opportunities in both the non-agricultural sector
as well as the urban sector. In the 1980s, with the Township and Village Enterprises (TVE)
strategy, it was able to absorb a lot of migrating farm workers from villages into the non-
agricultural sector. With its Special Economic Zone strategy, it was able to absorb a lot of
21
Usually in the formulation of minimum support price policies or in the prevention of large-
scale land reform process, the interests of rural elites continue to be protected. Also, the rural
intermediate classes have considerably diversified themselves into urban activities so that they
have one foot in the rural and another foot in the urban areas. See Vakulabharanam and Motiram
(2008) for a further discussion of these issues. 22
Chatterjee (2008) calls this phenomenon as the reversal of the primitive accumulation wherein
the state counteracts the dispossession of the poor by throwing certain benefits in their direction. 23
With the onset of corporate retail services in the more recent years, it may be hard for the
informal retailers to compete and continue to make gains.
19
migrants into the manufacturing sector. This also shows up in the rapid urbanization that is
visible in the current survey. The income differentials between the farming level and the urban
employment level are significant and therefore have provided the impetus to migrate for the
farming population. While the income differentials between the rural non-farm sector and the
farm sector are not as significant, they are still significant enough for farmers to leave agriculture
and move to non-farming work.
However, one of the main reasons behind the rising inequality in the Chinese economy is
that the migrant workers have been absorbed in relatively low-paid unskilled work, whether in
the non-agricultural manufacturing sector or the urban manufacturing sector, or in the urban
services sector. This has been coupled with substantial improvements for the professionals (even
more so in the services sector), thereby creating a multiple-tier labour market structure. This has
led to an increase in the within-urban inequality. At the same time, since the migrants are usually
absorbed in the low-wage non-agricultural sectors, even if they have rural hukou, the rural-urban
gap has remained high. These, along with the consumption of the farmer class that has lagged
behind, explain much of the Chinese inequality.
What is the new Chinese Class structure? Before 1978, it is widely felt that there were
three large groups/classes in Chinese society in economic terms. Firstly, the farming community
that was not completely homogeneous. In the sense that there was a substantial intra-peasant
inequality due to the differences of productivity levels across communes, while the communes
themselves were fairly equal. Secondly, the urban working class that was fairly homogeneous.
Thirdly, the government officials, who worked at various levels of the government. With the
onset of economic reforms after 1978, the major transformation in this class structure is that a
capitalist class (owner and manager category in our results) emerged first in urban areas and then
in the rural areas. This class has taken on a dominant role in the Chinese society today. This class
gets its support from the professional class in the urban and rural areas. The rest of the society
consists of urban workers (skilled and unskilled, in manufacturing and in services) as well as the
farmers. State policies have contributed to tremendous growth in China while creating and
deepening the new class structure. Added to this, the failures in the agricultural policy have
meant that the gaps between the entire urban community and the farming community have
increased tremendously. From our analysis of the CHIP survey data, these trends are
unmistakably evident in the Chinese society.
VII.3 Policy Suggestions
For India and China, several policy conclusions follow if this skewed pattern of growth
and rising inequality need to be counteracted. Firstly, it is obvious that the agricultural sector in
both countries needs higher public investment and better support in terms of promoting
institutional lending and so forth. However, in the Indian case, it is the poor peasants and
agricultural workers who really need to be supported. In this context, an effective way to counter
landlessness (in which group, poverty is quite concentrated) is to implement land reforms. Better
market-mediation structures need to be developed, for instance, creation of input-procurement
and output-marketing cooperatives among farmers (Motiram and Vakulabharanam 2007). This
could potentially make the rural sector much more egalitarian and may even contribute to higher
growth due to improved consumption within the rural areas due to this. Secondly, the labour
absorption strategies for the agricultural surplus labour need to be strengthened. Instead of
hankering exclusively after higher labour productivity, the strategies in the two countries need to
center around job creation. These efforts need to be proactive and direct, wherever possible.
20
Thirdly, the non-agricultural sector needs to be developed along cooperative lines in both
countries, perhaps taking a cue from the Chinese growth strategy especially in the 1980s and
1990s when township and village enterprises provided a much needed impetus towards finding
employment for the displaced farmers. India should think about this strategy afresh. Fourthly,
careful social safety nets need to be provided for those classes of people (the urban and the rural
poor) who are contributing to growth but who are benefiting little from it. Implementing these
measures will certainly improve domestic consumption in both economies as well as put both
these economies on a sounder, more sustainable and a more equal growth path.
21
References
Bannerjee L., Deshpande A., Ming Y., Ruparelia S., Vakulabharanam V. and Zhong W., (2009)
“Comparing Indian and Chinese Inequality After Economic Reforms,” India China Institute
Working Paper, New School, New York.
Bardhan, Pranab (1984) The Political Economy of Underdevelopment in India, New Delhi:
Oxford University Press.
Barooah V. Gustafson B. and Li S. (2005) “China and India: Income Inequality and Poverty
North and South of the Himalayas,” presented at an International conference on ”Liberalization
Experiences in Asia: a Comparative Appraisal”, jointly organized by Centre de Sciences
Humaines (CSH,) in Delhi, the Indian Statistical Institute, Kolkata and the Indian Council of
Social Science Research ICSSR, Delhi.
Chatterjee, Partha (2008) “Democracy and Economic Transformation in India,” Economic and
Political Weekly, April 19th
.
Chaudhuri S and M Ravallion (2006) “Partially Awakened Giants: Uneven Growth in India and
China” in L A Winters and S Yusuf (eds) Dancing with Giants: China, India and the Global
Economy, World Bank Washington DC.
Damodaran, Harish (2008) “India‟s New Capitalists,” Delhi: Permanent Black.
Dutt A.K. and Rao, J. Mohan (2000) “Globalization and Its Social Discontents: The Case of
India” Working paper No 2000-06, SCEPA Working Papers from Schwartz Center for
Economic Policy Analysis (SCEPA), The New School of Social Research, New York.
Hardt Michael, Negri Antonio (2000) Empire, Harvard University Press.
Himanshu, (2007) "Recent Trends in Poverty and Inequality: Some Preliminary Results",
Economic and Political Weekly February 10, 2007.
Jayadev A. Motiram S. and Vakulabharanam V. (2007) “Patterns of Wealth Disparities in India
During the Era of Liberalization,” Economic and Political Weekly, 42 (39), pp. 3853-63
Kalecki, M. (1972) Essays on the Economic Growth of the Socialist and the Mixed Economy,
London: Unwin.
Khan, Azizur R., and Carl Riskin (2005) “China‟s household income and its distribution, 1995 and 2002.” The China Quarterly, Vol. 182, June, pp. 356-384.
Li Peilin, Zhang Yi, Zhao Yandong and Liang Dong (2004) Social Conflicts and Consciousness
in China Today(shehui chongtu yu jieji yishi), Social Sciences Academic Press.
22
Lu, Xueyi. (eds.) (2004), Social Mobility in Conteporary China (dangdai zhongguo shehui
jieceng yanjiu baogao). Social Sciences Academic Press.
Marx, Karl. (1976) Capital Volume 1, London: Penguin.
Marx, Karl (1978) Capital Volume 2, London: Penguin.
Marx, Karl (1981) Capital Volume 3, London: Penguin.
McCartney M. and Harriss-White Barbara (2000), “The Intermediate Regime and Intermediate
Classes Revisited: A Critical Political Economy of Indian Economic Development From 1980 to
Hindutva,” Working Paper Series of Queen Elizabeth House, Oxford, QEHWPS34.
Milanovic, Branko and Shlomo Yitzhaki. (2002) “Decomposing World Income Distribution:
Does the World Have a Middle Class?” Review of Income and Wealth, Series 48, No.2, pp.155-
178.
Motiram S. and Vakulabharanam V. (2007) “Corporate and Cooperative Solutions for the
Agrarian Crisis in Developing Countries,” Review of Radical Political Economics, Vol. 39, No.
3, pp. 360-367.
Patnaik, Prabhat (2009) “A Perspective on the Growth Process in India and China,” The IDEAS
Working Paper Series, Paper No. 05/2009.
Patnaik, Utsa (1987) Peasant Class Differentiation: A Study in Method With Reference to
Haryana, New Delhi: Oxford University Press.
Raj, K.N. (1973) “The Politics and Economics of Intermediate Regimes,” Economic and
Political Weekly, July 7th
.
Reddy D. N. and Mishra Srijit (2009) Agrarian Crisis in India, Delhi: Oxford University Press.
Riskin, Carl, Renwei Zhao, and Shi Li (eds.),(2001) China's Retreat from Equality: Income Distribution and Economic Transition, Armonk, New York: M.E. Sharpe.
Thompson E.P. (1963) Making of the English Working Class, London: Victor Gollancz.
UNDP, China Human Development Report 2005, UNDP.
Vakulabharanam V. (2004) Immiserizing growth: Globalization and agrarian change in
Telangana, South India between 1985 and 2000, PhD. Dissertation, University of Massachusetts,
Amherst.
23
Vakulabharanam V. and Motiram S. (2007) “Political Economy of Agrarian Distress in India
Since the 1990s,” in Great Transformation? Undertanding India’s New Political Economy (eds.)
John Harriss, Stuart Corbridge, Sanjay Reddy and Sanjay Ruparelia, Forthcoming.
Vakulabharanam V. (2009) “Does Class matter? Class Structure and Worsening Inequality in
India During the Era of Economic Reforms,” Discussion Paper, Economic Research Center,
Nagoya University, Japan.
Wright E.O. (1997) Class Counts: Comparative Studies in Class Analysis, Cambridge University
Press.
Wolff E.N. and Zacharias A. (2009) “Class Structure and Economic Inequality,” Cambridge
Journal of Economics, Forthcoming Issue.
Wu, Jinglian. (2004) Economic Reform in Contemporary China (dangdai zhongguo jingji gaige),
Shanghai Fareast Press.
Xue J. and Zhang Y. (2007) “Social Class Structure and Income Inequality in China: A Study
Base on the China Social Dynamic Survey 2006,” Economic Science, Vol. 55 Issue 3.
Yitzhaki, Shlomo. (1994) “Economic Distance and Overlapping Distributions,” Journal of
Econometrics, 61, pp. 147-159.
Zacharias A. and V. Vakulabharanam. (2009) “Caste and Wealth Inequality in India” Working
Paper No. 566, Annandale-on-Hudson, NY: The Levy Economics Institute of Bard College,
May.
Tables
Please note: 1. All Indian tables constructed from National Sample Survey Rounds 50 (1993-94) and 61 (2004-05)
2. All Chinese tables constructed from China Household Income Project, 1995 and 2002.
Table 1: Simplified Class Structure (India)
1993-94 2004-05
Mean Pop (%) Ratio to Mean Mean Pop (%) Ratio to
Mean Ratio
Growth
Urban Elite 984 7.44 1.94 1189 8.19 2.04 0.06
Urban Workers 703 17.35 1.38 758 17.13 1.30 -0.06
Rural Elite 480 32.18 0.94 559 29.44 0.96 0.02
Non-Ag Workers 417 6.67 0.82 488 11.01 0.84 0.02
Rural Small Peasants 412 15.62 0.81 456 15.67 0.78 -0.03


![STUART CORBRIDGE CURRICULUM VITAE - LSE Home · contested spaces of Hindutva”, [with Edward Simpson], in Raju, Kumar and Corbridge (eds.) Colonial and Postcolonial Geographies of](https://static.documents.pub/doc/80x56/5f037de97e708231d4095834/stuart-corbridge-curriculum-vitae-lse-contested-spaces-of-hindutvaa-with-edward.jpg)


![0305-750x(90)90014-o] Stuart Corbridge -- Post-Marxism and Development Studies- Beyond the Impasse](https://static.documents.pub/doc/80x56/577cd9311a28ab9e78a2f452/0305-750x9090014-o-stuart-corbridge-post-marxism-and-development-studies-.jpg)


