93
St. Lucie Plant EPU Biological Study Quality Assurance Plan Prepared By Ecological Associates, Inc. Post Office Box 405 Jensen Beach, Florida 34958 August 2011

St. Lucie Plant EPU Biological Study
Quality Assurance Plan
Prepared By
Ecological Associates, Inc.
Post Office Box 405
Jensen Beach, Florida 34958
August 2011

August 2011 i PSL EPU/EAI QAP, Revision 1.doc
TABLE OF CONTENTS
Ecological Associates, Inc.
1.0 INTRODUCTION .................................................................................................................. 1-1 1.1 PURPOSE ................................................................................................................. 1-1 1.2 ORGANIZATION .................................................................................................... 1-1 1.3 QUALITY OBJECTIVES AND CRITERIA ............................................................ 1-4
1.3.1 PROJECT QUALITY OBJECTIVES .......................................................... 1-4 1.3.2 MEASUREMENT PERFORMANCE CRITERIA ...................................... 1-5
1.4 DOCUMENTATION AND RECORDS ................................................................... 1-5 1.5 SPECIAL TRAINING REQUIREMENTS/CERTIFICATION ............................... 1-7
2.0 SAMPLING METHODS ....................................................................................................... 2-1 2.1 STANDARD OPERATING PROCEDURES ........................................................... 2-1 2.2 SAMPLE HANDLING AND CUSTODY ................................................................ 2-1 2.3 ANALYTICAL METHODS ..................................................................................... 2-2
2.3.1 FIELD IDENTIFICATION OF FISHES AND SHELLFISH ...................... 2-3 2.4 QUALITY CONTROL ............................................................................................. 2-4
2.4.1 PRECISION ................................................................................................. 2-4 2.4.2 ACCURACY ................................................................................................ 2-5 2.4.3 REPRESENTATIVENESS .......................................................................... 2-6 2.4.4 COMPARABILITY ..................................................................................... 2-6 2.4.5 COMPLETENESS ....................................................................................... 2-6
2.5 INSTRUMENT/EQUIPMENT TESTING, INSPECTION, MAINTENANCE, AND CALIBRATION .............................................................................................. 2-7
2.6 DATA MANAGEMENT .......................................................................................... 2-8 2.7 HANDLING OF STATE OR FEDERALLY LISTED SPECIES ............................ 2-8
3.0 ASSESSMENT AND OVERSIGHT ..................................................................................... 3-1 3.1 ASSESSMENT AND RESPONSE ACTIONS......................................................... 3-1
4.0 DATA VALIDATION AND USABILITY ........................................................................... 4-1 4.1 VERIFICATION AND VALIDATION METHODS ............................................... 4-1 4.2 RECONCILIATION WITH USER REQUIREMENTS ........................................... 4-1
5.0 REFERENCES ....................................................................................................................... 5-1 6.0 ACRONYMN DEFINITIONS ............................................................................................... 6-1
August 2011 ii PSL EPU/EAI QAP, Revision 1.doc
TABLE OF CONTENTS
Ecological Associates, Inc.
TABLES
Table 1-1 Example of Environmental Data
Table 1-2 Measurement Performance Criteria
FIGURES
Figure 1-1 Project Organization Chart
Figure 3-1 Example of Corrective Action Request and Response Verification Form
APPENDICES
Appendix A Field Data Sheets
Appendix B Sample Identification Label and Chain-of-Custody Form
Appendix C Project SOP
August 2011 1-1 PSL EPU/EAI QAP, Revision 1.doc
Ecological Associates, Inc.
1.0 INTRODUCTION
1.1 PURPOSE
The purpose of this document is to establish the Quality Assurance Plan (QAP) for collecting data
utilizing gill nets, beach seines, trawls, plankton nets, water quality monitoring equipment, and boat-
based observations as required by Florida Power and Light Company’s (FPL’s) permit modification
(NPDES Permit No. FL0002208) for the extended power uprate (EPU) for both Units 1 and 2 at the
St. Lucie Plant on Hutchinson Island, St. Lucie County, Florida.
This QAP provides general descriptions of the work to be performed to collect the samples, the
standards to be met and the procedures that will be used to ensure that the data are scientifically valid
and defensible.
1.2 ORGANIZATION
The organizational chart provided as Figure 1-1 shows the relationships among EAI project
participants. Key project roles are filled by those persons responsible for ensuring the collection of
valid data, the assessment of data for precision and accuracy, and the person(s) responsible for
approving and accepting final products and deliverables.
The responsibilities of these persons are described below.
The Project Manager (PM) will supervise the assigned project personnel to ensure compliance with
QAP procedures and project goals. The PM responsibilities include:
• Providing oversight for sampling design, selection of station sites, and adherence to project
objectives;
• Reviewing and approving the QAP, SOP and other materials developed to support the
project;
• Coordinating with contractors, reviewers, and others to ensure technical quality and
contract adherence;
• Coordinating project assignments in establishing priorities and scheduling;
• Ensuring project completion within established budgets and time schedules;
• Providing technical supervision to project personnel;
• Implementing corrective actions and providing managerial supervision to staff;

August 2011 1-2 PSL EPU/EAI QAP, Revision 1.doc
Ecological Associates, Inc.
• Preparing and/or reviewing preparation of project deliverables, including the QAP and
SOP developed to support the project; and
• Liaison with EPA and other agencies for interaction with the project team, technical
reviewers, and others to ensure technical quality requirements are met in accordance with
project objectives.
The Quality Assurance (QA) Officer will be responsible for reviewing and approving the QAP and
SOP. Additional QA Officer responsibilities include the following:
• Reviewing and evaluating field procedures;
• Conducting external performance and system audits of the procedures;
• Monitoring quality control activities to assure conformance;
• Performing one internal technical system audit;
• Performing a field audit of each sampling team;
• Ensuring the timely processing and analyzing of field samples;
• Ensuring sorting staff and ichthyoplankton taxonomists follow QA procedures outlined in
the QAP and SOP;
The Quality Control (QC) Officer (typically the Field Team Leader), is responsible for performing
evaluations to ensure that QC is maintained throughout the sampling process, analysis procedures in
the laboratory and during subsequent documentation of results. The QC Officer will:
• Monitoring field activities during sampling events;
• Perform QC evaluations to ensure compliance with QAP standards;
• Interact with the field sampling team and others to ensure technical quality requirements
are met in accordance with project design objectives;
• Verify work completed and provide written documentation of QC reviews;
• Oversee ichthyoplankton sorting rechecks;
• Provide peer review oversight on the content of the work products;
• Ensure compliance with EPA/FDEP reporting requirements.
The Field Team Leader (who also typically serves as the QC Officer), will direct the work of the
field sampling team, including collection, preservation of samples and completion of field sampling
records. The field sampling team will include scientific staff with specialization and technical
competence in field sampling activities to effectively and efficiently perform the required tasks in

August 2011 1-3 PSL EPU/EAI QAP, Revision 1.doc
Ecological Associates, Inc.
accordance with the QAP and SOP. Custody procedures required ensuring the integrity of the
samples and the maintenance of proper sample identification during handling will be followed. The
field sampling team is responsible for:
• Receiving and inspecting the sample containers to be taken into the field;
• Ensuring equipment calibration;
• Ensuring all items on the field sampling checklist are functional and taken into the field for
each sampling event;
• Maintaining field log notebooks;
• Identification of trawl, gill net, and beach seine specimens;
• Assigning tracking numbers to each sample;
• Completing and signing appropriate field records;
• Contacting the FFWCC Law Enforcement Dispatch Center 24 hours prior to sampling as
required by EAI’s Special Activity License Number SAL-11-0071A-SR.
The Ichthyoplankton Taxonomists will:
• Identify ichthyoplankton specimens to the lowest practical taxon;
• Follow sample processing procedures to ensure the integrity of the samples (with respect to
prevention of loss and maintenance of proper sample identification during handling);
• Verify the completeness and accuracy of sample tracking documentation;
• Maintain the integrity of the samples in their custody;
• Complete and sign laboratory records.
Fish and Shellfish Taxonomists will:
• Identify specimens that could not be readily identified in the field to the lowest practical
taxon using published literature or the assistance of experts;
• Follow sample processing procedures to ensure the integrity of the samples (with respect to
prevention of loss and maintenance of proper sample identification during handling);
• Verify the completeness and accuracy of sample tracking documentation;
• Maintain the integrity of the samples in their custody;
• Complete and sign laboratory records.

August 2011 1-4 PSL EPU/EAI QAP, Revision 1.doc
Ecological Associates, Inc.
1.3 QUALITY OBJECTIVES AND CRITERIA
Data quality objectives (DQOs) are qualitative and quantitative statements that clarify the intended
use of the data, define the type of data needed to support the decision, identify the conditions under
which the data should be collected, and specify tolerable limits on the probability of making a
decision error due to uncertainty in the data (if applicable). Data users develop DQOs to specify the
data quality needed to support specific decisions.
1.3.1 PROJECT QUALITY OBJECTIVES
The quality of an environmental monitoring program can be evaluated in three steps: (1) establishing
scientific assessment quality objectives, (2) evaluating program design to determine if the objectives
can be met, and (3) establishing assessment and measurement quality objectives that can be used to
evaluate the appropriateness of the methods being used in the program. The quality of a particular
dataset is a measure of the types and amount of error associated with the data. Sources of error or
uncertainty in statistical inference are commonly grouped into two categories:
1. Sampling error: The difference between sample values and true population values from
unknown biases. Sampling error includes natural variability (spatial heterogeneity and
temporal variability in population abundance and distribution) not specifically accounted
for in a design (for design-based inference) and variability associated with model
parameters or incorrect model specification (for model-based inference).
2. Measurement error: The difference between sample values and true population values
associated with the measurement process. Measurement error includes bias and
imprecision associated with sampling methodology; specification of the sampling unit;
sample handling, storage, preservation, and identification; instrumentation; and the like.
The data requirements encompass aspects of both laboratory taxonomic analysis and database
management to reduce sources of errors and uncertainty in the use of the data. Data required for each
project are listed in Table 1-1.
Water temperature, dissolved oxygen, pH, salinity, and conductivity are monitored in association with
each gillnet and trawl/bongo sample. Water temperature is monitored for each beach seine sample and
turtle survey.
August 2011 1-5 PSL EPU/EAI QAP, Revision 1.doc
Ecological Associates, Inc.
Methods and procedures described in this document are intended to reduce the magnitude of
measurement error sources and the frequency of error occurrence. The relevant quality objectives are
related to sample handling and to making measurements of required parameters onsite.
Project quality objectives include the following:
• Use of standardized, repeatable data and sample collection procedures;
• Use of site maps, GPS coordinates and photographs to document the actual sampling
locations to ensure correct locations are sampled and for future reference purposes;
• Use of experienced scientists to perform the data and sample collection and taxonomic
analyses;
• Calibration of meters for flow rate, pH, temperature, dissolved oxygen, conductivity and
salinity to known standards in accordance with the manufacturer’s specifications;
• Use of QC protocols and analyses.
1.3.2 MEASUREMENT PERFORMANCE CRITERIA
Measurement performance criteria are quantitative statistics used to interpret the degree of
acceptability of the data to the user. These criteria, also known as Data Quality Indicators (DQIs)
include the following:
• Precision,
• Accuracy,
• Representativeness,
• Completeness, and
• Comparability.
DQIs that cannot be expressed in terms of accuracy, precision, or completeness will be reported by
fully describing the specified method. Measurement performance criteria for various parameters are
presented in Table 1-2.
1.4 DOCUMENTATION AND RECORDS
Thorough documentation of all field sample collection and handling activities is necessary for proper
processing in the laboratory and, ultimately, for the interpretation of study results. Field sample
collection and handling will be documented in writing using the following forms and labels:
• A waterproof field log notebook for general observations and notes at each station;

August 2011 1-6 PSL EPU/EAI QAP, Revision 1.doc
Ecological Associates, Inc.
• A Data Sheet for each sample (gill netting, beach seines, trawls, ichthyoplankton sampling,
turtle surveys) (Appendix A);
• An in-jar Sample Identification Label that accompanies and identifies each sample sent to
the laboratory for identification (Appendix B);
• An EAI external Sample Identification Label that accompanies and identifies each sample
jar (Appendix B);
• A Chain-of-Custody Record form to provide additional tracking information and request
specific analyses for each sample sent to outside sources (Appendix B).
A Sample Identification Label (to be placed on the sample bottle/container) (Appendix B) will be
completed with specific information to accompany each sample throughout the chain of custody. The
label will document the Sample Identification Number (SIN) (consisting of date, sampling area,
transect or point, and type of sampling). All entries will be made in indelible ink and will coincide
with sample information on the appropriate sample Data Sheet (Appendix A).
Proper chain-of-custody procedures are necessary for tracking sample possession from the EAI
laboratory to the confirmation laboratory for samples sent for identification verification. Chain-of-
Custody Record forms (Appendix B) will accompany each shipment of samples documenting sample
identity (coinciding with information on the Sample Identification Label and field log) and laboratory
receipt date and time. All Chain-of-Custody Record entries will be made in ink. A copy of EAI’s
Special Activity License Number SAL-11-0071A-SR will also accompany each shipment of samples.
Samples will be delivered to the appropriate laboratory when problematic species are unidentifiable
by EAI taxonomists. The laboratories will retain copies of all shipping airbills. Specifications (to be
identified by the PM) will be followed for retention of field samples by the receiving location.
The PM is responsible for ensuring the completeness and retention of data, correspondence, plans,
and revisions that may be required for the preparation of reports and supporting documentation during
the project. Examples of the type of information to manage include:
• Any reports and documents prepared;
• Contract and work assignment information;
• Project QAP;
• Field datasheets;
• Sorting and taxonomy datasheets;
• Results of technical reviews, data quality assessments, and audits;
August 2011 1-7 PSL EPU/EAI QAP, Revision 1.doc
Ecological Associates, Inc.
• Relevant communications (memoranda; internal notes; telephone conversation records;
letters; meeting minutes; and written correspondence among the project team
personnel, subcontractors, suppliers, or others);
• Maps, photographs, and drawings;
• Studies, reports, documents, and newspaper articles pertaining to the project;
• Special data compilations; and
• Spreadsheet data files (hardcopy and on CD or DVD).
The Field Team Leader will ensure data on field data sheets are entered into the database. Data
compilations and formal reports will be maintained at EAI. Reports will include a summary of the
types of data collected, sampling dates, and any problems or anomalies observed during sample
collection, as directed by the PM.
If any change(s) in this QAP are required during the study, a memorandum will be sent to each person
on the distribution list describing the change(s), following approval by the appropriate persons. The
memorandums will be attached to the QAP. All written records relevant to the sampling and
processing of samples will be maintained at EAI. Unless other arrangements are made, records will
be maintained for a minimum of 2 years following project completion.
1.5 SPECIAL TRAINING REQUIREMENTS/CERTIFICATION
This QAP and other supporting materials will be distributed to all participants. All field, laboratory,
and data analytical personnel have training and/or extensive experience in performing all duties that
are their responsibility. Prior to the initial sampling event, a training session will be held to:
• Review the QAP and other materials,
• Check that all equipment and sampling gear are ready,
• Discuss and demonstrate the sampling method(s) to be used,
• Provide site orientations for the site sampling teams, and
• Review health and safety gear and procedures.
The training session will consist of a discussion of procedures and study-specific paperwork, as well
as a field demonstration of equipment components, assembly and operation. Each field sampling
team will consist of at least two people. In addition, a QC Officer will ensure strict adherence to the
project protocols by conducting field audits (i.e., a field audit of each field sampling team during each
August 2011 1-8 PSL EPU/EAI QAP, Revision 1.doc
Ecological Associates, Inc.
of its first sampling events to assess compliance with the QAP and SOPs) and a second audit midway
through the first sampling season.
August 2011 2-1 PSL EPU/EAI QAP, Revision 1.doc
Ecological Associates, Inc.
2.0 SAMPLING METHODS
This section describes the procedures that will be used to collect site information, water quality data,
ichthyoplankton samples, fish and shellfish samples, and other data to support compliance with
FPL’s NPDES permit modification.
Site characteristics will be recorded on field data sheets and in the field log notebook. Samples will
be collected at the designated sampling points and transects within the 3 study areas every other
month. Gill netting, beach seines, and turtle surveys will be conducted during daylight hours. Trawl
and ichthyoplankton sampling (500 μm mesh plankton net) will be conducted at night.
2.1 STANDARD OPERATING PROCEDURES
Standard Operating Procedures (SOP) will be followed for all sampling. A list of equipment and
expendable supplies needed in the field for each type of sampling is provided in the SOP for each
type of sampling. All primary and back up meters will be calibrated prior to leaving the lab for a
sampling event and upon return to the lab after the sampling event. Backup gear will be calibrated
and taken into the field for all sampling events. Should any primary equipment fail during sampling,
back up gear will be used to complete the sampling event. An equipment failure report will be made
by the Field Team Leader upon return to the lab. Malfunctioning equipment will be repaired or
replaced as needed. Should the backup equipment fail, the Field Team Leader must determine
whether additional backup equipment or samples can be obtained quickly to continue the sampling
effort. The Field Team Leader should try to contact either the PM, or QA Officer to notify them of
the situation and possible corrective actions. If it is not possible to obtain their approval, the Field
Team Leader should proceed based on best professional judgment. Any deviations from the planned
sampling procedures must be recorded in the field log notebook and on any pertinent forms.
2.2 SAMPLE HANDLING AND CUSTODY
Samples will be transferred to suitable containers, labeled internally and externally and properly
stored until the end of the sampling event. External labels will be marked with the SIN consisting of
date, sampling area, transect or point, and type of sampling. This number will also be recorded on the
internal label and field data sheet. After completion of sample collection for each sampling event, the
samples to be returned to the laboratory for identification will be preserved in a 5-10 percent formalin
solution. Alternately, samples may be placed on ice and frozen for lab confirmations of

August 2011 2-2 PSL EPU/EAI QAP, Revision 1.doc
Ecological Associates, Inc.
identifications. Samples sent for outside verification will be preserved and transferred to the
receiving analytical laboratories using Chain-of-Custody Record forms. The Chain-of-Custody
Record form (Appendix B) acts as a record of the sample shipment and a catalog of the contents of
each shipment (coinciding with information on the field record). All Chain-of-Custody Record form
entries will be made in black ink and will include:
• Sampler’s name;
• Project name and number;
• Page number (e.g., 1 of 1);
• Collection date;
• Sample Identification Number;
• Number of containers;
• Preservation protocol;
• Type of analysis required;
• Laboratory recipient signature; and
• Laboratory receipt date and time.
No erasures will be made on the Chain-of-Custody Record forms. If an incorrect entry is made, the
information will be crossed out with a single strike mark, which is initialed and dated. All portions of
the Chain-of-Custody Record will be filled out completely and any additional issues or comments
will be added in the space provided. The appropriate sample identification label (to be placed on and
in the sample bottle/container) will be completed to accompany each sample throughout the chain of
custody. The label will document the SIN (including date, sampling area, transect or point, and type
of sampling), sampling personnel initials, preservation technique, and the number of jars per SIN
(e.g., 1 of 1). Immediately following the packing of each shipping container (sample jar crate
complete with preserved, labeled samples sealed associated chain-of-custody records, and EAI’s
Special Activity License Number SAL-11-0071A-SR), the shipping container will be secured with
packaging tape.
2.3 ANALYTICAL METHODS
Ichthyoplankton samples will be delivered to the EAI laboratory for processing, sorting, enumeration,
and taxonomic identification. Laboratory processing will involve the removal of eggs and larvae
from detritus and other material found in each sample, and identifying and counting all eggs and
larvae to the lowest practical taxon. Processing will be conducted by experienced laboratory

August 2011 2-3 PSL EPU/EAI QAP, Revision 1.doc
Ecological Associates, Inc.
technicians and taxonomists according to the approved SOP, Laboratory Sorting/Specimen
Identification.
Training, experience, and possession of proper laboratory equipment and taxonomic literature are
crucial factors affecting the quality of taxonomic identification activities. EAI taxonomists will
follow the approved EAI SOP and consult the appropriate published taxonomic literature.
Ichthyoplankton will be identified to the lowest practical taxon (typically genus or species) using the
most pertinent taxonomic literature.
In addition to the published taxonomic literature, a reference collection may be used for taxonomic
verification or developed as part of the project. A reference collection is defined as a set of biological
specimens, each representing some taxonomic level and not necessarily limited to specific projects or
activities. Specimens whose identification is uncertain may be sent to taxonomic experts familiar
with the group in question for confirmation. Specimens damaged beyond recognition (i.e., by natural
causes or by the sampling process) will be enumerated and documented as “unidentifiable”. The true
data of a biological project such as this are the actual specimens collected in a survey for that project.
Following determination of density (i.e., number of eggs/larvae per volume of water sampled) and
taxonomic identification, these specimens should be maintained in a voucher collection for at least 2
years after project completion. If there are questions regarding the accuracy of taxonomic
identifications used in calculations and reporting, referral to the voucher collection should be an
initial step taken in error reduction.
2.3.1 FIELD IDENTIFICATION OF FISHES AND SHELLFISH
Specimens will be identified in the field to the lowest level that is practical. When specimens
collected cannot be identified to a minimum of generic level in the field, they will be preserved and
returned to the lab for further laboratory identification. These specimens will be noted on the Field
Data Sheet. Some juveniles, or hybrids, are not distinguishable below the generic level in the field
and will be left at that level [e.g., Eucinostomus less than 40 millimeters (mm) TL]. Field guides will
be taken on all field trips, as well as a written summary of field characters that are useful in separating
more problematic species (e.g., Gerreidae). Under no circumstances will species that are prohibited
or that have special protections (endangered or threatened status) be intentionally collected.

August 2011 2-4 PSL EPU/EAI QAP, Revision 1.doc
Ecological Associates, Inc.
2.4 QUALITY CONTROL
Data quality is addressed by consistent performance of procedures documented in the SOP, the
training and experience of project staff and documentation of project activities. The QAP and other
supporting materials will be distributed to all sampling personnel. A training session will be held
prior to commencement of sampling. Training will include a classroom session and a practical field
session and will be mandatory for all field staff. A Field Team Leader or QC Officer will ensure that
samples are taken according to the established protocols. The QC Officer and the Field Team
Leaders will ensure that all field notebook entries, forms, checklists, and measurements are recorded
and completed correctly during each sampling event. QC checks will be completed for all field data
sheets, and the name of QC personnel and date of QC check will be entered on the bottom of each
Field Data Sheet. Staff performance will be monitored throughout the sampling and analysis phases
to ensure adherence to project protocols.
DQOs are described in this QAP and Table 1-2 specifies the precision requirements for project
parameters. QC activities include field audits at each sampling location, laboratory sorting checks,
and laboratory taxonomic QC.
2.4.1 PRECISION
Precision is a measure of the nearness of two values and can be used as an indicator of internal
consistency of methodology. It is demonstrated by the degree of mutual agreement between
individual measurements or enumerated values of the same property of a sample, usually under
demonstrated similar conditions. Precision of ichthyoplankton measures (i.e., number of eggs and
larvae present in a sample) is estimated by a comparison of results between multiple sorters of the
same sample. Ten percent of ichthyoplankton samples will be resorted by a second trained sorter and
the results compared. Precision is calculated as Relative Percent Difference (RPD) as follows:
RPD = [ ]2/)(/ 2121 CCCC +− X 100%
Where: C1 and C2 are the two values (e.g., sorting/counting results of technician 1 and technician 2).
The precision of laboratory sorting (i.e., measurement error due to analytical error) is measured by
checking the sorted samples discard, removing and counting missed specimens, and calculating
sorting efficiency.
August 2011 2-5 PSL EPU/EAI QAP, Revision 1.doc
Ecological Associates, Inc.
Taxonomic precision is calculated from the re-identification process (i.e., taxonomic confirmation or
disagreement) conducted by two, independent taxonomists. The percent taxonomic difference (PTD)
is calculated as:
PTD = 1- [ ]NN /1 X 100%
Where: N is the total number of eggs or larvae, and N1 is the number of taxonomic “agreements.”
Taxonomic precision using PTD will be determined by having unusual or problematic species re-
identified by a second taxonomist.
Physicochemical measurements of sampled waters will also be collected, and the precision of their
measurements (as detailed in Table 1-2) will be determined.
2.4.2 ACCURACY
Accuracy is defined as the degree of agreement between an observed value and an accepted reference
or true value.
The field team will be trained in proper uses and calibration for all instrumentation used.
Manufacturer’s calibration procedures will be followed. For in-field measurements of temperature,
dissolved oxygen, pH, salinity and conductivity, procedures for determining precision include the
following:
• Temperature sensor: The precision of temperature sensors used in this project will be
checked using a NIST-traceable standard thermometer.
• DO sensor: The accuracy of DO sensors and methods used in this project will follow the
EAI SOP for instrument calibration. The YSI 85 and Hach/Hydrolab Quanta meters have a
saturation chamber which creates a 100% water saturated air environment for calibration.
The meter is temperature compensated and a prompt for manually entering ambient altitude
during calibration adjusts for sea level measurements.
• pH sensor: The accuracy of pH sensors used in this project will be checked using pH 4, 7,
and 10 certified buffer solutions.

August 2011 2-6 PSL EPU/EAI QAP, Revision 1.doc
Ecological Associates, Inc.
• Salinity/Conductivity sensor: The accuracy of the conductivity sensor used in this project
will be checked using certified conductivity standard solutions. The conductivity sensor is
calibrated using both 10 mS/cm and 50 mS/cm certified conductivity standard solutions
which bracket the anticipated conductivity range.
2.4.3 REPRESENTATIVENESS
Data representativeness is defined as the degree to which data actually represent a characteristic of a
population, parameter, variations at a sampling point, a process condition, or an environmental
condition. It therefore addresses the natural variability or the spatial and temporal heterogeneity of a
population. The location of the sampling points and the number of samples collected from each
sampling station during each sampling event will be examined to ensure that representative sample
collection from each station occurs.
2.4.4 COMPARABILITY
Two data sets are considered to be comparable when there is confidence that the two sets can be
considered equivalent with respect to the measurement of a specific variable or group of variables.
Comparability is dependent on the proper design of the sampling program and on adherence to
accepted sampling techniques, SOP, and QA guidelines. Comparability of data is ensured by
similarity in sampling methods, parameter measurement protocols, as well as by uniform training and
experience of field sampling and laboratory personnel. All field personnel conducting sampling will
have adequate training and appropriate experience.
2.4.5 COMPLETENESS
Completeness is defined as the percentage of measurements made that are judged to be valid
according to specific criteria and entered into the data management system. To achieve this objective,
every effort is made to avoid accidental or inadvertent sample or data loss. Accidents during sample
transport or lab activities that cause the loss of the original samples will result in irreparable loss of
data. Lack of data entry into the database will reduce the ability to perform analyses, integrate
results, and prepare reports. Field personnel will assign a set of continuous identifiers to a batch of
samples. Samples will be stored and transported in unbreakable (plastic) containers and final sample
processing will occur in a controlled environment within the laboratory. The assignment of a set of
continuous (serial) laboratory numbers to a batch of samples makes it less likely that a technician or
taxonomist will overlook samples when preparing them for processing and identification. The
August 2011 2-7 PSL EPU/EAI QAP, Revision 1.doc
Ecological Associates, Inc.
laboratory serial (or log) numbers also make it easy during the data compilation stage to recognize
that some samples have not been analyzed.
Percent completeness (% C) for measurement parameters can be defined as follows:
%C=[V/T] x 100
Where: V = the number of measurements judged valid and T = the total number of measurements.
For this project, sampling will be considered complete when no less than 90 percent of the samples
collected during a particular sampling event are judged valid.
2.5 INSTRUMENT/EQUIPMENT TESTING, INSPECTION, MAINTENANCE, AND CALIBRATION
Periodic regular inspection of equipment and instruments is needed to ensure the satisfactory
performance of the systems. Equipment to be used during the sampling event is listed in the
appropriate SOP. Before any piece of sampling or measurement equipment is taken into the field, it
will be determined to be appropriate for the task to be performed, that all necessary parts of the
equipment are intact, and the equipment is in working order. In addition, the equipment will be
visually inspected before its use by the field sampling team. Broken equipment will be labeled “DO
NOT USE” and returned to the office to receive necessary repairs or for disposal. Backup field
equipment will be available during all field activities in the event of equipment failure. The objective
of preventive maintenance is to ensure the availability and satisfactory performance of the equipment.
All field measurement instruments will receive preventive maintenance in accordance with the
manufacturer’s specifications.
Calibration of water quality instruments used for in-field measurements of temperature, dissolved
oxygen, pH, salinity and conductivity will be checked before each sampling event using certified
standard solutions. Calibrations will be recorded on instrument calibration forms, FDEP Form FD
9000-8 or equivalent (Appendix C). Individual sensors will be considered to be operating correctly if
the instrument readings are within the range of their respective precision values as provided by the
instrument manufacturer (Appendix C, Table 1-2). If the values are not within the specified range for
an individual sensor, the sensor will be cleaned and recalibrated. If these two values are still not
within the specified range following cleaning and recalibration, the sensor will be replaced. All field
August 2011 2-8 PSL EPU/EAI QAP, Revision 1.doc
Ecological Associates, Inc.
equipment will be inspected, maintained, and calibrated as described in the maintenance and
calibration portion of the EAI SOP.
2.6 DATA MANAGEMENT
Samples will be documented and tracked by means of Field Data Sheets, Sample Identification
Labels, and Chain-of-Custody Record forms. The Field Team Leaders will be responsible for
completing these forms, which the QC Officer will review for correctness and completeness. EAI
will maintain copies of these forms in the project files. If there is any indication that requirements for
sample integrity or data quality have not been met, the QA Officer will be notified immediately (with
an accompanying explanation of the problems encountered).
Field sampling data will be compiled and stochastically analyzed. Information obtained from
analyses will be used to calculate the density and types of organisms removed from the source water
body due to the sampling type. All field and laboratory data will be entered into a project database.
EAI will store all computer files associated with the project in a project subdirectory (subject to
regular system backups) and will copy the files to archival media and retain for two years after
project completion (unless otherwise directed).
2.7 HANDLING OF STATE OR FEDERALLY LISTED SPECIES
Although the probability of an encounter with endangered or threatened species in regular sampling is
low, every precaution will be taken to ensure that should this occur, the animals will be released
unharmed. Data (i.e., length, weight, photograph) will be collected on any individuals of listed
species and recorded as part of the regular sampling process. Because of the small size of the gear
employed (gill nets, seines, plankton nets and otter trawls), short duration of tow times, lack of
mechanical advantage or winches on otter trawls, and avoidance of sampling in federally managed
areas, any potential impacts to endangered or threatened species will be minimized. Any individuals
caught will be immediately released after the information on the capture is recorded. Proper handling
techniques and reporting requirements will be utilized. For example, if sea turtles are captured,
standard federal procedures on resuscitation will be followed or the animal will be considered a
stranding and handled appropriately with the FFWCC authorities. Similarly, any impacts to other
State or Federally listed species will be minimized by quick release (e.g., gulf sturgeon). It is possible
that eggs or larvae of listed species may be captured as part of the planktonic sampling, and these
August 2011 2-9 PSL EPU/EAI QAP, Revision 1.doc
Ecological Associates, Inc.
organisms will be unavoidably removed from the system. Data collected will potentially provide
additional information that will aid in the management of listed species populations.
August 2011 3-1 PSL EPU/EAI QAP, Revision 1.doc
Ecological Associates, Inc.
3.0 ASSESSMENT AND OVERSIGHT
3.1 ASSESSMENT AND RESPONSE ACTIONS
The QA program includes technical system audits, with independent checks of the data obtained from
sampling, analysis, and data gathering activities. The essential steps in the QA program are as
follows:
• Identify and define the problem;
• Assign responsibility for investigating the problem;
• Investigate and determine the cause of the problem;
• Assign and accept responsibility for implementing appropriate corrective action;
• Establish the effectiveness of and implement the corrective action; and
• Verify that the corrective action has eliminated the problem.
Many of the technical problems that might occur can be solved immediately by the staff members
involved (i.e., modifying the technical approach, repairing instrumentation that is not functioning
properly, or correcting errors or deficiencies in documentation). Immediate corrective actions form
part of normal operating procedures and are noted in records for the project. Problems not solved this
way require more formalized, long-term corrective action. If quality problems that require attention
are identified, EAI will determine whether attaining acceptable quality requires either short- or long-
term actions. If a failure in an analytical system occurs (e.g., performance requirements are not met),
the QC Officer will be responsible for corrective action and will immediately inform the PM or QA
Officer, as appropriate. Subsequent steps taken will depend on the nature and significance of the
problem. The PM has primary responsibility for monitoring the activities of this project and
identifying or confirming any quality problems. The QA Officer will initiate the corrective action
required, document the nature of the problem (using a form such as that shown in Figure 3-2), and
ensure that the recommended corrective action is carried out. The QA Officer has the authority to
stop work on the project if problems affecting data quality that will require extensive effort to resolve
are identified. The PM will be notified of major corrective actions and stop work orders.
Data review and validation services provide a method for determining the usability and limitations of
data and provide a standardized data quality assessment. All field record forms and Chain-of-
Custody Record forms will be reviewed by the QA Officer for completeness, correctness and
adherence to QA requirements. Data quality will be assessed by comparing entered data to original
data or by comparing results with the measurement performance criteria.

August 2011 4-1 PSL EPU/EAI QAP, Revision 1.doc
Ecological Associates, Inc.
4.0 DATA VALIDATION AND USABILITY
4.1 VERIFICATION AND VALIDATION METHODS
All entries in the field data sheets, field log notebook, and Chain-of-Custody Record form will be
reviewed by the Field Team Leader (assisted by the QA Officer, as needed) for completeness and
correctness. Any discrepancies in the records will be reconciled with the appropriate associated field
personnel and will be reported to the PM. EAI will be responsible for reviewing data entries and
transmittals for completeness and adherence to QA requirements. Data quality will be assessed by
verifying entered data to original data or by comparing results with the measurement performance
criteria to determine whether to accept, reject, or qualify the data. The submission of samples to
outside biological laboratories will include Chain-of-Custody Record forms, documenting sampling
time and date. This information will be checked by the laboratories.
4.2 RECONCILIATION WITH USER REQUIREMENTS
As soon as possible following completion of the sample collection and analyses, precision, accuracy,
and completeness measures will be assessed by EAI and compared with the criteria. This assessment
will represent the final determination of whether the data collected are of the correct type, quantity,
and quality to support their intended use for this project. Any problems encountered in meeting the
performance criteria (or uncertainties and limitations in the use of the data) will be discussed with the
PM and will be reconciled, if possible. All biological data will undergo an assessment to determine
their suitability for meeting project objectives. Measurements of physicochemical and biological
parameters obtained during the field sampling and laboratory analyses will be compared to the
requirements to ensure the number of samples obtained and their quality have met the project goal. A
preliminary data review will be conducted, and appropriate statistical tests will be performed (as
determined and directed by the PM) for summarizing and analyzing the data. The summary and
analysis will include an identification of the key underlying assumptions for the statistical procedures
to be valid, verification of the assumptions of the statistical test, and conclusions drawn from the data
(USEPA, 1998).

August 2011 5-1 PSL EPU/EAI QAP, Revision 1.doc
Ecological Associates, Inc.
5.0 REFERENCES
U.S. Environmental Protection Agency (USEPA). 1998. Guidance for Data Quality Assessment: Practical Methods for Data Analysis, EPA QA/G-9, QA97 Version. EPA/600/R-96/084. U.S. Environmental Protection Agency, Office of Research and Development, Washington, DC.
August 2011 6-1 PSL EPU/EAI QAP, Revision 1.doc
Ecological Associates, Inc.
6.0 ACRONYMN DEFINITIONS
CD – Compact disc
DO – Dissolved oxygen
DQI – Data Quality Initiative
DQO – Data Quality Objective
DVD – Digital video disc
EPA – Environmental Protection Agency
FDEP – Florida Department of Environmental Protection
FFWCC – Florida Fish and Wildlife Conservation Commission
mS – milliSiemens
NIST – National Institute of Standards and Technology
PM – Project manager
PTD – Percent taxonomic difference
QA – Quality assurance
QAP – Quality Assurance Plan
QC – Quality control
RPD – Relative percent difference
SE – Sorting efficiency
TL – Total length
SOP – Standard Operating Procedures

Table 1-1. ENVIRONMENTAL DATA TO BE COLLECTED DURING PSL UPRATE BIOLOGICAL MONITORING PLAN OF STUDY
DATA TYPE MEASUREMENT ENDPOINT(S) OR UNITS
Physiochemical Parameters
Photo documentation Visual record of sampling site characteristics and unusual conditions
GPS location Coordinates of sampling sites (degrees, minutes, thousandths of minutes)
Temperature Degrees Centigrade (°C)
Dissolved oxygen Milligrams per liter (mg/L)
pH pH Unit
Specific conductivity milliSiemens per centimeter (mS/cm)
Salinity Parts per thousand (ppt)
Biological Parameters (as necessary)
Fish egg density Eggs per cubic meter (eggs/m3)
Larval fish/shellfish density Larvae/m3
Fish/shellfish – trawl Number of individuals per square meter of bottom trawled (#/m2)
Fish/shellfish – gill net Number of individuals per 30 minute set (#/30 min)
Fish/shellfish – beach seine Number of individuals per seine (#/seine)

Table 1-2. MEASUREMENT PERFORMANCE CRITERIA FOR ST. LUCIE PLANT MONITORING
MEASUREMENT PARAMETER PRECISION ACCURACY COMPLETENESS (%) Field Water Quality Measurements Temperature ±0.15°C NA¹ ≥ 90 pH ±0.2 units NA¹ ≥ 90 Dissolved Oxygen ±0.2 mg/L + 10% ≥ 90 Salinity +0.01 pp + 15% ≥ 90 Conductivity ±0.001 mS/cm + 15% ≥ 90 Ichthyoplankton Measurements Egg Density RPD² ≤ 10% 95% calculation efficiency ≥ 95 Larval Density RPD ≤ 10% 95% calculation efficiency ≥ 95
Larval Taxonomy RPD <15% 95% calculation efficiency Literature confirmation³ ≥ 95
Fish and Shellfish Measurements Fish and Shellfish Lengths +/- 1 mm NA¹ > 95
Fish and Shellfish Taxonomy PTD4< 15% Confirmation in lab with
taxonomic keys and independent verification
> 95
¹ NA=Not applicable; Analytical truth is unknown for these field measures (i.e., there is no analytical standard). ² RPD = Relative percent difference. ³ Analytical truth based on taxonomic literature. 4PTD = Percent taxonomic difference.
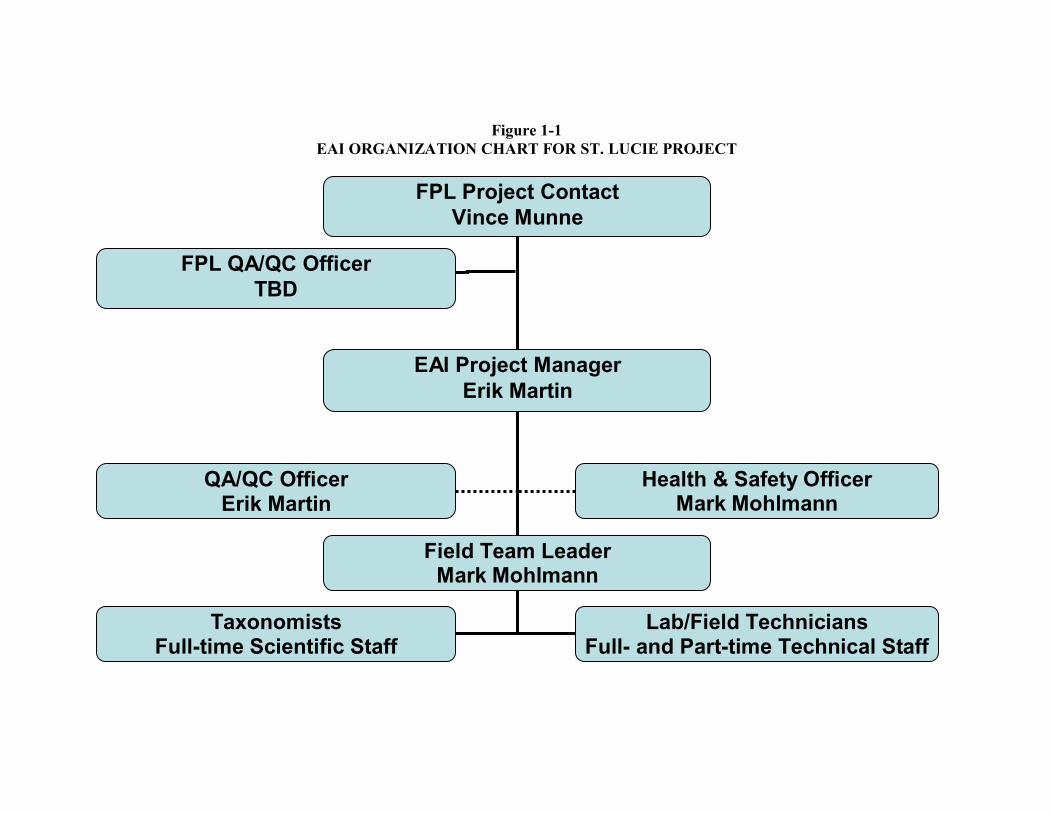
Figure 1-1 EAI ORGANIZATION CHART FOR ST. LUCIE PROJECT
FPL Project Contact Vince Munne
FPL QA/QC Officer TBD
EAI Project Manager Erik Martin
Field Team Leader Mark Mohlmann
QA/QC Officer Erik Martin
Health & Safety Officer Mark Mohlmann
Lab/Field Technicians Full- and Part-time Technical Staff
Taxonomists Full-time Scientific Staff

Yes No
QA/QC Officer:
Project Manager:
Date
Recommended Action:
Action Taken:
Project: Project Manager:
Potential Effect(s) on Data Quality:
Name of Person Reporting Problem:
Date Reported:
QA/QC Officer
Description of Problem Encountered:
Date Action Completed:
Corrective Action Request and Response Verification
Figure 3-1
Date
Signature
Signature
VERIFICATION OF CORRECTIVE ACTION
Corrective Action Has Effectively Resolved Problem:
ST. LUCIE PLANT EPU BIOLOGICAL STUDY QUALITY ASSURANCE PLAN
APPENDIX A FIELD DATA SHEETS

St. Lucie Plant 1 and 2 Uprate Project: Base Field Data Sheet - Beach SeineArea: SL1-
- SL2-
SL3-
Sampling Date/Time Personnel Point: a - North Type GN - Gill Net
07/28/2011 Mark Mohlmann b - Middle TR - Trawl
Matt Goff c - South IP - Ichthyoplankton
Carrie Goethel BS - Beach Seine
Jen Sanders ST - Sea Turtle Survey
High Ebb
Low Flood
Site Data
Time on Station:
Environmental Data
Current Direction
Current Speed
Mostly Cloudy Overcast No
Date:
Northern Area - Between Central Area and Ft. Pierce Inlet
Central Area - In the vicinity of the FPL St. Lucie Plant
Area Southern Area - Between Central Area and St. Lucie Inlet
FTL: Crew:
Time Arrive:
Time Depart:
Tide (Circle one) Sea Conditions
Crew:
Crew:
Crew:
Beach Seine Data
Clear Partly Cloudy
End
Seine Time Notes on Net Set
Start
Recorded By: Data Entered By: Data Verified By:Date:
Position Latitude (°N) Longitude (°W)
Time Net Deployed Time Net Beached
Water Temperature (°C)
Date:
Air Temp (°C) Wind Dir Sky Conditions
(Circle one)Precip
(Circle one) Notes on Environmental Data
Yes
Notes:
Crew:
Crew:
Crew:
Distance to 4' Depth
Estimated Surf Height (ft)
Estimated Water Visibility (ft)
Wind Spd (mph)
Sample Identification Number: SL1 - a - BSTransect Type
072811Date (MMDDYY)

St. Lucie Plant 1 and 2 Uprate Project: Base Field Data Sheet - IchthyoplanktonArea: SL1-
- SL2-
SL3-
Sampling Date/Time Personnel Point: a - Nearshore Type GN - Gill Net
07/28/2011 Mark Mohlmann b - Middle TR - Trawl
Matt Goff c - Offshore IP - Ichthyoplankton
Carrie Goethel BS - Beach Seine
Other _______________ ST - Sea Turtle Survey
High Ebb
Low Flood
Site Data
Date:Recorded By: Data Entered By: Data Verified By:Date:
South Hach-A Hach-B YSIMid-Depth
Surface
Bottom
Hach-A Hach-B YSIMid-Depth
Bottom
Bottom
Read By (Initials) Notes on Water Quality Data
Middle
Surface
Temp (°C) Salinity (PSU)
pH DO (mg/L)
Meter Used (Circle one)
North
SurfaceHach-A
Hach-B YSIMid-Depth
Position Profile Time (HH:MM)
Depth Taken
(m)
Sp. Cond (mS/cm)
End
Water Quality Data
Total (End - Start)
Start
Partly Cloudy Yes
Mostly Cloudy Overcast No
Bongo Data
Position Latitude (°N) Longitude (°W) Water Depth (ft)
Clear
Time Arrive: Crew: 25' Parker
Time Depart: Crew:
Time on Station: Crew:
Environmental Data
Current Direction
Current Speed
Tide (Circle one) Sea Conditions Air Temp
(°C) Wind Dir Wind Spd (mph)
Sky Conditions (Circle one)
Precip (Circle one) Notes on Environmental Data
Position
Start
End
Notes on Bongo TowFlowmeter A Flowmeter BTime
Northern Area - Between Central Area and Ft. Pierce Inlet
Central Area - In the vicinity of the FPL St. Lucie Plant
Area Southern Area - Between Central Area and St. Lucie Inlet
SL1 - a - IPTransect TypeDate (MMDDYY)
072811Sample Identification Number:
Sampling Vessel
Date: FTL: (Circle one)
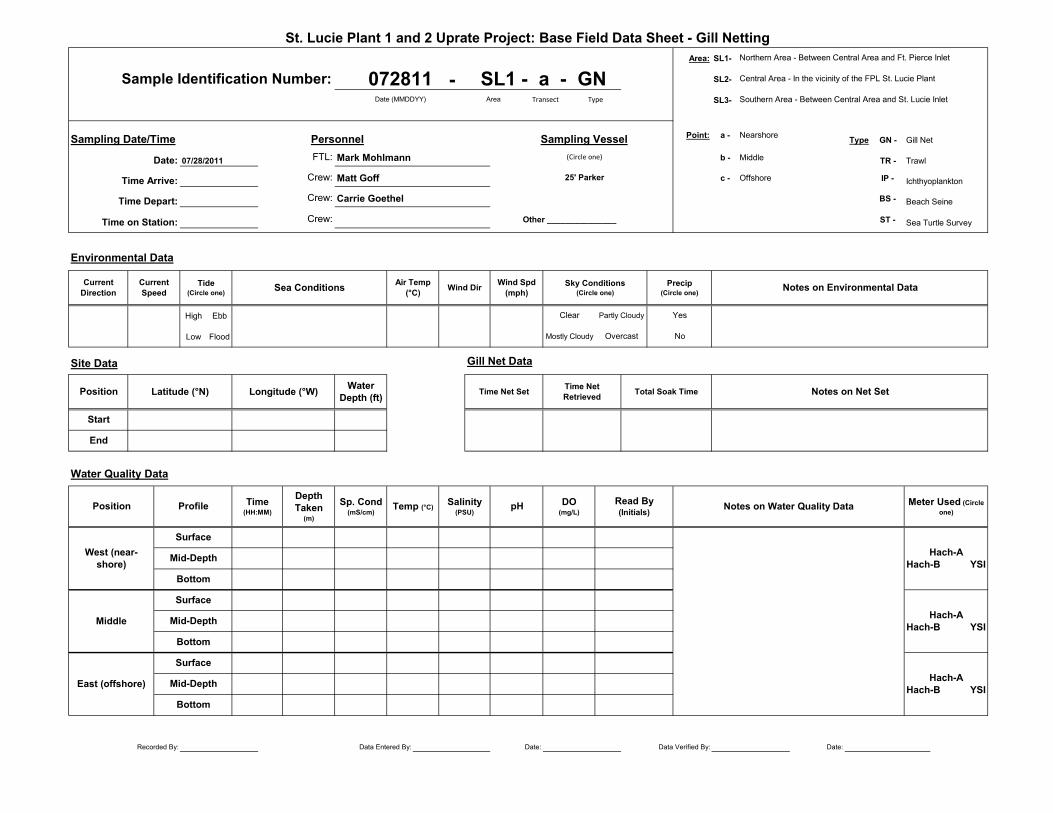
St. Lucie Plant 1 and 2 Uprate Project: Base Field Data Sheet - Gill NettingArea: SL1-
- SL2-
SL3-
Sampling Date/Time Personnel Point: a - Nearshore Type GN - Gill Net
07/28/2011 Mark Mohlmann b - Middle TR - Trawl
Matt Goff c - Offshore IP - Ichthyoplankton
Carrie Goethel BS - Beach Seine
Other _______________ ST - Sea Turtle Survey
High Ebb
Low Flood
Site Data
Wind Dir Wind Spd (mph)
Sky Conditions (Circle one)
Precip (Circle one)
Water Depth (ft)
Yes
Mostly Cloudy Overcast No
Gill Net Data
Notes on Net Set
Sea Conditions Notes on Environmental Data
Clear Partly Cloudy
Longitude (°W)
Northern Area - Between Central Area and Ft. Pierce Inlet
Central Area - In the vicinity of the FPL St. Lucie Plant
Southern Area - Between Central Area and St. Lucie Inlet
Total Soak TimeTime Net Set Time Net Retrieved
Crew:
Crew:
Position
Position
Start
End
Environmental Data
West (near-shore)
Bottom
Surface
Mid-Depth
Mid-Depth
25' Parker
(Circle one)
Time on Station:
Time Depart:
Crew:
FTL:
Middle
East (offshore)
Recorded By: Data Entered By: Date:
Mid-Depth
Bottom
Latitude (°N)
Meter Used (Circle one)
Surface
Profile Time (HH:MM)
Depth Taken
(m)
Sp. Cond (mS/cm)
Tide (Circle one)
Air Temp (°C)
Bottom
Surface
Water Quality Data
Hach-A Hach-B YSI
Date:Data Verified By:
Hach-A Hach-B YSI
Notes on Water Quality DataSalinity (PSU)
pH DO (mg/L)
Read By (Initials)
Hach-A Hach-B YSI
Time Arrive:
Date:
SL1 - a - GNType
Temp (°C)
Current Direction
Current Speed
Transect
072811Date (MMDDYY)
Sample Identification Number:Area
Sampling Vessel

St. Lucie Plant 1 and 2 Uprate Project: Base Field Data Sheet - Sea Turtle SurveyArea: SL1-
- SL2- Central Area - In the vicinity of the FPL St. Lucie Plant
SL3- Southern Area - Between Central Area and St. Lucie Inlet
Date: FTL: Crew:
Crew:
High Ebb
Low Flood
Site Data
Notes:
Position
Start
End
Latitude (°N) Longitude (°W)
No
Time
Area Type
Latitude (°N)
Northern Area - Between Central Area and Ft. Pierce Inlet
Sample Identification Number:
Crew:
Personnel
SL1 - ST072811Date (MMDDYY)
Distance and Angle
Environmental Data
Current Direction
Current Speed
Tide (Circle one)
Underwater Visiblity (ft)
Notes on Environmental Data
Clear Partly Cloudy Yes
Mostly Cloudy Overcast
Sea Conditions Air Temp (°C) Wind Dir Wind Spd
(mph)Sky Conditions
(Circle one)Precip
(Circle one)
Sea Turtle Data
Time Water Temperature (°C)Longitude (°W)
Data Verified By:Date: Date:
4
Time Species Size (cm) Surf or Subm Waypoint
Recorded By: Data Entered By:
East or West
Pass # (1 or 2)
1
Turtle #
E W
E W
2 E W
3
E W
E W
5
6
7
9
8
Pass #1 Pass #2
10 E W
Sampling Vessel:
E W
E W
E W
E W
Species: CC=loggerhead, CM=green turtle, EI=hawksbill, LK=Kemp's ridley, DC=leatherback; Surf=surfaced, Subm=submerged Page _____ of ______

St. Lucie Plant 1 and 2 Uprate Project: Base Field Data Sheet - TrawlArea: SL1-
- SL2-
SL3-
Sampling Date/Time Personnel Point: a - Nearshore Type GN - Gill Net
07/28/2011 Mark Mohlmann b - Middle TR - Trawl
Matt Goff c - Offshore IP - Ichthyoplankton
Carrie Goethel BS - Beach Seine
Other _______________ ST - Sea Turtle Survey
Environmental Data □ Use Bongo Data - Sample ID No.:_____________________
High Ebb
Low Flood
Site Data □ Use Bongo Data - Sample ID No.:_____________________ □ Use Bongo Data - Sample ID No.:_____________________
Water Quality Data □
Date:Recorded By: Data Entered By: Data Verified By:Date:
South Hach-A Hach-B YSIMid-Depth
Surface
Bottom
Hach-A Hach-B YSIMid-Depth
Bottom
Bottom
Read By (Initials) Notes on Water Quality Data
Middle
Surface
Temp (°C) Salinity (PSU)
pH DO (mg/L)
Meter Used (Circle one)
North
SurfaceHach-A
Hach-B YSIMid-Depth
Start
Position Profile Time (HH:MM)
Depth Taken
(m)
Sp. Cond (mS/cm)
End
Total (End - Start)
Partly Cloudy Yes
Mostly Cloudy Overcast No
Position Latitude (°N) Longitude (°W) Water Depth (ft)
Clear
Crew: 25' Parker
Time Depart: Crew:
Notes on Environmental Data
Time on Station: Crew:
Current Direction
Current Speed
Tide (Circle one) Sea Conditions
Notes on TrawlFlowmeter A Flowmeter B
Air Temp (°C) Wind Dir Wind Spd
(mph)Sky Conditions
(Circle one)Precip
(Circle one)
Northern Area - Between Central Area and Ft. Pierce Inlet
Central Area - In the vicinity of the FPL St. Lucie Plant
Area Southern Area - Between Central Area and St. Lucie Inlet
SL1 - a - TRTransect
Sampling Vessel
Date: FTL: (Circle one)
Time
Use Bongo Data - Sample ID No.:_____________________
Trawl Data
TypeDate (MMDDYY)
072811Sample Identification Number:
Position
Start
End
Time Arrive:

Ecological Associates, Inc. - St. Lucie Plant Uprate - Ichthyoplankton Laboratory Bench Sheet
REF (Y/N)
Eggs YSL PL Juv NOTES
QC Date Total QC Time
% Taxonomic Agreement: Notes:
Number per Life Stage
Sample ID:
Total ID Time
Due Date:
Primary Taxonomist ID Date
FAMILY/ TAXA GENUS SPECIES VIAL NO. ADD. SPLIT X (Multiplier)
QC Taxonomist
Project: St. Lucie
Data Entered By: ____________ Date: ______ Data Verified By: ____________ Date: ______

St. Lucie Units 1 and 2 Uprate ProjectBeach Seine Field Data Sheet
Page ____ of ____
072811 -SL1- a - BS
Notes:
Taxa
Date: 7/28/11 Time: _______Date (MMDDYY) Area Point Type
Sample Identification Number:
Number Retained
Number CollectedTally Notes
Field Data Recorded by: _______ Data Entered By: __________ Date: __________ Data Verified By: _________ Date: __________
ST. LUCIE PLANT EPU BIOLOGICAL STUDY QUALITY ASSURANCE PLAN
APPENDIX B SAMPLE IDENTIFICATION LABEL AND
CHAIN-OF-CUSTODY FORM

TAXONOMIC CHAIN-OF-CUSTODY RECORDEcological Associates, Inc
PO Box 405Jensen Beach, FL 34958
(772) 334-3729 fax (772) 334-4925
FormalinEthanolOther ____________________
Sample Origination: Alternate Origination:Name:
Address:
City, State, Zip:
Shipping Method:
RELINQUISHED BY: (SIGNATURE AND AFFILIATION):
RELINQUISHED BY: (SIGNATURE AND AFFILIATION):
Date:
Date:
Date:
Time:
Time:
Time:
EAI Contact Phone:
RELINQUISHED BY: (SIGNATURE AND AFFILIATION): RECEIVED BY: (SIGNATURE AND AFFILIATION):
Receiving Laboratory:Name:
Address:
City, State, Zip:
Phone:
Date: Time:
RECEIVED BY: (SIGNATURE AND AFFILIATION): Date:
Phone:
Time:
Preservative:
Tracking Number:
Laboratory Contact Name:
Laboratory Contact Phone (if different from above):
Laboratory Contact Email:
RECEIVED BY: (SIGNATURE AND AFFILIATION): Date: Time:
Vial Number
Collection Date
(mm/dd/yy)Vial
Number
Collection Date
(mm/dd/yy) Taxon (if known) Taxon (if known)
Sample NumberSample Number
Vial Number
Ecological Associates, Inc
1458 NE Sunview Terrace
Jensen Beach, FL 34957
(772) 334-3729
Sample Conditions/ Remarks:
Sample Number
Project Name:
Project Number:
EAI Contact Name
Collection Date
(mm/dd/yy) Taxon (if known)
Page ____ of ____Date Printed:8/12/2011
File:St. Lucie QAP Appendix B EAI Taxonomic Chain-of-Custody, Final
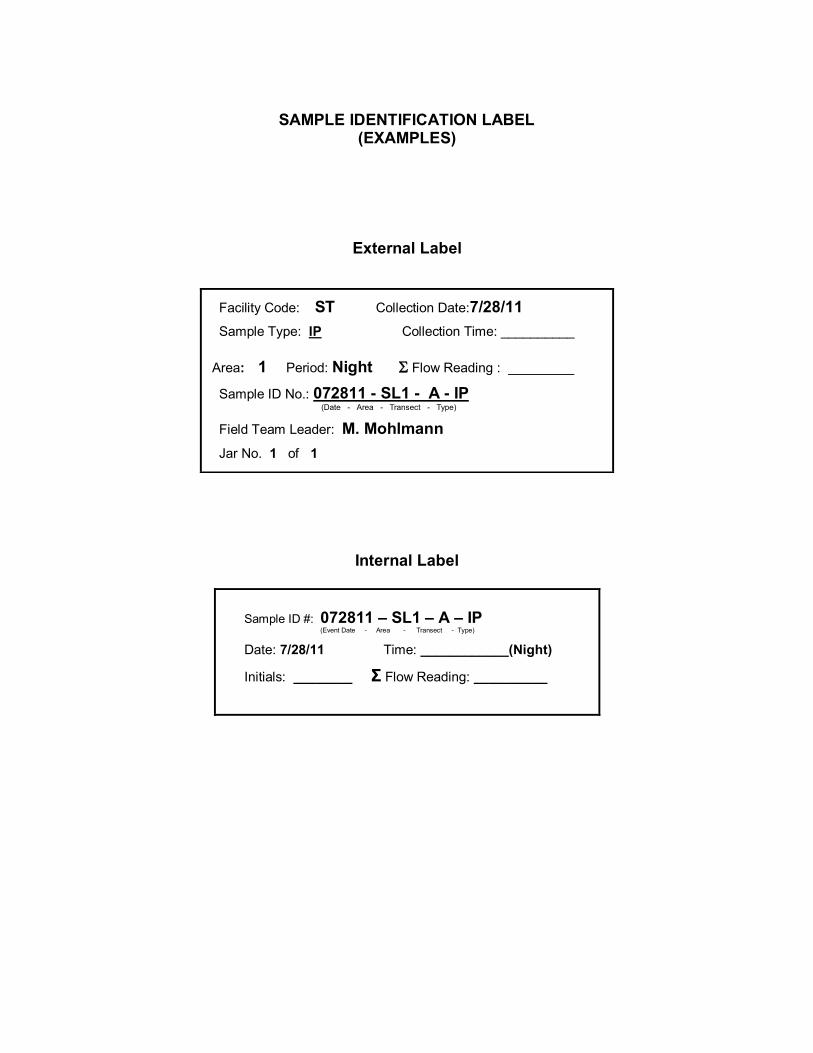
SAMPLE IDENTIFICATION LABEL
(EXAMPLES)
External Label
Internal Label
Facility Code: ST Collection Date:7/28/11
Sample Type: IP Collection Time: __________
Area: 1 Period: Night Flow Reading : _________
Sample ID No.: 072811 - SL1 - A - IP (Date - Area - Transect - Type) Field Team Leader: M. Mohlmann
Jar No. 1 of 1
Sample ID #: 072811 – SL1 – A – IP (Event Date - Area - Transect - Type)
Date: 7/28/11 Time: ____________(Night)
Initials: ________ Σ Flow Reading: __________

ST. LUCIE PLANT EPU BIOLOGICAL STUDY QUALITY ASSURANCE PLAN
APPENDIX C PROJECT SOP

ST. LUCIE PLANT EPU BIOLOGICAL
STUDY
STANDARD OPERATING PROCEDURES
(SOP)
Prepared By
Ecological Associates Inc.
Post Office Box 405
Jensen Beach, Florida 34958
August 2011

TABLE OF CONTENTS
1.0 Introduction ......................................................................................................... 1 2.0 Health and Safety ................................................................................................. 2 3.0 Mobilization ........................................................................................................ 2 4.0 Water Quality ...................................................................................................... 3 5.0 Trawl and Plankton Sampling – Preparation and Methods .................................... 4 6.0 Sampling Location and Frequency ....................................................................... 5 7.0 Field Data Collection ........................................................................................... 7 8.0 Trawl Sampling: Location and Methods ............................................................... 8 9.0 Ichthyo- and Meroplankton Sampling: Location and Methods ........................... 13 10.0 Gill Net Sampling: Location and Methods ......................................................... 16 11.0 Beach Seine Sampling: Location and Methods ................................................... 20 12.0 Sea Turtle Survey: Location and Methods .......................................................... 23 13.0 Laboratory Sorting/Specimen Identification ....................................................... 24 14.0 Trawl: Identification of Retained Specimens ..................................................... 30 APPENDIX A ............................................................................................................... 36 APPENDIX B ............................................................................................................... 39 APPENDIX C……………………………………………………………………………43

ST. LUCIE PLANT EPU BIOLOGICAL STUDY
STANDARD OPERATING PROCEDURES (SOP)
1.0 Introduction
This document describes the methods, procedures, and protocols to be used by staff of
Ecological Associates, Inc. (EAI) in support of Florida Power and Light Company’s
(FPL’s) trawl, plankton, gill net, beach seine, and sea turtle study at the St. Lucie Plant.
Activities governed under this Standard Operating Procedures (SOP) include sample
collection, sample processing, taxonomic identification of specimens, and collection of
physicochemical data.
Larval, juvenile, and adult fish and shellfish sampling will be conducted within three
general areas adjacent to the St. Lucie Plant: one site parallel to the discharge structure
and two reference sites. One of these will be located approximately midway between the
discharge site and the Ft. Pierce Inlet and the other midway between the discharge site
and the St. Lucie Inlet. Data will be collected bi-monthly, during both day and night
periods, as described in this SOP. Data analyses will examine trends in species
composition, abundance, and biomass, as well as diurnal and seasonal variation.
Sampling in the area of the St. Lucie Plant will be conducted using trawls, bongo nets,
gill nets, and beach seines. A 16-foot otter trawl and a 100-foot beach seine will be used
to collect juvenile and adult fish and shellfish, and ichthyoplankton and shellfish larvae
will be collected using paired 0.5 mm-mesh bongo nets. In addition, a 600-foot gill net
will be used to collect juvenile and adult fish.
Questions on sampling techniques, staffing, schedules, health and safety issues, and/or
Quality Assurance/Quality Control (QA/QC) related to sampling at the St. Lucie Plant
should be directed to one of the following individuals:
August 2011 PSL EPU/EAI SOP, Revision 0.doc
Ecological Associates, Inc. 2
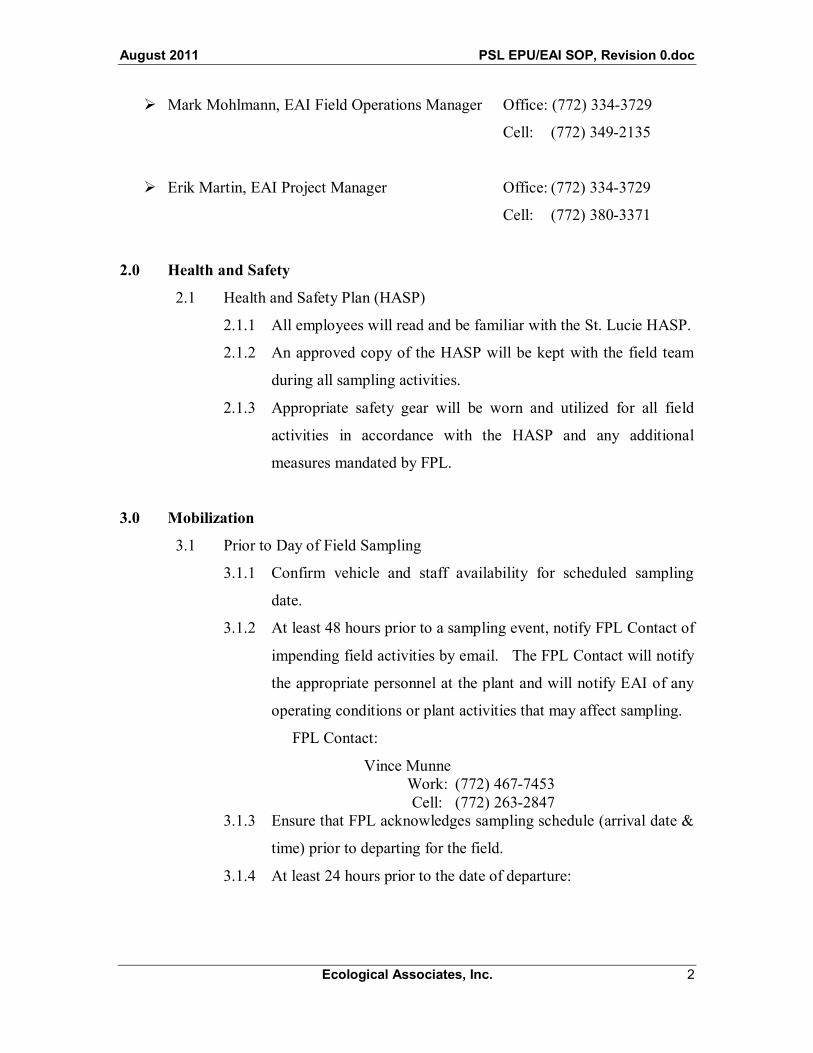
Mark Mohlmann, EAI Field Operations Manager Office: (772) 334-3729
Cell: (772) 349-2135
Erik Martin, EAI Project Manager Office: (772) 334-3729
Cell: (772) 380-3371
2.0 Health and Safety
2.1 Health and Safety Plan (HASP)
2.1.1 All employees will read and be familiar with the St. Lucie HASP.
2.1.2 An approved copy of the HASP will be kept with the field team
during all sampling activities.
2.1.3 Appropriate safety gear will be worn and utilized for all field
activities in accordance with the HASP and any additional
measures mandated by FPL.
3.0 Mobilization
3.1 Prior to Day of Field Sampling
3.1.1 Confirm vehicle and staff availability for scheduled sampling
date.
3.1.2 At least 48 hours prior to a sampling event, notify FPL Contact of
impending field activities by email. The FPL Contact will notify
the appropriate personnel at the plant and will notify EAI of any
operating conditions or plant activities that may affect sampling.
FPL Contact:
Vince Munne Work: (772) 467-7453
Cell: (772) 263-2847 3.1.3 Ensure that FPL acknowledges sampling schedule (arrival date &
time) prior to departing for the field.
3.1.4 At least 24 hours prior to the date of departure:

August 2011 PSL EPU/EAI SOP, Revision 0.doc
Ecological Associates, Inc. 3
3.1.5 Contact the Florida Fish and Wildlife Conservation
Commission (FWC) and advise them of the scheduled
sampling activities, as per EAI’s Special Activity License.
3.1.5.1 FWC – Martin and St. Lucie Counties :
(561) 625-5128 (Phone)
3.1.6 Assemble equipment and supplies using applicable
Equipment and Supplies Checklists (Appendix A) and
ensure that all needed gear is in proper operating
condition.
3.1.7 Review Health and Safety Plan (HASP) and ensure that
all requisite safety gear is included with equipment and
supplies.
3.1.8 Calibrate field instrumentation (Appendix B).
3.2 Day of Field Sampling
3.2.1 Review sampling protocols prior to initiating field
activities.
3.2.2 Conduct a Safety and Environmental Tailboard meeting at
the site prior to sampling to address any safety and
environmental conditions the field team may encounter
(refer to HASP).
4.0 Water Quality
4.1 Calibration and Parameters
4.1.1 All meters taken into the field will be calibrated at the EAI office
prior to and following data collection in accordance with EAI’s
Quality Manual and QAP for the St. Lucie project.
4.1.2 A suite of standard water quality parameters, including
temperature, pH, conductivity, salinity, and dissolved oxygen,
will be taken at three equally spaced stations along each transect
during gill net, trawl and plankton sampling. Bottom, mid-depth
and sub-surface readings will be recorded at each station.

August 2011 PSL EPU/EAI SOP, Revision 0.doc
Ecological Associates, Inc. 4
5.0 Trawl and Plankton Sampling – Preparation and Methods
5.1 Mobilize
5.1.1 Use Equipment and Supplies Checklist to assemble and ready
trawl field gear (Appendix A).
5.1.2 Provide a Float Plan to EAI’s Field Operations Manager.
5.1.3 Prepare flow meters.
5.1.3.1 Sea Gear meters
5.1.3.1.1 Adjust dial to zero.
5.1.3.2 General Oceanics meters
5.1.3.2.1 Complete the following within 24 hours prior to
net deployment at the first sampling location to
ensure accurate readings.
5.1.3.2.1.1 Remove the screw at rear of the flow
meter.
5.1.3.2.1.2 Hold nose of meter down.
5.1.3.2.1.3 Inject tap water with a syringe or squirt
bottle into meter chamber until full.
5.1.3.2.1.4 Replace screw.
5.1.4 Prepare plankton sample containers.
5.1.4.1 Affix exterior sample labels on sample containers. Tape
interior labels to container lids.
5.1.4.2 Fill sample containers with 90-100 ml formaldehyde
(which will yield approximately 10% formalin when
mixed with salt water) and 6.3 g hexamethylenetetramine
(used as buffer). Place in carrying container.
5.1.5 Load gear aboard vessel.
5.2 Embarkation
5.2.1 Conduct a safety briefing prior to launching or loading gear on
vessel.
August 2011 PSL EPU/EAI SOP, Revision 0.doc
Ecological Associates, Inc. 5
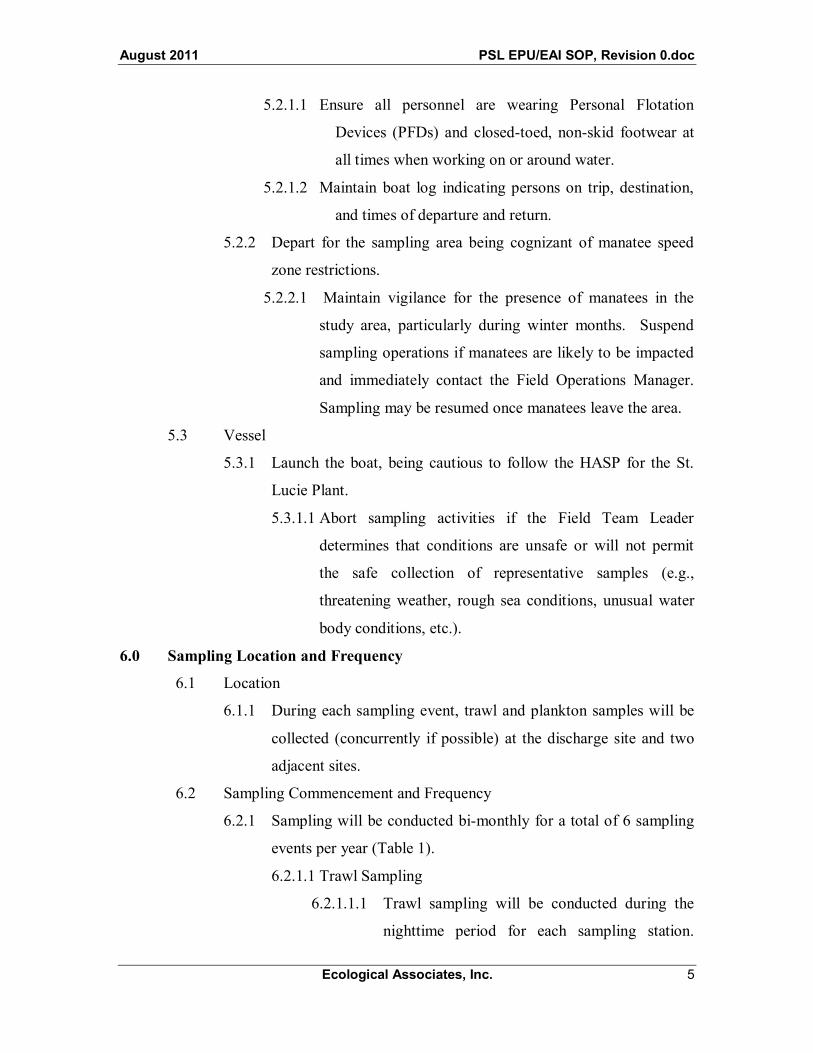
5.2.1.1 Ensure all personnel are wearing Personal Flotation
Devices (PFDs) and closed-toed, non-skid footwear at
all times when working on or around water.
5.2.1.2 Maintain boat log indicating persons on trip, destination,
and times of departure and return.
5.2.2 Depart for the sampling area being cognizant of manatee speed
zone restrictions.
5.2.2.1 Maintain vigilance for the presence of manatees in the
study area, particularly during winter months. Suspend
sampling operations if manatees are likely to be impacted
and immediately contact the Field Operations Manager.
Sampling may be resumed once manatees leave the area.
5.3 Vessel
5.3.1 Launch the boat, being cautious to follow the HASP for the St.
Lucie Plant.
5.3.1.1 Abort sampling activities if the Field Team Leader
determines that conditions are unsafe or will not permit
the safe collection of representative samples (e.g.,
threatening weather, rough sea conditions, unusual water
body conditions, etc.).
6.0 Sampling Location and Frequency
6.1 Location
6.1.1 During each sampling event, trawl and plankton samples will be
collected (concurrently if possible) at the discharge site and two
adjacent sites.
6.2 Sampling Commencement and Frequency
6.2.1 Sampling will be conducted bi-monthly for a total of 6 sampling
events per year (Table 1).
6.2.1.1 Trawl Sampling
6.2.1.1.1 Trawl sampling will be conducted during the
nighttime period for each sampling station.

August 2011 PSL EPU/EAI SOP, Revision 0.doc
Ecological Associates, Inc. 6
Nighttime sampling will not commence until at
least one hour after sunset.
6.2.1.1.2 A total of 54 trawl samples will be collected per
year (9 samples per sampling event X 6
sampling events; Table 1).
6.2.1.2 Plankton Sampling
6.2.1.2.1 Plankton sampling will be conducted during the
nighttime period for each sampling station.
Nighttime sampling will not commence until at
least one hour after sunset.
6.2.1.2.2 A total of 36 plankton samples will be collected
per year (6 samples per sampling event X 6
sampling events; Table 1).
6.2.1.3 Gill Net Sampling
6.2.1.3.1 Gill net sampling will be conducted during the
daytime period for each sampling station.
Daytime sampling will not commence until at
least one hour after sunrise.
6.2.1.3.2 A total of 54 gill net samples will be collected
per year (9 samples per sampling event X 6
sampling events; Table 1).
6.2.1.4 Beach Seine Sampling
6.2.1.4.1 Beach seine sampling will be conducted during
the daytime period for each sampling station.
Daytime sampling will not commence until at
least one hour after sunrise.
6.2.1.4.2 A total of 54 beach seine samples will be
collected per year (9 samples per sampling
event X 6 sampling events; Table 1).
6.2.1.5 Sea Turtle Survey

August 2011 PSL EPU/EAI SOP, Revision 0.doc
Ecological Associates, Inc. 7
6.2.1.5.1 Sea turtle utilization surveys will be conducted
during the daytime period for each sampling
station. Daytime sampling will not commence
until at least one hour after sunrise.
6.2.1.5.2 A total of 36 sea turtle surveys will be
conducted per year (2 passes along each of 3
transects per sampling event X 6 sampling
events; Table 1).
7.0 Field Data Collection
7.1 Ancillary Data
7.1.1 Upon arrival at the station, record weather conditions, sea state,
and water depth on the Bongo Field Data Sheet for nighttime
sampling or the Gill Net Field Data Sheet for daytime sampling.
If bongo and trawl sampling are being conducted concurrently,
check the appropriate box on the Trawl Field Data Sheet
verifying that the trawl and bongos were sampled concurrently,
and the above conditions can be used for both.
7.1.2 Collect water quality data at three equally spaced stations along
each transect during the sampling event.
7.1.2.1 After arriving on station, turn on water quality meter and
allow adequate time to warm up.
7.1.2.2 At all stations, measurements will be taken at bottom,
mid, and surface depths.
7.1.2.3 Measure temperature, pH, dissolved oxygen, conductivity,
and salinity with Hach/Hydrolab Quanta or equivalent
backup meter.
7.1.2.4 Record results on Bongo Field Data Sheet for nighttime
sampling and the Gill Net Field Data Sheet for daytime
sampling. If bongo and trawl sampling are being
conducted concurrently, check the appropriate box on the

August 2011 PSL EPU/EAI SOP, Revision 0.doc
Ecological Associates, Inc. 8
Trawl Field Data Sheet indicating the set of water quality
measurements on the Bongo Field Data Sheet applies to
the trawl data.
8.0 Trawl Sampling: Location and Methods
8.1 Sample Collection: Location
8.1.1 Conduct sampling along three sampling transects per site.
8.1.2 Towing will be conducted parallel to shore.
8.1.3 Use 16-foot otter trawl.
8.1.4 Conduct each tow for 15 minutes. If excessive debris loads are
encountered or weather conditions dictate, tow times may be
reduced or location may be adjusted at the discretion of the Field
Team Leader.
8.1.4.1 Conduct one bottom trawl at each station at night.
8.1.5 Operate at slow speed (2.0 – 3.0 knots). Ensure that the tow line
has the proper scope to keep the net on the bottom and out of the
direct prop wash.
8.1.5.1 Use 60’ bridle line attached to additional 50’ line secured
to the trawl doors for a total line length of 110’ for trawl
stations in water up to 20’ in depth. Add additional line
depending on water depth to achieve a 5:1 to 7:1 scope.
8.2 Sample Collection: Methods
8.2.1 Prepare the trawl for deployment. Attach trawl harness with
pulley to the transom u-bolts. Attach the trawl bridle to the trawl
doors and trawl harness to 50’ auxiliary line. Tie off the cod end
of the net and ensure that the net and lines are not twisted and
trawl will deploy correctly.
8.2.2 Attach float line to cod end.
8.2.3 If trawl is not being conducted concurrently with bongo tow,
record the initial flow meter reading on the Field Data Sheet and

August 2011 PSL EPU/EAI SOP, Revision 0.doc
Ecological Associates, Inc. 9
prepare for deployment. Ensure that the flow meter propeller
does not turn prior to deployment.
8.2.3.1 Attach one end of the flow meter bridle to a small
depressor and the other end of the bridle to the davit tow
line. Adjust the bridal and tow line as necessary so the
flow meter is deployed at mid depth.
8.2.4 Position the boat parallel to shore at one end of the station
transect and motor forward maintaining an appropriate speed to
deploy the net (just at or above idle). Ensure that all personnel
are clear of any lines and are positioned outside of the bridle and
harness.
8.2.5 Deploy the net by tossing the cod end off the stern and to the side
of the motor ensuring that net, lines, and tickler chain clear the
prop. Swing the doors over the transom of the boat and briefly
hold in place when deployed 10-15’ to allow the doors to spread.
Continue to deploy the trawl by guiding the bridle, tow line, and
harness over the stern clear of the prop.
8.2.6 When the net is fully deployed (tow line becomes taut),
immediately deploy the flow meter (if not conducting bongo tow
concurrently) from the davit and ensure that it is properly oriented
and facing into the current. Immediately activate timer. Record
time of deployment and GPS start point on Field Data Sheet.
8.2.7 Pull net at approximately 2.5 (2.0 – 3.0) knots in a relatively
straight line and at constant depth parallel to shore or slightly
angling away from shore.
8.2.7.1 If the trawl snags within the first seven minutes of the
tow, or if it is determined that the trawl has not fished
properly, discard the contents of the trawl overboard and
repeat the tow after addressing the cause of the problem.
8.2.8 At the end of the tow take the boat out of gear and immediately
retrieve flow meter and record reading. If the trawl is conducted

August 2011 PSL EPU/EAI SOP, Revision 0.doc
Ecological Associates, Inc. 10
concurrent with the bongo tow and the flowmeter readings are
within 10% of each other, record the average of the two bongo
flow meter readings on the Trawl Field Data Sheet. Record the
end time and end GPS waypoint on the Field Data Sheet. If the
difference between the two flowmeter readings are greater than
10%, the reading closest to the projected reading will be used.
Haul in the trawl tow line and harness over the starboard side of
the boat, maintaining tension on the lines. As the boat nears the
net, it may be necessary to move forward along the gunwale to
keep the net oriented on the starboard side or bump in and out of
gear to avoid drifting back over the net.
8.2.8.1 Bring the doors along side of the boat, clear of the prop.
Pull the doors over the side and into the boat, and shake
net to concentrate catch into cod end.
8.2.9 Untie and empty cod end into primary live well.
8.2.9.1 Carefully examine net liner and body of the net and
remove any entangled organisms.
8.2.9.2 Retie cod end in preparation for subsequent sampling.
8.3 Sample Processing
8.3.1 Wear work gloves or rubber gloves when processing samples to
avoid injury.
8.3.2 Carefully sift through debris in primary live well; transfer
specimens to bins within the secondary live well by species
groups for identification and measurement.
8.3.3 Use a small dip net to capture individual specimens or lift
specimen bins onto measuring board for processing.
8.3.3.1 Process live specimens first and return them to the water
as quickly as possible. Only discard dead specimens if
wind and current conditions will not cause specimens to
drift into an unsampled station area. Otherwise wait until
the trawl tows have been completed before discarding.

August 2011 PSL EPU/EAI SOP, Revision 0.doc
Ecological Associates, Inc. 11
8.3.4 Sort, identify, enumerate, and weigh fish and shellfish contained
in the sample, as described in 8.4 - 8.7.
8.3.5 Monitor the condition of organisms caught; record and quantify
specimens that appear to have been dead or injured prior to being
caught in the trawl (e.g., rotten/decomposed specimens, fish with
glazed/hazy eyes, etc.). Badly damaged specimens can be noted
by placing a “D” in the Retained block on the data sheet.
8.4 Field Collection
8.4.1 Sort, identify and enumerate all fish and shellfish contained in the
sample. Identify specimens to the lowest practicable taxon.
Scientific names will be verified using the Integrated Taxonomic
Information System (www.itis.gov) and common names will
follow AFS Special Publication 29, Sixth Edition (2004). Field
guides (e.g., EAI Field Identification Tools, 2008; Robins et al.,
1986) will be available during collection. A checklist of
previously collected species and common identification
characters will be developed over the life of the project and
available for reference.
8.4.2 Additionally, measure standard and total length of a subset of 25
individuals of each Representative Important Species (RIS)
(Table 2) from each station. Obtain a batch weight of the
representative specimens. Record these data on the Fish and
Shellfish Length and Weight Data Sheet. If more than 25
individuals are present, enter the total number of all remaining
specimens on the Data Sheet.
8.4.3 If samples contain excessively large numbers of individuals, a
random split may be used to obtain a representative sub-sample
that can be analyzed within a one-hour period. Large and/or
uncommon specimens should be removed, measured, and
recorded prior to splitting to minimize diversity loss.
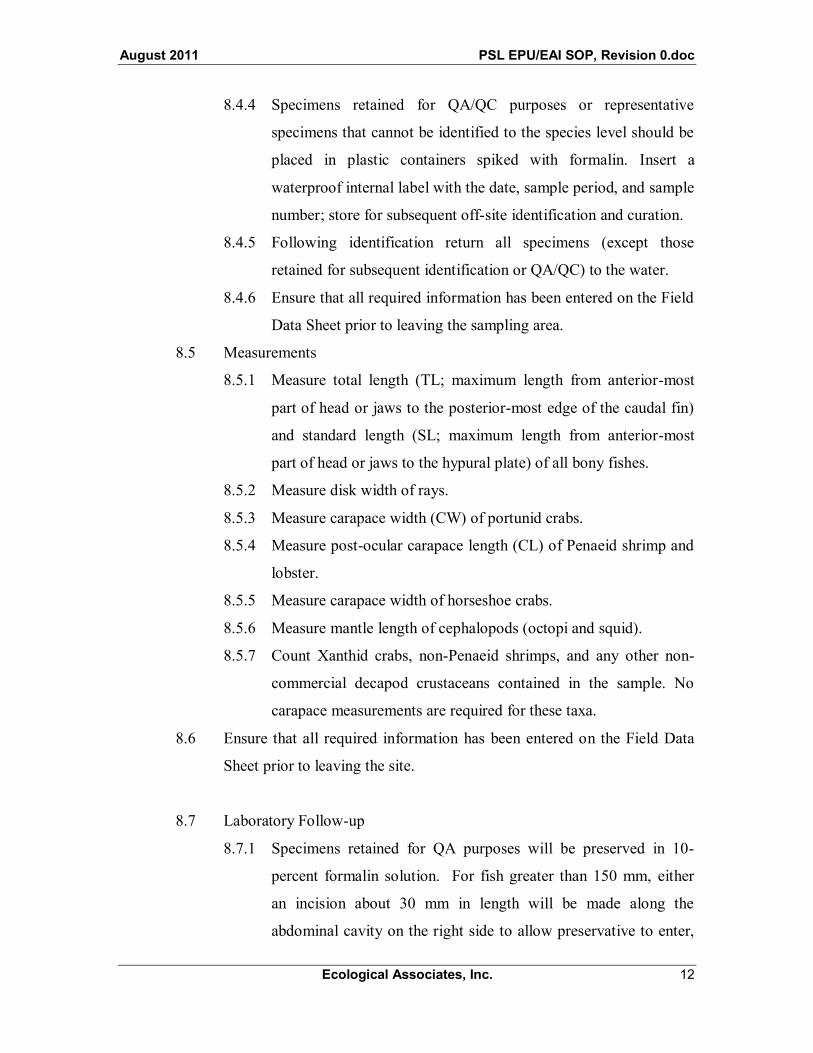
August 2011 PSL EPU/EAI SOP, Revision 0.doc
Ecological Associates, Inc. 12
8.4.4 Specimens retained for QA/QC purposes or representative
specimens that cannot be identified to the species level should be
placed in plastic containers spiked with formalin. Insert a
waterproof internal label with the date, sample period, and sample
number; store for subsequent off-site identification and curation.
8.4.5 Following identification return all specimens (except those
retained for subsequent identification or QA/QC) to the water.
8.4.6 Ensure that all required information has been entered on the Field
Data Sheet prior to leaving the sampling area.
8.5 Measurements
8.5.1 Measure total length (TL; maximum length from anterior-most
part of head or jaws to the posterior-most edge of the caudal fin)
and standard length (SL; maximum length from anterior-most
part of head or jaws to the hypural plate) of all bony fishes.
8.5.2 Measure disk width of rays.
8.5.3 Measure carapace width (CW) of portunid crabs.
8.5.4 Measure post-ocular carapace length (CL) of Penaeid shrimp and
lobster.
8.5.5 Measure carapace width of horseshoe crabs.
8.5.6 Measure mantle length of cephalopods (octopi and squid).
8.5.7 Count Xanthid crabs, non-Penaeid shrimps, and any other non-
commercial decapod crustaceans contained in the sample. No
carapace measurements are required for these taxa.
8.6 Ensure that all required information has been entered on the Field Data
Sheet prior to leaving the site.
8.7 Laboratory Follow-up
8.7.1 Specimens retained for QA purposes will be preserved in 10-
percent formalin solution. For fish greater than 150 mm, either
an incision about 30 mm in length will be made along the
abdominal cavity on the right side to allow preservative to enter,

August 2011 PSL EPU/EAI SOP, Revision 0.doc
Ecological Associates, Inc. 13
or a syringe will be used to inject formalin directly into the dorsal
muscles of the specimen to ensure penetration of preservative into
the tissues.
8.7.2 Organisms that cannot be readily identified in the laboratory will
be preserved and sent to a recognized expert for taxonomic
identification or verification. A list of experts, appropriate to the
taxon in question and approved by the Project Manager, will be
maintained at the EAI laboratory.
8.7.3 A reference collection of all species collected during the project
will be maintained and archived at the EAI laboratory.
9.0 Ichthyo- and Meroplankton Sampling: Location and Methods
9.1 Sample Collection: Location
9.1.1 During each sampling event, ichthyoplankton samples will be
collected at two shore-parallel transects per site.
9.1.2 Conduct one bongo net tow at each station at night.
9.1.3 Use 20-cm diameter paired bongo nets fitted with 0.5-mm mesh
nets.
9.1.4 Tow for 15 minutes, unless debris load or other conditions require
shorter tow times. If towed concurrent with the trawl and a snag
occurs, a bongo sample will be considered complete after a
minimum of 8 minutes of tow time.
9.1.5 Operate boat at slow speed (2.0 – 3.0 knots).
9.1.6 Tow nets just below the surface.
9.2 Sample Collection: Methods
9.2.1 Prepare the bongo net for deployment.
9.2.1.1 Assure that the flow meters are filled with water. Position
the flow meters within the mouth of each side of the
bongo frame using the attachment rods.

August 2011 PSL EPU/EAI SOP, Revision 0.doc
Ecological Associates, Inc. 14
9.2.1.2 Attach the bongo frame cable to the davit pulley. Ensure
that cod-ends are securely connected to both nets.
9.2.1.3 Attach the depressor to the other end of the bongo frame
cable.
9.2.1.4 Attach tag line and float to bongo frame.
9.2.1.5 Immediately prior to deployment, record flow meter serial
numbers and the initial meter readings of each flow meter
on the Field Data Sheet. Ensure that the flow meter
propellers do not turn prior to deployment.
9.2.2 Record all pertinent data on Field Data Sheet (weather, tidal
stage, water depth, etc.). If trawl and bongo sampling will occur
concurrently, check the appropriate box on the Trawl Field Data
Sheet to verify that the above conditions and flow meter readings
can be used for both operations.
9.2.3 Position the boat parallel to shore at one end of the station
transect and motor forward maintaining an appropriate speed to
deploy the bongo nets (just at or above idle). Ensure that all
personnel are clear of any lines.
9.2.4 Hoist bongo nets into air, high enough to clear gunwale, by
pulling davit line through cam-cleat. Place cod ends and tag line
into water. Swing davit arm 90° out from boat. Release davit line
from cam-cleat and slowly lower bongo nets into the water to
proper sampling depth. As soon as the bongo net is completely
beneath the surface of the water, activate timer. Record time of
deployment on Field Data Sheet.
9.2.5 Maintain a constant speed of approximately 2.0 – 3.0 knots.
9.2.6 Direct the boat in a straight line while watching to assure the net
does not wash under the boat and contact the prop.
9.2.7 Pull the nets for 15 minutes unless algae or other debris in the
water column prevent the nets from fishing effectively for that
length of time. If tows are less than 8 minutes, pull nets for 5
August 2011 PSL EPU/EAI SOP, Revision 0.doc
Ecological Associates, Inc. 15
minutes and composite three tows for the equivalent of a 15-
minute tow if conditions permit.
9.2.7.1 Constantly monitor bongo net while deployed to ensure it
fishes at the proper depth. Make slight adjustments to the
amount of line deployed to maintain a constant position in
the water column.
9.2.8 If the net collects large amounts of debris, retrieve the net, discard
sample, rinse net, record new flow meter readings, and re-deploy.
Record new start time and meter reading on Field Data Sheet.
9.2.9 At the end of each tow, retrieve net and deactivate timer. Record
time of retrieval, tow time in minutes, and final meter reading for
each flow meter on Field Data Sheet. Record the final meter
reading of each flow meter on the Field Data Sheet.
9.3 Sample Preservation
9.3.1 Elevate bongo frames on davit and thoroughly but gently rinse
down contents of nets from the outside using source water. Once
all of the net contents have been rinsed into the cod-end, tip the
cod-end to drain excess water. Use a squeeze bottle filled with
filtered source water to rinse sample from cod-end mesh.
9.3.2 Carefully remove cod-end and place in secondary containment to
avoid spillage. Remove large debris such as sticks and leaves,
and rinse any organisms adhering to this material back into the
cod-end. Use squeeze bottle to rinse all contents of cod-end into
sample container(s) spiked with preservative. Gloves and
protective eyewear should be worn while handling preservative.
9.3.2.1 The volume of the drained sample material should not
exceed 35% of the sample container for each of the two
cod-ends. Fill remaining volume of sample container with
filtered seawater (filtered through 0.5-mm mesh) being
careful not to overflow. Use a second prepared sample

August 2011 PSL EPU/EAI SOP, Revision 0.doc
Ecological Associates, Inc. 16
container should sample volume exceed the capacity of a
single container, note use of multiple containers on the
external labels and on the data sheets.
9.3.3 Fill in sample information on interior and exterior sample labels
using pencil or water-proof ink. Place interior label with sample
identification number inside jar and tightly secure lid.
9.3.4 If more than one jar is required per sample, labels should indicate
jar number (e.g., 1 of 2, 2 of 2, etc.). Contents of multiple-jar
samples will be composited in the laboratory for analysis.
9.3.5 Place sample containers securely in carrying case.
9.3.6 Double-check Field Data Sheets to ensure all relevant data has
been filled in.
10.0 Gill Net Sampling: Location and Methods
10.1 Sample Collection: Location
10.1.1 During each sampling event, gill net samples will be collected at
three transects perpendicular to shore per site.
10.1.2 Conduct three gill net samples at each station during the day.
10.1.3 Use 600-foot in length by 12-foot in depth net comprised of 5
monofilament mesh panels, each 120-foot long.
10.1.4 The gill net will be fully deployed for 30 minutes, unless large
numbers of fish are being capture or other conditions are present
that require shorter set times.
10.2 Sample Collection: Methods
10.2.1 Prepare the gill net for deployment.
10.2.2 Attach buoy line and weight to each end of the net.
10.2.3 Position the boat perpendicular to shore at one end of the station
transect and motor forward maintaining an appropriate speed to
deploy the net (just at or above idle). Ensure that all personnel
are clear of any lines and the net.
August 2011 PSL EPU/EAI SOP, Revision 0.doc
Ecological Associates, Inc. 17
10.2.4 Deploy the net by tossing the end off the stern and to the side of
the motor ensuring that net and buoy line clear the prop. Activate
the timer when the end of the net is first deployed. Record time of
deployment and GPS point on Field Data Sheet. Continue to
deploy the net by guiding the net over the stern clear of the prop.
10.2.5 At the end of the 30-minute soak begin to haul in the anchor
buoy from the end first deployed. Pull the gill net over the
starboard side of the boat, maintaining tension on the lines. As
the boat nears the net, it may be necessary to move forward along
the gunwale to keep the net oriented on the starboard side or
bump in and out of gear to avoid drifting back over the net.
Record the end time when the last buoy is retrieved.
10.2.6 Immediately remove any live specimens and place in live well.
10.2.6.1 While two people are retrieving the net, a third person
will carefully examine the body of the net as it comes
into the boat and remove any entangled organisms.
10.3 Sample Processing
10.3.1 Wear work gloves or rubber gloves when processing specimens
to avoid injury.
10.3.2 Transfer specimens to bins within the secondary live well by
species groups for identification and measurement.
10.3.3 Use a small dip net to capture individual specimens or lift
specimen bins onto measuring board for processing.
10.3.3.1 Process live specimens first and return them to the
water as quickly as possible. Only discard dead
specimens if wind and current conditions will not cause
specimens to drift into an unsampled station area.
Otherwise wait until the trawl tows have been completed
before discarding.
10.3.4 Sort, identify, enumerate, and weigh fish and shellfish contained
in the sample, as described in 10.4-10.7.

August 2011 PSL EPU/EAI SOP, Revision 0.doc
Ecological Associates, Inc. 18
10.3.5 Monitor the condition of organisms caught; record and quantify
specimens that appear to have been dead or injured prior to being
caught in the trawl (e.g., rotten/decomposed specimens, fish with
glazed/hazy eyes, etc.). Badly damaged specimens can be noted
by placing a “D” in the Retained block on the data sheet.
10.4 Field Collection
10.4.1 Sort, identify and enumerate all fish contained in the sample.
Identify specimens to the lowest practicable taxon. Scientific
names will be verified using the Integrated Taxonomic
Information System (www.itis.gov) and common names will
follow AFS Special Publication 29, Sixth Edition (2004). Field
guides (e.g., EAI Field Identification Tools, 2008; Robins et al.,
1986) will be available during collection. A checklist of
previously collected species and common identification
characters will be developed over the life of the project and
available for reference.
10.4.2 Additionally, measure standard and total length of a subset of 25
individuals of each Representative Important Species (RIS)
(Table 2) from each station. Obtain a batch weight of the
representative specimens. Record these data on the Fish and
Shellfish Length and Weight Data Sheet. If more than 25
individuals are present, enter the total number of all remaining
specimens on the Data Sheet.
10.4.3 If samples contain excessively large numbers of individuals, a
random split may be used to obtain a representative sub-sample
that can be analyzed within a one-hour period. Large and/or
uncommon specimens should be removed, measured, and
recorded prior to splitting to minimize diversity loss.
10.4.4 Specimens retained for QA/QC purposes or representative
specimens that cannot be identified to the species level should be
placed in plastic containers spiked with formalin. Insert a

August 2011 PSL EPU/EAI SOP, Revision 0.doc
Ecological Associates, Inc. 19
waterproof internal label with the date, sample period, and sample
number; store for subsequent off-site identification and curation.
10.4.5 Following identification return all specimens (except those
retained for subsequent identification or QA/QC) to the water.
10.4.6 Ensure that all required information has been entered on the Field
Data Sheet prior to leaving the sampling area.
10.5 Measurements
10.5.1 Measure total length (TL; maximum length from anterior-most
part of head or jaws to the posterior-most edge of the caudal fin)
and standard length (SL; maximum length from anterior-most
part of head or jaws to the hypural plate) of all bony fishes.
10.5.2 Measure disk width of rays.
10.5.3 Measure carapace width (CW) of portunid crabs.
10.5.4 Measure mantle length of cephalopods (octopi and squid).
10.5.5 Count Xanthid crabs, non-Penaeid shrimps, and any other non-
commercial decapod crustaceans contained in the sample. No
carapace measurements are required for these taxa.
10.6 Ensure that all required information has been entered on the Field Data
Sheet prior to leaving the site.
10.7 Laboratory Follow-up
10.7.1 Specimens retained for QA purposes will be preserved in 10-
percent formalin solution. For fish greater than 150 mm, either
an incision about 30 mm in length will be made along the
abdominal cavity on the right side to allow preservative to enter,
or a syringe will be used to inject formalin directly into the dorsal
muscles of the specimen to ensure penetration of preservative into
the tissues.
10.7.2 Organisms that cannot be readily identified in the laboratory will
be preserved and sent to a recognized expert for taxonomic
identification or verification. A list of experts, appropriate to the

August 2011 PSL EPU/EAI SOP, Revision 0.doc
Ecological Associates, Inc. 20
taxon in question and approved by the Project Manager, will be
maintained at the EAI laboratory.
10.7.3 A reference collection of all species collected during the project
will be maintained and archived at the EAI laboratory.
11.0 Beach Seine Sampling: Location and Methods
11.1 Sample Collection: Location
11.1.1 During each sampling event, one beach seine sample will be
collected at each of three stations per site.
11.1.2 Beach seine samples will be collected during the day.
11.1.3 Use 100-foot in length (125’ running length) by 6-foot in depth
net with a stretch mesh of one inch.
11.1.4 The beach seine will be fully deployed in 4-foot of water then
pulled onto the beach.
11.2 Sample Collection: Methods
11.2.1 Prepare the beach seine for deployment.
11.2.2 Carry the rolled beach seine out to a depth of approximately 4
feet.
11.2.3 Deploy the net parallel to shore ensuring the distance covered is
100 feet from end to end.
11.2.4 Begin to walk towards the beach with the ends of the beach seine
perpendicular to shore. Record time of deployment and GPS
point of the northern end on Field Data Sheet.
11.2.5 Once the net has reached the shore, record the end time on the
Field Data Sheet.
11.2.5.1 Bring the net completely onto shore.
11.2.6 Immediately remove any live specimens and place in sea water
filled storage container equipped with an aerator if necessary.
11.2.6.1 Carefully examine the body of the net and remove any
entangled organisms.
11.3 Sample Processing

August 2011 PSL EPU/EAI SOP, Revision 0.doc
Ecological Associates, Inc. 21
11.3.1 Wear work gloves or rubber gloves when processing specimens
to avoid injury.
11.3.2 Use a small dip net to capture individual specimens or lift
specimen bins onto measuring board for processing.
11.3.2.1 Process live specimens first and return them to the
water as quickly as possible. Only discard dead
specimens if wind and current conditions will not cause
specimens to drift into an unsampled station area.
Otherwise wait until the seine collections have been
completed before discarding.
11.3.3 Sort, identify, enumerate, and weigh fish and shellfish contained
in the sample, as described in 11.4-11.7.
11.3.4 Monitor the condition of organisms caught; record and quantify
specimens that appear to have been dead or injured prior to being
caught in the seine (e.g., rotten/decomposed specimens, fish with
glazed/hazy eyes, etc.). Badly damaged specimens can be noted
by placing a “D” in the Retained block on the data sheet.
11.4 Field Collection
11.4.1 Sort, identify and enumerate all fish contained in the sample.
Identify specimens to the lowest practicable taxon. Scientific
names will be verified using the Integrated Taxonomic
Information System (www.itis.gov) and common names will
follow AFS Special Publication 29, Sixth Edition (2004). Field
guides (e.g., EAI Field Identification Tools, 2008; Robins et al.,
1986) will be available during collection. A checklist of
previously collected species and common identification
characters will be developed over the life of the project and
available for reference.
11.4.2 Additionally, measure standard and total length of a subset of 25
individuals of each Representative Important Species (RIS)
(Table 2) from each station. Obtain a batch weight of the
August 2011 PSL EPU/EAI SOP, Revision 0.doc
Ecological Associates, Inc. 22
representative specimens. Record these data on the Fish and
Shellfish Length and Weight Data Sheet. If more than 25
individuals are present, enter the total number of all remaining
specimens on the Data Sheet.
11.4.3 If samples contain excessively large numbers of individuals, a
random split may be used to obtain a representative sub-sample
that can be analyzed within a one-hour period. Large and/or
uncommon specimens should be removed, measured, and
recorded prior to splitting to minimize diversity loss.
11.4.4 Specimens retained for QA/QC purposes or representative
specimens that cannot be identified to the species level should be
placed in plastic containers spiked with formalin. Insert a
waterproof internal label with the date, sample period, and sample
number; store for subsequent off-site identification and curation.
11.4.5 Following identification return all specimens (except those
retained for subsequent identification or QA/QC) to the water.
11.4.6 Ensure that all required information has been entered on the Field
Data Sheet prior to leaving the sampling area.
11.5 Measurements
11.5.1 Measure total length (TL; maximum length from anterior-most
part of head or jaws to the posterior-most edge of the caudal fin)
and standard length (SL; maximum length from anterior-most
part of head or jaws to the hypural plate) of all bony fishes.
11.5.2 Measure disk width of rays.
11.5.3 Measure carapace width (CW) of portunid crabs.
11.5.4 Measure post-ocular carapace length (CL) of Penaeid shrimp and
lobster.
11.5.5 Measure carapace width of horseshoe crabs.
11.5.6 Measure mantle length of cephalopods (octopi and squid).

August 2011 PSL EPU/EAI SOP, Revision 0.doc
Ecological Associates, Inc. 23
11.5.7 Count Xanthid crabs, non-Penaeid shrimps, and any other non-
commercial decapod crustaceans contained in the sample. No
carapace measurements are required for these taxa.
11.6 Ensure that all required information has been entered on the Field Data
Sheet prior to leaving the site.
11.7 Laboratory Follow-up
11.7.1 Specimens retained for QA purposes will be preserved in 10-
percent formalin solution. For fish greater than 150 mm, either
an incision about 30 mm in length will be made along the
abdominal cavity on the right side to allow preservative to enter,
or a syringe will be used to inject formalin directly into the dorsal
muscles of the specimen to ensure penetration of preservative into
the tissues.
11.7.2 Organisms that cannot be readily identified in the laboratory will
be preserved and sent to a recognized expert for taxonomic
identification or verification. A list of experts, appropriate to the
taxon in question and approved by the Project Manager, will be
maintained at the EAI laboratory.
11.7.3 A reference collection of all species collected during the project
will be maintained and archived at the EAI laboratory.
12.0 Sea Turtle Survey: Location and Methods
12.1 Survey: Location
12.1.1 During each sampling event, sea turtle surveys will be conducted
at one transect within each of the three sites.
12.1.2 Conduct surveys during the day.
12.1.2.1 The transect should measure 0.6 miles (1 km).
12.1.2.2 If insufficient habitat exists to allow a continuous
transect, two or more smaller transects may be used to
provide an equivalent length.

August 2011 PSL EPU/EAI SOP, Revision 0.doc
Ecological Associates, Inc. 24
12.1.3 Transverse each transect a minimum of two times during each
sampling event with at least a 30 minute separation between the
two passes.
12.1.3.1 Operate at slow speed (less than 4.0 knots).
12.2 Survey: Methods
12.2.1 Monitoring days will be selected for optimal viewing capabilities
(e.g., sunny with calm seas).
12.2.2 The order in which the three study sites are monitored will be
randomly selected prior to each monitoring event.
12.2.3 Standard environmental data (current direction and speed, wind
direction and speed, sky conditions, etc.) as well as water
temperature and underwater visibility will be recorded on the
Field Data Sheet just prior to each pass along each transect.
12.2.4 Two observers will be positioned on an elevated platform.
12.2.5 Record the start time and GPS waypoint on the Field Data Sheet
when the boat operator determines that the boat is at the
beginning of the transect.
12.2.6 One observer will look to port side and the other to starboard
side.
12.2.7 Observers will record and identify to species, when possible, any
turtle observed along the transect.
12.2.8 Observers will record the time each turtle was observed, location
(GPS waypoint) of the boat at the time of observation, the
distance and bearing to the turtle, the size (approximate length) of
the turtle, and whether the turtle was at the surface or submerged.
12.2.9 At the end of the transect, record the end time and GPS point on
the Field Data Sheet.
13.0 Laboratory Sorting/Specimen Identification
13.1 Plankton Sample Sorting

August 2011 PSL EPU/EAI SOP, Revision 0.doc
Ecological Associates, Inc. 25
13.1.1 Until a laboratory technician has been deemed qualified, his/her
sorting will be checked by EAI’s QA/QC Officer or another
qualified technician, as described in the QAP. During this
period, prior to storing the sample residue, the QA/QC Officer or
designee will inspect the sorting tray(s) of the original sorter, and
any missed organisms will be removed, counted and placed into
the appropriate sample vials.
13.1.1.1 The total number of missed organisms will be recorded
on the Laboratory Bench Sheet and Sorting Efficiency
calculated. Additionally, on-going QC checks will be
made over the life of the project, as described in the QAP.
After all applicable QC checks are completed; the sample
residue will be archived.
13.1.2 Obtain a sample from the raw sample storage area of the lab and
fill in all requisite information at the top of the Laboratory Bench
Sheet. Ensure that the sample is scheduled for processing by
comparing the Sample Identification Number (SIN) with the
Master Sample Inventory.
13.1.3 Remove and retain in-jar sample label. This will be returned to
the sample container with the archived portion of the sample
(sample residue). Verify that both the internal and external labels
match the SIN in the Master Sample Inventory and record SIN on
the Laboratory Bench Sheet.
13.1.4 Latex gloves and eye protection should be used while working
with preservative. Under a ventilated fume hood, or in an open-
air location, carefully decant the formalin solution from the
sample container through a 0.5-mm mesh cone into a secondary
container. The waste formalin may be poured down the drain
with the water running continuously at least 30 seconds prior to
and following the formalin.
August 2011 PSL EPU/EAI SOP, Revision 0.doc
Ecological Associates, Inc. 26
13.1.4.1 Gently transfer sample to conical 0.5-mm net with jar
type cod end and rinse sample with water for 5 to 10
minutes while suspended in sink. If woody debris,
vegetation, or other large detritus are present in the
sample, each piece of material may be washed in a larger
mesh sieve (e.g., 5-mm) suspended over the 0.5-mm
sieve. Following a thorough but gentle rinsing with tap
water and examination for organisms, discard any large
detritus.
13.1.5 Use a squeeze bottle filled with 70% Ethanol solution to wash
contents of the fine mesh conical net and cod end into a 1-L
beaker. Inspect the net and cod end to ensure that all organisms
have been transferred to the beaker.
13.1.6 Pour the organic material from the beaker into the appropriate
sized jar, place the original internal label into the jar and label the
lid with the SIN using the appropriate color tape for the St. Lucie
Project. Fill the jar with 70% ethanol.
13.1.7 Remove a small amount of the sample material and spread it on a
gridded tray. Add enough ethanol solution to cover sample
material, and spread material over bottom of tray as evenly as
possible. For large samples, it may be necessary to partition the
sample among several sorting trays.
13.1.8 Prepare three sample vials filled with 70% ethanol preservative
and label each for fish eggs, ichthyoplankton (fish larvae), or
meroplankton (shellfish larvae).
13.1.9 Inspect contents of each sorting tray grid under a dissecting
scope. Move systematically from one grid to the next carefully
searching for target organisms. Staining may be used, as
necessary, to help distinguish specimens from debris.
13.1.10 Remove all fish eggs, fish larvae, and targeted meroplankton
(refer to list provided by EAI Project Manager) from sorting tray

August 2011 PSL EPU/EAI SOP, Revision 0.doc
Ecological Associates, Inc. 27
using soft forceps or pipette, as practical, and place in appropriate
labeled specimen vial. Count and record number of organisms on
bench sheet.
13.1.11 Prepare internal labels on waterproof paper. Include the SIN and
contents (meroplankton, ichthyoplankton, or fish eggs), and insert
it into each sample vial. Seal vials with a cap and affix a color-
coded label to the top with last 4 digits of SIN and content type.
13.1.12 Record the time that sorting was completed on the Laboratory
Bench Sheet and store the sorted samples in designated area of
the lab for subsequent taxonomic identification. Place the bench
sheet in the Sorted Sample Folder.
13.1.13 Return the sample residue to its original glass jar. Insert the
original sample label after adding words “sorted residue” and
preserve in 70% ethanol. Place a unique color-coded label on the
lid, seal and store in the designated sorted sample storage area.
13.2 Plankton Sample Splitting
13.2.1 Samples containing excessive amounts of debris (algae,
ctenophores, etc.) or high numbers of plankton (>250) may be
split with a Motodo sample splitter, at the direction of the
Laboratory Manager. The Lab Manager will visually inspect the
sample and determine if a split is appropriate.
13.2.1.1 Samples that would require an experienced Certified
Sorter more than four hours to process will generally be
split. However, groups (meroplankton, ichthyoplankton,
fish eggs) with less than 250 individuals will be sorted
from samples prior to splitting to maintain species
diversity.
13.2.2 Decant ethanol from sample. Pour sample into splitting chamber
and dilute with sufficient amount of tap water from a wash bottle
to ensure an even split.
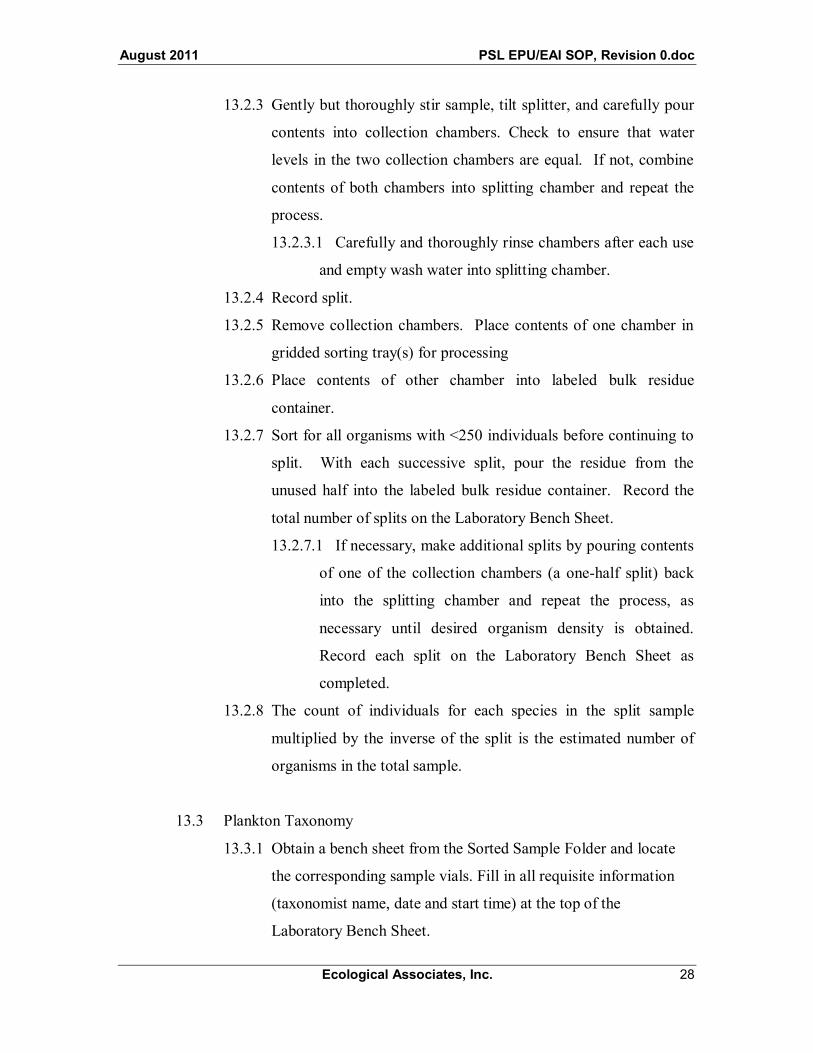
August 2011 PSL EPU/EAI SOP, Revision 0.doc
Ecological Associates, Inc. 28
13.2.3 Gently but thoroughly stir sample, tilt splitter, and carefully pour
contents into collection chambers. Check to ensure that water
levels in the two collection chambers are equal. If not, combine
contents of both chambers into splitting chamber and repeat the
process.
13.2.3.1 Carefully and thoroughly rinse chambers after each use
and empty wash water into splitting chamber.
13.2.4 Record split.
13.2.5 Remove collection chambers. Place contents of one chamber in
gridded sorting tray(s) for processing
13.2.6 Place contents of other chamber into labeled bulk residue
container.
13.2.7 Sort for all organisms with <250 individuals before continuing to
split. With each successive split, pour the residue from the
unused half into the labeled bulk residue container. Record the
total number of splits on the Laboratory Bench Sheet.
13.2.7.1 If necessary, make additional splits by pouring contents
of one of the collection chambers (a one-half split) back
into the splitting chamber and repeat the process, as
necessary until desired organism density is obtained.
Record each split on the Laboratory Bench Sheet as
completed.
13.2.8 The count of individuals for each species in the split sample
multiplied by the inverse of the split is the estimated number of
organisms in the total sample.
13.3 Plankton Taxonomy
13.3.1 Obtain a bench sheet from the Sorted Sample Folder and locate
the corresponding sample vials. Fill in all requisite information
(taxonomist name, date and start time) at the top of the
Laboratory Bench Sheet.
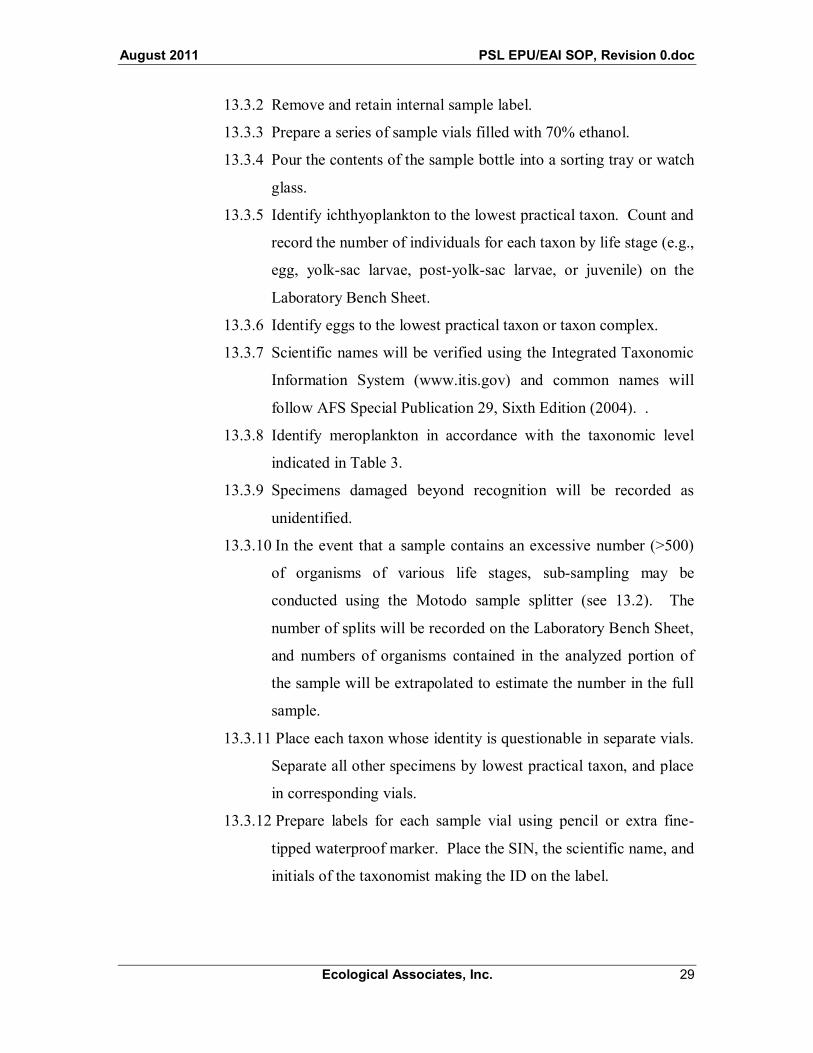
August 2011 PSL EPU/EAI SOP, Revision 0.doc
Ecological Associates, Inc. 29
13.3.2 Remove and retain internal sample label.
13.3.3 Prepare a series of sample vials filled with 70% ethanol.
13.3.4 Pour the contents of the sample bottle into a sorting tray or watch
glass.
13.3.5 Identify ichthyoplankton to the lowest practical taxon. Count and
record the number of individuals for each taxon by life stage (e.g.,
egg, yolk-sac larvae, post-yolk-sac larvae, or juvenile) on the
Laboratory Bench Sheet.
13.3.6 Identify eggs to the lowest practical taxon or taxon complex.
13.3.7 Scientific names will be verified using the Integrated Taxonomic
Information System (www.itis.gov) and common names will
follow AFS Special Publication 29, Sixth Edition (2004). .
13.3.8 Identify meroplankton in accordance with the taxonomic level
indicated in Table 3.
13.3.9 Specimens damaged beyond recognition will be recorded as
unidentified.
13.3.10 In the event that a sample contains an excessive number (>500)
of organisms of various life stages, sub-sampling may be
conducted using the Motodo sample splitter (see 13.2). The
number of splits will be recorded on the Laboratory Bench Sheet,
and numbers of organisms contained in the analyzed portion of
the sample will be extrapolated to estimate the number in the full
sample.
13.3.11 Place each taxon whose identity is questionable in separate vials.
Separate all other specimens by lowest practical taxon, and place
in corresponding vials.
13.3.12 Prepare labels for each sample vial using pencil or extra fine-
tipped waterproof marker. Place the SIN, the scientific name, and
initials of the taxonomist making the ID on the label.

August 2011 PSL EPU/EAI SOP, Revision 0.doc
Ecological Associates, Inc. 30
13.3.13 Secure the vials/bottles with caps, label the cap with the project
color tape, last four digits of the SIN, taxa and vial number, and
place in the area designated for sample archival/QC.
13.3.14 Record the date and time the taxonomy was completed on the
Laboratory Bench Sheet. If taxonomy is completed for all
components, file in the “To Be Input” project folder. If all
taxonomic components are not completed, file in the “To Be
Identified” folder.
13.3.15 One or more representative individuals of each species will be
preserved in 70% ethanol and retained in a reference collection
archived at EAI.
13.3.15.1 Individuals will be selected to represent the various
sizes and developmental stages of the species contained in
the samples. An electronic photographic reference
collection will also be maintained.
13.3.15.1.1 If specimens are removed from a sample for
the reference collection, a notation will be made
on the Laboratory Bench Sheet.
13.3.16 If there is disagreement on the identification of organisms
between taxonomists in the laboratory, the organisms will be sent
to an outside recognized expert (approved by the Project
Manager) for taxonomic identification/confirmation.
Alternatively, electronic images of the disputed specimens may
be submitted to the expert, alleviating the need for sending
specimens through the mail.
14.0 Trawl: Identification of Retained Specimens
14.1 Procedures for Identification and Curation
14.1.1 Return unidentified specimens to the laboratory. Preserved
specimens should remain in formalin storage for no less than 5
days.

August 2011 PSL EPU/EAI SOP, Revision 0.doc
Ecological Associates, Inc. 31
14.1.2 Decant formalin into Waste Formalin Receptacle. Be sure to
wear latex gloves and protective eyewear, and always work in a
well-ventilated area.
14.1.2.1 Soak rinsed specimens in water for at least an hour
under fume hood to remove excess formalin. Change the
water periodically. Keep label with sample.
14.1.3 Ensure that labels containing the SIN and other pertinent field
information are included with the specimen.
14.1.4 Using available literature, identify specimens to lowest practical
taxon. Generally, problematic specimens will have been
identified to family level in the field, and will require further ID
in the laboratory to either genus or species level.
14.1.5 Once identifications are complete, obtain the Fish and Shellfish
Length and Weight Data Sheet from which the specimen was
removed and enter the correct identification.
14.1.6 Weigh the specimen and record on the Length and Weight Data
Sheet.
14.1.7 Either preserve the specimen in 70% ethanol and retain for the
reference collection or discard as trash.
14.1.7.1 Specimens retained for the reference collection will
have an internal label with the sample number, date
collected, method of collection, taxon and the initials of
the person that identified the specimen(s).
14.1.7.2 An external label will be affixed to the lid of the
container with the sample number and taxon.
14.1.8 A reference collection of all species collected during the project
will be maintained and archived at the EAI laboratory.
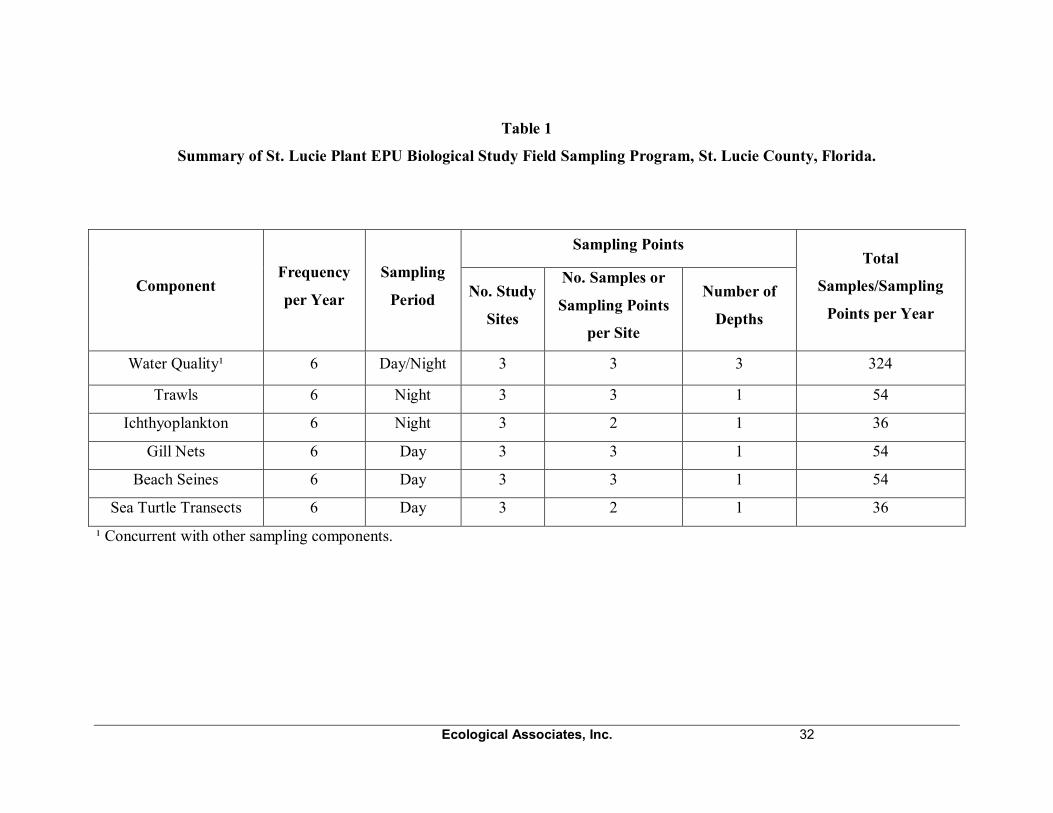
Ecological Associates, Inc. 32
Table 1
Summary of St. Lucie Plant EPU Biological Study Field Sampling Program, St. Lucie County, Florida.
Component Frequency
per Year
Sampling
Period
Sampling Points Total
Samples/Sampling
Points per Year No. Study
Sites
No. Samples or
Sampling Points
per Site
Number of
Depths
Water Quality¹ 6 Day/Night 3 3 3 324
Trawls 6 Night 3 3 1 54
Ichthyoplankton 6 Night 3 2 1 36
Gill Nets 6 Day 3 3 1 54
Beach Seines 6 Day 3 3 1 54
Sea Turtle Transects 6 Day 3 2 1 36
¹ Concurrent with other sampling components.

Ecological Associates, Inc. 33
Table 2
Representative Important Species Targeted for St. Lucie Plant EPU Biological Study
Common Name Scientific Name
Atlantic Croaker Micropogonias undulatus
Spot Leiostomus xanthurus
Sand Drum Umbrina coroides
Pigfish Orthopristis chrysoptera
Bluefish Pomatomus saltatrix
Silver Seatrout Cynoscion nothus
Kingfish/Whiting Menticirrhus spp.
Florida Pompano Trachinotus carolinus
Spanish Mackerel Scomberomorus maculatus
Clupeiformes: Anchovies,
Herrings, and Sardines
Leopard Searobin Prionotus scitulus
Green Sea Turtle Chelonia mydas

Ecological Associates, Inc. 34
Table 3
Shellfish Larvae (Meroplankton) Level of Taxonomy Targeted for St. Lucie Plant EPU Biological Study
Group Lowest
Taxonomic Level Targeted
Taxa Included
Commercial or Recreationally Important
Species
Genus and Species
Menippe mercenaria Menippe nodifrons
Farfantepenaeus duorarum Farfantepenaeus aztecus
Litopenaeus setiferus Callinectes sapidus
Callinectes sp. Panulirus argus
Scyllarides nodifer Lolliguncula brevis
Loligo pealeii Emerita talpoida
Albunea sp. Limulus polyphemus
Lepidopa sp.
Caridean Shrimp Infraorder (Caridea)
Hippolyte Thor
Lysmata Tozeuma
Palaemonetes Alpheus Crangon Latreutes Processa
Sergestid Shrimp
Superfamily (Sergestoidea)
Acetes Lucifer
Stomatopods Order (Stomatopoda) Squilla
Mud/Ghost Shrimp Infraorder (Thalassinidea)
Callianassa Upogebia Naushonia

Ecological Associates, Inc. 35
Table 3 (Continued)
Group Lowest
Taxonomic Level Targeted
Taxa Included
Hermit Crabs Infraorder (Anomura)
Clibanarius Pagurus Polyonyx
Non-commercial Crabs
Infraorder (Brachyura)
Persephona Libinia Cancer
Ovalipes Panopeidae Pilumnus Sesarma
Dissodactylus Pinnixa
Pinnotheres Ocypode
Uca Zaops
Non-commercial Bivalve Molluscs
Class (Bivalvia)
Mytilidae Mactridae Ostreidae Tellinidae Arcidae
Cardiidae

Ecological Associates, Inc. 36
SOP APPENDIX A
EQUIPMENT AND SUPPLIES CHECKLISTS ST. LUCIE PLANT EPU BIOLOGICAL STUDY
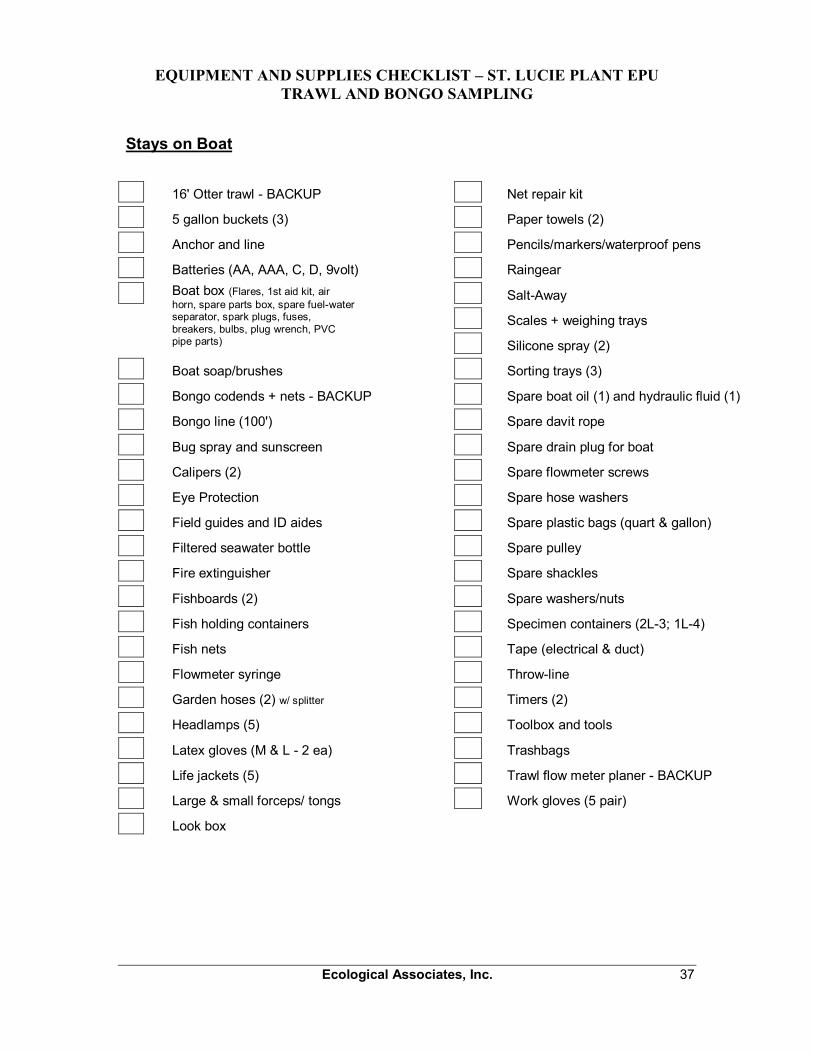
Ecological Associates, Inc. 37
EQUIPMENT AND SUPPLIES CHECKLIST – ST. LUCIE PLANT EPU TRAWL AND BONGO SAMPLING
Stays on Boat
16' Otter trawl - BACKUP
Net repair kit
5 gallon buckets (3)
Paper towels (2)
Anchor and line
Pencils/markers/waterproof pens
Batteries (AA, AAA, C, D, 9volt)
Raingear
Boat box (Flares, 1st aid kit, air horn, spare parts box, spare fuel-water separator, spark plugs, fuses, breakers, bulbs, plug wrench, PVC pipe parts)
Salt-Away
Scales + weighing trays
Silicone spray (2)
Boat soap/brushes
Sorting trays (3)
Bongo codends + nets - BACKUP
Spare boat oil (1) and hydraulic fluid (1)
Bongo line (100')
Spare davit rope
Bug spray and sunscreen
Spare drain plug for boat
Calipers (2)
Spare flowmeter screws
Eye Protection
Spare hose washers
Field guides and ID aides
Spare plastic bags (quart & gallon)
Filtered seawater bottle
Spare pulley
Fire extinguisher
Spare shackles
Fishboards (2)
Spare washers/nuts
Fish holding containers
Specimen containers (2L-3; 1L-4)
Fish nets
Tape (electrical & duct)
Flowmeter syringe
Throw-line
Garden hoses (2) w/ splitter
Timers (2)
Headlamps (5)
Toolbox and tools
Latex gloves (M & L - 2 ea)
Trashbags
Life jackets (5)
Trawl flow meter planer - BACKUP
Large & small forceps/ tongs
Work gloves (5 pair)
Look box

Ecological Associates, Inc. 38
EQUIPMENT AND SUPPLIES CHECKLIST – ST. LUCIE PLANT EPU TRAWL, BONGO, GILL NET SAMPLING, AND SEA TURTLE SURVEYS
Trip Prep
Paperwork Checklist
FPL Operations Letter
Field Data Sheets (Trawl, IP, Gill Net, Turtle Survey, L/W)
FWC Float Plan
Field Log
EAI Float Plan
Boat Log
Safety Tailboard Forms
SAL
Field Data Sheets
HASP & SOP
Sample Labels
Contact Numbers (FPL, FWC, SeaTow)
Prep sample containers
Calibrate meters (2)
Fill flowmeters with water and replace screws
Trailer Chains and Locks
Equipment Checklist
16' Otter trawl w/ ropes & doors
600’ Gill Net w/ anchors and buoys
Boat GPS/depth finder
Boat Keys
Bongo frame, nets, codends (505µm)
Bongo planer
Cell phones
Closed-toed shoes
Cooler (large & small)
Flashlights (Maglites & Q-beams) -2
Flow meters (2) and backup (1)
Formaldehyde: 1/2 liter bottles (2)
Handheld GPS
Leftover snacks, condiments and utensils
Sample containers - 12 (spiked & labeled)
Spare Bongo flowmeter
Tap water (gallon)
Water quality meters (2) -calibrated

Ecological Associates, Inc. 39
SOP APPENDIX B
CALIBRATION OF FIELD INSTRUMENTATON
ST. LUCIE PLANT EPU BIOLOGICAL STUDY

Ecological Associates, Inc. 40
FIELD INSTRUMENT CALIBRATION
General Information The day of each sampling event, the Field Team Leader will verify that all equipment is in proper working condition, calibrated, and that batteries are properly charged (see Appendix C: DEP-SOP-001/01 FT 1000). Calibrations performed prior to the collection of the first sample for each event are considered Initial Calibrations and are recorded on the EAI Field Instrument Calibration Log. Final Calibration Checks will be performed upon return to the lab. Initial and Final calibration checks will be performed for all measured variables. If an Initial or Final Calibration Check fails to meet acceptance criteria, the instrument will be immediately recalibrated. If the instrument fails a second time, it will be removed from service. In this case, the Field Technician will use the back-up instrument during collection of field data (DEP-SOP-001/01 FT 1000). If a Final Calibration Check fails to meet acceptance criteria, and it is not possible to reanalyze the sample(s), the Field Team Leader will a) report all results between the last acceptable calibration check and the failed calibration check as “estimated” by using the 62-160, F.A.C. qualifier “J”; b) include a narrative description of the problem; and c) shorten the time period between verification checks or replace/repair the instrument, as appropriate.
Specific Procedures
A list of the different field instruments available for use during the St. Lucie Plant EPU Biological Study field sampling program are found in Table 1 along with the corresponding manual that provides detailed manufacturer’s instructions for calibrations. An example of an instrument calibration form is given in Figure 1.
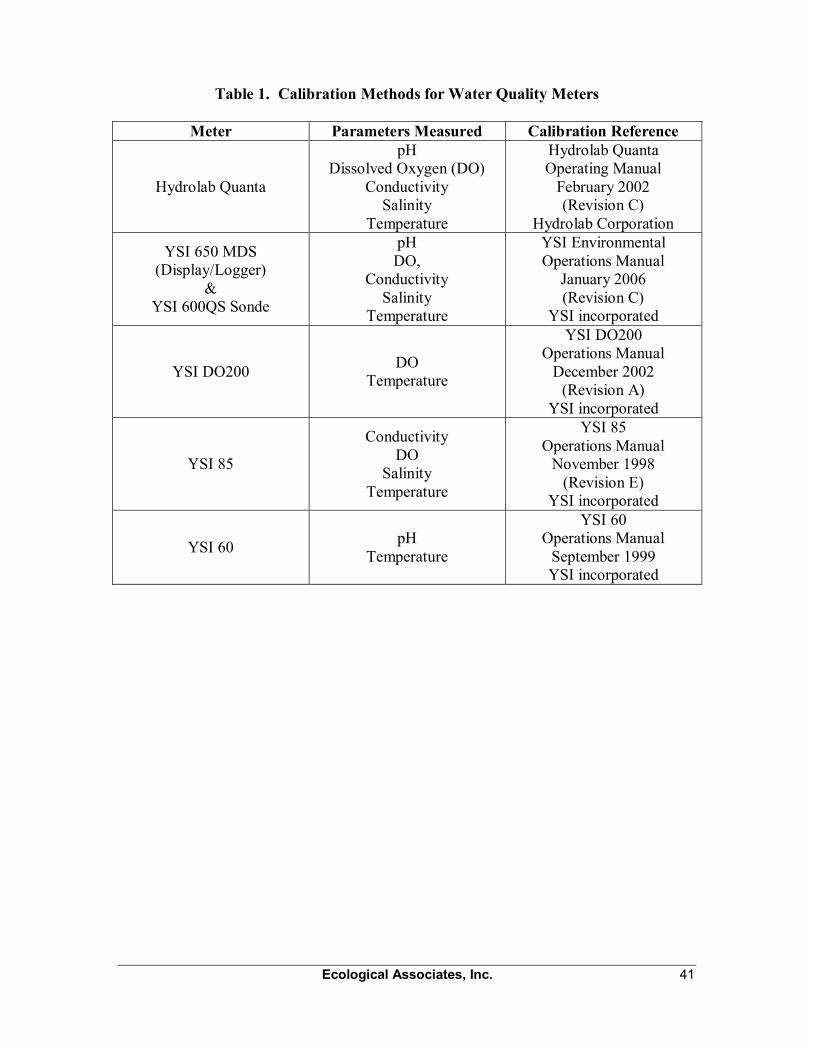
Ecological Associates, Inc. 41
Table 1. Calibration Methods for Water Quality Meters
Meter Parameters Measured Calibration Reference
Hydrolab Quanta
pH Dissolved Oxygen (DO)
Conductivity Salinity
Temperature
Hydrolab Quanta Operating Manual
February 2002 (Revision C)
Hydrolab Corporation
YSI 650 MDS (Display/Logger)
& YSI 600QS Sonde
pH DO,
Conductivity Salinity
Temperature
YSI Environmental Operations Manual
January 2006 (Revision C)
YSI incorporated
YSI DO200 DO Temperature
YSI DO200 Operations Manual
December 2002 (Revision A)
YSI incorporated
YSI 85
Conductivity DO
Salinity Temperature
YSI 85 Operations Manual
November 1998 (Revision E)
YSI incorporated
YSI 60 pH Temperature
YSI 60 Operations Manual
September 1999 YSI incorporated
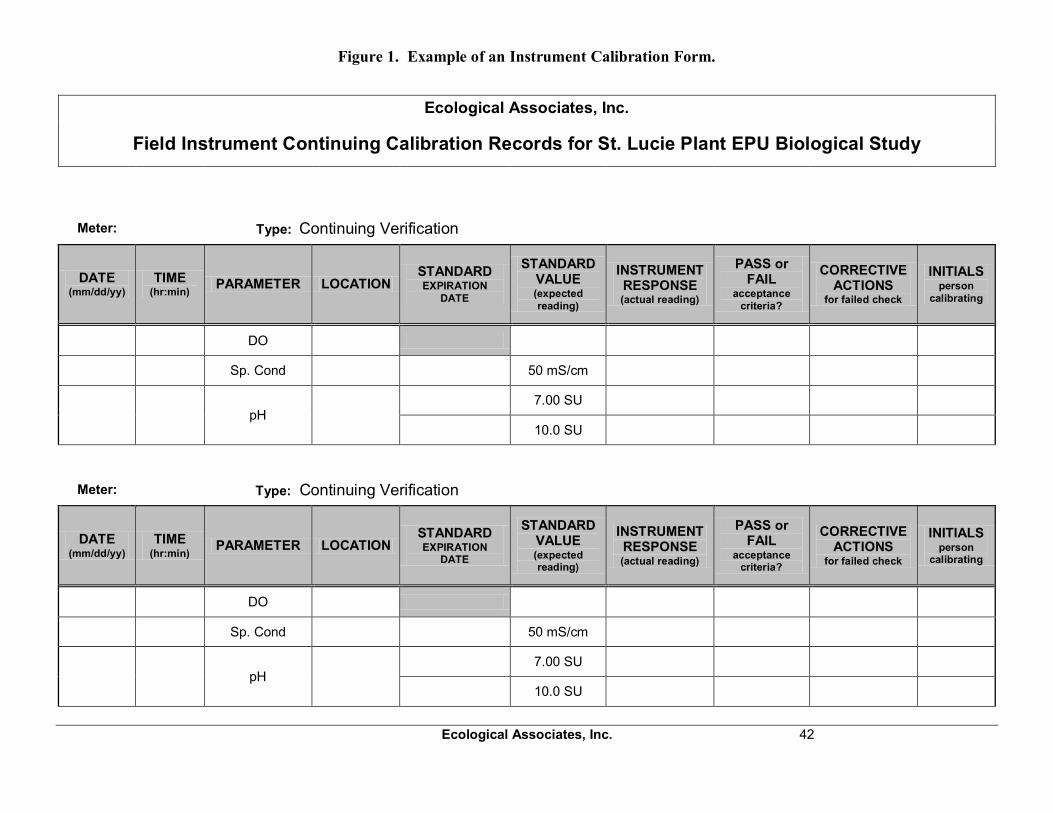
Figure 1. Example of an Instrument Calibration Form.
Ecological Associates, Inc. 42
Ecological Associates, Inc.
Field Instrument Continuing Calibration Records for St. Lucie Plant EPU Biological Study
Meter: Type: Continuing Verification
DATE (mm/dd/yy)
TIME (hr:min) PARAMETER LOCATION
STANDARD EXPIRATION
DATE
STANDARD VALUE (expected reading)
INSTRUMENT RESPONSE (actual reading)
PASS or FAIL
acceptance criteria?
CORRECTIVE ACTIONS
for failed check
INITIALS person
calibrating
DO
Sp. Cond 50 mS/cm
pH 7.00 SU
10.0 SU
Ecological Associates, Inc. 43
SOP APPENDIX C
DEP-SOP-001/01 FT 1000
GENERAL FIELD TESTING AND MEASUREMENT

DEP-SOP-001/01 FT 1000 General Field Testing and Measurement
FT 1000. GENERAL FIELD TESTING AND MEASUREMENT
Use the following SOPs in conjunction with FT 1000:
• FD 1000 Documentation Procedures
• FM 1000 Field Planning and Mobilization
• FS 1000 General Sampling Procedures
• FT 1100 through FT 3000 Specific Field Testing Procedures
1. INTRODUCTION
1.1. Scope and Applicability: SOPs FT 1100 to FT 3000 outline procedures to conduct field testing measurements and observations. They include the parameters that are measured in-situ or in a field-collected sample. Additionally some samples with allowable extended holding times may be collected for laboratory measurement, as described in the specific FT-series SOPs. Included in SOPs FT 1100 to FT 3000 are:
• FT 1100 Field Measurement of Hydrogen Ion Activity (pH)
• FT 1200 Field Measurement of Specific Conductance (Conductivity)
• FT 1300 Field Measurement of Salinity
• FT 1400 Field Measurement of Temperature
• FT 1500 Field Measurement of Dissolved Oxygen (DO)
• FT 1600 Field Measurement of Turbidity
• FT 1700 Field Measurement of Light Penetration (Secchi Depth and Transparency)
• FT 1800 Field Measurement of Water Flow and Velocity
• FT 1900 Continuous Monitoring with Installed Meters
• FT 2000 Field Measurement of Residual Chlorine
• FT 3000 Aquatic Habitat Characterization
1.2. Exclusions: If proposed for experimental purposes, field-screening procedures employing techniques not addressed in these SOPs must be submitted to the DEP site or project manager. Such procedures must be addressed for each program or project dealing specifically with the planning and design of sampling events. Data quality objectives for quantitative assessment preclude the use of field-screening procedures for regulatory purposes.
1.3. Expectations and Requirements:
1.3.1. In some cases, specific instruments are identified in the SOP, with detailed instruction provided on their use. If you are using a different instrument from that identified in the SOP, follow the manufacturer’s instructions for assembly, operation, and maintenance.
Page 1 of 8 Revision Date: March 31, 2008 (Effective 12/3/08)

DEP-SOP-001/01 FT 1000 General Field Testing and Measurement
1.3.2. When required, the FT-series SOPs outline the instrument specifications. A field instrument must meet the stated requirements.
1.3.3. The FT-Series SOPs specify the calibration requirements for each method. Although instruments may vary in configuration or operation, the specified calibration requirements must be met.
1.3.3.1. Where applicable to the FT-series SOP, use the minimum number of calibration standards specified.
1.3.3.2. Do not establish the lower limit of the quantitative calibration bracket with “zero” solutions, quality control blanks or reagent dilution water.
1.3.4. Ensure that all equipment is in proper working condition, calibrated, and that batteries are properly charged before using the equipment for field testing measurements.
1.3.5. If reagents or standards are prepared from stock chemicals, they must be analytical reagent grade or better. Some procedures may specify a higher grade or assay of reagent or standard.
1.4. Recommendations for Use of Grab Samples or in situ Field Testing Measurements:
1.4.1. Use in situ readings where practical for field measurements in surface water and wastewater.
1.4.2. Use in situ readings or flow-through containers for field measurements for groundwater stabilization during purging and for other applications where groundwater monitoring measurements are required.
1.4.3. If grab samples are collected for measurement where allowed in the individual FT-series SOP, measure samples within fifteen (15) minutes of collection when immediate analysis is specified per Table FS 1000-4 and FS 1000-5. Otherwise, analyze grab samples within the applicable holding times specified in Table FS 1000-4 and FS 1000-5.
2. MINIMUM CALIBRATION REQUIREMENTS:
2.1. Calibration Definitions: This section outlines the essential calibration concepts that must be applied to each field test. Specific requirements for calibration are addressed in the individual SOPs.
2.1.1. Initial Calibration (IC): The instrument or meter electronics are adjusted (manually or automatically) to a theoretical value (e.g., dissolved oxygen saturation) or a known value of a calibration standard.
2.1.2. Initial Calibration Verification (ICV): The instrument or meter calibration is checked or verified directly following initial calibration by measuring a calibration standard of known value as if it were a sample and comparing the measured result to the calibration acceptance criteria listed in the SOP.
2.1.3. Continuing Calibration Verification (CCV): The instrument or meter calibration is checked or verified by measuring a calibration standard of known value as if it were a sample and comparing the measured result to the calibration acceptance criteria listed in the SOP.
2.1.4. Chronological Calibration Bracket: The interval of time between verifications within which environmental sample measurements must occur. The instrument or meter
Page 2 of 8 Revision Date: March 31, 2008 (Effective 12/3/08)
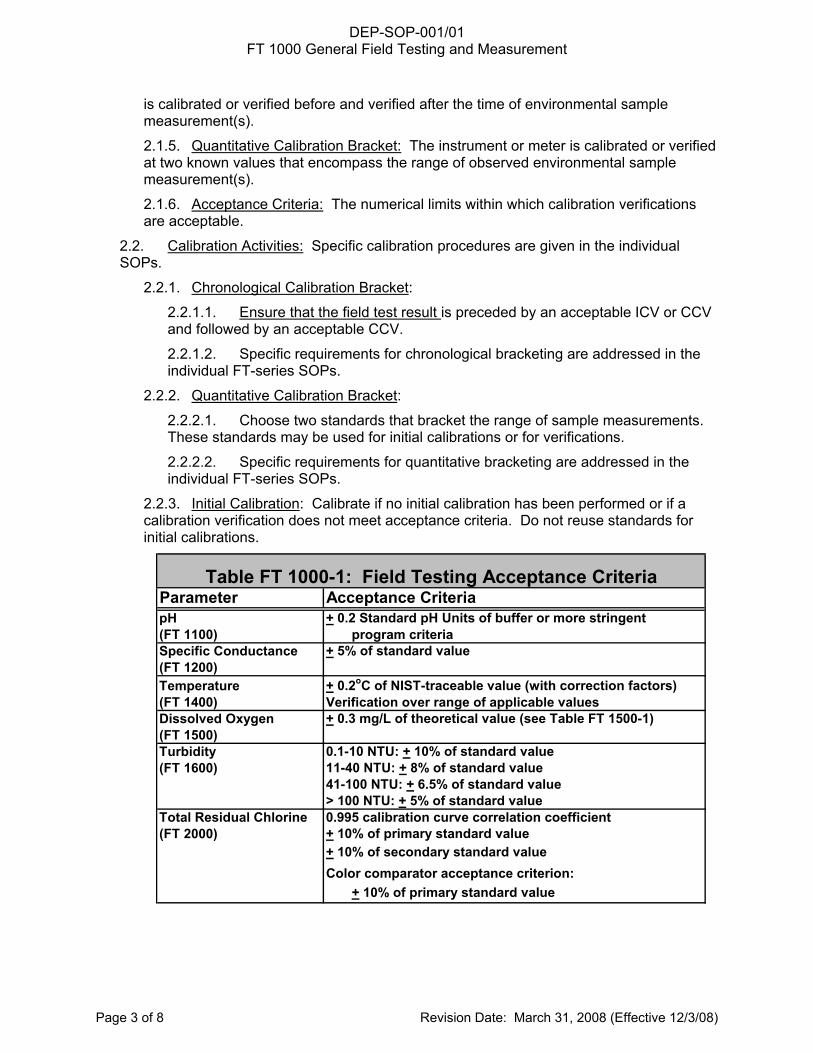
DEP-SOP-001/01 FT 1000 General Field Testing and Measurement
is calibrated or verified before and verified after the time of environmental sample measurement(s).
2.1.5. Quantitative Calibration Bracket: The instrument or meter is calibrated or verified at two known values that encompass the range of observed environmental sample measurement(s).
2.1.6. Acceptance Criteria: The numerical limits within which calibration verifications are acceptable.
2.2. Calibration Activities: Specific calibration procedures are given in the individual SOPs.
2.2.1. Chronological Calibration Bracket:
2.2.1.1. Ensure that the field test result is preceded by an acceptable ICV or CCV and followed by an acceptable CCV.
2.2.1.2. Specific requirements for chronological bracketing are addressed in the individual FT-series SOPs.
2.2.2. Quantitative Calibration Bracket:
2.2.2.1. Choose two standards that bracket the range of sample measurements. These standards may be used for initial calibrations or for verifications.
2.2.2.2. Specific requirements for quantitative bracketing are addressed in the individual FT-series SOPs.
2.2.3. Initial Calibration: Calibrate if no initial calibration has been performed or if a calibration verification does not meet acceptance criteria. Do not reuse standards for initial calibrations.
Parameter Acceptance CriteriapH + 0.2 Standard pH Units of buffer or more stringent(FT 1100) program criteriaSpecific Conductance + 5% of standard value(FT 1200)Temperature + 0.2oC of NIST-traceable value (with correction factors)(FT 1400) Verification over range of applicable values Dissolved Oxygen + 0.3 mg/L of theoretical value (see Table FT 1500-1)(FT 1500)Turbidity 0.1-10 NTU: + 10% of standard value(FT 1600) 11-40 NTU: + 8% of standard value
41-100 NTU: + 6.5% of standard value> 100 NTU: + 5% of standard value
Total Residual Chlorine 0.995 calibration curve correlation coefficient(FT 2000) + 10% of primary standard value
+ 10% of secondary standard valueColor comparator acceptance criterion: + 10% of primary standard value
Table FT 1000-1: Field Testing Acceptance Criteria
Page 3 of 8 Revision Date: March 31, 2008 (Effective 12/3/08)

DEP-SOP-001/01 FT 1000 General Field Testing and Measurement
2.2.4. Initial Calibration Verification:
2.2.4.1. Perform an ICV immediately after calibration. All ICVs must meet the calibration acceptance criteria specified in the applicable FT-series SOP. See Table FT 1000-1 for a list of acceptance criteria for the most common field testing procedures.
2.2.4.2. If an ICV fails to meet acceptance criteria, immediately recalibrate the instrument using the applicable initial calibration procedure or remove it from service.
2.2.5. Continuing Calibration Verification: Perform a CCV at no more than 24-hour intervals from previous verification, except where noted for individual FT-series SOPs.
2.2.5.1. If historically generated data demonstrate that a specific instrument remains stable for longer periods of time, the time interval between calibration verifications may be increased.
2.2.5.2. Base the selected time interval on the shortest interval that the instrument maintains stability. If CCVs consistently fail, shorten the time period between verifications or replace/repair the instrument.
2.2.5.3. All CCVs must meet the calibration acceptance criteria specified in the applicable FT-series SOP. See Table FT 1000-1 for a list of acceptance criteria for the most common field testing procedures.
2.2.5.4. If a CCV fails to meet acceptance criteria perform one or more of the following procedures as necessary:
• Reattempt the CCV again within the chronological bracket time interval without changing the instrument calibration. Do not perform maintenance, repair, or cleaning of the instrument or probe. Probes may be rinsed with analyte-free water or fresh verification standard. The CCV may be reattempted with a fresh aliquot of verification standard.
• Perform the initial calibration, perform an ICV, re-analyze the sample(s), and perform a CCV.
• Report all results between the last acceptable calibration verification and the failed calibration verification as estimated (report the value with a "J"). Include a narrative description of the problem in the field notes.
2.2.5.5. For installed instruments that are deployed for extended periods of time or used for continuous monitoring, see FT 1900.
2.2.5.6. Shorten the time period between verification checks or replace/repair the instrument.
2.2.6. Determining the Values of Secondary Standards: Use only those standards recommended by the manufacturer for a specific instrument. Only use secondary standards for continuing calibration verifications. See the individual FT-series SOPs for specific procedures for use of secondary standards. At documented intervals, determine or verify the values of secondary standards immediately after performing an initial calibration or after verifying the calibration with primary standards. Read each secondary standard as a sample. This result must be within the manufacturer’s stated tolerance range and +/- 10% of the stated standard value. If the +/- 10% criterion is not
Page 4 of 8 Revision Date: March 31, 2008 (Effective 12/3/08)
DEP-SOP-001/01 FT 1000 General Field Testing and Measurement
met, assign this reading as the value of the standard. If the reading is outside the manufacturer’s stated tolerance range, discard the secondary standard.
2.2.7. More frequent calibration verifications may be required for discharge permit compliance measurements or other regulatory requirements.
3. PREVENTIVE MAINTENANCE: Record all maintenance and repair notes in the maintenance logbook for each meter (see FS 1007). If rental equipment is used, a log is not required. However, the origin (i.e., rental company), rental date, equipment type, model number, and identification number (if applicable) must be entered into the field notes or a rental equipment notebook.
4. DOCUMENTATION
4.1. Standard and Reagent Documentation: Document information about standards and reagents used for calibrations, verifications, and sample measurements.
4.1.1. Note the date of receipt, the expiration date and the date of first use for all standards and reagents.
4.1.1.1. Document acceptable verification of any standard used after its expiration date.
4.1.2. Record the concentration or other value for the standard in the appropriate measurement units.
4.1.2.1. Note vendor catalog number and description for pre-formulated solutions as well as for neat liquids and powdered standards.
4.1.2.2. Retain vendor assay specifications for standards as part of the calibration record.
4.1.3. Record the grade of standard or reagent used.
4.1.4. When formulated in-house, document all calculations used to formulate calibration standards.
4.1.4.1. Record the date of preparation for all in-house formulations.
4.1.5. Describe or cite the procedure(s) used to prepare any standards in-house (DEP SOP or internal SOP).
4.2. Field Instrument Calibration Documentation: Document acceptable calibration and calibration verification for each instrument unit and field test or analysis, linking this record with affected sample measurements.
4.2.1. Retain vendor certifications of all factory-calibrated instrumentation.
4.2.2. Designate the identity of specific instrumentation in the documentation with a unique description or code for each instrument unit used.
4.2.2.1. Record the manufacturer name, model number, and identifying number such as a serial number for each instrument unit.
4.2.3. Record the time and date of all initial calibrations and all calibration verifications.
4.2.4. Record the instrument reading (value in appropriate measurement units) of all calibration verifications.
4.2.5. Record the name of the analyst(s) performing the calibration.
Page 5 of 8 Revision Date: March 31, 2008 (Effective 12/3/08)
DEP-SOP-001/01 FT 1000 General Field Testing and Measurement
4.2.6. Document the specific standards used to calibrate or verify the instrument or field test with the following information:
• Type of standard or standard name (e.g., pH buffer)
• Value of standard, including correct units (e.g., pH = 7.0 SU)
• Manufacturer’s tolerance range for secondary standards
• Link to information recorded according to section 4.1 above
4.2.7. Retain manufacturers’ instrument specifications.
4.2.8. Document whether successful initial calibration occurred.
4.2.9. Document whether each calibration verification passed or failed.
4.2.10. Document any corrective actions taken to correct instrument performance according to records requirements of FD 3000.
4.2.10.1. Document the date and time of any corrective actions.
4.2.10.2. Note any incidence of discontinuation of use of the instrument due to calibration failure.
4.2.11. Describe or cite the specific calibration or verification procedure performed (DEP SOP or internal SOP).
4.3. Record all field-testing measurement data, to include the following:
• Project name
• Date and time of measurement or test (including time zone, if applicable)
• Source and location of the measurement or test sample (e.g., monitoring well identification number, outfall number, station number or other description)
• Latitude and longitude of sampling source location (if required)
• Analyte or parameter measured
• Measurement or test sample value
• Reporting units
• Initials or name of analyst performing the measurement
• Unique identification of the specific instrument unit(s) used for the test(s)
Page 6 of 8 Revision Date: March 31, 2008 (Effective 12/3/08)

DEP-SOP-001/01 FT 1000 General Field Testing and Measurement
Appendix FT 1000 Tables, Figures and Forms
Table FT 1000-1 Field Testing Acceptance Criteria
Page 7 of 8 Revision Date: March 31, 2008 (Effective 12/3/08)

DEP-SOP-001/01 FT 1000 General Field Testing and Measurement
Page 8 of 8 Revision Date: March 31, 2008 (Effective 12/3/08)
Parameter Acceptance CriteriapH + 0.2 Standard pH Units of buffer or more stringent(FT 1100) program criteriaSpecific Conductance + 5% of standard value(FT 1200)Temperature + 0.2oC of NIST-traceable value (with correction factors)(FT 1400) Verification over range of applicable values Dissolved Oxygen + 0.3 mg/L of theoretical value (see Table FT 1500-1)(FT 1500)Turbidity 0.1-10 NTU: + 10% of standard value(FT 1600) 11-40 NTU: + 8% of standard value
41-100 NTU: + 6.5% of standard value> 100 NTU: + 5% of standard value
Total Residual Chlorine 0.995 calibration curve correlation coefficient(FT 2000) + 10% of primary standard value
+ 10% of secondary standard valueColor comparator acceptance criterion: + 10% of primary standard value
Table FT 1000-1: Field Testing Acceptance Criteria


