59
RNM/OECS COUNTRY STUDIES TO INFORM TRADE NEGOTIATIONS: ST. VINCENT AND THE GRENADINES Prepared by Alick Lazare Patrick Antoine Wendell Samuel March 2001

RNM/OECS COUNTRY STUDIESTO INFORM TRADE NEGOTIATIONS:ST. VINCENT AND THE GRENADINES
Prepared by
Alick LazarePatrick AntoineWendell Samuel
March 2001


TABLE OF CONTENTS INTRODUCTION..............................................................................................................................1 RECENT ECONOMIC PERFORMANCE...........................................................................................1 RECENT FISCAL PERFORMANCE..................................................................................................3
Structure of Revenues.....................................................................................................................4 Recent Tax Changes .......................................................................................................................6
MEDIUM TERM PROSPECTS..........................................................................................................7 Fiscal Prospects..............................................................................................................................7 Medium Term Policy Objectives ...................................................................................................10
SECTORAL STRATEGIES..............................................................................................................11 Economic Infrastructure................................................................................................................12 Social Infrastructure......................................................................................................................13 The Environment ..........................................................................................................................13
AGRICULTURE SECTOR...............................................................................................................14 Contribution and Performance .......................................................................................................14 Policies and Prospects...................................................................................................................17
Bananas...................................................................................................................................17 Non-Banana Agriculture ...........................................................................................................18 Livestock .................................................................................................................................19 Forestry ...................................................................................................................................20 Fisheries ..................................................................................................................................20 Land Reform............................................................................................................................20
MANUFACTURING.......................................................................................................................20 Constraints to the Development of Manufacturing ..........................................................................22 Policies and Prospects...................................................................................................................24
TOURISM.......................................................................................................................................25 Contribution to GDP.....................................................................................................................26 Role of Foreign Direct Investment .................................................................................................26
CONSTRUCTION ...........................................................................................................................26 Recent Economic Developments....................................................................................................26
TRANSPORTATION.......................................................................................................................27 COMMUNICATIONS......................................................................................................................27 FINANCIAL SERVICES..................................................................................................................29
Offshore Financial Services...........................................................................................................29 Offshore Financial Services in St. Vincent .....................................................................................32 Domestic Financial Services..........................................................................................................34
TRADE LIBERALIZATION............................................................................................................35 Status of CET...............................................................................................................................35 Trade and Revenue Effects of the CET...........................................................................................36 Trade Liberalisation Negotiations (FTAA & WTO)...................................................................... 388 Simulations of a Reduction in Trade Taxes.....................................................................................39 Transmission Mechanism of a Reduction in Tariffs....................................................................... 400
SIMULATIONS...............................................................................................................................41 LIBERALIZATION OF TRADE IN SERVICES ...............................................................................43
Commitments Under GATS and Trading Arrangements..................................................................44 Financial Services.....................................................................................................................44 Health Related Services ............................................................................................................45 Tourism and Tourism Related Services ......................................................................................45 Recreational and Sporting Services/Transport Services/Transshipment/Free Zones.......................45 Direction of Trade ....................................................................................................................45
CONCLUSION............................................................................................................................. 45

St Vincent and The Grenadines
1
ST. VINCENT AND THE GRENADINES
INTRODUCTION St. Vincent and The Grenadines has traditionally been regarded as an agricultural economy with that sector accounting for as much as 21% of GDP in 1977. However, like most of the OECS economies, in recent time the economy has become more diversified and the agricultural sector now accounts for about 12% of GDP. St. Vincent's agricultural sector has been rather more diversified than Dominica and St. Lucia and hence would not be as severely affected by the World Trade Organisation (WTO) ruling on bananas. Regional agricultural exports have always been a big outlet for St. Vincent's agricultural production. Government services (16%), Wholesale and retail (15%), Transport (15%) and Construction round out the top five major activities in the country. Communications like in the rest of the OECS countries has been a rapidly expanding sector. The manufacturing sector has never really taken hold in St. Vincent and The Grenadines. Manufacturing contribution to GDP peaked at 10.9% in 1990 but since then has declined steadily to 7.3% in 1998. Efforts at diversification have focussed on the tourism sector and although there has been some growth, the sector still contributes less than 3% of GDP. RECENT ECONOMIC PERFORMANCE The economy of St. Vincent and The Grenadines grew at an average rate of 5.7% per annum over the period 1986-1998. However this average masks a variety of performances which can be divided into three distinct periods. The period 1986-1989 was a period of high growth, during which the average growth rate exceeded 6% annually. The second period, which lasted from1990-94 was a period of slower and sometimes negative growth. The period 1995-1998 saw a period of recovery as the economy resumed growth, albeit at a slower rate than that achieved in the late 1980s. Buoyed by rapid expansion in the agricultural sector, in particular the banana industry, the economy grew at an average annual rate of 7.9% during the period 1986-1989. After experiencing a decline of 31.8% in 1986 due to poor weather conditions the industry grew at 13.3 and 212.3% in 1987 and 1998 respectively. A negative growth rate of 5.3% was again experienced in 1989. These volatile changes in the value added in bananas, fluctuating between high positive growth and high negative growth have characterised the industry over the entire period under consideration. The manufacturing sector achieved relatively strong growth during this period averaging 9.7% and achieving growth rates in excess of 10% in three of the four years. Communications was the fastest growing sector achieving an annual average rate of growth of 17.1% over the period, and in 1986, achieved a growth rate in excess of 30%. Construction also grew at an average annual rate in excess of 8% during this period and so did transport. The

St Vincent and The Grenadines
2
growth in the economy was broad-based as all sectors of the economy expanded, except for government services and real estate and housing which grew at a rate less than 3%. During this period the deficit on the current account of the balance of payments widened from 9.1% of GDP in 1986 to 19.8% in 1989. Exports grew at an annual rate of 8.1% while imports grew at 13.3%. Except for 1987 the overall balance of payments recorded an overall surplus during the other years. Capital transfers amounting to 7% of GDP and Foreign Direct Investment averaging 5.1% of GDP were able to offset the widening current account balance. The rapid pace of growth was interrupted during the period 1990-1994 as the economy stalled. After growing at 6.7% in 1990, marginal growth (0.5%) was achieved in 1991. A 54% increase in the value added in bananas led to a 9% growth in the economy in 1992 but negative growth rate of -0.7 and -3.0% were experienced in 1993 and 1994 respectively, as the value added in bananas tumbled by -24.2 and -48.1% respectively. The price shock created by the withdrawal of the pound sterling from the European exchange rate mechanism (ERM) and the increased uncertainty in the industry was responsible for this decline. The construction, distributive and tourism sectors continued to grow at the rates achieved earlier but the growth rate of the communications sector slowed to less than 2% after achieving growth rates in excess of 20% in 1990 and 1991. This period saw further deterioration of the current account of the balance of payments. It widened from 13.8% of GDP to 29.5%. The negative growth rate in banana production coupled with the fall in the domestic currency price of bananas consequent on the exit of the pound sterling from the ERM resulted in an almost EC$100m reduction in earnings from merchandise exports. Merchandise export earnings declined from EC$352.3m in 1990 to EC$255.5 in 1994. Not surprisingly, the overall balance of payments recorded deficits in all other years except 1993. This occurred in spite of FDI flows amounting to 9.5% of GDP and tourism receipts averaging EC$87.38 during that five year period. The period 1994 to 1998 can only be described as a period or erratic growth as the economy fluctuated between years of high and low growth but averaging about 4% over the period. The growth in the overall economy mirrored the performance of the agricultural sector and in particular the volatility of the banana industry. Banana production declined -55% in 1994, grew by 63% in 1995 and declined -9.4% and -42.4% in 1996 and 1997 respectively. In 1998 value added in the industry increased by 33.04%. This volatility is related to the uncertainty in the industry and weather conditions. As noted earlier, the manufacturing sector also displayed similar volatility but with a much lower amplitude. A similar patter was observed for the tourism sector. The only sector that seems to have been isolated from the volatility is the financial services sector and to a lesser extent, communications. Since 1994 the balance on the current account of the Balance of Payments fluctuated almost in tandem with the fortunes of the banana industry as the merchandise exports mirrored banana production and imports continued to rise. The volatility in the banana industry coupled with the cessation of regional agricultural exports as a result of the mealy bug infestation are the major causes for the poor performance of merchandise exports. It was during this period that for the first time, tourism earning exceeded export earning from bananas. Competitive pressures in the
St Vincent and The Grenadines
3
regional market for flour and beverages have also contributed to the decline in merchandise exports. The growth in imports was related to the inflow of foreign direct investment for the construction of a major hotel and the implementation of a number of large projects in the Public Sector Investment Programme (PSIP). Although capital transfers fell to EC$14.5m and EC$13.8m in 1995 and 1996 they improved significantly during the remaining years due to significant inflows of STABEX funds to assist with the rehabilitation of the banana industry. Capital Transfers were EC$57.9m, equivalent to 8% of GDP in 1998. Meanwhile FDI flows continued to increase averaging 11% of GDP during the period 1995-98. RECENT FISCAL PERFORMANCE Fiscal performance in St. Vincent and The Grenadines has been characterised by moderate tax ratios and strong growth in central government operations. Over the past five years government has maintained current account savings at close to 4.0% of GDP and overall deficits of just over 1.0% of GDP which were financed by external loans and moderate amounts of domestic borrowing. The savings/investment ratio in 1994 stood at 60.0% declining to 36.5% in 1998 as government embarked on higher levels of public sector investment which rose from 6.6% of GDP in 1994 to 12.1% of GDP in 1998. The rest of the public sector achieved annual current account savings averaging just under 2.0% of GDP and was a net contributor to domestic savings. Except for the Marketing Board, the Arrowroot Industry Association, the St. Vincent Development Corporation, the Housing and Land Development Corporation, the Philatelic Services and Diamond Diary and Camden Park Container Port, all other major public enterprises showed strong savings performance. Central government operations showed consistent growth in recurrent revenues (except for a period of negative growth in 1989) averaging 7.9% between 1984 to 1998. Tax revenue growth averaged 8.2% over that period. Taxes on international trade, however, showed slightly lower average growth at 8.0%. Total revenue as a per cent of GDP declined from 39.0% in 1984 to 35.0% by 1998. With regard to the relative importance of taxes, there was a slight shift towards domestic taxes which increased from 13.8% of GDP in 1984 to 14.1% of GDP in 1998. Taxes on international trade, on the other hand, declined from 17.9% of GDP to 14.6% of GDP while non-tax revenue also declined from 7.3% to 5.9% of GDP over the same period. Tax buoyancy remained strong at 0.98 for tax revenue overall and 0.95 for taxes on international trade despite constant erosion of the taxable base by concessions in both direct and indirect taxes. It is estimated that close to 54.0% of imported goods are relieved of duties and taxes including government imports. Recurrent expenditure which was equivalent to 36.1% of GDP in 1984 fell to 29.3% by 1998. Overall, annual growth in recurrent expenditure averaged 6.5% as compared to annual growth in recurrent revenues which averaged 7.9%. Growth in wages and salaries was particularly strong at 8.0% as compared to growth in goods and services at 3.8% and interest payments at 7.4%. Growth in transfers, however, averaged 29.8% over the same period, although the rate of growth

St Vincent and The Grenadines
4
has slowed down markedly during the period 1995 to 1998 as public sector enterprises improved their operations. No significant change has occurred in the sectoral allocation of recurrent expenditure. General administration consumed a larger portion of recurrent revenues with allocations rising form 24.4% to 26.6% of total recurrent expenditure between 1990 and 1995. Education declined slightly from 21.6% to 20.2%. The share of allocations to Health declined from 15.1% to 13.6% and to social and community services from 13.1% to 11.4% over the same period. The share of allocations to economic services remained basically the same. The external debt of St. Vincent and The Grenadines as a per cent of GDP has been declining steadily since 1990 from 49.0% of GDP in that year to 35.4% of GDP by 1998. At the same time debt service costs as a ratio of recurrent expenditure have risen from 5.1% to 6.4% during the same period despite the highly concessional terms of borrowing. This is attributable to the assumption by government of the Ottley Hall debt which increased domestic debt by about 40.0%. An analysis of the outstanding debt by sector shows that in 1998 debt outstanding in respect of roads and bridges as a per cent of total debt was 21.2 followed by agriculture at 10.4 and industrial development at 8.1. The share of external debt attributable to investment in agriculture may be understated as most of the investment in roads and bridges was directed to agricultural feeder and farm roads. Aggregated multi-sector loans outstanding was 18.6 of the total. Utilities accounted for 5.9% while the shares for education and training and housing were 4.4% and 1.6% of the total respectively. Overall, the relationship between debt outstanding and GDP growth was positive throughout the period although the response from agriculture and manufacturing declined during the period 1996 to 1998. STRUCTURE OF REVENUES Although St. Vincent and The Grenadines has reduced its dependence on taxes on international trade and transactions from 17.9% of GDP in 1984 to 14.7% in 1998, the share of these taxes in total recurrent revenue is still considerable at over 42.0% as compared to domestic taxes at 43.3% and non-tax revenue at 14.7%. Domestic taxes in 1998 consisted of taxes on income at 30.3%, taxes on property at 1.6% and taxes on domestic goods and services at 11.4% of total recurrent revenue. The basic structure of taxes is similar to those of other OECS countries. Taxes are classified broadly under two headings – taxes and charges on domestic goods and services and taxes on international trade and transactions. Each classification consists of the following:
St Vincent and The Grenadines
5
Taxes and Charges on Domestic Goods and Services – • personal income tax after a threshold of $11,000 is levied at rates varying from 10.0% to
45.0% with the highest rate applying to taxable incomes over $45,000 after the threshold and after deduction of a number of qualifying allowances including mortgage interest, insurance premium, dependent relative, child, spouse and personal;
• corporate tax at 40.0% of net income with special rates for export companies at 35.0% for OECS exports, 30.0% for non-OECS CARICOM exports and 25.0% for extra-CARICOM exports;
• withholding tax generally at 10.0% on payments to non-residents with special rates of 10.0% for rents and 15.0% for inter-corporate dividends;
• property tax at 5.0% of annual rental value with special rates of 2.5% for agricultural property and hotels and apartments and 1.5% for tourism related developments greater than $20,000;
• a tax on land holding and transactions by aliens at 10.0% of rental value and 10.0% of sale respectively and in addition $500.00 license fee for holding land;
• excise duty at $9.00 on over proof rum and $15.00 on under proof rum;
• hotel turnover tax at 7 0% of room and restaurant bills;
• interest levy of 1.0% of interest bearing account balances;
• insurance premium tax of 5.0% of non-life premium value and 3.0% of life premium value;
• international telecommunications charges at 10.0% of the cost of outgoing traffic;
• entertainment tax at 10.0% of gate receipts;
• various trade, professional and vehicle licenses. Taxes on International Trade and Transactions - • consumption tax on the c.i.f. value of imports at general rates ranging from 5.0% to 35.0%
with specific rates on liquor and special rates up to 65.0% on vehicles;
• excise equalisation tax applying to CARICOM imports entering free of duty
• customs service charge at 4.0% of the c.i.f. value of imports;
• travel tax of 5.0% of airline tickets for travel originating in St. Vincent and The Grenadines;

St Vincent and The Grenadines
6
• cruise ship passenger tax of $25.00 for ships carrying less than 200 passengers and $15.00 for ships carrying more than 200 passengers;
• embarkation tax of $20.00 for departing passengers travelling by air. Only two of the taxes listed above appear to be inconsistent with WTO standards. The first relates to the tax on aliens entering into land transactions. While the revenue loss from the abolition of this tax would be insignificant, there are social implications for deregulating the transfer of land. There are valid concerns that such deregulation could alienate the poorer segment of society from lands required for basic shelter and small farming if a demand/price spiral forces lower income groups from the land market. A gradual approach to, and an effectively devised strategy for deregulation is needed so as to protect vulnerable groups from dispossession or exclusion. The other area of concern relates to the customs service charge which was recently increased from 2.5% of CIF to 4.0% of CIF to compensate for losses incurred in the final implementation of the CARICOM CET. The present rate of this tax appears to be in violation of the limit allowed for cost recovery under GATT rules. With revenue yield over 7.0% of tax revenue, an adjustment of this charge within the allowable limit would result in a considerable loss of revenue unless compensatory changes are made to shift the tax downstream from imports to expenditure on goods and services without destabilising the relative competitivess of locally produced goods. Generally, the tax structure bears heavily on income and expenditure on goods. The greater part of expenditure on services, except hotel, insurance, entertainment, telecommunications and professional, is not captured. A notable anomaly is the exemption of dividends from the income tax while interest-bearing savings are subjected to a 1.0% levy. While the former favours growth in share holdings, the latter could decelerate growth in savings and consequently in sustainable investment. A consistent incentive policy towards both dividends and interest bearing deposits could stimulate growth in both savings and investment RECENT TAX CHANGES Major changes were made to the personal income tax in 1994 which reduced the number of marginal rates from nine to five with the top rate falling from 55.0% at taxable incomes over $45,000 to 45.0% at the same taxable income and later to 40.0%. In 1998, a further change was made to increase the threshold from $10,000 to $11,000. Adjustments towards the CET were completed up to Phase IV in 1998. In addition, the following tax changes were implemented: • increase in the customs service charge from 2.5% to 4.0%;
• an increase in the insurance premium tax from 3.0% to 5.0% and the abolition of the withholding tax on re-insurance premium;
St Vincent and The Grenadines
7
• an increase in the hotel tax from 5.0% to 7.0%;
• exemption of imports by the St. Vincent Banana Association from the customs service charge;
• abolition of export duty on banana exports;
• increase in customs surcharge from 2.0% to 2.5%;
• exemption of agricultural income from income tax for five years;
• abolition of tax on dividends;
• increase in bank licenses. MEDIUM TERM PROSPECTS The Economy of St. Vincent and The Grenadines is expected to grow at an average rate of 4% annually over the period 2000-2002. This performance is hinged on the performance of the agricultural sector, mainly bananas; expansion in the tourism sector and the take off other services in particular financial services and informatics. With respect to agriculture, the improvement of fruit quality, better husbandry and the irrigation of substantial acreage of banana lands under the STABEX funded banana industry rehabilitation programme would yield increases in out put in that sub-sector. The resumption of agricultural exports to the regional market would also contribute to a recovery in that sector. In the services sector the breakup of the monopoly in the telecommunications sector is likely to lead to an opening up of opportunities for service providers in this sector and in other related services. On the other hand, the manufacturing sector is expected to remain stagnant is the competitive pressures continue to buffet the sector. Inflation is expected to remain benign as inflation rate moves in line with that of the USA - St. Vincent and The Grenadines major trading partner. FISCAL PROSPECTS Central government operations are expected to maintain steady growth and to achieve current savings of at least 4.0% of GDP and overall public sector savings of 9.2% of GDP by year 2000. However, this objective may be challenged if public sector investment continues at present levels and debt servicing costs continue to increase. Careful selection of investment spending and funding will have to be made to maintain the debt ratio to the planned target of 45% of GDP. Government has taken a number of important measures to strengthen fiscal management. Most of these measures have been newly implemented and the full benefits have not been felt since the integration of systems and the training of personnel are still in progress. These include:

St Vincent and The Grenadines
8
• a standard integrated tax administration system (SIGTAS) to computerise tax assessments and accounting, strengthen tax legislation and improve tax administration generally;
• a standard integrated government financial information system (SIGFIS) to computerise procurement, payments and accounting and improve treasury operations;
• budget reform to strengthen budget management and rationalise the allocation of budget resources;
• ASYCUDA designed to enhance customs duty assessments and accounting and strengthen customs management;
• Reform of the legal and regulatory framework for strengthening fiscal/financial management. Prospects for improved fiscal performance will also be assisted by the implementation of a number of policies already identified such as the revision of user fees (hospital fees and postal rates), the introduction of a national insurance scheme, the rationalisation of tax concessions and improvements in the collection of revenue arrears. At the same time expenditure control measures should be intensified to reduce wastage and improve the efficiency of resource allocation and use. Fiscal performance in St. Vincent and The Grenadines has shown satisfactory ratios in relation to central government savings, revenue buoyancy, the external debt and debt servicing costs. Recurrent revenue and expenditure ratios have been comparatively high at 35.0% and 31.0% of GDP respectively. There are a number of issues, however, in both revenue mobilisation and expenditure allocation which need to be addressed. Tax rates in St. Vincent and The Grenadines are relatively high. This coupled with the unequal distribution of the tax burden encourages non-compliance, a situation compounded by the complexities of the tax laws and the weakness of the administration to enforce tax collection. As a result high accumulation of arrears occur due to arbitrary assessments and disputes which take time to resolve. Additionally, tax authorities do not have adequate legal support to pursue complicated cases in court. Customs revenue is also affected similarly. Undervaluation of imports and smuggling challenge the capacity of customs administration to achieve revenue targets. E-commerce and electronic transactions further complicate customs operations in a situation where most customs officials have received only basic training in customs procedure. Moreover, the demands for increasing attention to drug control and preventive work have put a strain on the resources of customs administration to maintain their normal revenue functions. Recent initiatives have been taken to strengthen both the customs and inland revenue. ASYCUDA has assisted in upgrading the assessment, warehousing and accounting functions by computerising customs entry processes; but has not realised its full potential as a management tool. DFID has also assisted to strengthen customs administration by upgrading management and operating skills of customs officials. The SIGTAS has brought considerable improvements to the administration of the inland revenue with encouraging results. It has been reported that

St Vincent and The Grenadines
9
there have been significant improvements in service delivery, information retrieval and taxpayer registration which has helped to broaden the tax net. Another important area of concern is the considerable loss of revenue arising from the administration of the incentives regime. This creates distortions in burden sharing as well as opportunities to divert taxable income from the tax net. The result is high effective tax rates in some sectors and extremely low rates in others. Although data are not available to carry out a complete analysis in the case of St. Vincent and The Grenadines, the application of the incentives laws indicates a distinct bias towards preferred sectors such as agriculture, tourism and manufacturing. The allocative effect of this policy tends to drive investments in sectors where economic rents (such as provided by the incentives framework) are readily available. It is becoming more accepted that in the drive towards diversification and balanced growth all sectors are important and that the bias shown in the incentives regime is no longer appropriate. This situation also affects customs revenue. It is estimated that 54.0% of revenue from customs is forgone as a result of exemptions and ad hoc concessions. Quite apart from the direct revenue loss, lack of transparency in the incentives policy and the absence of a system of accountability on the part of the recipients of incentive benefits challenge the authority and morale of tax officials and increase the difficulties they face in enforcing tax compliance. Given the current weakness in tax administration the tax system should be made less difficult to administer. Some of the taxes and charges provided by statute are complicated to administer and many of them are low yielding. Although St. Vincent and The Grenadines has only recently engaged in a tax reform programme, there is room to further simplify the tax system by reducing the number of taxes to a few high yielding, broad based taxes that can be efficiently administered and that will encourage compliance as well as growth in private savings and investments. There have been regular reviews of user charges both within central government and the rest of the public sector. But some of these charges are still below economic levels and should be adjusted. The government has stated its intention to examine the feasibility of introducing a national health insurance scheme which should assist in recovering a significant part of health costs. It is also intended to review postal rates as soon as possible. As far as the central budget is concerned, the recent introduction of programme and performance budgeting should provide data on the unit cost of providing services to both the public and internally that should facilitate a revision of user charges. Such data should also aid in decisions concerning the commercialisation or divestment of selected economic and social services presently provided by government. As mentioned above the ratio of recurrent expenditure is high at 31.0% at GDP. Annual growth in recurrent expenditure has been well contained at an average of 6.5% per annum. However, given the already high ratio of recurrent revenue to GDP at 35.0% of GDP, more needs to be done to lower the proportion of recurrent expenditure if higher levels of public sector savings is to be realised.

St Vincent and The Grenadines
10
A substantial share of the recurrent expenditure (54.7% in 1998) goes to the payment of wages and salaries. The sectoral allocation of recurrent expenditure shows a vast improvement as compared to other to other OECS countries with education’s share at 20.2%, health at 13.6% and economic services at 21.4% as compared to 26.6% for general administration. Given the large share of expenditure devoted to wages and salaries, there appears to be need to re-examine government’s employment and pay policy. With regards to employment policy a review of the actual manpower needs consistent with government’s goals, objectives and priorities may very well result in reduced numbers. At the same time, government’s pay policy has been inward looking and not market oriented. There may be need to take account of private sector comparators to establish wage rates for mid and upper management in particular that are competitive so as to attract much needed skills into the public service. Additionally, annual wage adjustments, although well controlled in the past, should be negotiated within transparent and mutually accepted parameters that are based more directly on changes in macro economic indicators. The net result of this approach may not result in significant savings immediately but should support improvements in civil service efficiency and growth in savings on a sustainable basis. The share of transfers to the rest of the public sector at 16.7% of recurrent expenditure also indicates a need to review the operations of public enterprises. Most of these enterprises are currently generating surpluses on their operations. Nonetheless, government should consider formulating a privatisation policy for divestment of some of its assets, in particular loss making enterprises. In general, government’s recurrent budget has performed satisfactorily. The recent introduction of programme and performance budgeting backed up by the standard integrated government financial information system (SIGFIS) should strengthen the process of reviewing expenditure proposals, evaluating performance and providing adequate management information for policy adjustments in the use of resources. These programmes have not been extended to all departments and are still at their initial stages. It should be noted, however, that while they are designed to introduce flexibility in resource allocation and priority setting, they operate within rigid institutional arrangements which could affect the dynamics of change which they were intended to provide. Public sector investment spending has been high at 14.8% of GDP in 1998. This has been supported by substantial grants which rose to 4.8% of GDP in that year as well as concessional loans. Although the external public debt of St. Vincent and The Grenadines has been well managed, public sector investments at that level may not be sustainable unless the savings level is increased considerably. More careful selection and prioritisation of projects will assist to maintain manageable levels of the public debt. MEDIUM TERM POLICY OBJECTIVES The medium term macroeconomic policy objectives are related to the implementation of measures to enhance the competitiveness of the economy to face the competitive pressures in the new international environment. The most important of these are:
St Vincent and The Grenadines
11
(i) Increasing the level of national saving in the economy: Over the period 1995-1997 gross capital formation averaged about 33% of GDP while gross national saving averaged about 25%. The saving investment gap was therefore financed by foreign inflows largely in the form of foreign direct investment especially in the tourism sector. However, government investment in physical infrastructure was financed largely by official borrowing internationally. In recognition of the need the reduce the saving-investment gap, the government is committed to increasing the level of public sector saving to 5% of GDP and the central government saving to 3% of GDP, in line with the framework for mutual obligations conditioning the disbursement of STABEX resources. Among the measures being implemented to try to achieve the level of public sector saving are:
(a) rationalisation of tax incentives; (b) implementation of comprehensive reform, including income tax, property, tax,
indirect taxes (c) Improvement in customs administration; (d) Introduction of a National Health Insurance
(ii) Private sector saving would be enhanced by the development of money and capital
markets being developed on a regional basis by the Eastern Caribbean Central Bank, and the creation of specialised saving vehicles to encourage contractual savings.
(iii) A new development bank is being established to meet the demands of the private sector
for long term financing and venture capital. New legislation are being considered to govern the operations and regulation of the insurance and credit union sectors.
(iv) Trade policy initiatives are geared to provide the enabling environment and collaboration
with the private sector to respond to changes in the international environment. In this regard the following measures are at various stages of implementation:
(a) Collaboration with regional countries and organisations to develop a strategy for
negotiations on trade agreements. (b) The establishment of mechanisms to strengthen the institutional capacity to
address World Trade Organisation and CARCOM issues. These include formation of inter-ministerial committees to channel information to the Regional Negotiating Machinery (RNM), regular consultations with the private sector on trade and development issues and regular attendance at regional and international meetings.
SECTORAL STRATEGIES The authorities in St. Vincent and The Grenadines are focussing on five major areas for the development of the economy over the medium-term. These are agriculture, tourism, offshore financial services, manufacturing and other services including informatics. The specific strategies for these sectors will be discussed under the appropriate sub-headings. However there are some cross cutting issues that affect all four sectors that can be discussed at this point. These

St Vincent and The Grenadines
12
are related to economic infrastructure, social infrastructure and the environment. These are potential constraints to the development of the productive sectors and would need to be addressed if the country is to take advantage of the opportunities afforded by trade liberalisation. ECONOMIC INFRASTRUCTURE In recent years there have been significant improvements in the port and airport facilities in St. Vincent and The Grenadines. Never the less the development of the tourist industry and export agriculture is still hampered by inadequate air access, mainly due to the limitations of the airport facilities on the mainland. A new cruise ship and ferry berth has been constructed at port Kingstown and prior to this a container port was constructed at Ottley Hall. The main Kingstown Port is still used for general cargo. Airport facilities have been developed on a number of Grenadines islands in recent times. An airport in Bequai capable of handing mid-size propeller-driven aircraft, the extension of the airport in Canouan to take similar aircraft and the realignment of the airport in Union Island have all added to the capital investment in airports in the country. However, the airport on the mainland does not provide direct access for international destinations due to the length of the airstrip. Moreover, it suffers from seasonal crosswinds which can make landing quite difficult and there is a shortage of abort space if aircraft take off in the appropriate direction. A plan to lengthen the existing airstrip out into the sea in order to accommodate mid-size jets is currently under consideration and some financing has already been identified. The development of a hotel resort at Mt. Wynne/Peter's Hope hinges on the improvement of air access to the country. The absence of adequate airport facilities on the mainland is one of the constraining forces in the development of the country. All of the other OECS countries except Dominica have international airports. This allows for scheduled jet service and the development of back to back charters where scheduled service is impracticable. This has led to significant increases in arrivals from the European market for countries like Grenada, St. Lucia and St. Kitts-Nevis. American Eagle has discontinued its service into St. Vincent citing the inadequacy of the airport facilities. Room capacity is not going to increase in the absence of adequate air access. Similarly agricultural output can be enhanced by better air access. Although one air-cargo company flies weekly into the existing airport there are concerns about the safety of such flights. The recent downgrading of the airport and the cessation of flights by one airline only highlights the urgency of addressing the issue of air access. The road network also underwent some improvement in recent times. The Central Leeward Highway and the improvement in the Sion Hill junction would have helped to reduce the congestion of getting into Kingston. However, much of the other roads have suffered from deferred maintenance as the Labour Intensive Road Maintenance Programme was not executed as efficiently as planned. The electricity supply in St. Vincent and The Grenadines has become more reliable with the significant investments in the energy sector. In particular, The Grenadines has benefited from such investments. The electricity generating capacity in The Grenadines was up graded to supply the demand for electricity by a major private sector investment in the tourism sector in

St Vincent and The Grenadines
13
Canouan and the electrification of Myreau. One new Power plant was constructed and facilities in Canouan, Cane End and Union Island were expanded. There were also improvements in the transmission and distribution system. SOCIAL INFRASTRUCTURE Human Development is central to the development strategy of St. Vincent and The Grenadines. To create a more skilled and flexible labour force to deal with the challenges of globalisation education at all levels is being addressed. In particular to address the shortage of persons with skills to work in informatics industry, a training programme to provide 1000 young persons with such skills has been executed. In addition, public sector in-service training will focus on financial management, strategic planning and quality management. The Government spends about 20% of its recurrent expenditure on education and about 12% of its capital budget. This expenditure complements the Basic Education Project, financed by the CDB. Its major aims are: (i) to expand access to education at all levels; (ii) improve curriculum development; (iii) strengthen administration and management; and (iv) increase teacher training. The Ministry of Education has been strengthened and a programme for testing and evaluation has been implemented. A review of the administrative and management systems has been undertaken to increase the efficiency of the sector and a management information system has been adopted. The provision of adequate level of primary health care at a reasonable cost is one of the major challenges of the authorities. It would require significant enhancement of the healthcare delivery system. This would involve improvement in both, the management of the system, and the physical infrastructure. At present expenditure on health accounts for approximately 13.6% of the recurrent budget. A comprehensive evaluation of all of the district Health Centres was undertaken to make recommendations to improve the community based delivery of health care services. The main hospital in Kingstown has been refurbished and expanded to enhance care at the accident and emergency department. In order to make health care more accessible the authorities have been looking at cost recovery mechanisms and greater private sector participation in the provision of health services. A National Health Insurance scheme is being proposed. THE ENVIRONMENT Like most small island economies, St. Vincent and The Grenadines recognises the fragility of its ecosystem and its importance in one of its major industry, tourism, which is heavily dependent on the preservation of the environment. At the same time tourism can be heavily destructive of the environment. Thus greater attention has to be paid to environmental issues including

St Vincent and The Grenadines
14
protection of the fragile ecosystem, bio-diversity, environmental impact assessment and general environmental issues. It is possible to turn the emphasis on environmental issues into profitable opportunities for these economies. The environment issues faced by the country are related to the use of its natural resources for agriculture and tourism. Some of the specific issues highlighted in the National Environmental Action Plan (NEAP) are watershed management, coastal zone management, marine resource management, solid waste management, liquid waste management, water resources and forestry resources. The Major projects that are being executed are: Solid Waste Management Projects for the mainland and Southern Grenadines, the Tobago Cays Marine Park, Coastal Resources Mapping Project and Community Based Watershed Management Project. The projects which are aimed at environmental sustainability are being executed in collaboration with the OECS Natural Resources Management Unit. ST. VINCENT AND THE GRENADINES AGRICULTURE SECTOR CONTRIBUTION AND PERFORMANCE From its dominant position in the decades of the 1970s and 1980s as the largest sectoral contributor to GDP, the decline of the agricultural sector started in the mid-1990s as the erosion of preferences for the country’s banana exports to Europe began to impact. The importance of the agriculture sector to GDP and specifically the importance of one crop, bananas, to overall economic performance is seen in the positive relationship between agriculture and GDP growth and between banana production and GDP growth as is clearly depicted in Table 24.
Table 24: St. Vincent Share and Growth Indicators – Agriculture
Real Price (1990) 1990-94 Avg.
1995 1996 1997 1998 1999
Agricultural GDP Share Per Cent 17.42 15.6 14.8 12.5 12.4 12.3 Agricultural GDP Growth Per Cent
-10.68 42.2 -3.9 -15.3 8.3 -5.7
- Crops -14.4 60.3 -6.1 -21.6 10.9 -5.4 - Bananas -18.7 63.0 -9.4 -41.3 33.0 -16.2 - Other Crops -7.3 58.6 -3.5 -6.9 0.6 1.2
- Livestock 3.1 2.8 2.7 3.1 2.0 1.9 - Forestry 2.3 2.2 2.1 2.4 2.0 2.0 - Fishing 6.72 5.7 3.0 3.0 3.0 -
12.0 Total GDP Growth Rate 1.8 8.3 1.2 3.1 5.8 3.9 Source: National Statistics, CSO.
St Vincent and The Grenadines
15
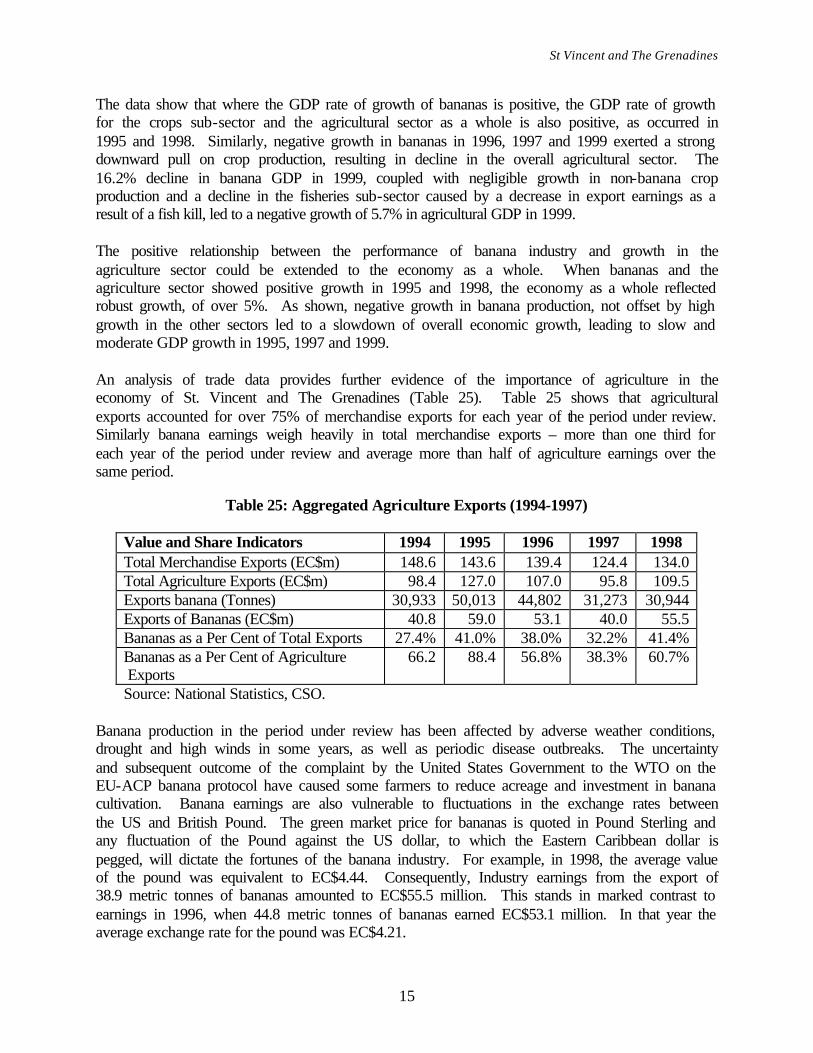
The data show that where the GDP rate of growth of bananas is positive, the GDP rate of growth for the crops sub-sector and the agricultural sector as a whole is also positive, as occurred in 1995 and 1998. Similarly, negative growth in bananas in 1996, 1997 and 1999 exerted a strong downward pull on crop production, resulting in decline in the overall agricultural sector. The 16.2% decline in banana GDP in 1999, coupled with negligible growth in non-banana crop production and a decline in the fisheries sub-sector caused by a decrease in export earnings as a result of a fish kill, led to a negative growth of 5.7% in agricultural GDP in 1999. The positive relationship between the performance of banana industry and growth in the agriculture sector could be extended to the economy as a whole. When bananas and the agriculture sector showed positive growth in 1995 and 1998, the economy as a whole reflected robust growth, of over 5%. As shown, negative growth in banana production, not offset by high growth in the other sectors led to a slowdown of overall economic growth, leading to slow and moderate GDP growth in 1995, 1997 and 1999. An analysis of trade data provides further evidence of the importance of agriculture in the economy of St. Vincent and The Grenadines (Table 25). Table 25 shows that agricultural exports accounted for over 75% of merchandise exports for each year of the period under review. Similarly banana earnings weigh heavily in total merchandise exports – more than one third for each year of the period under review and average more than half of agriculture earnings over the same period.
Table 25: Aggregated Agriculture Exports (1994-1997)
Value and Share Indicators 1994 1995 1996 1997 1998 Total Merchandise Exports (EC$m) 148.6 143.6 139.4 124.4 134.0 Total Agriculture Exports (EC$m) 98.4 127.0 107.0 95.8 109.5 Exports banana (Tonnes) 30,933 50,013 44,802 31,273 30,944 Exports of Bananas (EC$m) 40.8 59.0 53.1 40.0 55.5 Bananas as a Per Cent of Total Exports 27.4% 41.0% 38.0% 32.2% 41.4% Bananas as a Per Cent of Agriculture Exports
66.2 88.4 56.8% 38.3% 60.7%
Source: National Statistics, CSO. Banana production in the period under review has been affected by adverse weather conditions, drought and high winds in some years, as well as periodic disease outbreaks. The uncertainty and subsequent outcome of the complaint by the United States Government to the WTO on the EU-ACP banana protocol have caused some farmers to reduce acreage and investment in banana cultivation. Banana earnings are also vulnerable to fluctuations in the exchange rates between the US and British Pound. The green market price for bananas is quoted in Pound Sterling and any fluctuation of the Pound against the US dollar, to which the Eastern Caribbean dollar is pegged, will dictate the fortunes of the banana industry. For example, in 1998, the average value of the pound was equivalent to EC$4.44. Consequently, Industry earnings from the export of 38.9 metric tonnes of bananas amounted to EC$55.5 million. This stands in marked contrast to earnings in 1996, when 44.8 metric tonnes of bananas earned EC$53.1 million. In that year the average exchange rate for the pound was EC$4.21.

St Vincent and The Grenadines
16
Fluctuations in the green market price per tonne of bananas have also impacted on banana earnings. Such fluctuations were partly as a result of the establishment of the Single European Market (SEM) in 1992 which allowed the entry of bananas into the U.K. market from other parts of Europe free of duty. This led to an influx of other cheaper bananas trans-shipped from European markets, which contributed to a deflation in the price for Windward Island bananas. This factor, coupled with quality considerations, has seen the GMP per tonne fluctuate from high of £542 per tonne in 1994 to a low of £465 and £464 in 1995 and 1996, respectively. Although its presence looms quite large, banana is not the only contributor to agriculture earning foreign exchange, as indicated in Table 26. The export of arrowroot starch has held constant over the three years for which data are available. The same is also true for eddo, dasheen and tannia. Earnings from coconuts declined significantly in 1998 mainly as a result of the cessation of operations of the lone oil factory at the end of 1997. The oil factory was also an exporter of copra and whole nuts. Plantains, exported mainly to Barbados by the Small Traffickers, declined significantly in 1997 and 1998 due to the suspension of trade with Barbados as a result of the pink mealy bug infestation.
Table 26: Selected Agriculture Exports 1996-1998
Commodity Exports, EC$ 1996 1997 1998 Arrowroot 946,515 985,597 905,047 Coconuts 909,594 1,252,050 445,573 Sweet Potatoes 2,863,069 1,288,252 191,466 Plantains 1,456,757 662,452 742,142 Eddoes 2,551,327 2,847,284 2,395,781 Dasheens 1,727,805 2,019,486 2,395,781 Yams 454,385 646,557 669,291 Tannias 388,477 417,538 379,907 Fish: fresh, chilled or frozen 2,653,918 1,600,360 1,264,998
Within recent times, the fortunes of non-banana agriculture have also experienced a significant setback. In 1997 Barbados and Antigua suspended trade in fresh agricultural produce with St. Vincent and The Grenadines because of the hibiscus Pink-Mealy Bug infestation in this country. Non-banana food crop exports were severely affected during the period of suspension, which partially explains the 11.7% decrease in agricultural exports in 1997. An outbreak of the mango seed weevil also adversely impacted mango exports, particularly to the lucrative US market. The resumption of trade with Barbados in November 1999, albeit in a limited number of commodities. There, however, continues to be an unfilled demand for arrowroot starch in the UK and the US markets. The phenomenon of the conversion of sometimes prime agricultural land into non-agricultural uses, mainly housing, has been a major constraint to the expansion in the non-traditional sub-sector in particular, and to agricultural production in general. The last agricultural census in 1985 reported 20,000 hectares of arable land in St. Vincent and The Grenadines. Policy makers

St Vincent and The Grenadines
17
now agree that the current figure will represent a significant reduction from the 1985 estimate. Undoubtedly, with less lands available for agricultural production than was the case ten or even five years ago, agricultural output will, ceteris paribus, decline. A major factor which could slow this decline is the utilisation of productivity-enhancing technologies which facilitate increased yields from intensive cultivation. POLICIES AND PROSPECTS Bananas Notwithstanding the uncertainty of continued preferential access for Windward Island Bananas given the WTO Dispute Settlement Panel ruling and the apparent difficulty in obtaining a WTO waiver for bananas in the new EU/ACP Agreement, banana industry officials are confident about future. There was a significant amount of replanting during 1999 which has had the impact of reducing production during the year, but will be reflected in increased output in the coming year. The level of imports of tissue culture plants is one indication of the scale of the replanting exercise that has occurred during the year. Over 400,000 plants were imported during 1999 as compared with 80,000 plants in 1998. The national irrigation project is expected to irrigate some 4,000 acres. To date 1,300 acres have been irrigated including 410 at Grand Sable, San Souci, Collins and Colonarie. The next phase will include some 300 acres at Richmond and several individual farms in various locations. To further support the Banana Industry, Government has recently launched the Banana Industry Trust Fund, to facilitate farmer access to funds. The Trust is supported with financing from the EU and will be operated in collaboration with the Banana Production Recovery Plan (PRP) and the Windward Islands Action Plan. The Trust will be managed by a Board of Trustees, comprised of private and public sector individuals. All of these measures and initiatives are expected to result in increased banana output, projected at 43,500 for the year 2000. The purpose of the Trust is to implement the PRP by: - encouraging, assisting and supporting the development of sound farm practices and services
in the production of banana by restoring confidence in the banana industry;
- determining the merits of requests for project support by potential beneficiaries;
- providing funding support for qualified beneficiaries; and
- providing technical assistance, information and training services to the projects of qualified beneficiaries.
Of note is the Certified Growers Programme where the criteria for eligibility is based on a certain minimum acreage and the attainment of specified quality standards. The Banana Growers Association will accept fruit only from farmers satisfying these eligibility requirements. Because of the traceability element, this programme has helped to increase the market quality rating

St Vincent and The Grenadines
18
scores for St. Vincent fruit. There is also the fair trade in banana initiatives between certain farmers and specific buyers in the market place. Non-Banana Agriculture The partial resumption of the Traffickers Trade with Barbados in late 1999 with the prospects of full trade in all commodities resuming in the latter half of 2000, together with the imminent re-opening of the Antigua market, should benefit local farmers and exporters. Private shippers have been also exploring the feasibility of shipping fresh produce on a weekly basis to other Leeward Islands. Providing that an effective solution to the mango seed weevil problem is found, then mango exports to the US market is expected to resume during the second half of 2000 and early 2001. Arrowroot The prospects for increased arrowroot production and export appear positive. The East Caribbean Group of Companies (ECGC) is helping on two fronts. Firstly, it is providing the services of its laboratories to analyse the moisture and bacteriological content of the starch to industry standards. Secondly, the Arrowroot Association and the ECGC are about to embark on a strategic alliance with a view to using arrowroot starch in the production of a number of new products. Arrowroot is a traditional crop with great earning potential because of its capacity for vertical integration. Over the planned period, attention will be given to the expansion of the industry and the modernisation of the production processes. The following activities will be undertaken to achieve this objective: - Provision of technical assistance to farmers aimed at increasing the national average
yield/acre from an estimated 8,000 to 20,000 lbs/acre;
- Expanding of the research programme of plant multiplication for distribution to farmers;
- Introduction of new varieties and validation of new techniques to enhance production efficiency and productivity;
- Expansion in acreage under cultivation from an existing 419 acres to 1,200 acres;
- Procurement of machinery for land preparation and harvesting;
- Collaboration with the French Technical Mission to solicit technical assistance to eliminate the existing processing plants and develop proposals to access financing to modernise the factories;
- Implementation of strategies to improve processes that will significantly increase starch recovery presently at 30%;
St Vincent and The Grenadines
19
- Restructuring and strengthening the administration and management of the Arrowroot Industry Association to ensure operational efficiency.
The Caribbean Development Bank is presently providing assistance to the Arrowroot Industry Association to develop a business and marketing plan and a modernisation programme with the objective of re-establishing arrowroot as a dominant crop in the agriculture of St. Vincent and The Grenadines. Root Crops and Vegetables Success at diversifying agriculture has been marginal due to the relatively attractiveness of banana production. The attractiveness of bananas is largely due to the guaranteed markets, the potential high prices offered by British supermarkets, weekly payments and availability of crop Insurance. Government is continuing efforts to provide an enabling environment to accelerate agricultural diversification. To maximise the gains from agriculture, measures will be taken to ensure: - adoption of new production technologies; - identification and exploitation of niche markets; - provision of adequate transportation; - proper institutional development; and - effective human resource development. The Government recognises the need to encourage the production of root-crops such as eddoes, dasheens, sweet potatoes, tannias and yams, as a part of its food security and diversification programme. This sub-sector was severely affected in 1997 by the Pink Mealy Bug. As a result, food crop exports have declined. Government has embarked on an Eradication Programme using biological means to control the pest. The programme has been producing positive results and expectations are that markets will be re-opened over the medium term. Based on SVG’s comparative advantage in the production of root-crops, as indicated by an ADCU Study, Government will: - identify market opportunities in the United Kingdom United States and within CARICOM; - increase acreage under cultivation; - collaborate with regional and international agencies to develop treatments and other
protection against pests and diseases. Fruit and vegetable production will be encouraged mainly to facilitate import substitution, food security and nutritional sustenance. The Ministry of Agriculture is expected to work closely with the Taiwanese Mission and CARDI in the transfer of appropriate productivity-enhancing technologies for vegetable production to farmers. Livestock Livestock production activities possess great potential for food security and poverty reduction. Over medium term, efforts will be made to continue the integration of livestock into the crop farming system. In this regard, small ruminant production will be afforded special attention and

St Vincent and The Grenadines
20
the multiplication centres will be used to produce pedigree animals for distribution to small farmers. Forestry Under the Forestry Development and Conservation Programme the Government will take measures to: - ensure that 35% of the total land area remain under natural forest; - complete the demarcation and gazetting of forest reserves to prevent further deforestation; - implement a re-afforestation programme to recover depleted forest lands and to prevent
indiscriminate farming on steep slopes; - establish nurseries to supply tree for research and commercial operations. Fisheries The fisheries sub-sector has an important role to play in the agricultural diversification process. Efforts would be made to increase the fishing sub-sector’s contribution to GDP for the planned period. Measures to be undertaken include: - construction of fishing centres in rural areas; and - conservation and management of in-shore species through programmes of education,
legislation and surveillance of in shore fishing activities. Land Reform The Mt. Wynne/Peters Hope project, now in its implementation phase, aims to provide about seventy leasehold farmers with land for farming. The Project is the final phase of Government’s land reform programme which over the last ten years distributed over ten thousand (10,000) acres of plantation land to farmers in lots of 2 – 5 acres each. A wide range of non-banana agricultural activity will be carried out. It is anticipated that this project will create substantial linkages between the agriculture and tourism sectors. MANUFACTURING From the heyday during the 1970s and 1980s, the manufacturing sector has declined to a mere shadow of its former self. During those two decades, manufacturing enterprises were attracted to St. Vincent and The Grenadines through the offer of incentives such as duty free importation of raw material, generous tax holidays, repatriation of profits and low labour rates. Expansion in the manufacturing sector is driven by the Fiscal Incentives Act No.5 of 1982, in which the calculation of the local value added determines the fiscal incentives granted. The formula by which local value added is determined is as follows:
LVA = V(100- W )*100 Where V = value added as a percentage of total sales of the approved product.
W = wages and salaries paid to nationals expressed as a percentage of total of the approved products.
St Vincent and The Grenadines
21
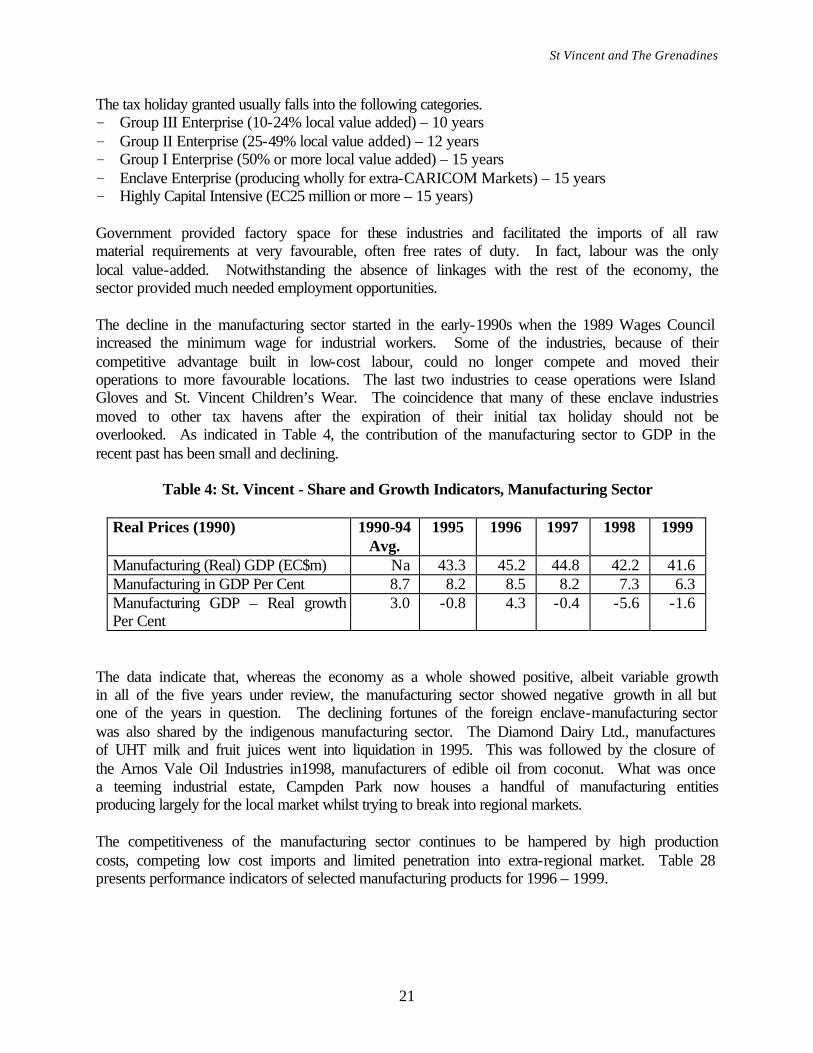
The tax holiday granted usually falls into the following categories. - Group III Enterprise (10-24% local value added) – 10 years - Group II Enterprise (25-49% local value added) – 12 years - Group I Enterprise (50% or more local value added) – 15 years - Enclave Enterprise (producing wholly for extra-CARICOM Markets) – 15 years - Highly Capital Intensive (EC25 million or more – 15 years) Government provided factory space for these industries and facilitated the imports of all raw material requirements at very favourable, often free rates of duty. In fact, labour was the only local value-added. Notwithstanding the absence of linkages with the rest of the economy, the sector provided much needed employment opportunities. The decline in the manufacturing sector started in the early-1990s when the 1989 Wages Council increased the minimum wage for industrial workers. Some of the industries, because of their competitive advantage built in low-cost labour, could no longer compete and moved their operations to more favourable locations. The last two industries to cease operations were Island Gloves and St. Vincent Children’s Wear. The coincidence that many of these enclave industries moved to other tax havens after the expiration of their initial tax holiday should not be overlooked. As indicated in Table 4, the contribution of the manufacturing sector to GDP in the recent past has been small and declining.
Table 4: St. Vincent - Share and Growth Indicators, Manufacturing Sector
Real Prices (1990) 1990-94 Avg.
1995 1996 1997 1998 1999
Manufacturing (Real) GDP (EC$m) Na 43.3 45.2 44.8 42.2 41.6 Manufacturing in GDP Per Cent 8.7 8.2 8.5 8.2 7.3 6.3 Manufacturing GDP – Real growth Per Cent
3.0 -0.8 4.3 -0.4 -5.6 -1.6
The data indicate that, whereas the economy as a whole showed positive, albeit variable growth in all of the five years under review, the manufacturing sector showed negative growth in all but one of the years in question. The declining fortunes of the foreign enclave-manufacturing sector was also shared by the indigenous manufacturing sector. The Diamond Dairy Ltd., manufactures of UHT milk and fruit juices went into liquidation in 1995. This was followed by the closure of the Arnos Vale Oil Industries in1998, manufacturers of edible oil from coconut. What was once a teeming industrial estate, Campden Park now houses a handful of manufacturing entities producing largely for the local market whilst trying to break into regional markets. The competitiveness of the manufacturing sector continues to be hampered by high production costs, competing low cost imports and limited penetration into extra-regional market. Table 28 presents performance indicators of selected manufacturing products for 1996 – 1999.

St Vincent and The Grenadines
22
Table 5: Selected Manufacturing Exports, 1996 – 1999(EC’000)
Industry: 1996 1997 1998 Jan –June 1999
Rice 14,522 16,046 17,185 8,193 Beer 351 542 518 281 Flour 17,144 20,619 18,580 10,141 Animal Feeds 3,414 4,631 3,724 1,896 Galvanise Sheets 3,924 3,872 3,409 1,587 Stoves 573 480 551 208 Cardboard Cartons 1,537 1,855 2,241 1,239 Electronic Equipment 756 891 1,068 456 Clothing 2,453 994 986 398
The data show that approximately two-thirds of major manufacturers are by-products of rice, flour and animal feeds, produced by one company, the East Caribbean Group of Companies (ECGC). The local brewery appears to have made little inroads in penetrating the export market, whilst the export of garments has dropped significantly from 1996. CONSTRAINTS TO THE DEVELOPMENT OF MANUFACTURING The manufacturing sector in St. Vincent and The Grenadines operates under several constraints. These include: Finance: Although large firms have access to foreign finance or can attract local financing quite easily, indigenous firms face great difficulties in accessing finance. The commercial banks have a penchant for short term less risky lending and hence lend more for mercantile activities, rather than for manufacturing and agriculture. The percentage of loans to the personal and distributive sectors account for more than 60% of loans outstanding while the manufacturing sector receives less than 10%. Moreover indigenous firms do not have the requisite expertise in the conceptualisation of projects and presenting them to commercial banks as projects for financing. Neither do the commercial banks have the expertise to assist in this type of activity. In addition, the high cost of finance in the face of high price elasticities of consumer demand, intense competition in the regional market, excess production capacity, primitive technology, deficient technical skills, unreliable transport and quality of raw materials all constrain the development of the sector. Technology and technical skills are two other sources of concern. The rapid pace of technological development worldwide hastens the obsolescence of capital and erodes the competitiveness of less technologically dynamic countries. The high cost of upgrading capital and the inadequacy of technical capability to speed up the transfer and diffusion of technology retards the export competitiveness of the firms. Hence their inability to penetrate extra-regional markets and even its ability to hold on to domestic markets. The paucity of technical training results in wastage of raw materials, inadequate maintenance leading to loss of production during

St Vincent and The Grenadines
23
down times, and the need for foreign technical assistance to diagnose and solve some very simple problems. High labour costs. St. Vincent and The Grenadines is by no means a low wage area. The boom in prices of traditional agricultural exports during the 1980s pushed up the price of agricultural and had a demonstration effect on the other sectors. Thus the type of manufacturing sector which emerges in the post liberalisation period must take this as a given. Moreover higher remuneration in the tourism sector has tended attract workers away from manufacturing. Inadequate transportation links. The paucity and reliability of transportation links is another constraining factor. Sea transport is not only scarce but sometimes unreliably. In addition, the cost of sea transport is not significantly lower than air transport which is usually more reliable. However, due to insufficient air access into St. Vincent and The Grenadines, the country has not attracted quite as many firms in the enclave sector. Even the countries with superior air access suffer from a shortage of dedicated air cargo space. The size of firms and local market. As mentioned earlier, most of the manufacturing firms in the country employ less than 20 employees. This limits the ability of the firms to reap economies of scale and spread overheads. Moreover the majority of indigenous firms are contented to produce for protected local markets which are extremely small. The markets are protected by the CARICOM CET and in some cases by Article 56 of the CARICOM treaty1. The regulatory framework for businesses. The regulatory and legal framework in which business operate may have impeded the development of the manufacturing sector. The process by which projects are approved is too long and circuitous. In addition, there is the perception that the process favours foreign investment over local investment. Some regulations and legal requirement tend to impede the flexibility of the firms. The effects of protection. The protection accorded by the CET along with an incentive regime which treats production for the local market and production for export in the same way create an anti-export bias. There is no incentive to produce for the more competitive, more risky export market, while production for the protected local market is quite profitable. The reduction in the CET would tend to redress this bias to some extent but specific incentives have to be put in place to encourage production for export. However the regime of quantitative restrictions is being considered for phasing out via a process of tariffication which would initially increase the import duty. The method of calculation of the local value in the Fiscal Incentives Act No.5 of 1982 is disadvantageous to the local investor who cannot muster investments large enough to qualify for the tax holidays. Consequently, many relatively small local investors were completely omitted from considerations for the provision of fiscal incentives. There was therefore the need to develop a package of incentives specifically tailored to the meet the needs of the small-scale local investor. In this regard, a programme to exempt local manufacturers from the payment of
1 Article 56 allows the less developed CARICOM countries to impose quantitative restrictions and suspend origin treatment for goods of the more developed countries in an effort to develop the manufacturing sector in the less developed countries.

St Vincent and The Grenadines
24
consumption tax on imported raw material has recently been developed. The fledgling local manufacturing sector is concentrated mainly on cottage type food processing and furniture manufacturing industries. Fiscal charges. The size of the country and the inadequacy of transportation links already impose severe disadvantages on the countries in terms of their ability to compete internationally. Thus it is essential that no inordinate charges are imposed to prevent the firms from sourcing their inputs at international prices. Additional charges like high port charges impose further restrictions the ability of the firms to compete internationally. The consumption tax on inputs which is not rebated on export goods creates a disadvantage for Vincentian firms vis-à-vis their CARICOM counterparts whose exports are zero-rated under the VAT. Non-tariff barriers in export markets. The existence of non-tariff barriers in the export markets especially the USA has tended to impede the growth of manufacturing exports. Vincentian exports face a myriad of regulations, which only experience in the market can help to get around. Many firms are seeking ISO and other international certification to facilitate entry into international markets. Although the greater transparency under the new WTO rules may have reduced the uncertainty of entry, many indigenous firms may be unable to finance the cost of the barrage of legal challenges that they may face in these markets. Knowledge of export markets. The paucity of knowledge about export markets is another significant obstacle to export development. Basic information regarding the structure of markets, changes in taste, import regulations in the foreign country, appropriate technology, new processes, new products and potential competitors has to be assembled. Market intelligence is a costly exercise for the individual producer and there are also externalities associated with this activity. This suggests the need for co-ordinated action at the OECS level. The activities of Export Development and Agricultural Diversification Unit (EDADU) are aimed at reducing some of these difficulties, but the organisation remains largely under-funded and suffers from a lack of clear commitment and strategic focus. In addition tapping into international producer and market information networks would reduce significantly the cost of gathering market intelligence. POLICIES AND PROSPECTS St. Vincent and The Grenadines, in preparing for global market competition in the context of non-preferential arrangements, must expedite the adjustment process in order to ensure that the manufacturing sector experiences long-run sustainability. Consequently, the Government policy for the sector over the medium-term is to create the environment, which facilitates the increase in output and employment in manufacturing activities. The objective is to develop a dynamic sector, primarily by promoting the development of small manufacturing and agro-based enterprises; revising the fiscal incentives programme; providing credit for small businesses; and by implementing a more systematic monitoring of policy instruments. Key strategies to be undertaken by the Government regarding the development of the manufacturing sector include:

St Vincent and The Grenadines
25
- strengthening the capability of local agencies to facilitate small business development (the National Development Foundation will provide financial and technical assistance);
- increasing collaboration with the private sector in developing and implementing training programmes;
- establishing a small business development unit to provide technical support to the private sector;
- improving port facilities and streamlining of operational procedures in order to reduce the cost of business operations;
- providing export credit guarantee facilities for business;
- establishing a National Development Bank to provide easier access to affordable credit; and
- establishing a Standards Bureau to enhance product development and internationally accepted standards.
TOURISM Primary merchandise exports have been dominated by the exports of agricultural crops. The lack of an international airport has constrained the expansion in room capacity and the level of stay-over visitor arrivals. Consequently, the service penetration index indicates the dominance of merchandise exports. This index has increased from 0.53 over 1986-89 to 0.83 during 1990-94 and finally to 1.8 by 1995-98. Stay-over visitor arrivals grew by 10.1% to 45,910 during 1986-89. During this review period, cruise ship passenger arrivals also increased by 14.8% to 54,060. The strong performance in visitor arrivals contributed to a 13.2% growth in visitor expenditure to $69.4m. By 1990-94, growth in stay-over visitor arrivals slowed to 2.0% (54,068). The impact of a world recession impacted the performance of this category of visitor. In contrast cruise ship passengers sustained their growth at 10.7% to 73,967. Despite the slower growth in total visitor arrivals visitor expenditure grew by 11.2% to $87.4m. During 1995-98 there was a recovery in stay-over visitor arrivals. This category of visitor grew by 5.3% to 62,626. In contrast, cruise ship passengers declined by 12.1% to 53,418. The expansion of hotel room capacity in the previous period and related marketing and promotion contributed to a stronger performance in stay-over visitor arrivals. The tourism product evolved around marketing the mainland for business travellers and The Grenadines for the upscale market of high net worth individuals. The fragility of the natural resources on the micro Grenadine islands has forced cruise ship berthing to be concentrated on the mainland. The Caribbean market is the major source of stay-over visitors to the mainland. During 1986-89 this market accounted for 39.2% of visitors, declined to 35.7% during 1990-94 and declined further to 33.1% by 1995-98. With the increasing importance of The Grenadines as upmarket

St Vincent and The Grenadines
26
resorts visitors from the USA which have ranked second across all periods have gradually increased their market share at the expense of the Caribbean. Visitors from the UK which have ranked third in importance have also increased their market share at the expense of the Caribbean and Canada. CONTRIBUTION TO GDP The tourism industry in its narrowest definition using value added in the hotel and restaurants sector have ranged between 2-3% of real GDP in its relative contribution. Real growth in the sector has however declined over time from a period of strong growth in the 1980s (9.6%) to 2.4% by the end of the review period. This trend reflects the binding constraint of airlift capacity due to the lack of an international airport despite catering for high net worth individuals in The Grenadines. Other constraints faced by the industry include lack of product definition the mainly with its black sand beaches is clearly not a sun and sea destination, value for money in hotels on the mainland and the absence of sufficient room capacity. ROLE OF FOREIGN DIRECT INVESTMENT Foreign direct investment played an increasing role over time with the increased investment in upmarket resorts in The Grenadines FDI inflows rose from 5.1% of GDP during 1986-89 to 9.5% in 1990-94 and rose to a further 11.6% by 1995-98. The equity component of FDI fell from 26.3% in 1986-98 to 4.6% during 1990-94 but rose to 33.5%. The increase in equity share reflects the expansion in resort construction in The Grenadines during 1995-98. The share of land sales in FDI have declined from a high of 43.8% during 1986-89 to 17.8% during 1990-94. However by 1995-98 this share rose to 24.5% due to FDI investments in hotel construction and residential construction by Vincentians living abroad. CONSTRUCTION RECENT ECONOMIC DEVELOPMENTS Construction sector activity reflects developments in the business cycle particularly that related to the export of primary commodities, FDI and public sector investment. The terms of trade has been highly volatile over time and appears to be reflected in the variability of growth in this sector. The sector contributed 9.3% of real GDP during 1986-89. Real GDP growth during this period was 9.7%. Major construction projects during this review period included the Cumberland Hydroelectric project, the Finance Complex and feeder roads. The relative contribution of the sector rose to approximately 10.0% during 1990-94. Growth in the sector slowed to approximately 6.0% as a number of large public sector investment projects were completed. During this review period the Bequia and Union Island airports were constructed. Other public sector projects included the North Leeward Highway and Feeder

St Vincent and The Grenadines
27
Roads IV. Credit for mortgage financing also moderated during this review period and would have impacted on the degree of residential construction. The construction sector further increased its relative contribution to 10.4% by 1995-98. Real GDP growth in the sector rose to 6.3%. In the public sector the major projects during this period were the construction of the ‘A’ Level College, the Canouan Airport and the Campden Park Container Port project. The construction of the first phase of a luxury resort on Canaouan and the commencement of second phase were the main private sector projects. TRANSPORTATION The transportation sector has emerged as one of the larger service sectors in the economy. It is closely integrated with the tourism sector and the export of agricultural produce to the neighbouring islands. Trucking services in the export of bananas play an important role in the value added in this sector. During 1986-89 the relative contribution was 12.9% of real GDP. Real growth of 7.4% reflected favourable terms of trade for primary exports and developments in the tourism industry. The sector maintained its relative share during 1990-94 at 13.0% while real GDP growth slowed to 3.2%. This performance also reflected the deterioration in the terms of trade and moderate growth in tourism. An improved growth performance of 6.8% was recorded during 1995-98. Meanwhile the relative contribution of the sector to real GDP rose to 13.4%. COMMUNICATIONS The communications sector in the absence of a vibrant tourism sector is by far the most important source of FDI inflows into the territory. This sector’s relative contribution to real GDP has increased from 5.6% in 1986-89 to 9.7% during 1995-98. Real GDP growth was highest during the 1986-89 period with substantial investment in telecommunications infrastructure. Given, the increasing role of reinvested earnings over time real GDP growth was sustained in the 1990’s averaging 7.1% and 8.9% over 1990-94 and 1995-98 respectively. The liberalisation of basic telecommunications under the General Agreement on Trade in Services (GATS) signed in 1997 has unleashed a wave of competitive pressures which has resulted in a spate or international mergers, as formerly protected national telecommunications companies scramble to position themselves to be players in the global market. No doubt this development has forced the monopoly provider of telecommunications services in the Organisation of Eastern Caribbean States (OECS) countries to soften its stance and agree to

St Vincent and The Grenadines
28
renegotiate its contract with five of the independent OECS countries2. Many of these contracts date well into the new millennium. At the same time, technological advances in the telecommunications industry is threatening to create a glut of bandwidth internationally that would force the price of telecommunications services to near zero levels. These advances are taking place at all three critical points in telecommunications networks, i.e., international/long distance carrying capacity, switching gear and the local loop. Cost reduction in the local loop is critical for 75.0 to 80.0% of the cost of a call consists of the cost of the link in the last couple of miles. About two thirds of the assets of telephone companies is invested in this segment hence making them a candidate for natural monopolies. The telecommunications reform occasioned by the re-negotiation of the licenses and continued advances in technology will usher in major changes in the industry for which the country needs to be prepared. RECENT PERFORMANCE Telecommunications is already the fastest growing area in St. Vincent and The Grenadines and its increased contribution to GDP has largely offset the decline in the contribution of agriculture in recent years. For the OECS as a whole, over the period 1977 to 1998, the contribution of agriculture to GDP declined from 19.8% to 8.5% while the contribution of communications have grown from 2.1% to 9.7%. Hence any price stimulus that increases demand and hence the equilibrium quantity of telecom services would be adding to an already dynamic leading sector. In examining the effect which the reform process would have on the GDP for the OECS, it is important to recognise the role which telecommunications play in economic development. In doing so, it is imperative that one examines the sector’s contribution to GDP over a given period of time. Over the period 1977 to 1998, the percentage contribution of the communications sector in the OECS (of which telecommunications is the largest sub-sector) ranged from 2.8% at the beginning of the period to 9.6% at the end of the period. Over the years, the sector’s contribution to GDP has been growing at a steady rate, largely reflecting the impact of an improved telecommunications sector. The liberalisation of the sector is expected to lead to a reduction in the cost of telecommunications services, thereby fostering an improvement in the linkages between other vital sectors in the economy
St. Vincent and The Grenadines like the other OECS countries which have a comparative advantage in the provision of services. The information infrastructure is the pillar on which many of these services are delivered. Therefore, the fall in the cost of international and regional communications which liberalisation of the telecommunications sector is expected to achieve, will in fact increase the potential for trade in services and consequently improve the regions value of services produced.
2 Five of the independent OECS countries are involved in a World Bank financed project to reform the telecommunications industry. The five countries are Dominica, Grenada, St Kitts-Nevis, St Lucia and St Vincent and The Grenadines.

St Vincent and The Grenadines
29
As was mentioned earlier, expansion in areas such as the informatics industry would have a positive impact on the regions Gross Domestic Product. The major issues affecting the telecommunications sector are regional in scope and are discussed in the OECS Overview to this study. FINANCIAL SERVICES OFFSHORE FINANCIAL SERVICES The term Offshore Financial Services refers to a variety of activities which take place between corporations registered in a country with residents in the rest of the world with little interaction with domestic residents. It is rather limiting for offshore financial services does not accurately describe the range of activities undertaken in these centres and may also limit the scope of opportunities considered when one is trying to visualise the future development of the industry. A more accurate descriptor would be International Business Facilitation Centres. Not only does this nomenclature cover the wide range of services provided by the offshore sector, it also makes for a much neater classification of the activities and would ultimately assists in resolving some of the ticklish regulatory issues, since different types of activities do not necessarily need the same level of regulation. The offshore sector was developed to provide services which are normally provided in the domestic economy at lower cost or under a less demanding regulatory environment. Thus, all of the activities which take place in the offshore sector have counterparts in the domestic economy and it is quite natural that any such classification would be equally applicable to the offshore sector. The International Monetary Fund along with the other international institutions has recently revised its classification of financial institutions and this framework can be useful in the development a taxonomy of International Business Facilitation Services (IBFS). The IMF Classification divides corporations/enterprises into five mutually exclusive sectors, Households, General Government, Financial Corporations, Non-financial corporations and non-profit institutions. IBFS are concerned with Financial Corporations and Non-financial Corporations and the bulk of the activity is concerned with the former. The offshore Services Sector in the OECS territories is currently at varying stages of development ranging from Antigua and Barbuda which is the most established, dating back to 1982 and St. Lucia where the legislation was passed in 1999 (see appendix I). The oldest offshore centre is St. Vincent and The Grenadines which had offshore banking and ship registry legislation enacted in 1976. However the activities, promoted by the St. Vincent Trust Authority Limited based in Liechtenstein have not really taken off. The legislation was modernised in 1996 to give the sector anew lease on life. The most dynamic centres are Nevis and Anguilla which have recently passed modern legislation which have created fiscal consumer products which are on the leading edge of the industry.

St Vincent and The Grenadines
30
The legislation of most of the OECS countries is patterned on that of the British Virgin Islands which is reputed to be one of the most successful emerging offshore financial services centres. The sector is usually exempt from all forms of corporation taxes in the jurisdiction of incorporation. These include income taxes, corporate taxes, capital gains taxes, inheritance taxes, withholding tax, other indirect taxes levied on international business activity. Offshore activities are also exempt from indirect taxes such as stamp duties and customs duties. Government revenue from these activities is generated by modest licence fees. Several opportunities exist for the countries in the ECCB jurisdiction to develop offshore financial centres. The opportunities can be discussed under seven broad categories: Tax Advantages - Individuals of high net worth and multinational corporations are attracted to offshore jurisdictions because of the many tax advantages they offer. These jurisdictions offer legitimate deferment, reduction or avoidance of taxes on certain profits earned abroad. Most of the OECS countries have chosen to be no tax jurisdictions. This factor makes them attractive to external investors as possible tax havens. However, this non-tax situation may make these offshore jurisdictions reluctant to enter into bilateral double taxation agreements with other nations because the initial benefits are not always apparent. These bilateral agreements do however have certain distinct advantages for the developing financial services provider jurisdictions. Some of the benefits may be that the home country provides the developing host offshore jurisdiction with avenues for resolving disputes, procedures for exchanging information regarding drug abuse and other illegal activities, favourable tax treatments for residents or companies organised under signatory laws. Product Development - Offshore financial product and laws can be viewed as fiscal consumer goods. The range of legal products offered can be as broad as the jurisdiction so desires and spans the fields of banking, brokerage and other "traditional" financial services, immigration and nationality, manufacturing and general law services. Emerging jurisdictions are advised that the more readable, and understandable the laws, the more saleable is the jurisdiction. Putting the appropriate legislation in place is a therefore a necessary, albeit not sufficient, condition for the development of the offshore sector. Jurisdictions have to be vigilant to ensure that their legal products always remain on the leading edge of the industry. Niche Positioning - Since it may not be possible or advisable for an emerging centre to simultaneously develop the full range of financial services to the same degree, countries should seek to develop niches and therefore position themselves and gain an international advantage. In the development of a niche profile countries should seek to render quick, efficient and professional service, and be innovative in meeting the needs of a niche clientele in a changing and dynamic environment. It is advisable for emerging centres to develop niches and to seek to gain an international advantage in a particular segment of the market. This strategy may, however, prove difficult to pursue given that other more established and resourceful jurisdictions are competing to diversify into new and different products. Marketing and Promotion - A continuous marketing and public relations programme is necessary to support the legislation in place.
St Vincent and The Grenadines
31
Private-public Sector Co-operation - Other successful Caribbean jurisdictions have identified the need to have co-operation between the private sector professionals and government officials. Communications Technology - Private banking and other financial services increasing utilise high technology communications systems and electronic payments systems, which offer opportunities for emerging centres to compete globally. Moreover an offshore jurisdiction cannot compete effectively if it does not offer twenty-four hour online searches and registration. Supervisory and Regulatory System - Those jurisdictions with effective systems for supervision are increasingly the choice of reputable institutions and individuals. The threats of money laundering and other illegal activities require that countries put in place a competent and efficient regulatory system. Among the major challenges facing the offshore industry in the OECS are the following: Limited Professional Expertise - To attract desirable investors OECS countries must have in place an infrastructure accompanied by highly trained professional accountants, bankers, taxation specialists and legal experts. Telecommunications and Air Transportation - The cost of telecommunication service in the region is generally regarded as high and in some cases prohibitive. The irregularity or unavailability of international flights also inhibits efficient travel services. Regulation and Supervision - Unregulated or inadequately regulated financial services centres pose a threat to global financial stability. Hence the need for new regulatory standards for their operation. The new regulatory standards will constrain growth of new centres due to increased financial and human resources requirements. At the same time the need for a good reputation should ensure that laxity in regulation frameworks is not encouraged. Financial Liberalisation in Developed Markets - In the 1980's many of the regulations which encouraged institutions to move offshore were dismantled as developed countries have liberalised and deregulated their economies. New threats are always emerging from the anti-tax haven posture of the U.S Government and new laws are being continuously passed which serve to restrict the development of offshore centres. The recent threat by the OECD countries on harmful tax competition follows in this same vein. Such challenges are likely to increase in the future. It is therefore incumbent on newly- emerging offshore centre like the OECS countries to maintain the highest standard of regulation and propriety. In spite of these constraints the offshore sector provides significant opportunities for economic diversification. The global offshore sector is growing at a rapid pace propelled by the growth in the World?economic wealth. Countries embarking on this path however need to remain cognisant of the many responsibilities they face to uphold the integrity of the financial system.

St Vincent and The Grenadines
32
OFFSHORE FINANCIAL SERVICES IN ST. VINCENT Offshore financial services in St. Vincent and The Grenadines dates back to 1976 but has only been emphasised since 1993-94 consequent on the difficulties with the banana industry. Hence the sector is seen as part of the efforts at economic diversification. In establishing the country as an emerging offshore destination the authorities looked at the legislation around the world and try to put in place modern flexible legislation. Six acts were passed in 1996 to deal with the various products offered. These include offshore banks, insurance, trusts, IBCs and Limited Liability Companies. An Offshore Financial Services Authority was established with exclusive rights monitor, control, market and regulate offshore activity. This variety of function can lead to conflict of interest especially in the areas of promotion and regulation. There has been phenomenal growth in the offshore sector in St. Vincent and The Grenadines since the passage of the legislation in 1996. At the end of 1999 there were over 8 thousand companies registered in St. Vincent and The Grenadines. There were 747 offshore trusts, 26 banks and 30 Registered Agents. It is estimated that the sector contributed over EC$ 30 million to the economy. The sector is moving towards improving the services offered by providing 24 hour on-line registration. St. Vincent and The Grenadines has emerged as market leader in the registration of shipping trademarks. The creation of this niche market within the financial services industry can provide an alternative vehicle for the development of this sector other than through International Business Companies. The offshore sector contributes to the economy in a variety of ways. The most direct contribution is to government revenue in the form of fees, licenses and taxes. Table 6 Gives government revenue from the offshore financial services sector. It shows that revenue grew from $1.5m in 1996 to almost $4m in 2000. Most of the financial services are intermediated through Registered Agents (usually a local law firm), which provides a second source of revenue and foreign exchange earning to the country. Some employment is created but this is minimal. Some institutions are required to maintain a physical presence in the country and the rents and expenditure by the expatriate workers are additional sources of foreign receipts. In recent months the Authorities in St. Vincent and The Grenadines have made several steps to reform the operations of the offshore sector to accord with international best practice. The legislation has been amended to strengthen the anti-money laundering provisions and a number of banks have been de-registered. The sector has some potential to contribute to the diversification of the economy if the threats discussed earlier can be addressed.
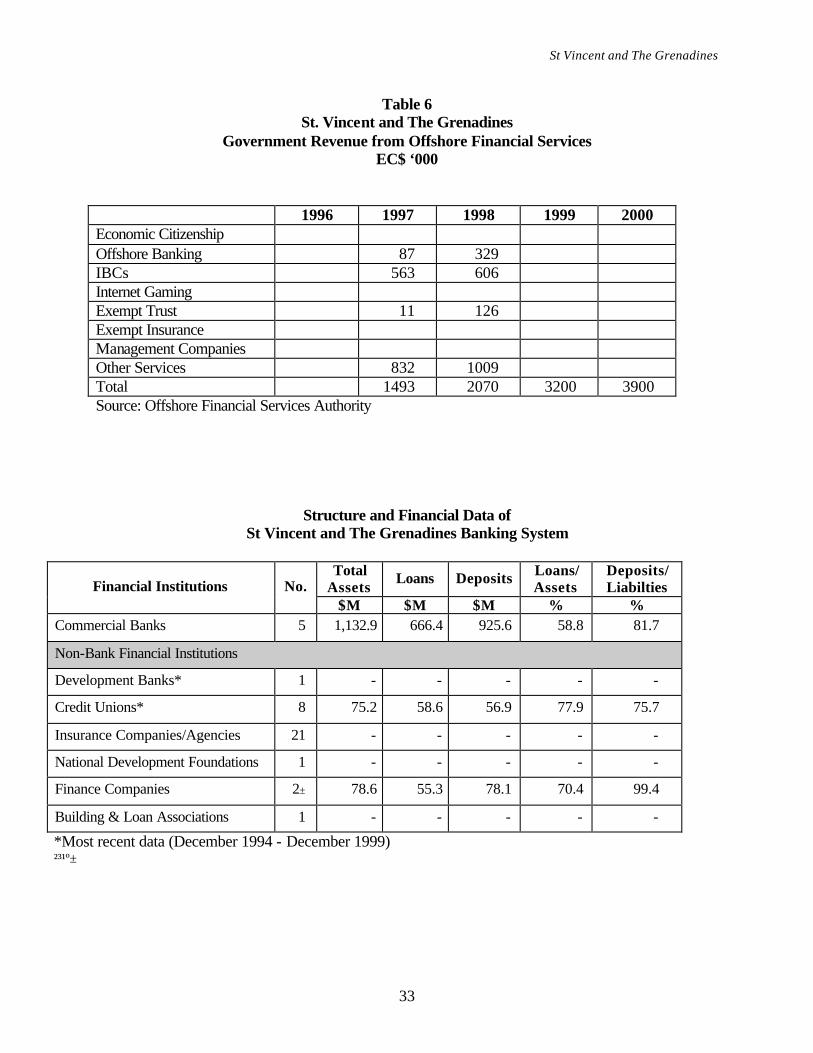
St Vincent and The Grenadines
33
Table 6 St. Vincent and The Grenadines
Government Revenue from Offshore Financial Services EC$ ‘000
1996 1997 1998 1999 2000 Economic Citizenship Offshore Banking 87 329 IBCs 563 606 Internet Gaming Exempt Trust 11 126 Exempt Insurance Management Companies Other Services 832 1009 Total 1493 2070 3200 3900 Source: Offshore Financial Services Authority
Structure and Financial Data of St Vincent and The Grenadines Banking System
Total
Assets Loans Deposits Loans/ Assets
Deposits/ Liabilties Financial Institutions No.
$M $M $M % % Commercial Banks 5 1,132.9 666.4 925.6 58.8 81.7
Non-Bank Financial Institutions
Development Banks* 1 - - - - -
Credit Unions* 8 75.2 58.6 56.9 77.9 75.7
Insurance Companies/Agencies 21 - - - - -
National Development Foundations 1 - - - - -
Finance Companies 2± 78.6 55.3 78.1 70.4 99.4
Building & Loan Associations 1 - - - - -
*Most recent data (December 1994 - December 1999) ²³¹º±

St Vincent and The Grenadines
34
Offshore Companies
Type of Institution Number Banks 26 Insurance 6 Trusts 747 IBC's 8000 Exempt Companies - Internet Gaming - Economic Citizens - Registered Agents 30 Limited Liability Companies -
DOMESTIC FINANCIAL SERVICES Total assets of the banking system grew by 14.1% to $363.2m during 1986-89. Loans accounted for 55.7% of total assets. Growth in assets declined to 7.4% to $548.0m as the terms of trade deteriorated and overall economic activity slowed during 1990-94. However by 1995-98 there was an increase in banking sector assets by 9.7% to $768.2m. Loans increased its relative share in total assets to 66.8% with increased inflows of FDI into the territory. During 1986-89 domestic credit grew on average by 5.4%. Of all the sectors the private sector experienced the highest growth in credit at 15.7%. The other public sector and non-bank financial institutions were net lenders to the banking system. Credit growth to Central Government averaged 28.8% due to exceptional financing needs in 1986. Domestic credit grew faster during 1990-94 with that to the private sector rising by 8.6%. Both the other public sector and the non-bank financial institutions continued to be net lenders of the banking system. The surpluses of the former sector in addition to those generated by Central Government enhanced the savings position of the public sector. As a result of the generation of sizeable current account surpluses credit growth to Central Government averaged 3.0%. Growth in domestic credit accelerated to an average 11.8% during 1995-98 with that to the private sector increasing by 14.4%. The buoyancy in credit growth arose from favourable expectations about the general economy with the increased inflows of FDI and the rehabilitation of the banana industry. Growth in monetary liabilities was a robust 12.8% during 1986-89. This growth moderated to 8.7% during 1990-94 but rose to 10.6% in the 1995-98 period. Liquidity in the banking system has always been high because of the general faster growth in M2 relative to domestic credit. Consequently, St. Vincent and The Grenadines have consistently accumulated net foreign assets. These reserves have tended to be not very variable relative to other members of the monetary union.

St Vincent and The Grenadines
35
TRADE LIBERALIZATION St. Vincent and The Grenadines is simultaneously taking part in a number processes of trade liberalisation. The first results from the deepening of the CARICOM Integration movement which has resulted in a phased reduction of the CET. At the same time the country is participating in a number of international negotiations which would lead to freer trade. These include the FTAA, the post Lomé IV, the millennium round of the WTO and a number of CARICOM sponsored trade liberalisation negotiations. STATUS OF CET As part of the regional integration movement and towards the structural adjustment of the economies of the CARICOM countries, a common external tariff was adopted for implementation in 1991. The tariff was later reviewed in the light of developments in the international economic environment with greater emphasis on trade liberalisation and competitiveness as well as the formulation and expansion of regional economic groupings. A number of factors were taken into account in formulating the policies for the new tariff structures: • differences in the levels of development of member states; • differences in their industrial structures; • their respective exchange rate regimes; • the nature of their fiscal regimes; • their respective administrative capabilities.
These factors determined the principles guiding the design of the new tariff:
i. international competitiveness;
ii. efficient production for the regional market;
iii. the preservation of government revenues;
iv. controlling inflation so as not to increase the price of basic foods and social services;
v. duty exemptions regime should be reduced/removed so as to foster uniform treatment of production inputs across the common market;
vi. there should be uniform rates for the same items notwithstanding their economic use;
vii. the special needs of the LDCs should be taken into account;
viii. the tariff structure should be simplified with fewer rate bands with less room for discretionary application.

St Vincent and The Grenadines
36
The phasing of implementation of the new common external tariff for the OECS was as follows:
January – June. 1993 0 – 5% to 30/35% January – June, 1995 0 – 5% to 25/30% January – June, 1997 0 – 5% to 20/25% January – June, 1998 0 – 5% to 20%
St. Vincent and The Grenadines has completed the implementation of the CET. All four phases were carried out as follows: Ø Phase I 1993 Ø Phase I 1996 Ø Phase III 1997 Ø Phase IV 1998
None of the phases involved significant losses of revenue and no major adjustments to the tax structure was necessary. The experience of Phase II at which compensatory measures were taken to replace revenue lost (the customs service charge was increased from 2.0% to 2.5% ) showed that demand elasticity and a minor shift towards third country imports were sufficient to maintain revenues at current levels. Consequently no compensatory measures were applied in 1997 when Phase III was implemented. The final phase required minor adjustment to the consumption tax. St. Vincent and The Grenadines still maintain a licensing system and has not addressed the issue of tariffication. This issue will be considered after the proposed OECS study is complete. TRADE AND REVENUE EFFECTS OF THE CET The following simulations were undertaken to determine the impact of varying the rates of the CET on the agricultural sector. The Common External Tariff (CET) represents an attempt by CARICOM countries to promote industrialisation in the region and to harmonise their trade policies as a first step in meeting the challenges of global competition and trade liberalisation. The CET proposes that all CARICOM members should apply common tariffs on imports from non-CARICOM countries. Starting in 1993, the CET was to be implemented in four phases. By the end of the last phase, which was adopted for implementation by1998, all CARICOM countries should have the following CET rates (on non-CARICOM imports) in place: (1) a 0-5% import tariff on non-competing, primary, intermediate, and capital inputs; (2) a 10% tariff on competing primary inputs and capital goods; (3) a 15% tariff on competing intermediate inputs; (4) a 20% tariff on non-competing final goods; and (5) a 20% tariff on garments, general manufactures and agro-industry commodities. For most CARICOM countries to meet the requirements of the CET, they would need to decrease import tariffs on some items and increase it on others. Declines in imports arising from tariff rate increases may suggest the extent to which CARICOM production is being substituted for non-CARICOM imports. On the other

St Vincent and The Grenadines
37
hand, tariff rate decreases imply loss of tariff revenues that member countries may need to make up for by increasing non-CET import taxes. This study analyses the effect of changes in CET rates on OECS tariff revenues, and non-CARICOM agricultural imports. OECS imports were grouped in accordance with seven CET rate brackets: 0%, 0-5%, 5-10%, 10-20%, 20-30%, 30-45%, and >45%. The Analysis will help OECS policy planners to anticipate, in the presence of CET rate changes, the extent to which CARICOM production would substitute for non-CARICOM imports, and the amount by which non-CET import taxes would have to rise to keep net import tax revenues unchanged. To conduct the analysis, the study employed a simulation exercise in which the CET rate on non-CARICOM agricultural imports was increased by 5, 10 and 15%. Next, CET rates were adjusted to ensure that commodities in each rate group faced a CET rate of 100%. For the purposes of this exercise, the CET rate increases and adjustments were applied only to commodities that fell within the CET rate brackets of >20% (20-30%, 30-45%, > 45%). The study assumes that non-CARICOM imports entering the OECS face symmetric unitary import demand elasticities. The elasticities are symmetric in that a given percentage increase or decrease in CET rates (or in import prices) would produce the same magnitude of change. In 1997, OECS (excluding Antigua) imports of agricultural commodities from non-CARICOM countries amounted to $232.62 million. About 54% of these imports faced no import tariffs, 21.4% faced import tariffs of 5% or less, 4.9% faced rates ranging between 5 and 10%, 4.2% faced rates between 10 and 20%, and another 15% faced tariff rates in excess of 20%. Over $15 million in CET revenues were collected, representing 41% of all import taxes. Commodities falling in the >20% rate groups accounted for a disproportionate 80% of the CET revenues. The simulation results suggest that the CET rate increases on commodities in the >20% rate groups would cause imports to fall, CET tariff revenues to rise, and the resulting decline in imports would cause non-CET import tax revenues to decline. However, increases in CET revenues would more than offset non-CET revenue losses. For example, a 10% increase in the CET rate would cause OECS imports to fall by 1.2%, CET revenues to rise by 15.3%, or $2.40 million, and net import tax revenues to rise by 6%, or $2.25 million. In 1997 St. Vincent imported $40.5 million worth of agricultural commodities from non-CARICOM countries as opposed to $35.4 million in 1996. The share of these imports facing duties of less than 5% increased from 75 to 79%, while the share of the >20% tariff rate groups fell from 14.8% to 12.7%. Consequently, in spite of increased imports, the shift in imports to lower tariff rate brackets caused CET revenues to fall from $2.1 to $1.9 million, a 6.7% decrease. This together with overall declines in non-CET tax revenues led total tax collections to fall by 6%, from $6.6 to $6.2 million. Most imports within the >20% tariff groups faced average tariff rates at just about the midpoint of the tariff range. For example, the 30-45% rate group had an average tariff rate of 37.3%. These average tariff rates have changed over time. The average rate of the 20-30% rate group in 1997 was almost 3 percentage points lower than that of 1996, while the average tariff rates of the 30-45 and the >45% rate groups were over four percentage points higher than their 1996

St Vincent and The Grenadines
38
counterparts. Of the collected1997 CET revenues, 75% or $1.4 million were obtained from imports falling into these >20% CET rate groups. The 20-30% group accounted for the largest share, 75.5%, of imports falling in the >20% rate groups, the 30-45% group represented 23.9%, while the >45% group represented a negligible 0.6%. The simulation results suggest that a 5 and 10% increase in the CET rate on imports of agricultural commodities falling in the >20% CET rate brackets would cause imports to fall by 0.5 and 0.99%, respectively. Owing to the shift of imports away from the >20% rate groups, decline in imports was slightly less pronounced in 1997 than in 1996. Among the >20% rate groups, the fall in imports was most pronounced in the 20-30% group, and least pronounced in the >45% group. For the 5% rate increase the average tariff rate of the 20-30 and 30-45% rate groups remained within their range, but occupied the upper half of the range. In the case of the 10% rate increase, the average tariff rate of the 20-30% group exceeded the upper limit of the range, and the average rate for the >45% group rose from 61.2% to 67.3%. As to be expected both the 15% tariff increase and the 100% tariff imposition produced more pronounced effects than the 5 or 10% rate increase. For 1997, imports decreased by 1.49% when the CET was raised by 15%, and 7.2% when the 100% tariff rate was imposed. In comparison, for 1996, imports declined by 1.7 and 8%, respectively. Regarding tariff revenues, a 15% rate increase would give rise to a 26.8% rise in CET revenues, and net import tax revenue gains of 8%. In comparison, a 100% CET rate would cause tariff revenues to rise by 41%, and net import tax revenues to increase by 6.9%. Figure 4.a. shows the import effect (by rate group) of the imposition of a 100% CET tax rate and a 15% rate increase. The 20-30% rate group, followed by the 30-45% group accounted for the largest share of imports, and accordingly they contributed the largest share of the decline in imports resulting from the tariff simulations. The CET revenue simulation results are displayed in Figure 4.b. Imports falling in the 20-30% rate bracket accounted for the largest increase in tariff revenues, while imports associated with the >45% rate group contributed the least. TRADE LIBERALISATION NEGOTIATIONS (FTAA & WTO) St. Vincent and The Grenadines is to conduct negotiations on trade liberalisation through the Regional Negotiation Machinery established by CARICOM to represent the interest of the region at WTO and FTAA. The impact of trade liberalisation on a global scale is likely to have much greater significance as far the fiscal situation in St. Vincent and The Grenadines is concerned than the adjustments made towards the CET. It is true that revenue buoyancy has been generally high, the savings rate satisfactory though moderate and the economy has been able to absorb tariff reductions without much impact on the fiscal account and on the performance of the sectors of the economy. But there are deficiencies in the fiscal regime as discussed above that need to be corrected to make

St Vincent and The Grenadines
39
the fiscal system more responsive to changes in the domestic and external environment and to improve its allocative efficiency. Resource allocation in the public service also needs rationalising to improve efficiency and effectiveness in spending. Furthermore, the large grant element in the government budget may not continue in the medium term and any disruptions in the revenue flow may destabilise fiscal operations. In considering the issue of further tariff reductions the following factors must be taken into account: • the importance of import duties as a share of total recurrent revenue; • the deficiencies in the fiscal regime; • the market structure of import trade and its response to changes in border prices; • possible contraction in the economy arising from negative sector response to external
competition which could have an impact on revenue generating capacity. St. Vincent and The Grenadines depends heavily on international trade for a considerable part of its recurrent revenue. In 1998 the share of taxes on internal trade in total recurrent revenue was as high as 42.1%. The share of import duty alone was 9.3%. The magnitude of the adjustment required if import duties were to be removed could imposed on a weak fiscal system would be disruptive and could destabilise the economy unless the fiscal regime is strengthened beforehand. Moreover the benefits that could accrue from tariff reduction may not be realised if the market structure is not conducive to price competition and gains in border prices are treated as windfall profits that could result in a fall in demand and a net loss of revenue. Even if price elasticity of demand were to result in larger volume of imports, the effect on the domestic economy could lead to a contraction in domestic goods production unless exchange rate adjustment were to complement the change. But given the high import content of domestic production any gains from exchange rate adjustment on prices would at best be marginal. The net effect could be a fall in overall demand and a contraction in the economy with consequential fall off in government revenues. Any further adjustment in tariffs should be done within a well-structured programme that will take account of the following: 1. A comprehensive tax reform that will improve efficiency in the tax system increase savings
and investments and an improved system to improve the allocation of resources to governments expenditure programmes and activities.
2. A phased approach to tariff reduction that will minimise disruptions to the flow of revenues. In order to address the latter simulations of the effect of the reduction in tariffs were conducted using the World Bank 123 model. SIMULATIONS OF A REDUCTION IN TRADE TAXES This section proposes to analyse the impact on the fiscal accounts, the sequential reduction in tariff rates based on trade liberalisation. The basis of the exercise is premised on a given set savings investment balance of the economies in question. By how much would indirect taxes

St Vincent and The Grenadines
40
have to increase in order to maintain this balance. The adjustment is therefore entirely fiscal and consistent with the economic foundations of the Eastern Caribbean Currency Union. Given the limits placed on the degree of Central Government borrowing from the monetary authorities, there is a binding constraint on governments’ ability to monetise their deficits. This adjustment is further reinforced by the choice of nominal anchor whereby the exchange rate is pegged at a fixed rate to the United States dollar. Given our degree of openness the economies of the Currency Union have been heavily dependent on taxes on international trade and transactions as a major source of revenue. This degree of dependence increases the vulnerability of the economies to shocks arising from increased trade liberalisation. The likely establishment of Regional Economic Partnership Arrangements (REPAs) under the new Lomé 5 protocol and accession to the Free Trade Area of the Americas (FTAA) will alter tariff rates among the membership in these regional trading blocks. Member countries of the Currency Union therefore must take a proactive and anticipatory stance in mitigating the costs of adjustment arising during the transitional period. The One Country, Two Sector, Three Good (123) Model This model refers to one country with two producing sectors and three goods. The sectors are the traded and non traded goods sectors while the goods produced are the export good, a domestic good and an import good. The three agents involved in the model are a producer, a household and the rest of the world. There are a total of twenty equations and two accounting identities. Five equations describe the underlying relationships that generate real flows. Six explain price relationships. Four describe nominal flows while the remainder describe equilibrium or market clearing conditions. These market clearing conditions state that supply must equal demand and that the balance of trade constraint must be satisfied. The model does not assume that all tradables are perfect substitutes with domestic goods. The model is static and does not yield a dynamic solution but a one period result based on the type of shock that is selected. TRANSMISSION MECHANISM OF A REDUCTION IN TARIFFS One of the key assumptions underlying the model is imperfect substitution between tradables and non-tradables. This assumption enables deviations from the law of one price which is standard in classical trade theory. By relaxing the assumption of perfect substitution between traded and non traded goods the model reflects the body of empirical evidence that indicates that changes in the price of imports and exports are only partially transmitted to the prices of domestic goods. Product differentiation of both imports and exports given the level of aggregation permits an extension of the Salter Swan model and gives rise to normally shaped offer curves. All domestic goods that are not exported are effectively treated as non-tradables (semi-tradables). Another key assumption in the model is the small country assumption whereby the country is a price taker in both import and export markets. In this model, consumers consume a composite good (Q) that is comprised of imports (M) and domestic good (D). Relatedly all income is spent on the composite good to satisfy the equilibrium condition that the value of goods demanded must equal aggregate expenditure. The

St Vincent and The Grenadines
41
desired ratio of imports to the domestic goods is a function of relative prices for a given degree of substitution. This allows for the relative demand functions to be linearly homogeneous of degree zero thus mitigating issues of “money illusion”. When the import tariff rate is cut this changes the relative price of imports to the domestic good. Imports become cheaper and there is a real appreciation of the exchange rate. There are two effects that arise: the income effect and the substitution effect as imports become relatively more attractive. For a given propensity to import consumers maximise utility by consuming more of the import good as real income is now higher. For most developing countries such as those of the currency union the income effect is likely to dominate given low elasticities of substitution. Both exports and the domestic good will be more expensive relative to imports. In the simulation the constraint that the overall savings investment balance should remain the same is imposed. The simulation basically asks the question how much would sales tax/value added tax or excise tax revenues have to be raised in order to ensure revenue neutrality. The current revenue has three components related to (a) tradable sector; (b) non-tradable sector and (c) overall income. Revenue is therefore a function of the product of the import tariff rate times the real exchange rate times the value of imports plus the product of the sales/excise/value added tax rate times value of demand for the composite good plus the product of the direct tax rate times total income. Hence when the import tariff rate is cut it, the income effect results in more imports hence the quantity effect dominates the price effect for a given propensity to import in the revenue function. The second effect is traced through the sales/excise or value added tax rate as it is applied to demand for the composite good which is comprised of both imports and domestic goods. The sales or excise tax provides a compensatory mechanism that ensures that the savings investment balance is maintained for a given cut in the import tariff rate. Walras’ Law ensures that the sum of the price-weighted excess demands summed over all markets must be zero. SIMULATIONS The simulations were based on a 25.0%, 50.0% and 100.0% reduction of import tariff rates in the face of increasing trade liberalisation. The method of adjustment assumed was internal based on a change in the tax regime. It was assumed that given the reliance on trade taxes for most revenue that indirect tax rates would have to change in order to maintain the existing savings investment balance. The indirect taxes could take the form of a sales tax or some other form of indirect tax on consumption. The baseline year chosen was 1998. In St. Vincent and The Grenadines, trade taxes accounted for 46.4% of current revenue in the 1980’s compared with 42.4% in the 1990’s. The revenue elasticity was 1.02 in the 1980’s compared with 1.11 in the 1990’s. In contrast the trade tax elasticity was higher in the 1980’s at 1.07 compared with 0.99 in the 1980’s.

St Vincent and The Grenadines
42
St. Vincent and The Grenadines Revenue and Trade Tax Elasticities 1980-98 1980's 1990's
Revenue 0.92 1.02 1.11 Trade Tax 0.85 1.07 0.99
In order for the current account to remain the same in the face of a 25.0% reduction in trade tariff rate, indirect taxes would have to rise to 2.4% of GDP. For a 50.0% reduction, indirect taxes would have to be raised to 4.8% of GDP. For full liberalisation these taxes would have to rise to 12.0% of GDP.
St. Vincent and The Grenadines
Tariff Rate Indirect Tax Rate Per Cent GDP
25% reduction in Import Tariff 2.4 50% reduction in Import Tariff 4.8 100% reduction in Import Tariff 12.0
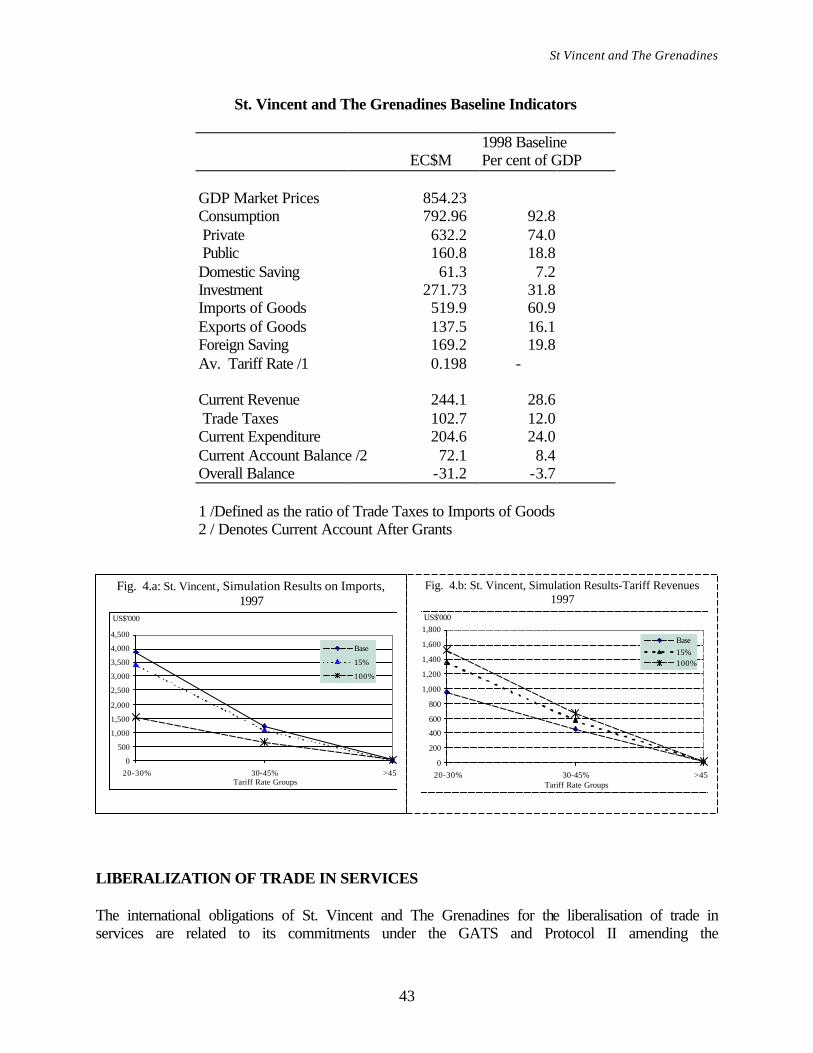
St Vincent and The Grenadines
43
St. Vincent and The Grenadines Baseline Indicators 1998 Baseline EC$M Per cent of GDP
GDP Market Prices 854.23 Consumption 792.96 92.8 Private 632.2 74.0 Public 160.8 18.8 Domestic Saving 61.3 7.2 Investment 271.73 31.8 Imports of Goods 519.9 60.9 Exports of Goods 137.5 16.1 Foreign Saving 169.2 19.8 Av. Tariff Rate /1 0.198 -
Current Revenue 244.1 28.6 Trade Taxes 102.7 12.0 Current Expenditure 204.6 24.0 Current Account Balance /2 72.1 8.4 Overall Balance -31.2 -3.7
1 /Defined as the ratio of Trade Taxes to Imports of Goods 2 / Denotes Current Account After Grants
LIBERALIZATION OF TRADE IN SERVICES The international obligations of St. Vincent and The Grenadines for the liberalisation of trade in services are related to its commitments under the GATS and Protocol II amending the
Fig. 4.a: St. Vincent, Simulation Results on Imports, 1997
0
500
1,000
1,500
2,000
2,500
3,000
3,500
4,000
4,500
20-30% 30-45% >45%Tariff Rate Groups
Base
15%
100%
US$'000
Fig. 4.b: St. Vincent, Simulation Results-Tariff Revenues 1997
0
200
400
600
800
1,000
1,200
1,400
1,600
1,800
20-30% 30-45% >45%Tariff Rate Groups
Base15%100%
US$'000

St Vincent and The Grenadines
44
CARICOM treaty. The commitments under Protocol II represent advancement on the GATS hence this section begins with a discussion of the GATS COMMITMENTS UNDER GATS AND TRADING ARRANGEMENTS The general objective of the GATS is to develop as set of rules that would foster increased transparency, consistency, certainty and non discriminatory norms and regulations in the governance of trade in services. The services not covered by the agreement pertain to transportation and airline services. With regards to modes of supply four specific mechanisms apply as follows: (1) cross border supply; (2) consumption abroad; (3) commercial presence; and (4) presence of natural persons. The Most Favoured Nation (MFN) principle under the GATS dictates that trading partners whether with the Free Trade Area of the Americas (FTAA) or the Regional Economic Partnership Agreements (REPA) of the EU. Albeit temporary exemptions may be allowed for transitional purposes. The principle of National Treatment dictates that once a foreign entity supplies a service to WTO member country then there should be no discrimination between this entity and a local one. St. Vincent and The Grenadines has made commitments under GATS for the following services: (1) Health Related Services, specifically hospital services; (2) Financial services, specifically insurance and insurance related services; (3) Tourism and tourism related services; (4) Recreational, cultural and sporting services; and (5) Transport services. In the above five areas limitations to market access pertain to horizontal commitments are specific to commercial presence and presence of natural persons. In the case of commercial presence, joint ventures are encouraged with prior approval from the authorities. Foreign providers are required to incorporate locally in accordance with St. Vincent’s and The Grenadines Commercial Code. These entities are also subject to the Exchange Control Act, Withholding Tax, Insurance Act and Aliens Landholding. The employment of non-nationals are also subject to work permit and Immigration regulations. Financial Services Commitments under financial services are specific to insurance and insurance related services. There are no limitations to market access or national treatment other than those articulated in the Insurance and Insurance Premium Acts, Withholding Tax, Commercial Code and Exchange Control Act.
St Vincent and The Grenadines
45
Health Related Services There are no limitations to national treatment but with regards to market access, the issue of commercial presence is subject to Commercial Code, Exchange Control Acts, Alien Landholding Act. The presence of natural persons is also subject to work permit laws, and Immigration Regulations. Tourism and Tourism Related Services As in the case of health-related services and financial services there are no limitations to market access and national treatment other that those enshrined within the Hotel Proprietors Act, Commercial Code, Exchange Control Act and withholding tax. These services are heavily dependent on FDI flows and so are already at fairly high degree of liberalisation. The incentive regime provided under the Fiscal Incentives and Hotels Aid Acts are designed to facilitate these inflows without undue restriction. Recreational and Sporting Services/Transport Services/Transshipment/Free Zones Cross border supply is restricted to laws that deal with moral matters. Under limitations to market access commercial presence is governed by the Commercial Code, Exchange Control Act and Alien Landholding Act. The presence of natural persons as is the case for all commitments are subject to work permit and immigration regulations Direction of Trade St. Vincent and The Grenadines is a net exporter of tourism and financial services to both the EU and the USA. These two sectors offer the greatest opportunity for growth over the medium term. Business and travel services are the major imports into the EU from CARICOM countries. The UK, France and Germany are the largest importers of these services from CARICOM. In the establishment of REPAs with the EU a number of limitations may arise with respect to market access particularly with regards to the movement of natural persons and commercial presence. CONCLUSION The defining feature of the economic performance of St. Vincent and The Grenadines has been the volatility of economic growth. Thus although the overall growth rates exhibited the pattern of higher growth rates in the 1980s and slower growth in the 1990s, as observed in the other OECS countries, growth rates have been much more volatile than in the other countries. The competitiveness studies suggest that the country is most competitive in the production of sweet potatoes, bananas, and coconuts. Also export competitive were nutmeg, plantains, mangoes, pumpkin, rice and citrus fruits. The manufacturing sector that has developed with the aid of high levels of protection. The agro-processing sector has strong linkages with the agricultural sector and has the potential to be competitive in selected niche markets but the survival of some firms in the sector may be doubtful without the protective arrangements. In this

St Vincent and The Grenadines
46
regard the authorities may need to allow the least efficient firms to exit the sector in an orderly manner while providing support to those firms that have the potential to be export competitive. A package of assistance would need to be provided to these firms and may include, finance and technical assistance in product development, factory layout, marketing etc. Given the tight budgetary constraints facing the country and the expected loss of revenue from trade liberalisation it may be necessary to access the required resources from external sources. St. Vincent and The Grenadines have been one of the more fiscally prudent members of the monetary union. Both Central Government and the public sector as a whole has generated the requisite current account surpluses to finance economic transformation. The preservation of this trend is critical to future economic development of the territory given the high costs of infrastructure arising from the mountainous terrain and the dispersion of the Grenadine Islands. This further compounded by the diminution of aid flows and concessional financing of development. Fiscal performance in St. Vincent and The Grenadines has been stable with strong growth in recurrent revenues, moderate growth in recurrent expenditure and satisfactory current account savings. However, the savings/investment ratio has fallen drastically as government embarked on higher levels of public sector investment, resulting in a rapid increase in the public debt. Despite distortions and inefficiencies in the tax system and weaknesses in tax administration, revenue buoyancy has been maintained at a relatively high level. Generally, the tax structure is consistent with WTO standards except for regulatory restrictions in the aliens landholding legislation which discriminates between nationals and non-nationals. Although the requirement for a landholding license and a fee equivalent to 10.0% of land value can be removed without significant loss of revenue, there are social implications which require a cautious approach to avoid the alienation of the poorer segment of the community from lands needed for basic shelter and small farming. The other exception relates to the rate of customs service charge at 4.0% of CIF, above the allowable limit of 1.0% for cost recovery under the GATT rules. A downward adjustment of this tax could result in a considerable loss of revenue unless the tax is shifted and distributed downstream on expenditure on a broader base of expenditure on goods and services. A major programme of tax reform is needed to improve the efficiency and responsiveness of the tax system, rationalise the incentive framework and the policy on concessions, correct trade anomalies, especially for inconsistency with WTO principles and strengthen tax administration. At the same time, improvements are needed to control growth in recurrent expenditure, improve savings performance, increase the savings/investment ratio and decelerate growth in the public debt and debt servicing costs. St. Vincent and The Grenadines has fully implemented the CARICOM CET and reduced its dependency on taxes on international trade. Further movements towards trade liberalisation is likely to be costly. As shown in the section on Simulations, total removal of tariffs would require an increase in domestic taxes equivalent to 12.0% of GDP. An adjustment on this scale applied to the present tax structure could disrupt the fragile domestic economy, especially import displacement industries and could have overall negative impact on the fiscal account unless it is
St Vincent and The Grenadines
47
done within the framework of major reforms in macroeconomic policy, in particular an overhaul of the tax system aimed at moving border taxes downstream to a broader base of expenditure on goods and services. The package of reform needed will require extensive international support and a transition period that takes account of the country’s institutional strength and absorptive capacity. There is a need either expand the existing airport on the mainland or construct a new facility in order to expand the role of tourism within the economy. There are opportunities to integrate the agricultural sector and the tourism industry. The continued dichotomy in tourism product with The Grenadines being designated up-market is essential to long term sustainability. The fragile nature of The Grenadines and the ease with which tourism density can be increased should guide policy on cruise tourism. The risk of increased pollution could also endanger the viability of the industry in The Grenadines. The study suggests that the market for services in St. Vincent and The Grenadines is already characterised by significant liberalisation further liberalisation would benefit the country more than it would lose. Thus a negotiating strategy would move to further liberalise the services sector in exchange for concessions in agriculture. The study could not identify a case for the St. Vincent and The Grenadines as part of the OECS grouping to pursue a negotiating strategy that was different from the rest of CARICOM except in so far as the sequencing of adjustment measures and the transition period for liberalisation are concerned. Action to be taken and the transition period required are indicated in the Section on the Way Forward in the Overview.
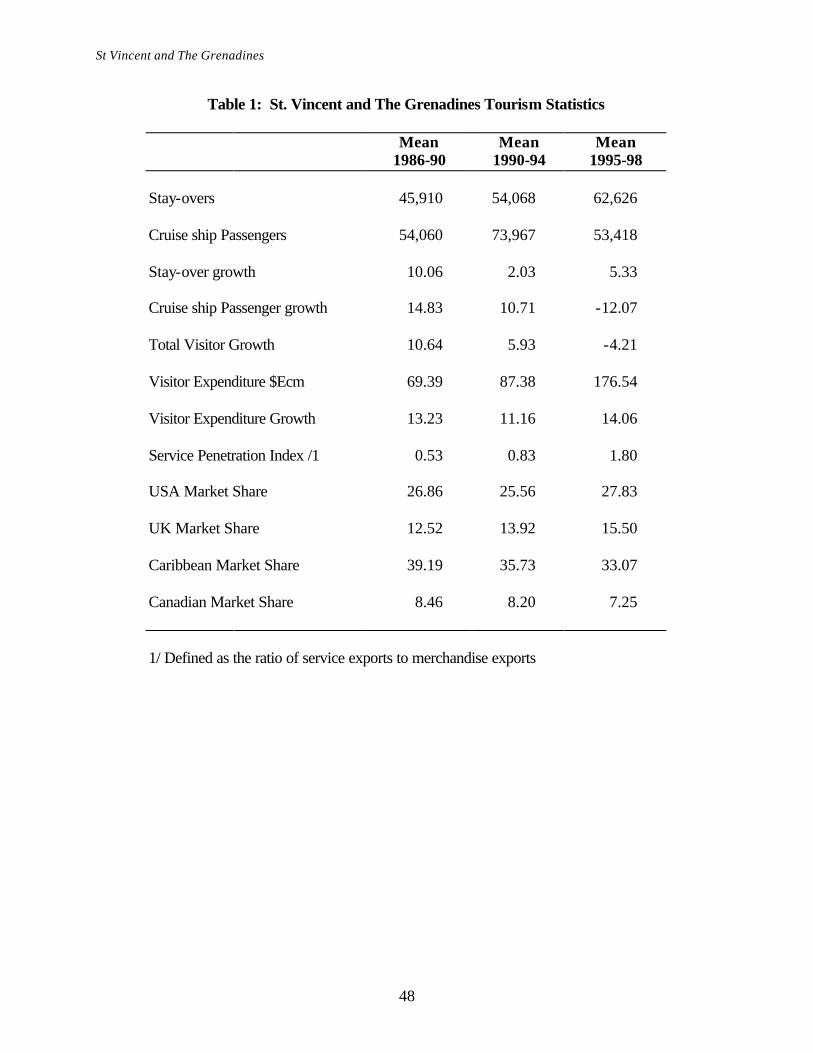
St Vincent and The Grenadines
48
Table 1: St. Vincent and The Grenadines Tourism Statistics Mean Mean Mean 1986-90 1990-94 1995-98
Stay-overs 45,910 54,068 62,626
Cruise ship Passengers 54,060 73,967 53,418
Stay-over growth 10.06 2.03 5.33
Cruise ship Passenger growth 14.83 10.71 -12.07
Total Visitor Growth 10.64 5.93 -4.21
Visitor Expenditure $Ecm 69.39 87.38 176.54
Visitor Expenditure Growth 13.23 11.16 14.06
Service Penetration Index /1 0.53 0.83 1.80
USA Market Share 26.86 25.56 27.83
UK Market Share 12.52 13.92 15.50
Caribbean Market Share 39.19 35.73 33.07
Canadian Market Share 8.46 8.20 7.25
1/ Defined as the ratio of service exports to merchandise exports

St Vincent and The Grenadines
49
Table 2: St. Vincent and The Grenadines Terms of Trade
1987 1988 1989 1990 1991 1992 1993 1994 1995
Total Merchandise Exports 70.02 114.37 100 105.4 81.9 97.9 81.9 67.9 76.7 Percentage Change -19.6 63.35 -12.57 5.40 -22.30 19.54 -16.34 -17.09 12.96
Export Prices 98.29 109.00 100 105.2 107.5 100.4 91.1 98.9 97.5 Percentage Change 1.50 10.90 -8.26 5.20 2.19 -6.60 -9.26 8.56 -1.42
Import Prices 122.85 131.99 100.00 106.60 106.10 107.80 101.20 106.00 116.00 Percentage Change 5.10 7.44 -24.24 6.60 -0.47 1.60 -6.12 4.74 9.43
Merchandise Terms of Trade 105.57 108.95 100.00 98.70 101.40 93.20 90.00 93.30 84.00 Percentage Change -3.40 3.21 -8.22 -1.30 2.74 -8.09 -3.43 3.67 -9.97
Table 3: St. Vincent and Grenadines Sectoral Real GDP Contribution
and Real Growth in Services Mean Mean Mean 1986-89 1990-94 1995-98 Tourism
Contribution 2.07 2.40 2.45 Growth 9.55 6.22 2.36
Construction Contribution 9.25 9.96 10.37 Growth 9.68 5.98 6.27
Communications Contribution 6.40 7.78 8.40 Growth 19.78 7.55 5.95
Transportation Contribution 12.89 13.01 13.41 Growth 7.38 3.24 6.77
Banks Contribution 6.02 6.48 7.29 Growth 11.30 4.38 7.01

St Vincent and The Grenadines
50
Table 4: St. Vincent and The Grenadines Foreign Direct Investment (FDI) Profile
Mean Mean Mean 1986-89 1990-94 1995-98
FDI as Per Cent of GDP 5.11 9.5 11.6
FDI as Per Cent of ECCB Inflows 7.62 13.1 14.5
Equity Share of FDI 26.3 4.55 33.46
Land Sales Share of FDI 43.75 17.75 24.48
Reinvested Earnings Share of FDI 27.93 37.49 25.77
Other Investment Share of FDI 2.03 40.22 16.29

St Vincent and The Grenadines
51
Table 5: St. Vincent and The Grenadines Hotel Capacity
1986 1987 1988 1989 1990 1991 1992 1993 1994 1995 1996 1997 1998
Hotels 468 494 512 494 494 522 540 542 na na 561 580 580 Apartment hotels 200 205 205 139 139 161 171 192 na na 205 206 206 Guest Houses/Villas 317 363 440 426 426 426 453 496 na na 485 486 486 Total 985 1062 1157 1059 1059 1109 1164 1230 1230 1215 1251 1272 1272
(Percentage Change)
Hotels -0.64 5.56 3.64 -3.52 0.00 5.67 3.45 0.37 na na na 3.39 0.00 Cottages/Apartments 0.00 2.50 0.00 -32.20 0.00 15.83 6.21 12.28 na na na 0.49 0.00 Guest Houses 0.00 0.15 0.21 -0.03 0.00 0.00 0.06 0.09 na na na 0.00 0.00 Total -0.20 7.82 8.95 -8.47 0.00 4.72 4.96 5.67 0.00 -1.22 2.96 1.68 0.00

St Vincent and The Grenadines
52
Table 6: St. Vincent and The Grenadines Savings Investment Profile (EC$M) 1986 1987 1988 1989 1990 1991 1992 1993 1994 1995 1996
Source of Funds 100.2 124.0 137.0 138.0 159.1 120.8 159.0 168.4 187.9 215.4 212.8 Gross National Savings 74.1 70.4 90.1 58.8 96.3 3.0 92.7 44.8 30.7 105.6 127.6 Gross Domestic Savings 76.0 63.7 103.6 54.9 100.2 13.9 95.9 50.3 27.5 112.3 124.7 Public Sector 27.0 32.3 31.1 39.7 45.5 46.5 42.2 53.5 51.2 49.9 52.6 Private Sector 49.1 31.4 72.5 15.2 54.7 -32.6 53.7 -3.2 -23.7 62.4 72.1 Transfers from Abroad 20.9 18.2 16.9 22.4 25.9 19.4 15.6 16.7 31.9 24.8 31.4 Net Factor Income -22.8 -11.5 -30.4 -18.5 -29.8 -30.2 -18.8 -22.2 -28.7 -31.5 -28.4 Foreign Savings 26.1 53.6 46.9 79.2 62.8 117.8 66.2 123.6 157.2 109.8 85.1
Use of Funds Domestic Investment 100.2 124.0 137.0 138.0 159.1 120.8 159.0 168.4 187.9 215.4 212.8 Public Sector 43.9 48.0 58.7 63.2 63.7 83.2 82.5 64.5 82.1 89.1 45.9 Private Sector 56.3 76.0 78.4 74.8 95.4 37.7 76.5 103.9 105.8 126.4 166.9
(In Per Cent GDP Market Prices)
Source of Funds 29.0 32.3 30.8 28.8 29.7 21.1 25.2 26.1 28.6 30.2 28.3 Gross National Savings 21.5 18.3 20.3 12.3 18.0 0.5 14.7 6.9 4.7 14.8 17.0 Gross Domestic Savings 22.0 16.6 23.3 11.5 18.7 2.4 15.2 7.8 4.2 15.8 16.6 Public Sector 7.8 8.4 7.0 8.3 8.5 8.1 6.7 8.3 7.8 7.0 7.0 Private Sector 14.2 8.2 16.3 3.2 10.2 -5.7 8.5 -0.5 -3.6 8.8 9.6 Foreign Savings 7.6 14.0 10.6 16.5 11.7 20.5 10.5 19.2 23.9 15.4 11.3 Use of Funds Domestic Investment 29.0 32.3 30.8 28.8 29.7 21.1 25.2 26.1 28.6 30.2 28.3 Public Sector 12.7 12.5 13.2 13.2 11.9 14.5 13.1 10.0 12.5 12.5 6.1 Private Sector 16.3 19.8 17.6 15.6 17.8 6.6 12.1 16.1 16.1 17.7 22.2

St Vincent and The Grenadines
53
Table 7: St. Vincent and The Grenadines Monetary Survey (EC$M)
1986 1987 1988 1989 1990 1991 1992 1993 1994 1995 1996 1997 1998
Net Foreign Assets 80.40 73.95 112.42 109.79 146.42 128.97 134.10 122.39 143.43 115.04 105.58 130.99 179.52
Central Bank (net) 69.73 54.60 58.92 61.47 71.53 65.81 94.57 82.76 81.97 78.23 79.27 82.15 102.52 Commercial Banks (net) 10.67 19.35 53.50 48.32 74.88 63.16 39.54 39.62 61.46 36.81 26.31 48.84 77.00
External (net) 3.28 14.31 53.11 46.80 72.35 69.58 41.25 26.14 19.04 8.49 (19.05) (30.77) 0.93 Other ECCB Territories
(net) 7.40 5.04 0.39 1.52 2.53 (6.42) (1.71) 13.48 42.42 28.33 45.36 79.61 76.07
Net Domestic Assets 92.62 91.25 94.10 119.87 105.07 126.47 162.74 203.96 202.85 258.64 284.47 313.60 336.55 Domestic Credit 113.26 113.94 117.21 146.27 133.58 155.35 195.37 215.21 237.38 295.10 325.78 361.31 366.59 Central Government (net)
36.09 36.88 30.92 46.30 40.13 29.10 32.20 47.53 46.78 74.52 63.88 64.96 47.23
Other Public Sector (net)
(26.90) (49.81) (59.61) (72.02) (90.77) (92.58) (77.40) (81.69) (74.21) (110.27) (121.00) (137.25) (148.27)
Non-Bank Financials (4.12) (5.20) (13.50) (17.84) (20.11) (19.84) (17.87) (16.61) (20.30) (14.31) (11.92) (13.56) (18.80) Subsidiaries (net) 0.00 (0.04) 0.00 0.00 0.00 0.00 0.00 0.00 0.00 (1.84) (4.02) 0.00 0.00 Private Sector 108.18 132.10 159.41 189.83 204.33 238.67 258.45 265.98 285.12 347.02 398.83 447.16 486.42 Other Items (net) (20.64) (22.69) (23.11) (26.40) (28.52) (28.88) (32.63) (11.26) (34.54) (36.47) (41.31) (47.71) (30.05) Money Supply (M2) 173.02 165.20 206.52 229.66 251.48 255.44 296.84 326.34 346.28 373.68 390.05 444.59 516.06 Currency 41.42 23.60 25.15 32.12 23.96 19.09 30.30 28.22 32.02 28.59 27.01 33.49 36.43 Demand Deposits 17.24 18.08 27.87 28.99 32.22 33.65 54.71 56.71 64.17 66.62 69.25 95.76 114.32 Savings Deposits 71.14 79.10 103.22 115.33 133.96 145.09 149.84 175.83 182.16 198.65 212.42 221.72 251.96 Time Deposits 42.99 44.36 49.27 52.24 60.11 55.18 60.40 62.31 60.95 74.24 77.11 85.49 101.24 Foreign Currency Deposits
0.24 0.07 1.01 0.97 1.24 2.44 1.59 3.26 6.97 5.59 4.27 8.14 12.12


