STABILIZATION OF EXPANSIVE SOILS BY ÇAYIRHAN FLY ASH AND DESULPHOGYPSUM A THESIS SUBMITTED TO THE GRADUATE SCHOOL OF NATURAL AND APPLIED SCIENCES OF THE MIDDLE EAST TECHNICAL UNIVERSITY BY SERTAN IŞIK ÇETİNER IN PARTIAL FULFILLMENT OF THE REQUIREMENTS FOR THE DEGREE OF MASTER OF SCIENCE IN THE DEPARTMENT OF CIVIL ENGINEERING JANUARY 2004
Transcript
STABILIZATION OF EXPANSIVE SOILS BY ÇAYIRHAN FLY ASH AND DESULPHOGYPSUM
A THESIS SUBMITTED TO THE GRADUATE SCHOOL OF NATURAL AND APPLIED SCIENCES
OF THE MIDDLE EAST TECHNICAL UNIVERSITY
BY
SERTAN IŞIK ÇETİNER
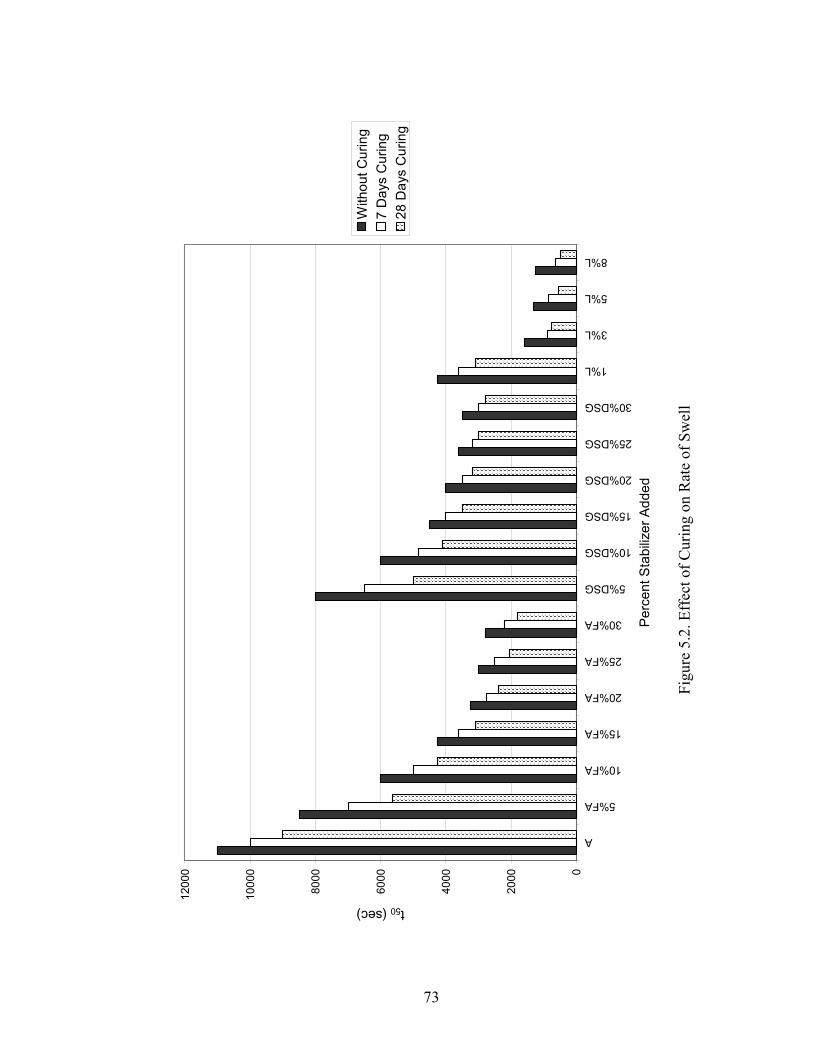
IN PARTIAL FULFILLMENT OF THE REQUIREMENTS FOR THE DEGREE OF
MASTER OF SCIENCE
IN
THE DEPARTMENT OF CIVIL ENGINEERING
JANUARY 2004
iii
ABSTRACT
STABILIZATION OF EXPANSIVE SOILS BY ÇAYIRHAN FLY ASH AND
DESULPHOGYPSUM
Çetiner, Sertan Işık
M.S., Department of Civil Engineering
Supervisor: Prof. Dr. Erdal Çokça
January 2004, 107 Pages
Expansive soils are one of the most serious problems which the foundation
engineer faces. Several attempts are being made to control the swell-shrink
behavior of these soils. One of the most effective and economical methods is to use
chemical additives. Fly ash and desulphogypsum, both of which are by-products of
coal burning thermal power plants, are accumulating in large quantities all over the
world and pose serious environmental problems. In this study, the expansive soil
was stabilized using the fly ash and desulphogypsum obtained from Çayırhan
Thermal Power Plant. Fly ash and desulphogypsum were added to the expansive
soil from 0 to 30 percent. Lime was used to see how efficient fly ash and
desulphogypsum on expansive soil stabilization were, and was added to the
expansive soil from 0 to 8 percent. The properties obtained were chemical
composition, grain size distribution, consistency limits, swelling percentage, and
rate of swell. Fly ash, desulphogypsum, and lime added samples were cured for 7
days and 28 days, after which they were subjected to free swell tests. Swelling
percentage decreased and rate of swell increased with increasing stabilizer
percentage. Curing resulted in further reduction in swelling percentage and further
iv
increase in rate of swell. 25 percent and 30 percent fly ash and desulphogypsum
additions reduced the swelling percentage to levels comparable to lime stabilization.
Keywords: Desulphogypsum, Expansive Soil, Fly Ash, Lime, Rate of Swell,
Stabilization, Swelling Percentage
v
ÖZ
ŞİŞEN ZEMİNLERİN ÇAYIRHAN UÇUCU KÜLÜ VE DESÜLFOJİPS İLE
STABİLİZASYONU
Çetiner, Sertan Işık
Yüksek Lisans, İnşaat Mühendisliği Bölümü
Tez Yöneticisi: Prof. Dr. Erdal Çokça
Ocak 2004, 107 Sayfa
Şişen zeminler temel mühendisinin karşılaştığı en ciddi sorunlardan bir
tanesidir. Bu zeminlerin şişme-büzülme davranışını kontrol edebilmek için bir çok
girişimler yapılmaktadır. En etkili ve ekonomik metodlardan bir tanesi kimyasal
katkılar kullanmaktır. Kömür yakan termik santrallerin yan ürünleri olan uçucu kül
ve desülfojips tüm dünyada büyük miktarlarda birikmekte ve ciddi çevresel sorunlar
teşkil etmektedir. Bu çalışmada, şişen zemin Çayırhan Termik Santrali’nden elde
edilen uçucu kül ve desülfojips ile stabilize edilmiştir. Uçucu kül ve desülfojips
şişen zemine 0’dan yüzde 30’a kadar eklenmiştir. Uçucu kül ve desülfojipsin şişen
zemin stabilizasyonunda ne kadar verimli olduklarını anlamak için kireç
kullanılmış, ve şişen zemine 0’dan yüzde 8’e kadar eklenmiştir. Kimyasal bileşim,
dane dağılımı, kıvam limitleri, şişme yüzdesi ve şişme hızı elde edilen özelliklerdir.
Uçucu kül, desülfojips ve kireç eklenmiş numunelere, sonrasında serbest şişme
deneylerine tabi tutulmak üzere, 7 günlük ve 28 günlük kür uygulanmıştır.
Stabilizan yüzdesinin artmasıyla şişme yüzdesi düşmüş ve şişme hızı artmıştır. Kür
şişme yüzdesinin daha da düşmesine ve şişme hızının daha da artmasına sebep
vi
olmuştur. Yüzde 25 ve yüzde 30 uçucu kül ve desülfojips eklenmesi şişme
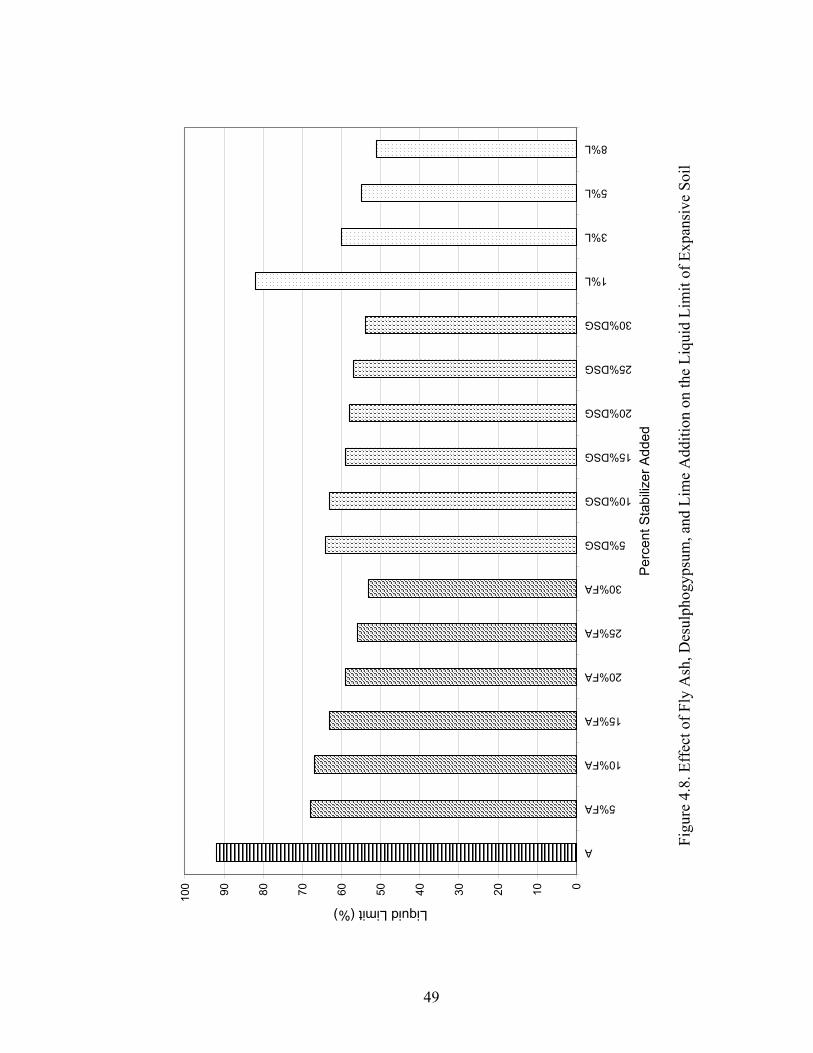
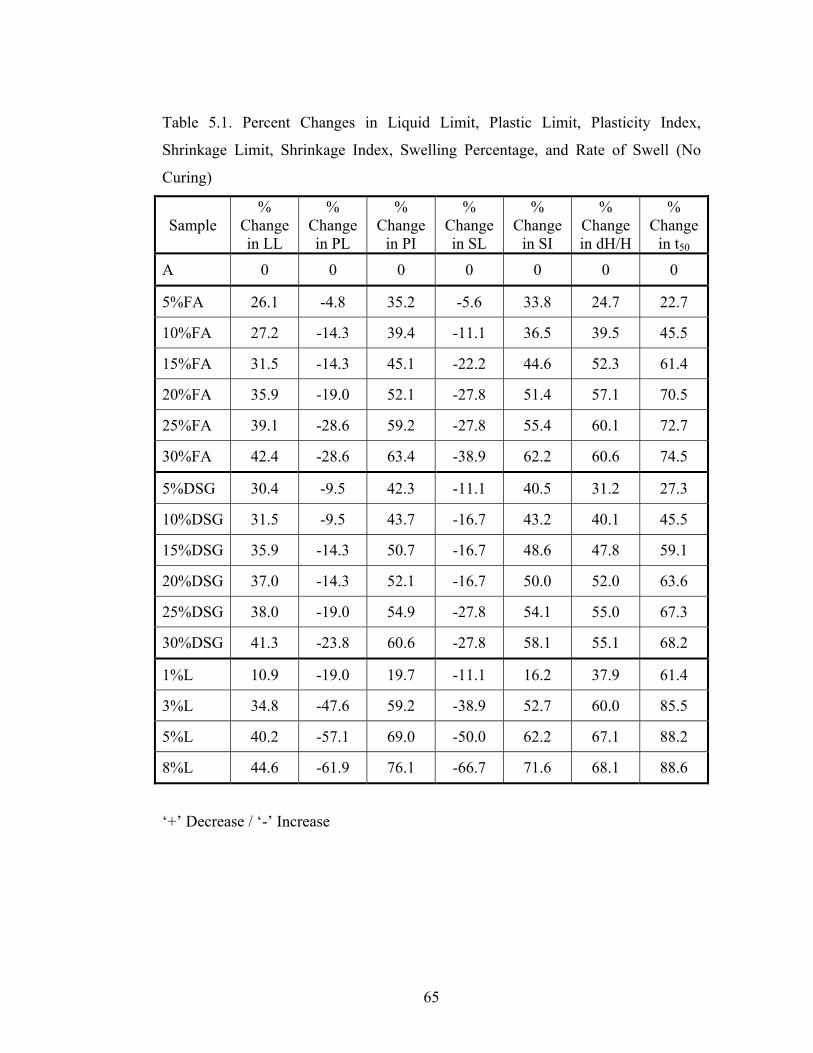
4.8. Effects of Fly Ash, Desulphogypsum, and Lime Addition on the
Liquid Limit of Expansive Soil …………………………………………. 49
xiv
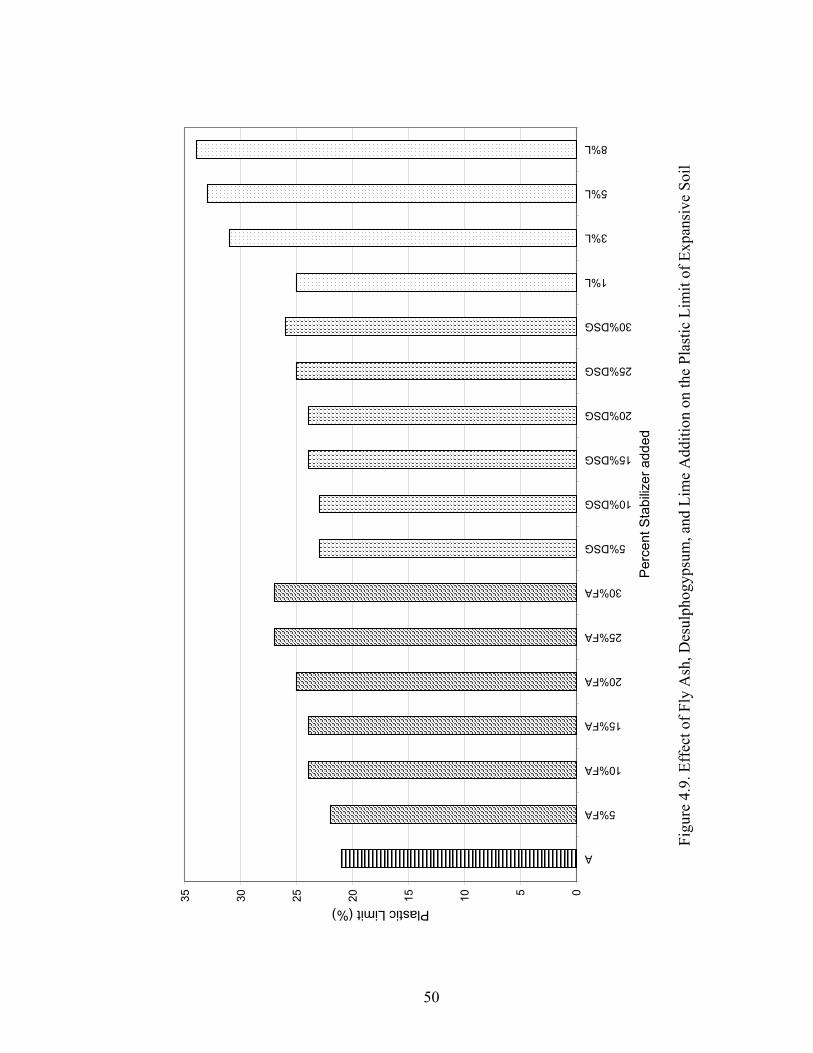
4.9. Effects of Fly Ash, Desulphogypsum, and Lime Addition on the
Plastic Limit of Expansive Soil …………………………………………. 50
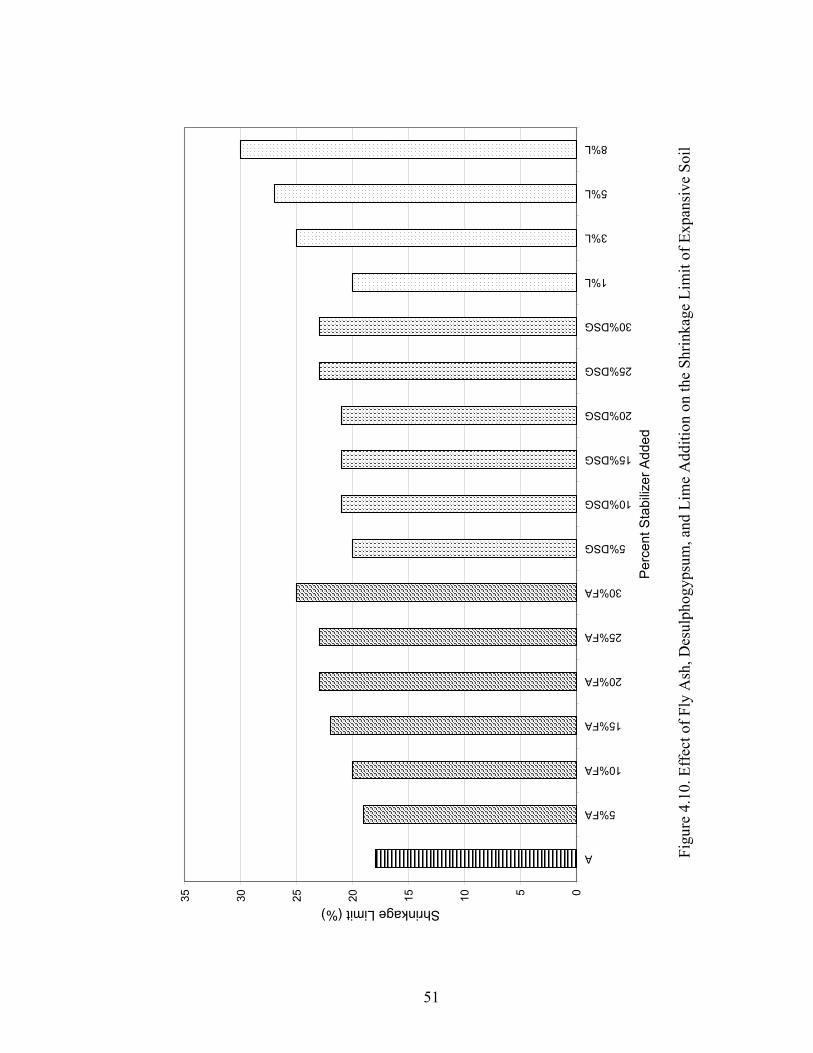
4.10. Effects of Fly Ash, Desulphogypsum, and Lime Addition on the
Shrinkage Limit of Expansive Soil …………………………………… 51
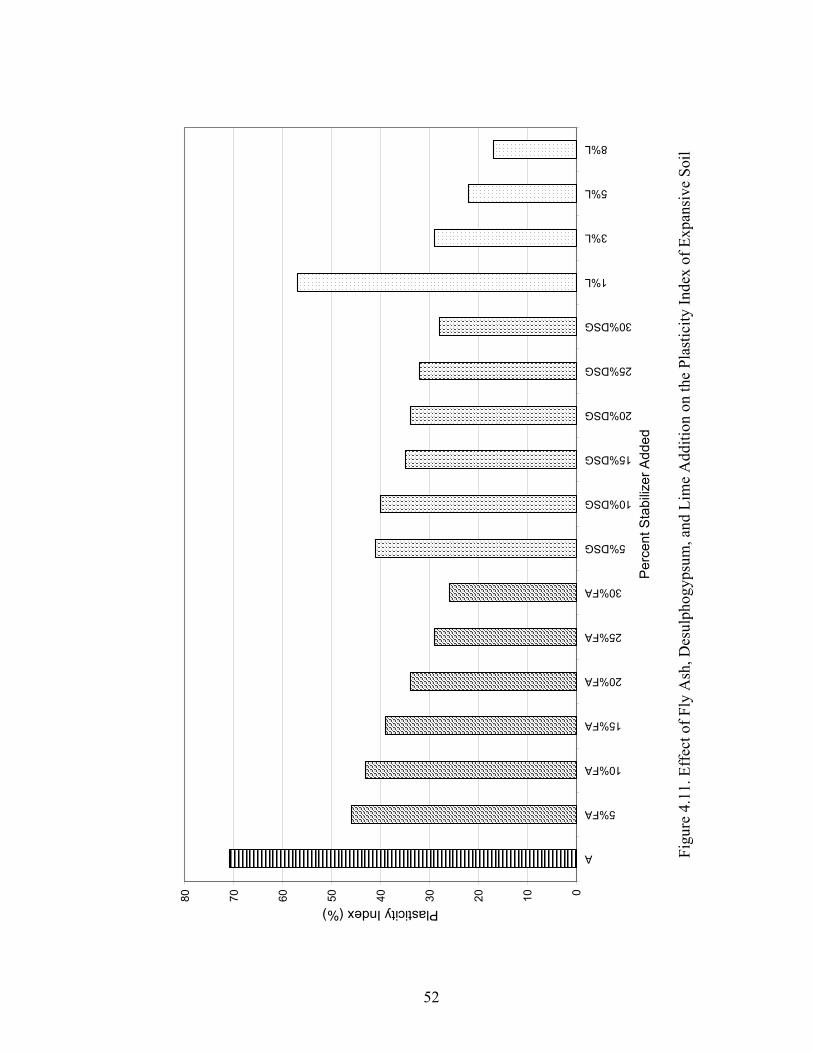
4.11. Effects of Fly Ash, Desulphogypsum, and Lime Addition on the
Plasticity Index of Expansive Soil ……………………………………. 52
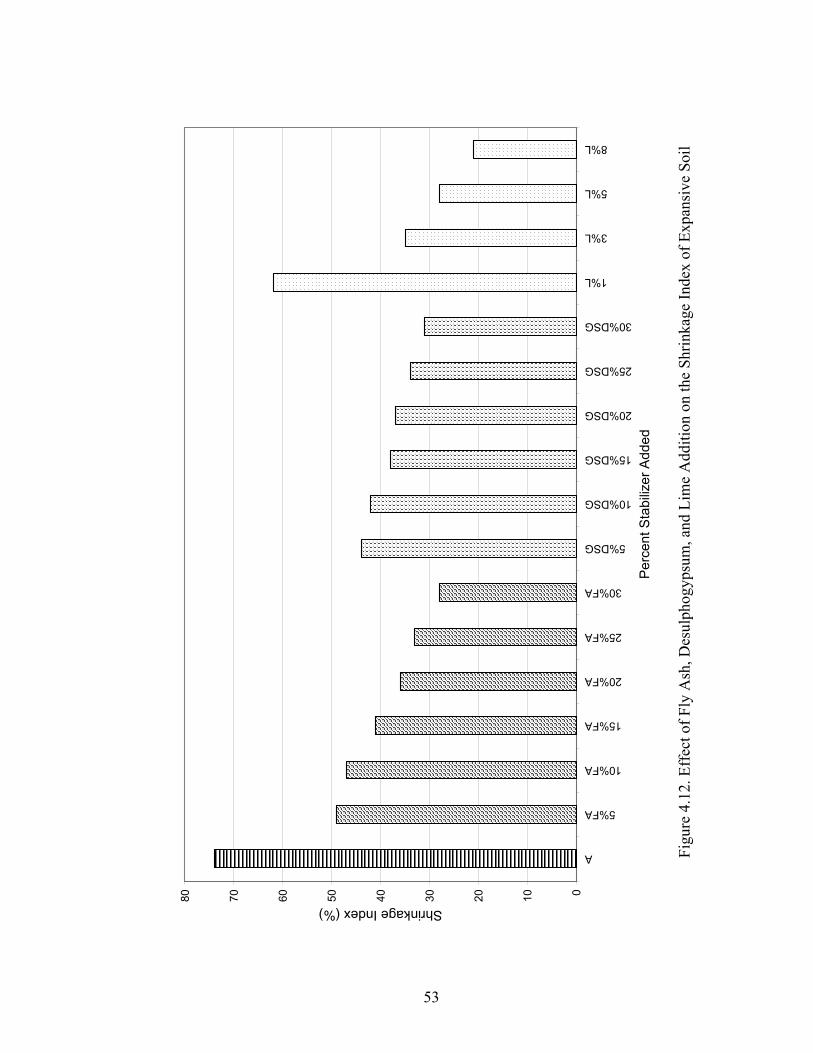
4.12. Effects of Fly Ash, Desulphogypsum, and Lime Addition on the
Shrinkage Index of Expansive Soil …………………………………… 53
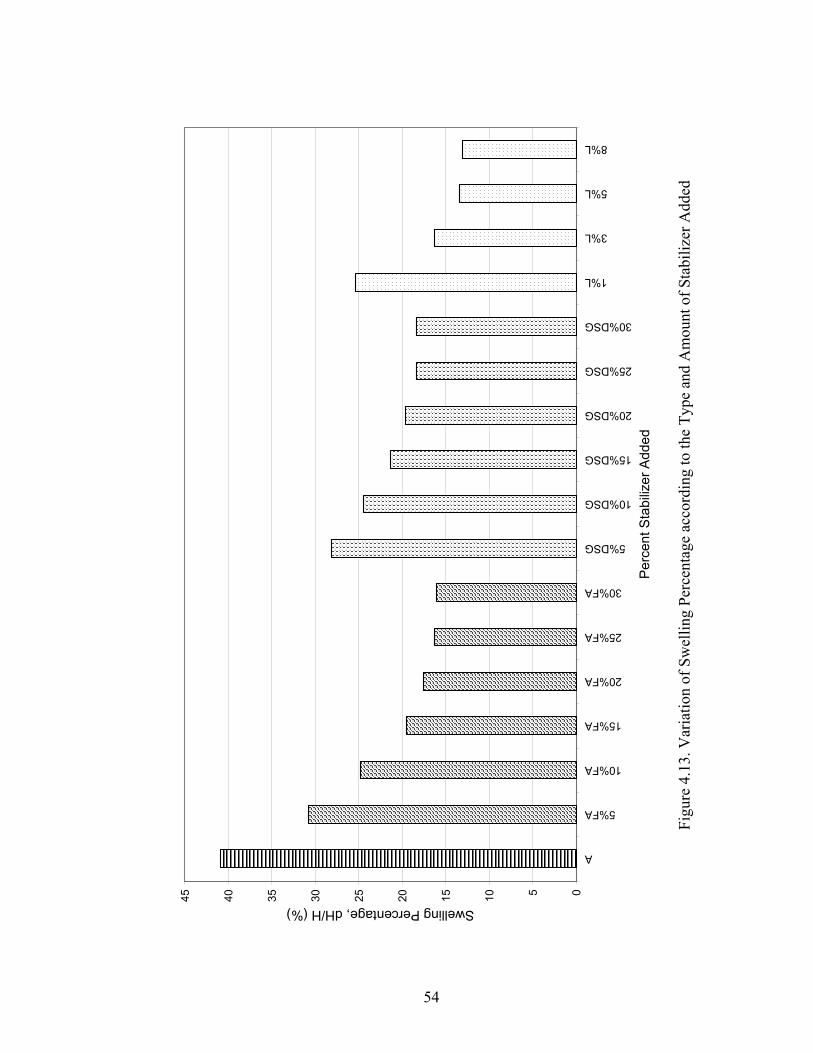
4.13. Variation of Swelling Percentage according to the Type and Amount
of Stabilizer Added …………………………………………………… 54
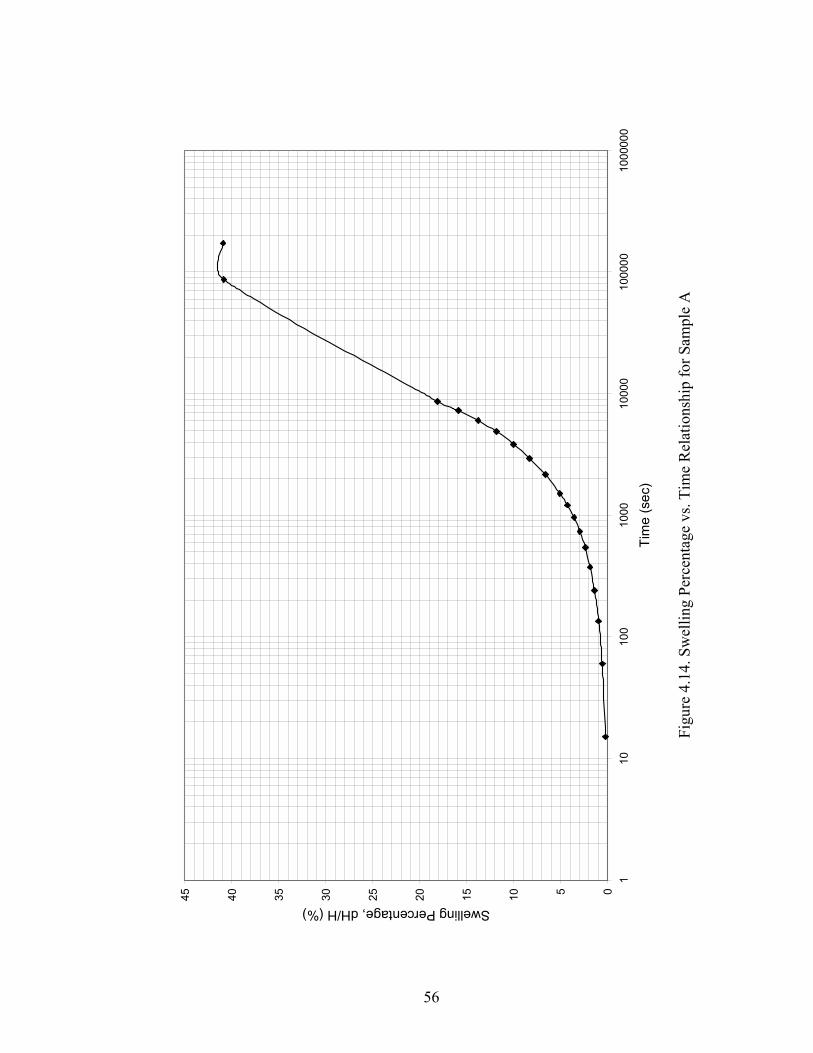
4.14. Swelling Percentage vs. Time Relationship for Sample A ……………. 56
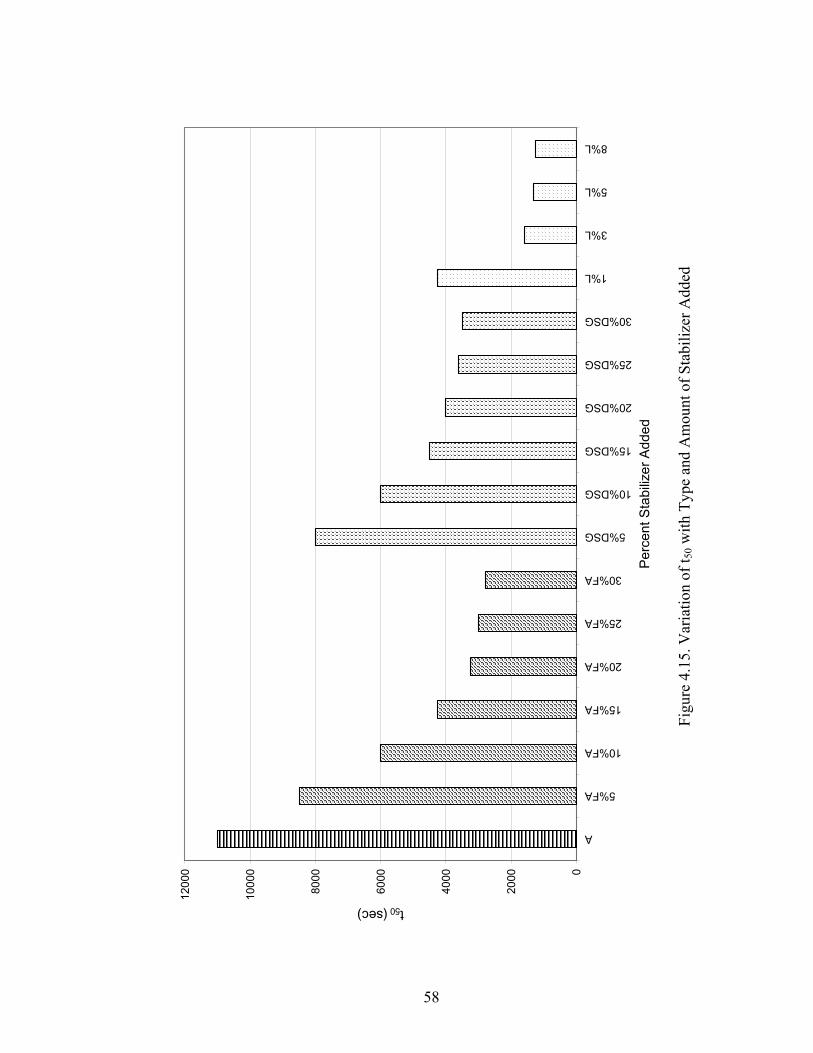
4.15. Variation of t50 with Type and Amount of Stabilizer Added ………….. 58
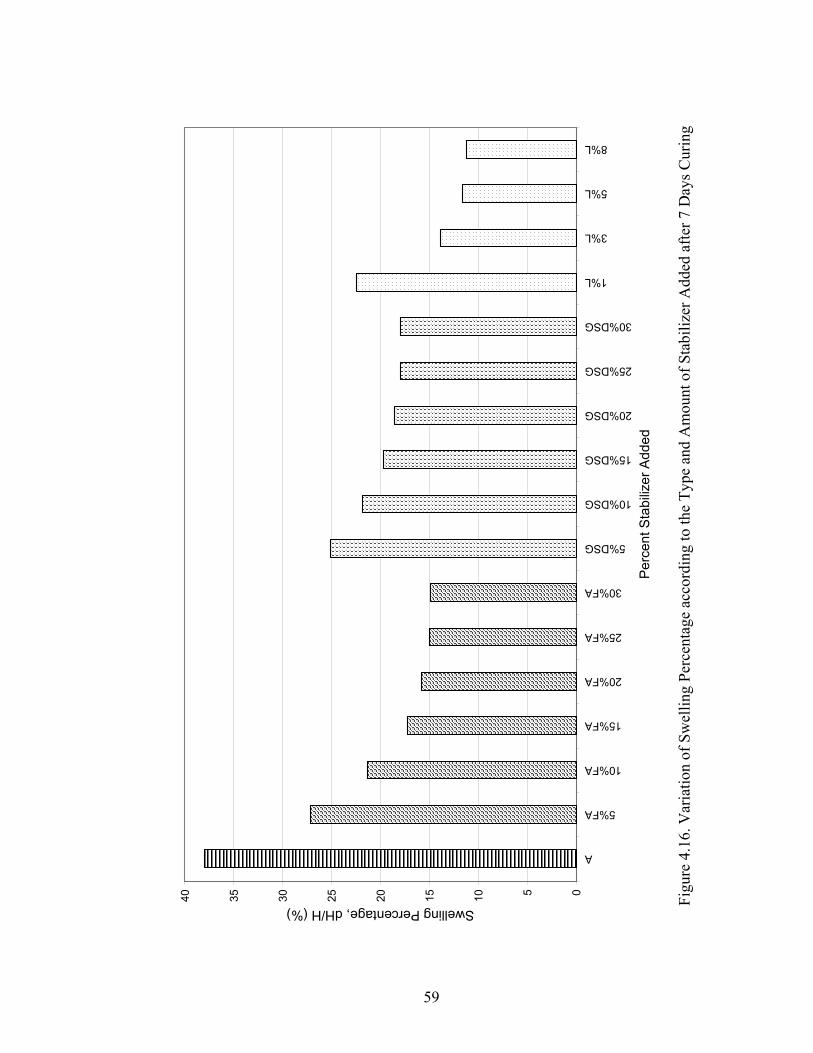
4.16. Variation of Swelling Percentage according to the Type and Amount
of Stabilizer Added after 7 Days Curing ……………………………… 59
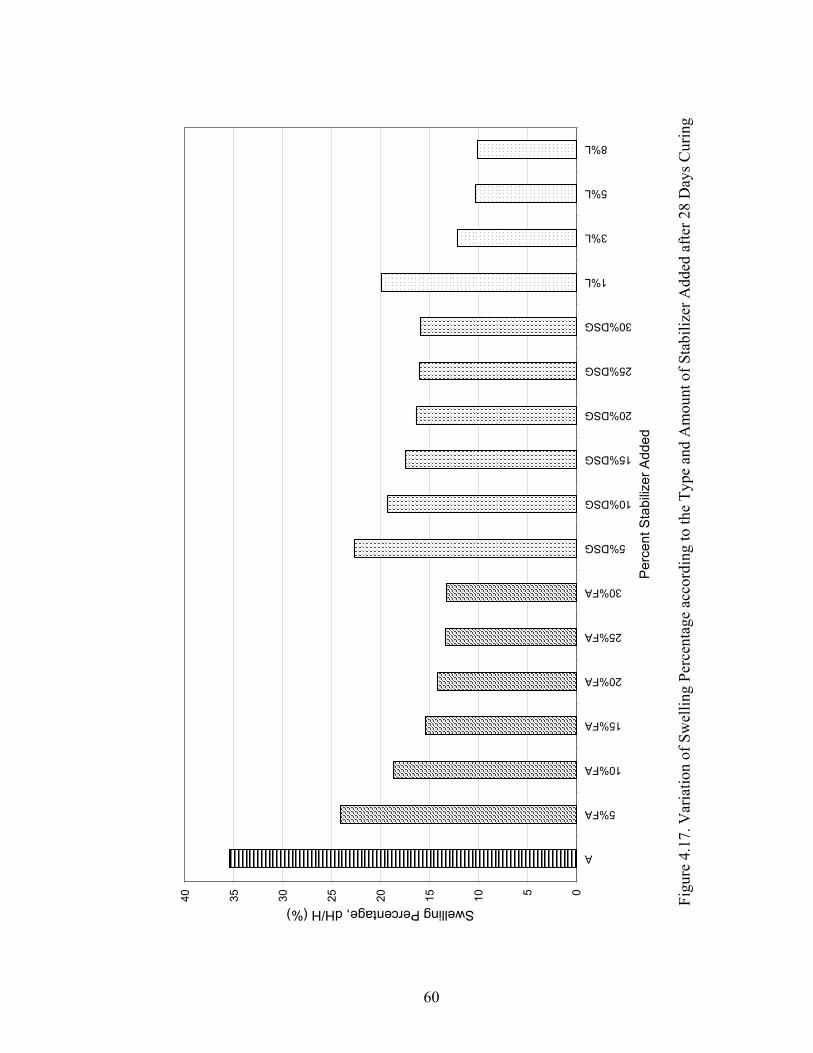
4.17. Variation of Swelling Percentage according to the Type and Amount
of Stabilizer Added after 28 Days Curing …………………………….. 60
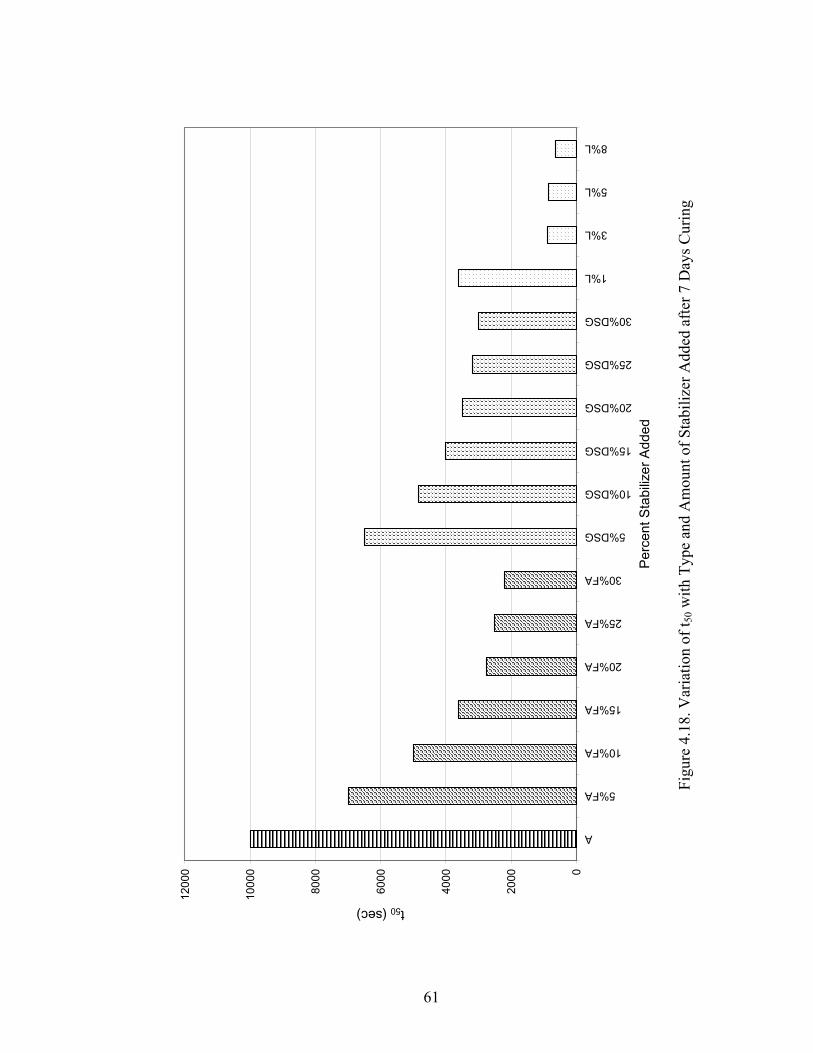
4.18. Variation of t50 with Type and Amount of Stabilizer Added after
7 Days Curing …………………………………………………………. 61
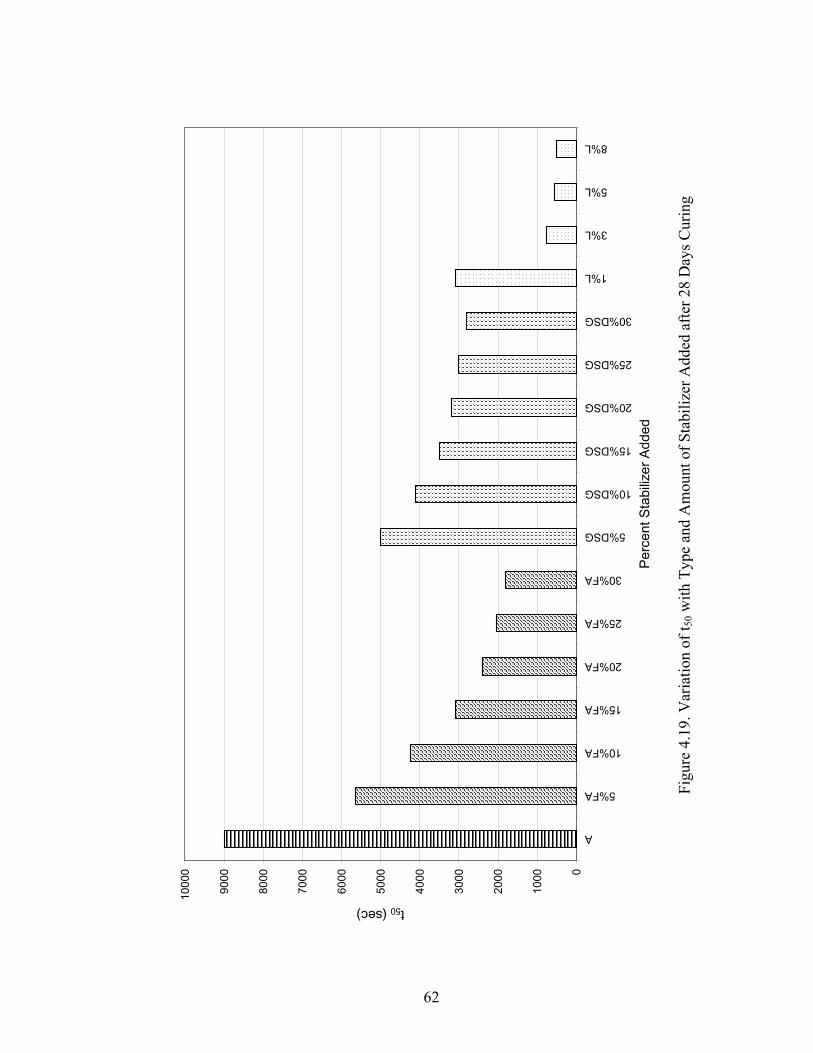
4.19. Variation of t50 with Type and Amount of Stabilizer Added after
28 Days Curing ………………………………………………………... 62
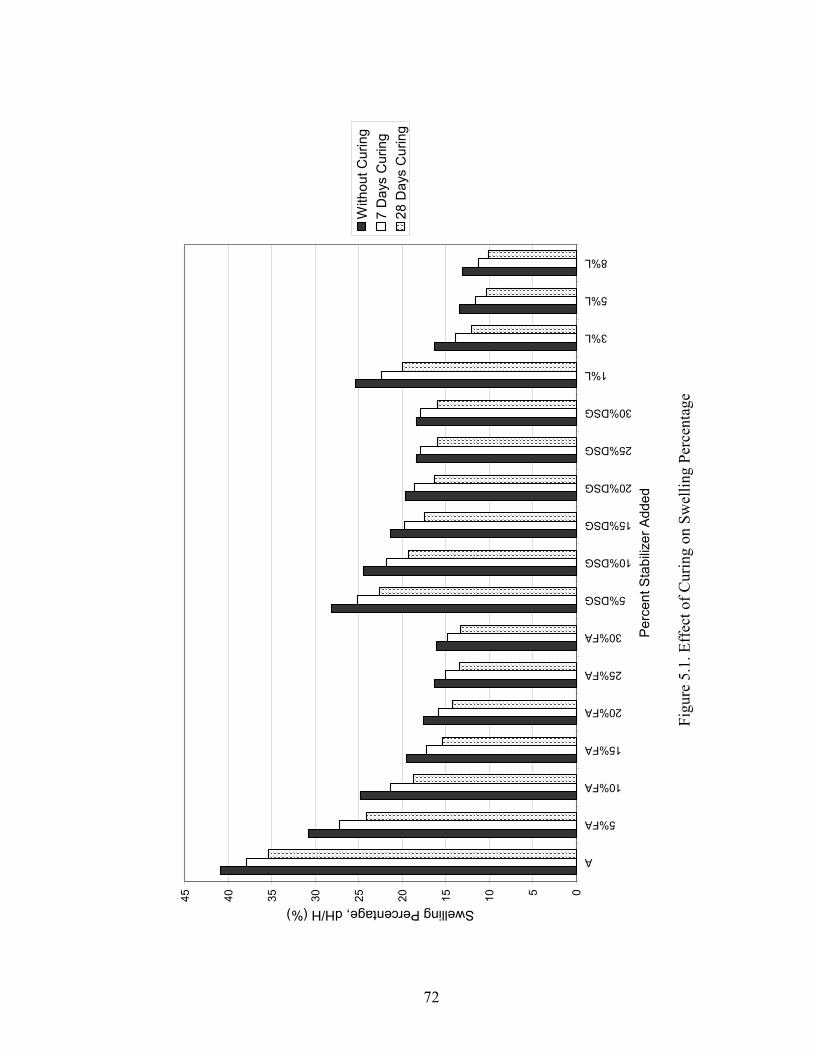
5.1. Effect of Curing on Swelling Percentage ……………………………….. 72
5.2. Effect of Curing on Rate of Swell ………………………………………. 73
A.1. Swelling Percentage vs. Time Relationship for Sample 5%FA ………… 83
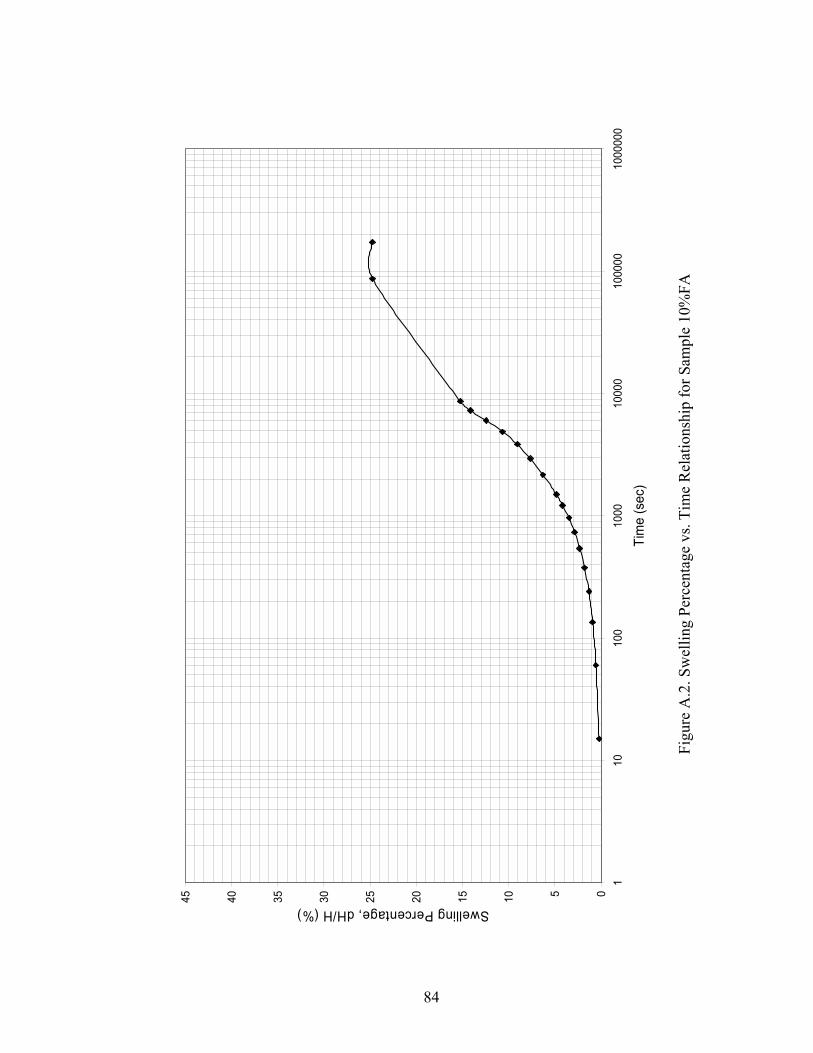
A.2. Swelling Percentage vs. Time Relationship for Sample 10%FA ………. 84
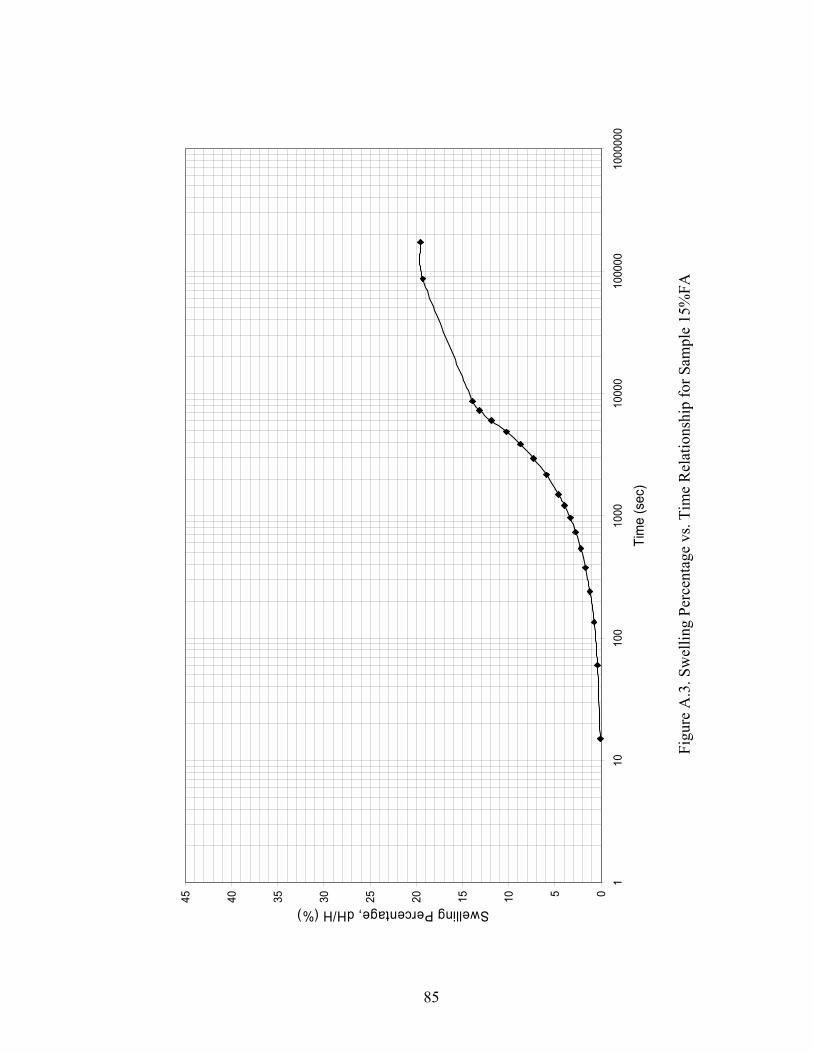
A.3. Swelling Percentage vs. Time Relationship for Sample 15%FA ………. 85
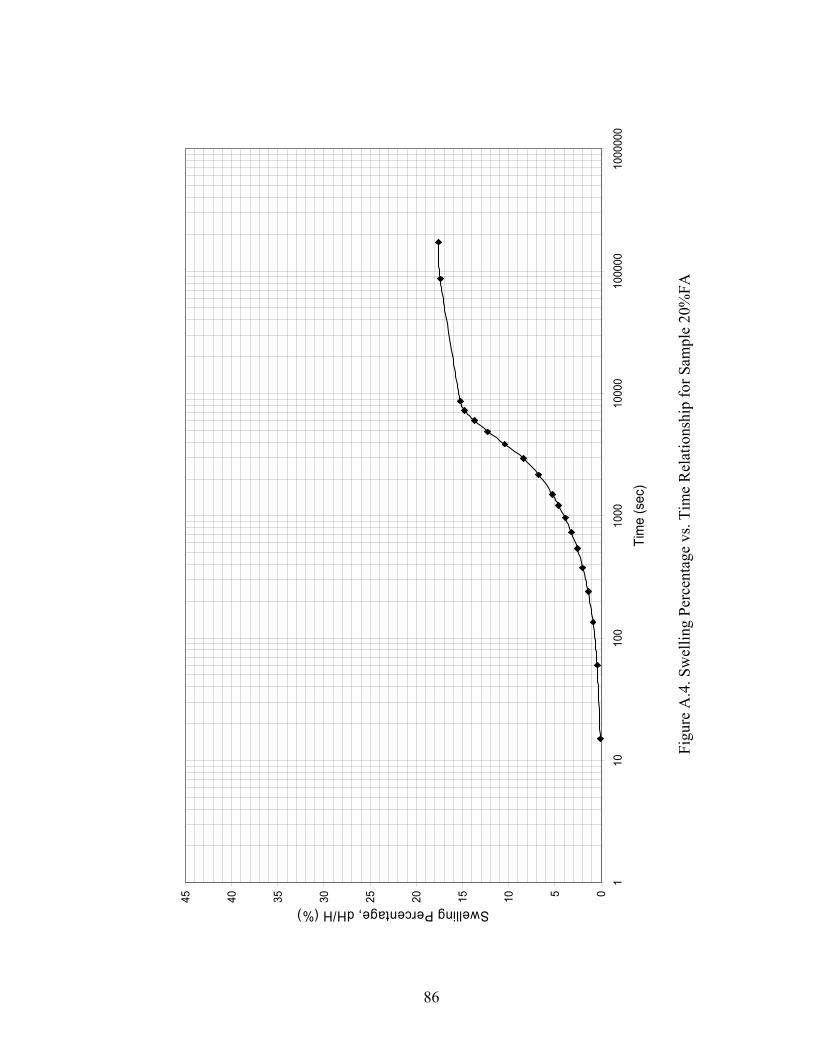
A.4. Swelling Percentage vs. Time Relationship for Sample 20%FA ………. 86
A.5. Swelling Percentage vs. Time Relationship for Sample 25%FA ………. 87
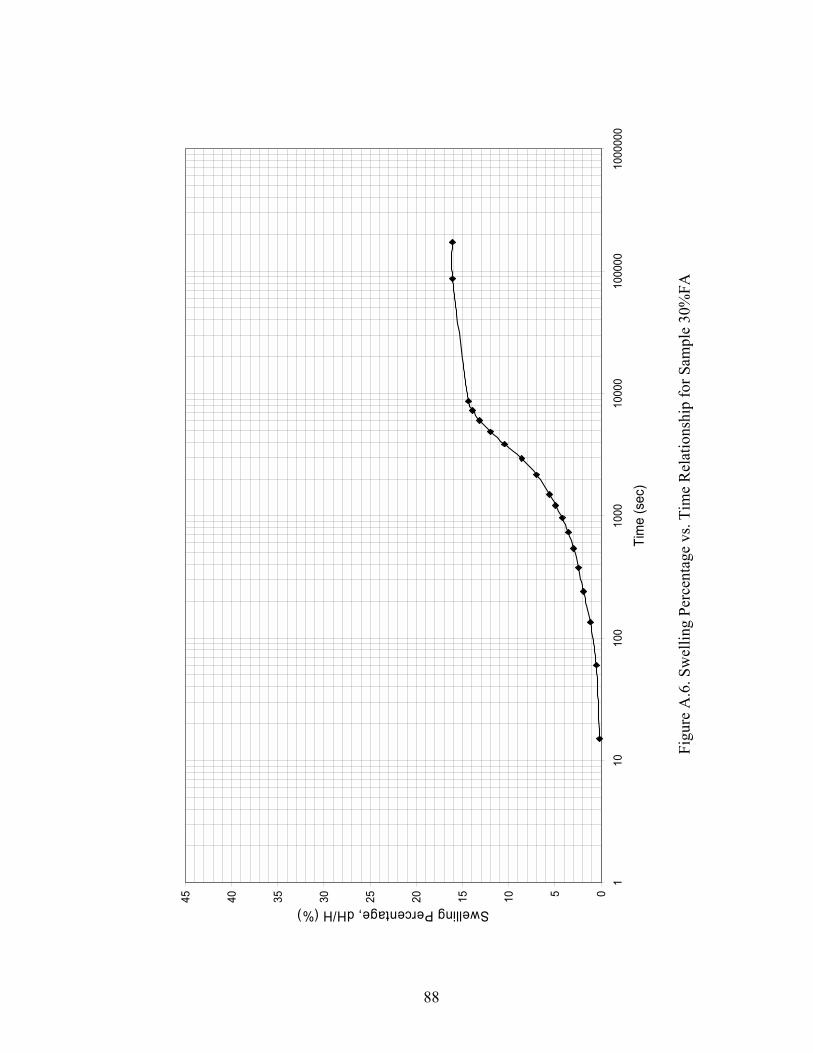
A.6. Swelling Percentage vs. Time Relationship for Sample 30%FA ………. 88
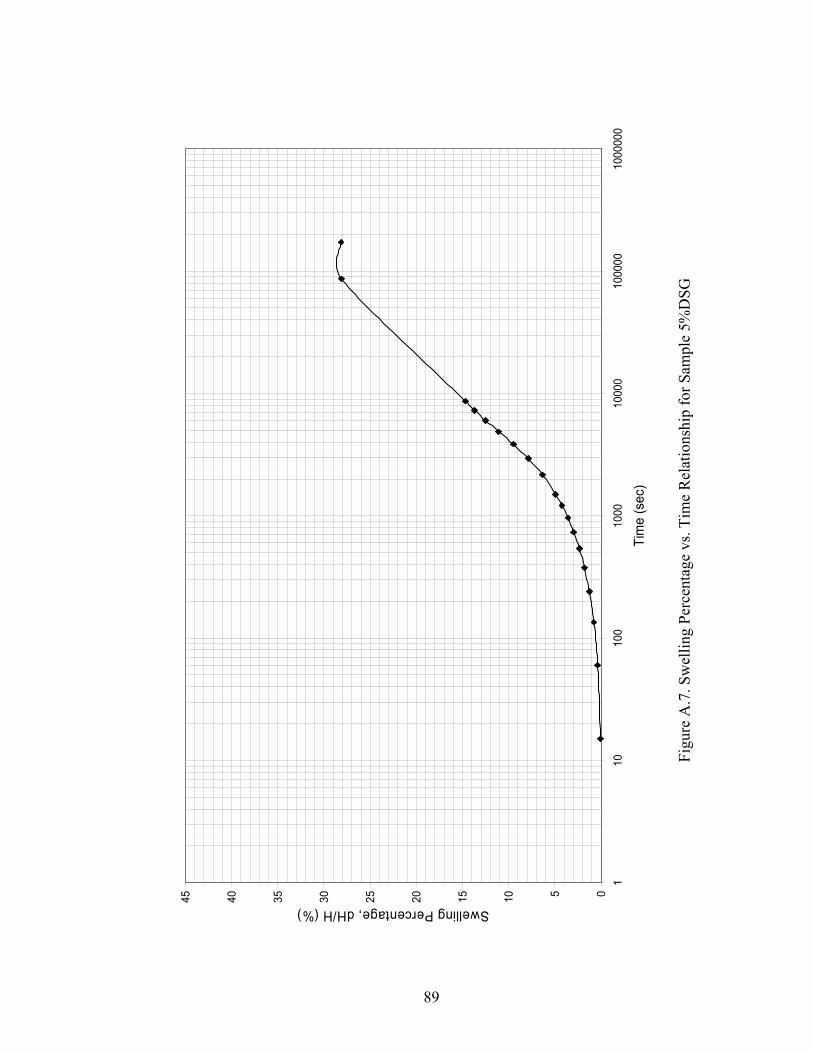
A.7. Swelling Percentage vs. Time Relationship for Sample 5%DSG …….... 89
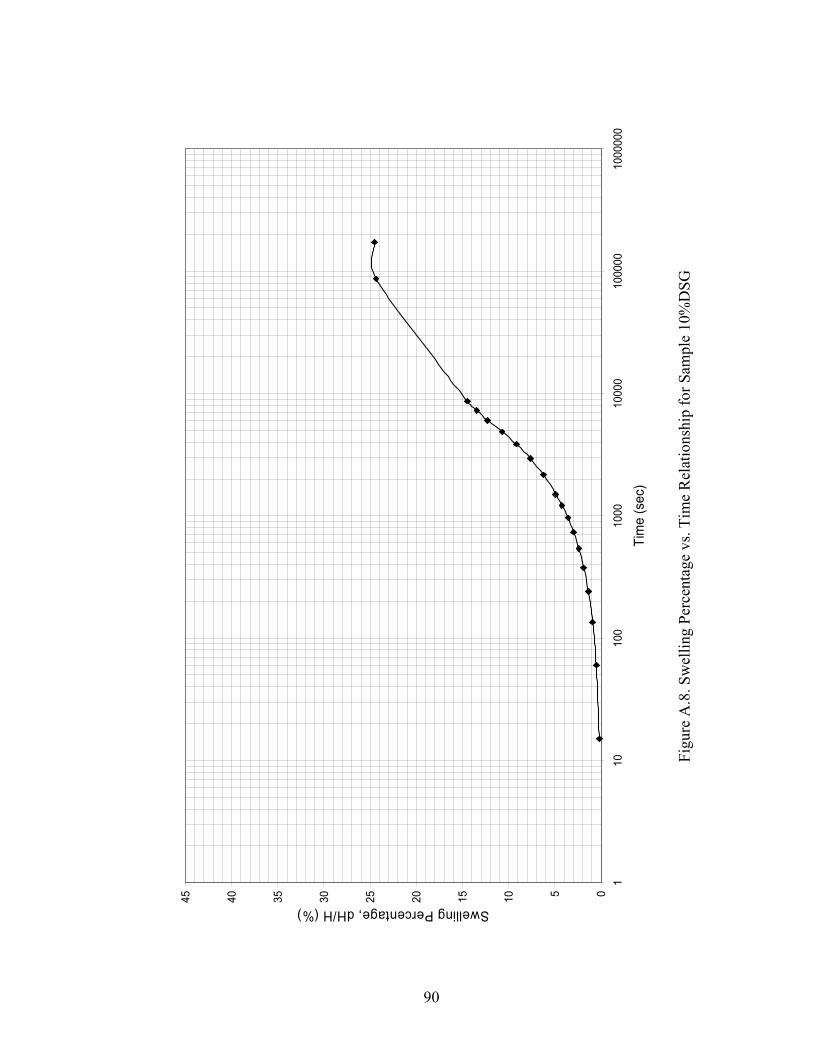
A.8. Swelling Percentage vs. Time Relationship for Sample 10%DSG …….. 90
xv
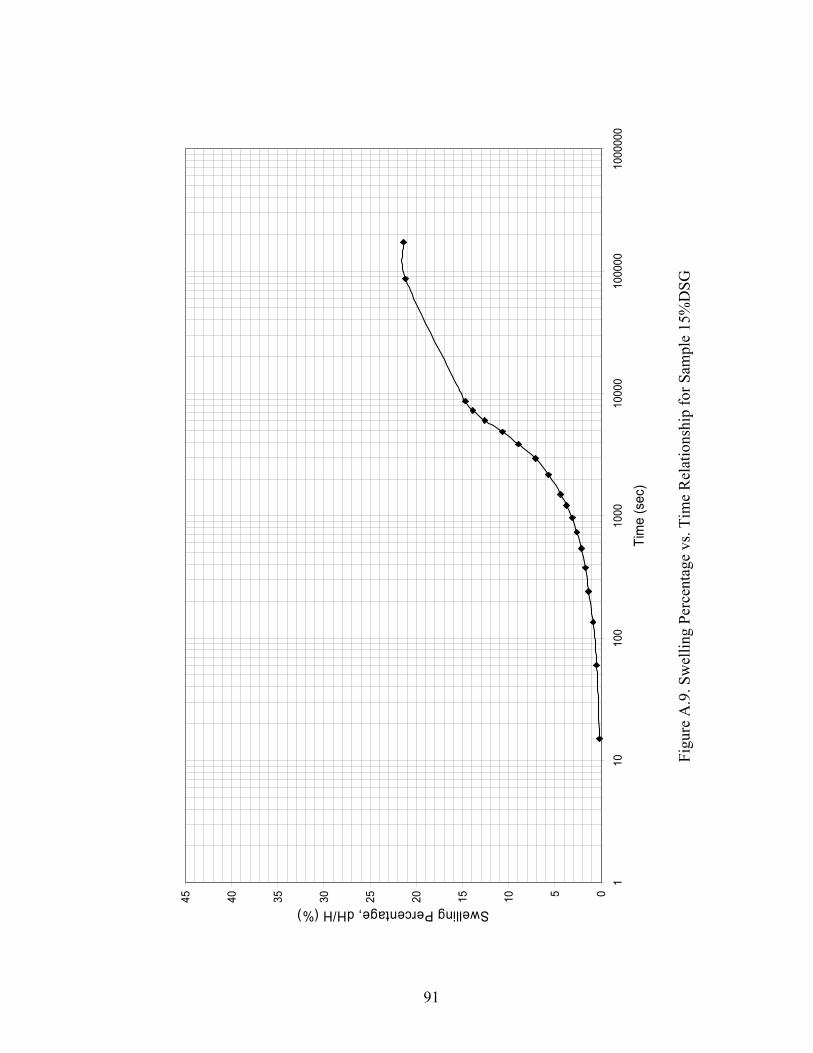
A.9. Swelling Percentage vs. Time Relationship for Sample 15%DSG …….. 91
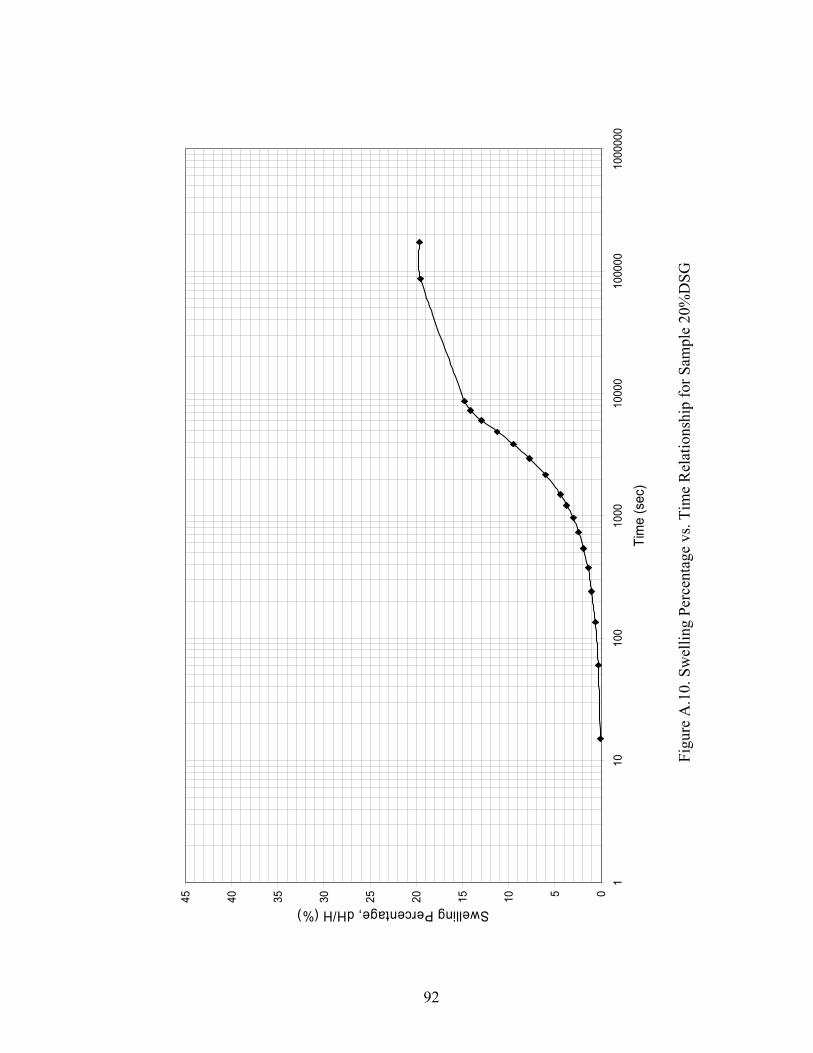
A.10. Swelling Percentage vs. Time Relationship for Sample 20%DSG ….... 92
A.11. Swelling Percentage vs. Time Relationship for Sample 25%DSG …… 93
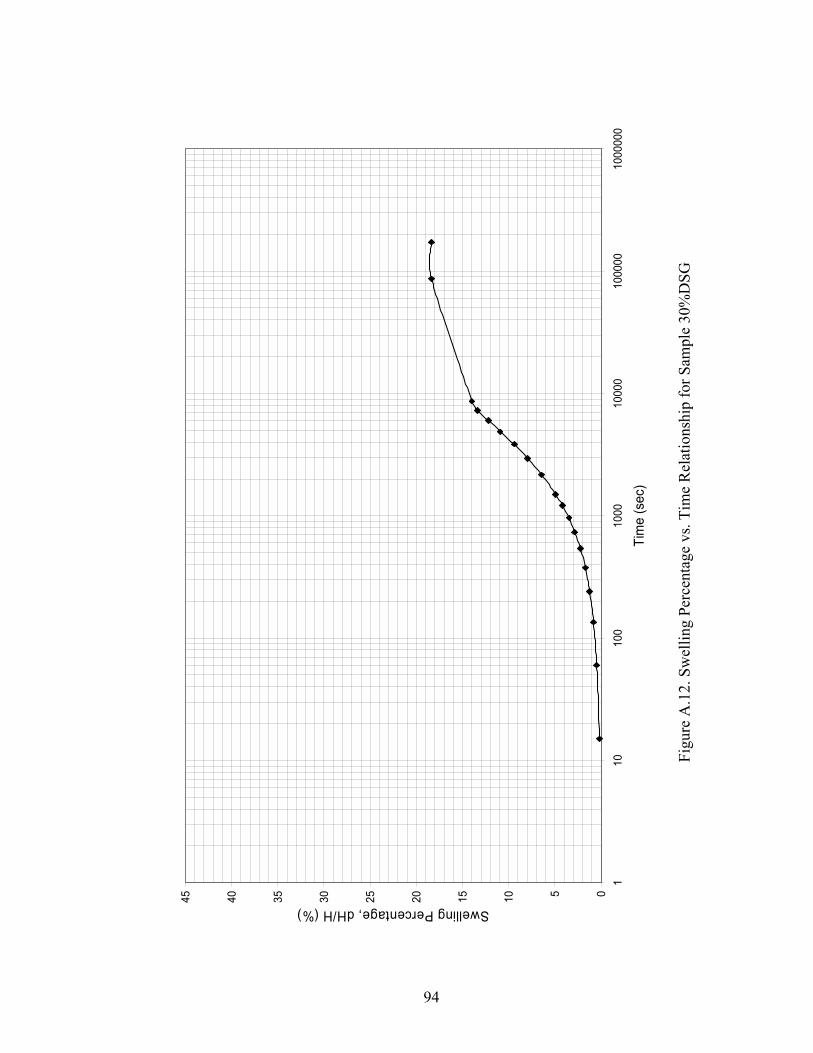
A.12. Swelling Percentage vs. Time Relationship for Sample 30%DSG …… 94
A.13. Swelling Percentage vs. Time Relationship for Sample 1%L ……….. 95
A.14. Swelling Percentage vs. Time Relationship for Sample 3%L ……….. 96
A.15. Swelling Percentage vs. Time Relationship for Sample 5%L ……….. 97
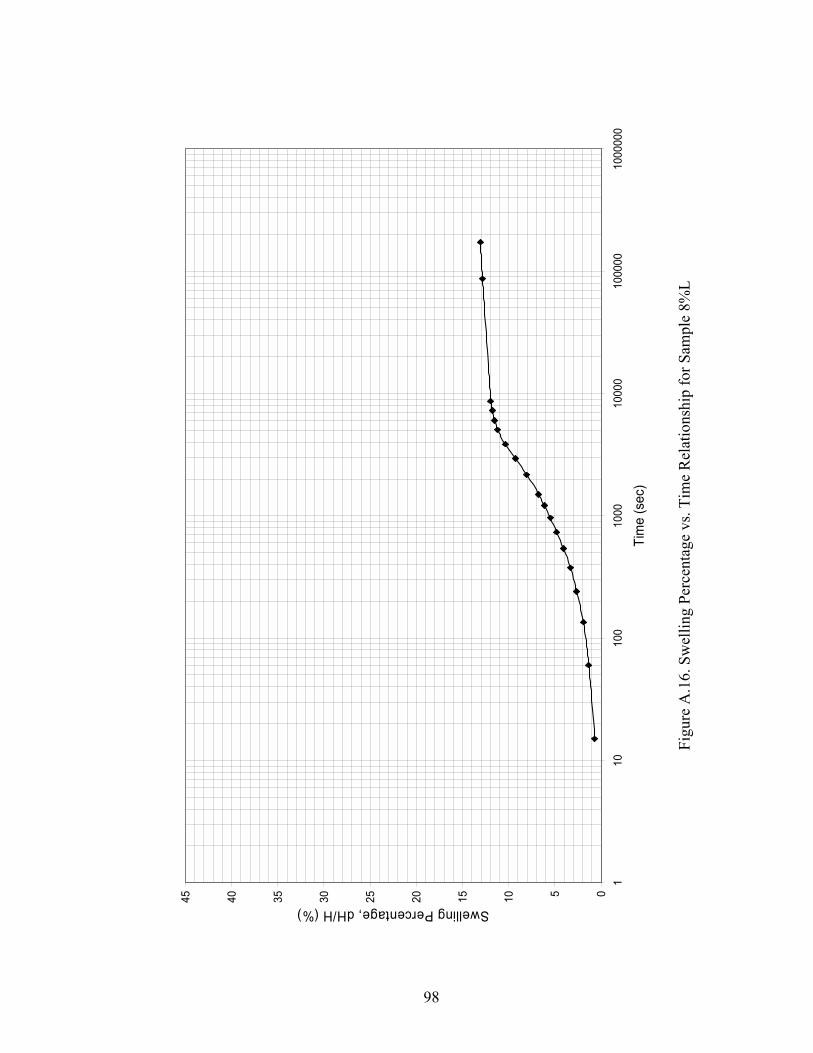
A.16. Swelling Percentage vs. Time Relationship for Sample 8%L ……….. 98
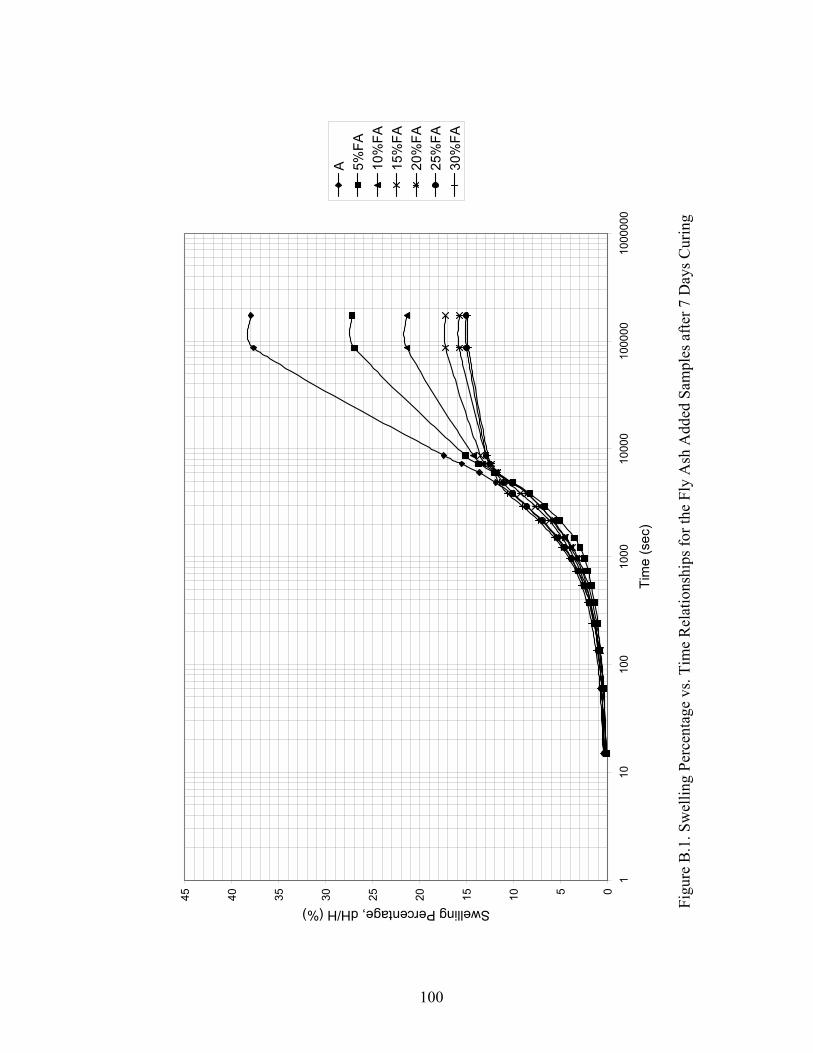
B.1. Swelling Percentage vs. Time Relationships for the Fly Ash Added
Samples after 7 Days Curing …………………………………………… 100
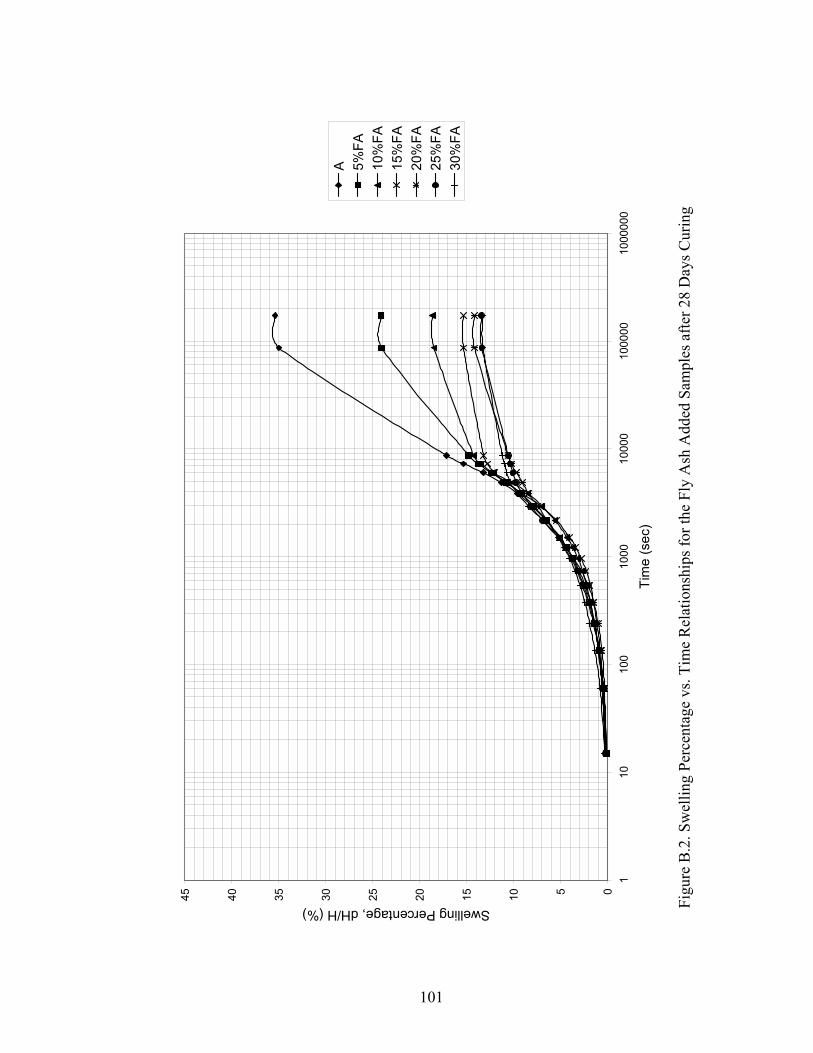
B.2. Swelling Percentage vs. Time Relationships for the Fly Ash Added
Samples after 28 Days Curing ………………………………………….. 101
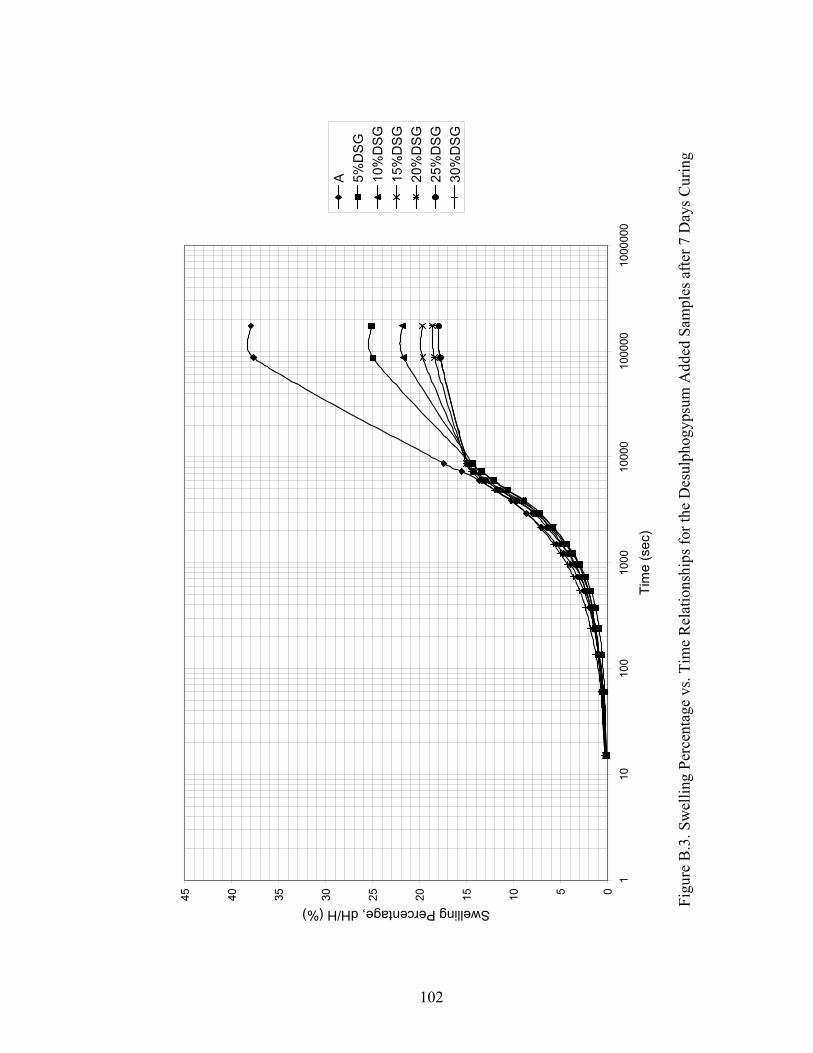
B.3. Swelling Percentage vs. Time Relationships for the Desulphogypsum
Added Samples after 7 Days Curing …………………………………… 102
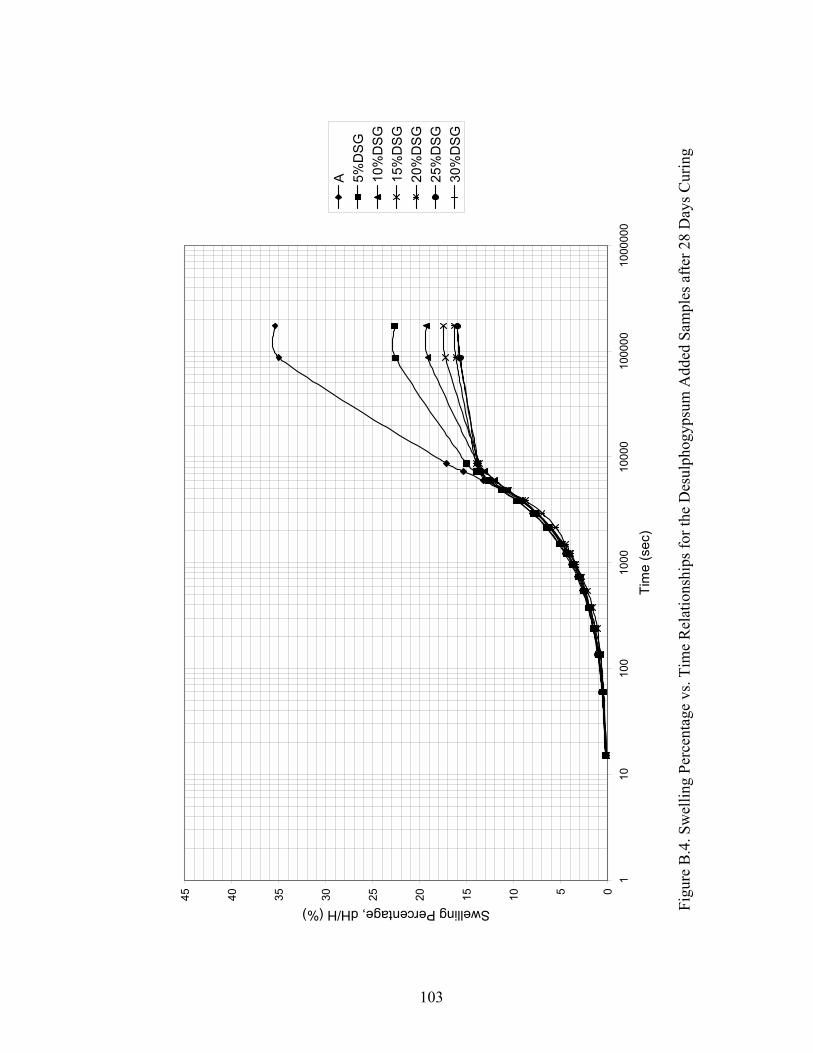
B.4. Swelling Percentage vs. Time Relationships for the Desulphogypsum
Added Samples after 28 Days Curing ………………………………….. 103
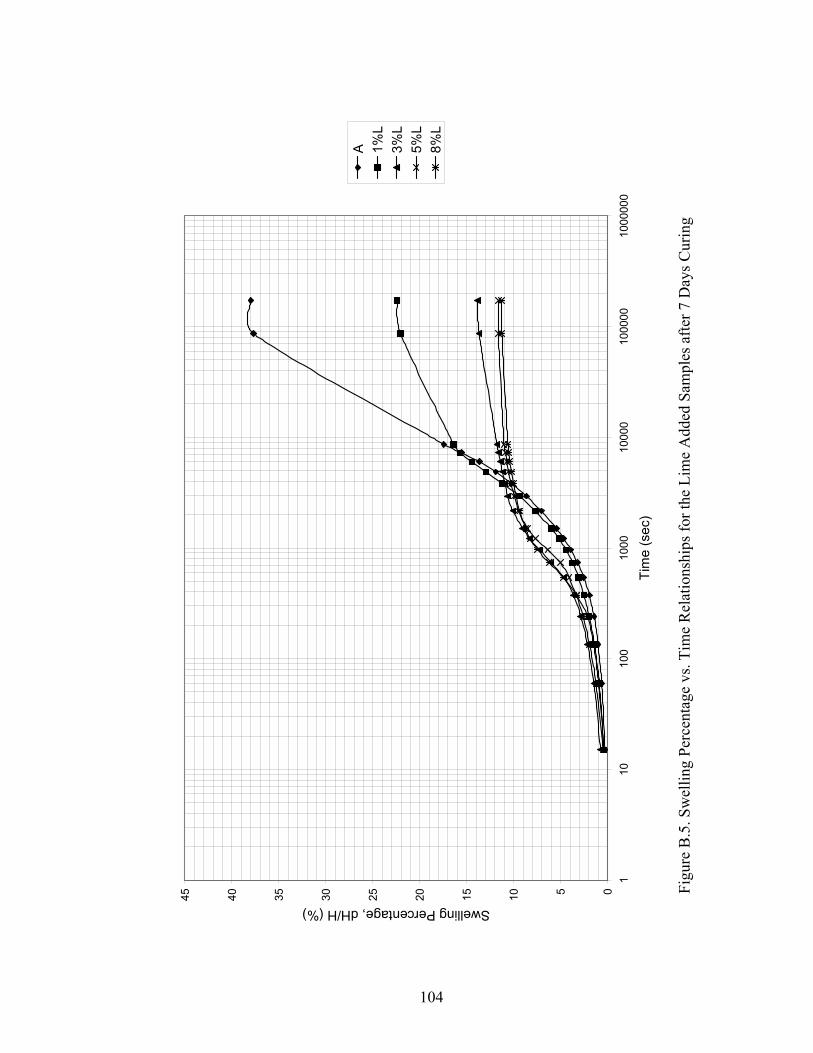
B.5. Swelling Percentage vs. Time Relationships for the Lime Added
Samples after 7 Days Curing …………………………………………… 104
B.6. Swelling Percentage vs. Time Relationships for the Lime Added
Samples after 28 Days Curing ………………………………………….. 105
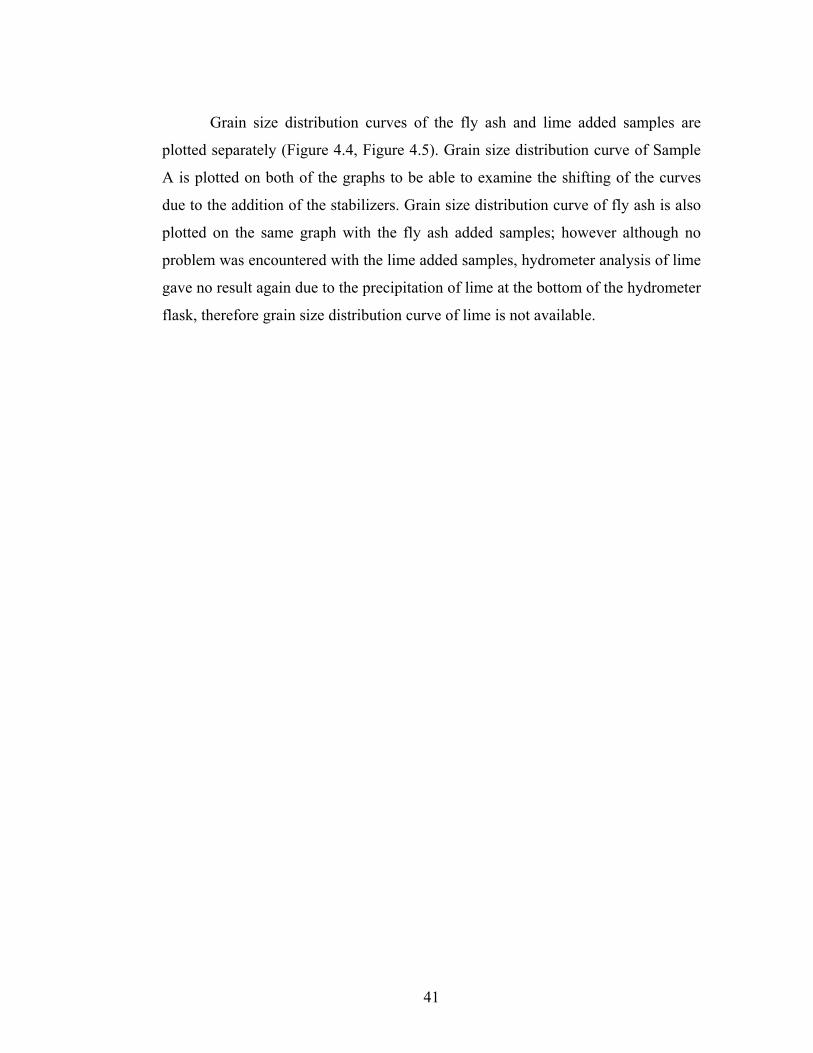
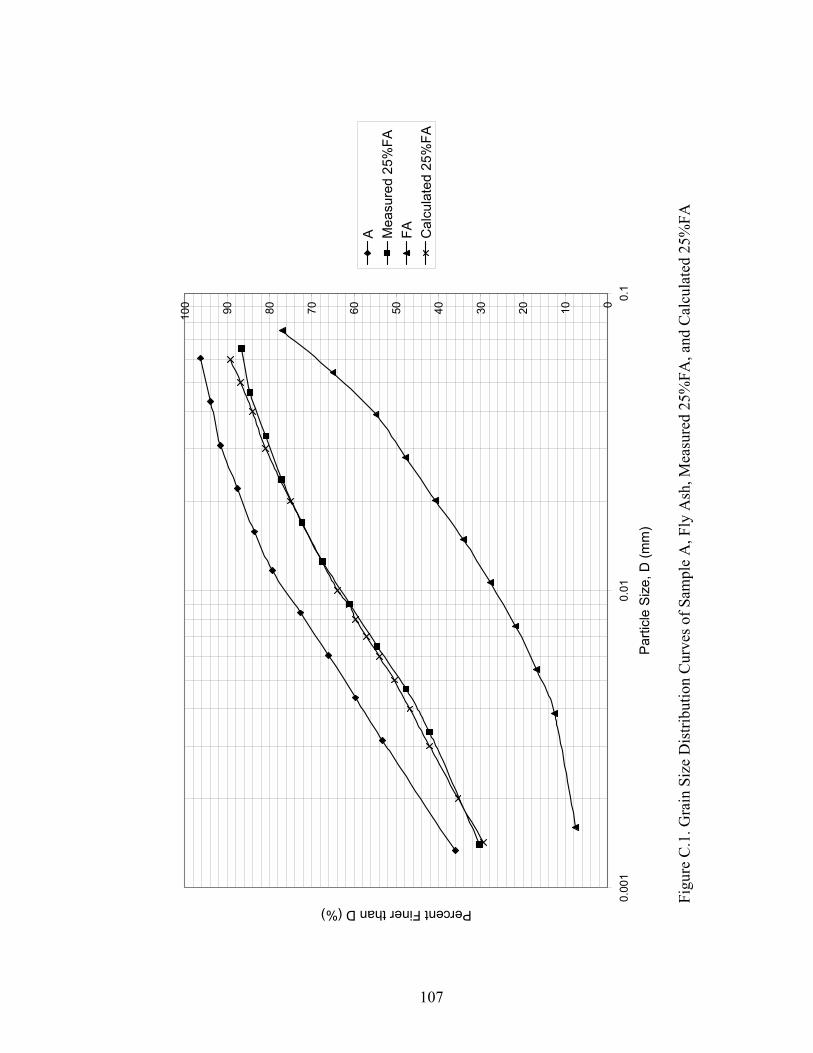
C.1. Grain Size Distribution Curves of Sample A, Fly Ash,
Measured 25%FA, and Calculated 25%FA …………………………….. 107
xvi
LIST OF ABBREVIATIONS
A: Sample A
ASTM: American Society for Testing and Materials
CH: Inorganic clays of high plasticity
CL: Inorganic clays, silty clays, sandy clays of low plasticity
dH: Change in initial height of the sample
DSG: Desulphogypsum
FA: Fly ash
Gs: Specific gravity
H: Initial height of the sample
L: Lime
LL: Liquid limit
MH: Inorganic silts of high plasticity
ML: Inorganic silts, silty or clayey fine sands, with slight plasticity
PI: Plasticity index
PL: Plastic limit
SI: Shrinkage index
SL: Shrinkage limit
t50: Time to reach fifty percent swell
1
CHAPTER 1
INTRODUCTION
Expansive soils are a worldwide problem that poses several challenges for
civil engineers. They are considered a potential natural hazard, which can cause
extensive damage to structures if not adequately treated. Such soils swell when
given an access to water and shrink when they dry out (Al-Rawas et al. 2002).
In general, expansive soils have high plasticity, and are relatively stiff or
dense. The expansive nature of soil is most obvious near the ground surface where
the profile is subjected to seasonal, environmental changes. The pore water pressure
is initially negative and the deposit is generally unsaturated. These soils often have
some montmorillonite clay mineral present. The higher the amount of monovalent
cations absorbed to the clay mineral (e.g. sodium), the more severe the expansive
soil problem (Fredlund and Rahardjo, 1993).
Expansive soils have been reported from many parts of the world, mainly in
the arid or semi-arid regions of the tropical and temperate zones like Africa,
Australia, India, South America, United States, and some regions in Canada. This
never means that expansive soils do not exist elsewhere, because they can be found
almost everywhere. However, in the humid regions water tables are generally at
shallow depth and moisture changes, which are responsible for volume changes in
soils, are minimal excepting under extended drought conditions (Arnold, 1984;
Shuai and Fredlund, 1998; Wayne et al. 1984).
2
The problems with foundations on expansive soils have included heaving,
cracking and break-up of pavements, roadways, building foundations, slab-on-grade
members, channel and reservoir linings, irrigation systems, water lines, and sewer
lines (Çokça, 2001).
It is reported that damage to the structures due to expansive soils has been
the most costly natural hazard in some countries (in United States more than the
cost of damage from floods, hurricanes, tornadoes, and earthquakes on an average
annual basis) for years (Kehew, 1995; Shuai and Fredlund, 1998).
Laboratory tests have to be carried out to determine the swelling properties
of such soils before a structure can be designed for such sites, and stabilization
methods must be investigated prior to construction to eliminate possible future
problems. One of the most effective and economical methods to prevent volume
changes of an expansive clay soil is through the use of chemical additives. Lime
and cement have been used for this purpose for many years.
On the other hand, the increasing demand for energy has resulted in
construction of many coal-fired power plants in Turkey. This development brought
it with the problem of safe disposal or beneficial utilization of large quantities of
by-products from these power plants (Çokça, 2001). Çayırhan Thermal Power Plant
is located at 120 km from Ankara and 22 km from Beypazarı. The plant covers a
total area of 5,032,000 m2. It has four boiler units, two of them (Units I and II) with
150 MW capacity and two of them (Units III and IV) with 160MW capacity. Units I
and II have been working since 1987 and Units III and IV have been working since
1998. All of the four units are equipped with flue gas desulphurization systems.
These four units, with a total capacity of 620MW, use 5,000,000 tons of lignite coal
and generate 4,200,000,000 kW-h electricity per year. The lignite coal, extracted
from the underground mines of the Beypazarı Basin, is of low calorific value (2200
kcal/kg), high dust (30 – 45%), and high sulphur (4 – 5%) content. As a result of
3
their electricity generation the four units of Çayırhan Thermal Power Plant produce
1,350,000 tons of fly ash and 680,000 tons of desulphogypsum annually. Fly ash
and desulphogypsum are collected by means of electrostatic precipitators and are
sent through 2.5 km transfer bands into open stock areas which now cover a total
area of 1,137,000 m2. Less than 1% of fly ash and none of the desulphogypsum is
productively employed. The plant is estimated to work for minimum another 20
years, and it is conceivable to mention that this will duplicate the fly ash and
desulphogypsum stocks. These stocks pose a serious problem in terms of both land
use and potential environmental pollution. An effective utilization of these
industrial by-products must be regarded as economically and environmentally
beneficial.
In this study, the expansive soil was stabilized using the fly ash and
desulphogypsum obtained from Çayırhan Thermal Power Plant. Lime was used to
see how effective fly ash and desulphogypsum on expansive soil stabilization were.
An extensive laboratory testing program was undertaken to provide information on
the geotechnical properties of expansive soils treated with Çayırhan fly ash and
desulphogypsum, and lime.
4
CHAPTER 2
REVIEW OF EXPANSIVE SOILS
The term expansive soil applies to soils, which have the tendency to swell
when their moisture content is allowed to increase. The moisture may come from
rain, flooding, leaking water or sewer lines, or from a reduction in surface
evapotranspiration when an area is covered by a building or pavement. The term
cracking soils is also used for these soils since they have the tendency to shrink and
crack when the moisture is allowed to decrease. Soils containing the clay mineral
montmorillonite generally exhibit these properties (Komine and Ogata, 1996; Rao
and Triphaty, 2003; Sivapullaiah et al. 1996; Wayne et al. 1984).
There are many correlations that are useful in identifying potentially
expansive soils. It may also be possible to identify them visually. Visual indications
include (Wayne et al. 1984):
1) Wide and deep shrinkage cracks occurring during dry periods
2) Soil is rock-hard when dry, but very sticky and soft when wet
3) Damages on the surrounding structures due to expansion of soil
2.1. Structure of Clay Minerals
Clay minerals are primarily the end product of the chemical weathering of
feldspathic rock. Chemically, these minerals are essentially hydrous aluminum
silicates, although occasionally the aluminum atoms are replaced with atoms of
5
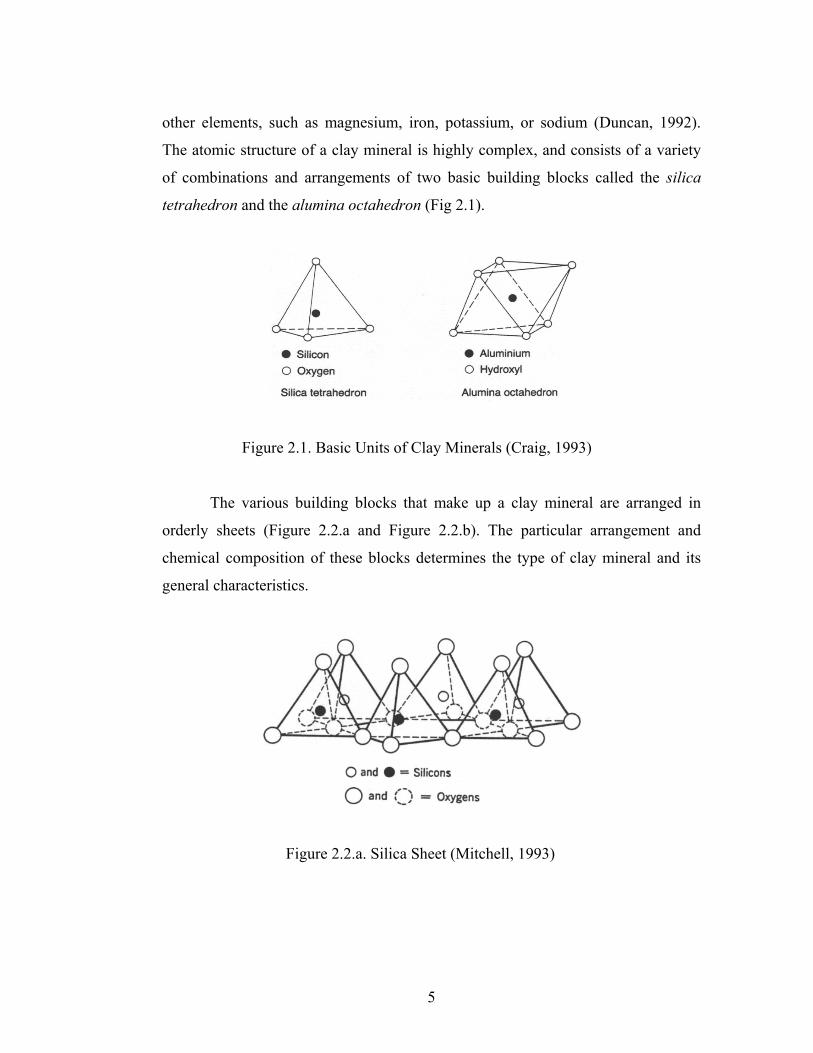
other elements, such as magnesium, iron, potassium, or sodium (Duncan, 1992).
The atomic structure of a clay mineral is highly complex, and consists of a variety
of combinations and arrangements of two basic building blocks called the silica
tetrahedron and the alumina octahedron (Fig 2.1).
Figure 2.1. Basic Units of Clay Minerals (Craig, 1993)
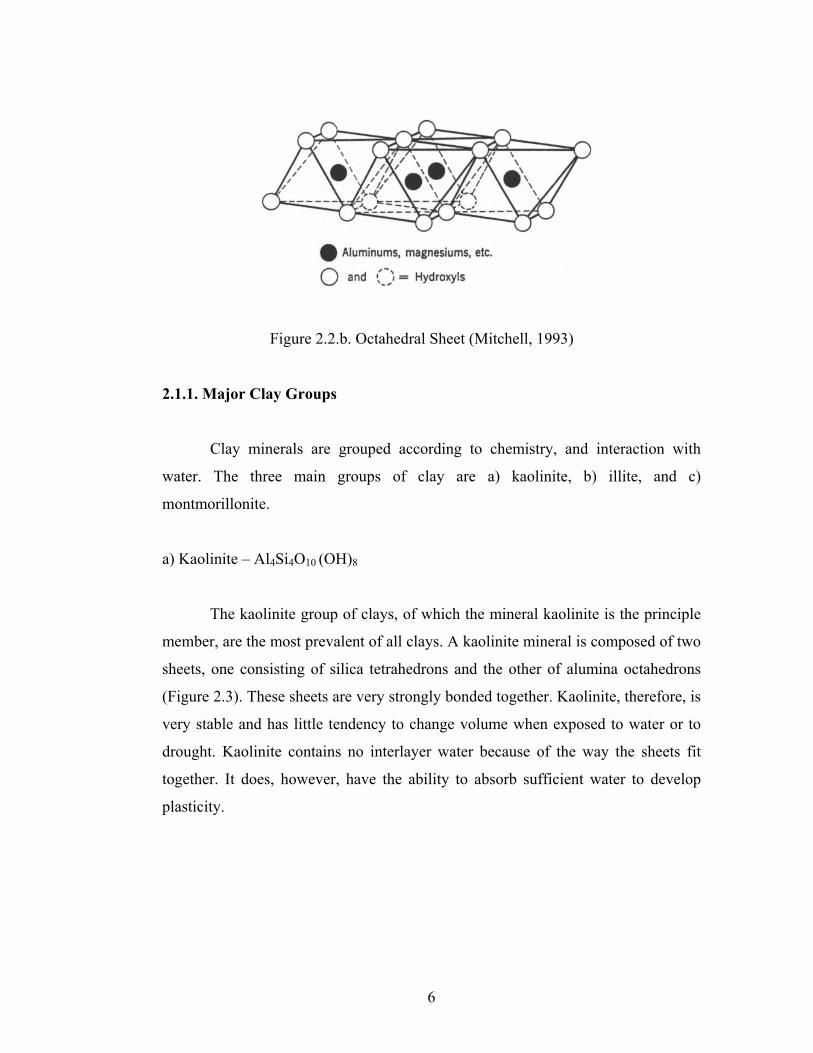
The various building blocks that make up a clay mineral are arranged in
orderly sheets (Figure 2.2.a and Figure 2.2.b). The particular arrangement and
chemical composition of these blocks determines the type of clay mineral and its
general characteristics.
Figure 2.2.a. Silica Sheet (Mitchell, 1993)
6
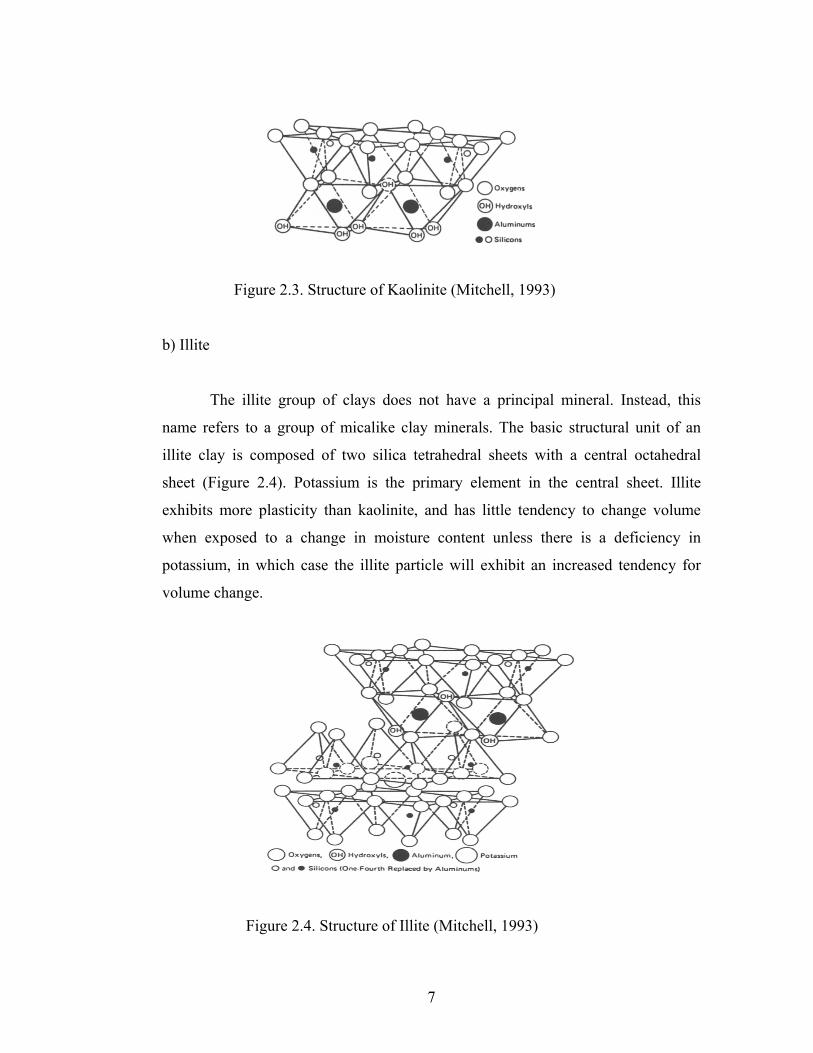
Figure 2.2.b. Octahedral Sheet (Mitchell, 1993)
2.1.1. Major Clay Groups
Clay minerals are grouped according to chemistry, and interaction with
water. The three main groups of clay are a) kaolinite, b) illite, and c)
montmorillonite.
a) Kaolinite – Al4Si4O10 (OH)8
The kaolinite group of clays, of which the mineral kaolinite is the principle
member, are the most prevalent of all clays. A kaolinite mineral is composed of two
sheets, one consisting of silica tetrahedrons and the other of alumina octahedrons
(Figure 2.3). These sheets are very strongly bonded together. Kaolinite, therefore, is
very stable and has little tendency to change volume when exposed to water or to
drought. Kaolinite contains no interlayer water because of the way the sheets fit
together. It does, however, have the ability to absorb sufficient water to develop
plasticity.
7
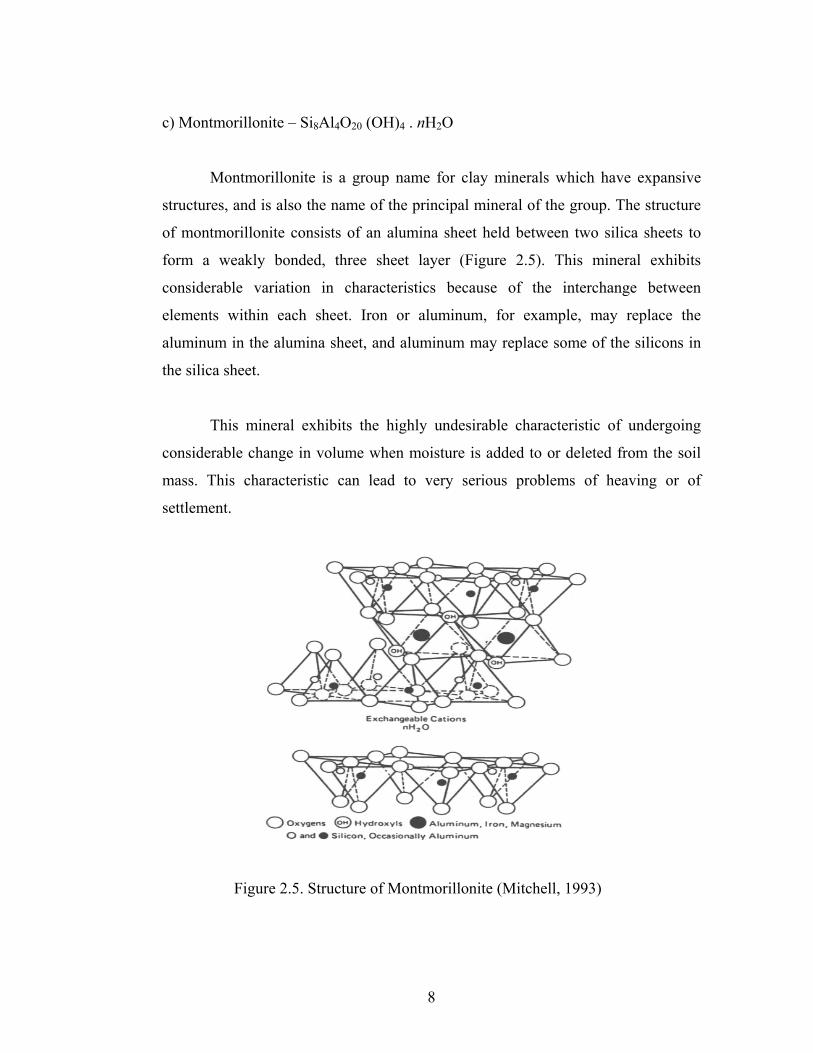
Figure 2.3. Structure of Kaolinite (Mitchell, 1993)
b) Illite
The illite group of clays does not have a principal mineral. Instead, this
name refers to a group of micalike clay minerals. The basic structural unit of an
illite clay is composed of two silica tetrahedral sheets with a central octahedral
sheet (Figure 2.4). Potassium is the primary element in the central sheet. Illite
exhibits more plasticity than kaolinite, and has little tendency to change volume
when exposed to a change in moisture content unless there is a deficiency in
potassium, in which case the illite particle will exhibit an increased tendency for
volume change.
Figure 2.4. Structure of Illite (Mitchell, 1993)
8
c) Montmorillonite – Si8Al4O20 (OH)4 . nH2O
Montmorillonite is a group name for clay minerals which have expansive
structures, and is also the name of the principal mineral of the group. The structure
of montmorillonite consists of an alumina sheet held between two silica sheets to
form a weakly bonded, three sheet layer (Figure 2.5). This mineral exhibits
considerable variation in characteristics because of the interchange between
elements within each sheet. Iron or aluminum, for example, may replace the
aluminum in the alumina sheet, and aluminum may replace some of the silicons in
the silica sheet.
This mineral exhibits the highly undesirable characteristic of undergoing
considerable change in volume when moisture is added to or deleted from the soil
mass. This characteristic can lead to very serious problems of heaving or of
settlement.
Figure 2.5. Structure of Montmorillonite (Mitchell, 1993)
9
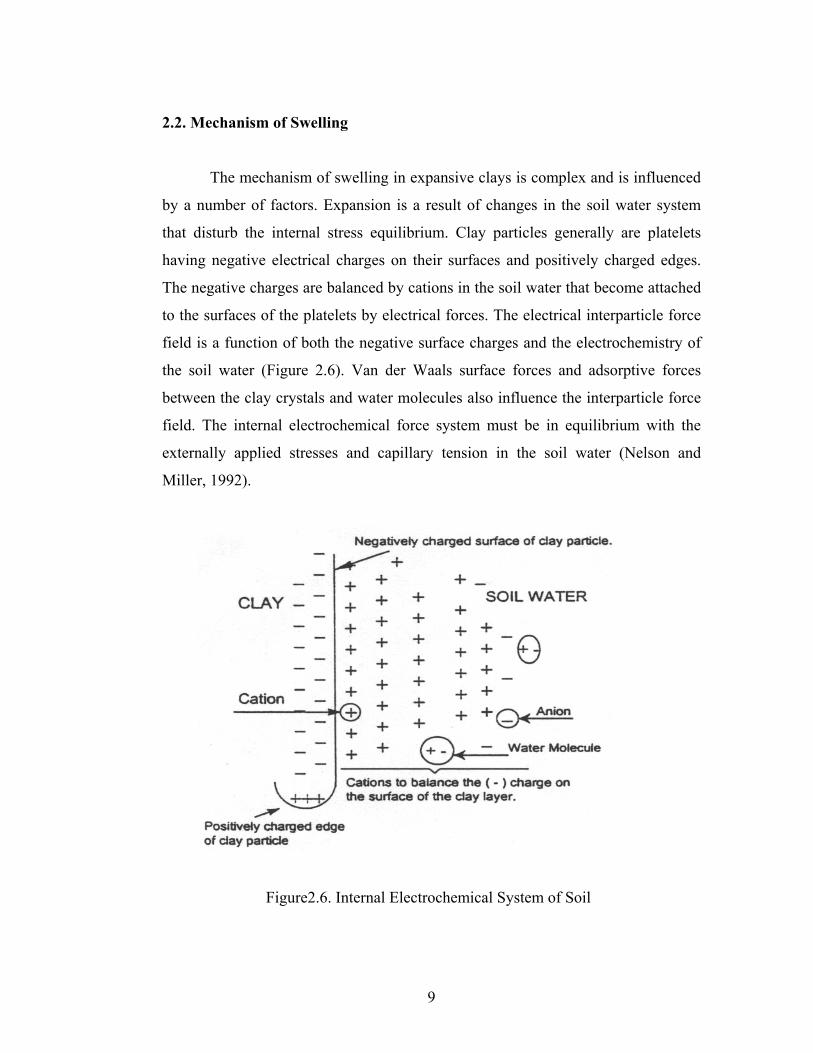
2.2. Mechanism of Swelling
The mechanism of swelling in expansive clays is complex and is influenced
by a number of factors. Expansion is a result of changes in the soil water system
that disturb the internal stress equilibrium. Clay particles generally are platelets
having negative electrical charges on their surfaces and positively charged edges.
The negative charges are balanced by cations in the soil water that become attached
to the surfaces of the platelets by electrical forces. The electrical interparticle force
field is a function of both the negative surface charges and the electrochemistry of
the soil water (Figure 2.6). Van der Waals surface forces and adsorptive forces
between the clay crystals and water molecules also influence the interparticle force
field. The internal electrochemical force system must be in equilibrium with the
externally applied stresses and capillary tension in the soil water (Nelson and
Miller, 1992).
Figure2.6. Internal Electrochemical System of Soil
10
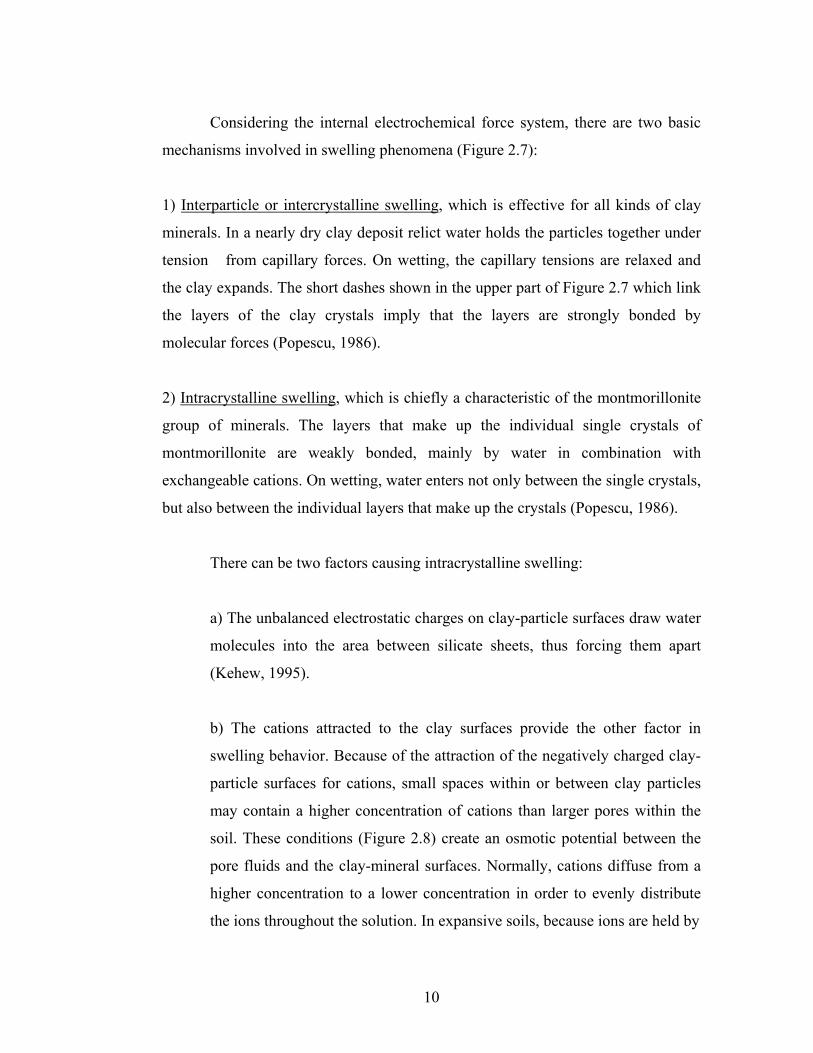
Considering the internal electrochemical force system, there are two basic
mechanisms involved in swelling phenomena (Figure 2.7):
1) Interparticle or intercrystalline swelling, which is effective for all kinds of clay
minerals. In a nearly dry clay deposit relict water holds the particles together under
tension from capillary forces. On wetting, the capillary tensions are relaxed and
the clay expands. The short dashes shown in the upper part of Figure 2.7 which link
the layers of the clay crystals imply that the layers are strongly bonded by
molecular forces (Popescu, 1986).
2) Intracrystalline swelling, which is chiefly a characteristic of the montmorillonite
group of minerals. The layers that make up the individual single crystals of
montmorillonite are weakly bonded, mainly by water in combination with
exchangeable cations. On wetting, water enters not only between the single crystals,
but also between the individual layers that make up the crystals (Popescu, 1986).
There can be two factors causing intracrystalline swelling:
a) The unbalanced electrostatic charges on clay-particle surfaces draw water
molecules into the area between silicate sheets, thus forcing them apart
(Kehew, 1995).
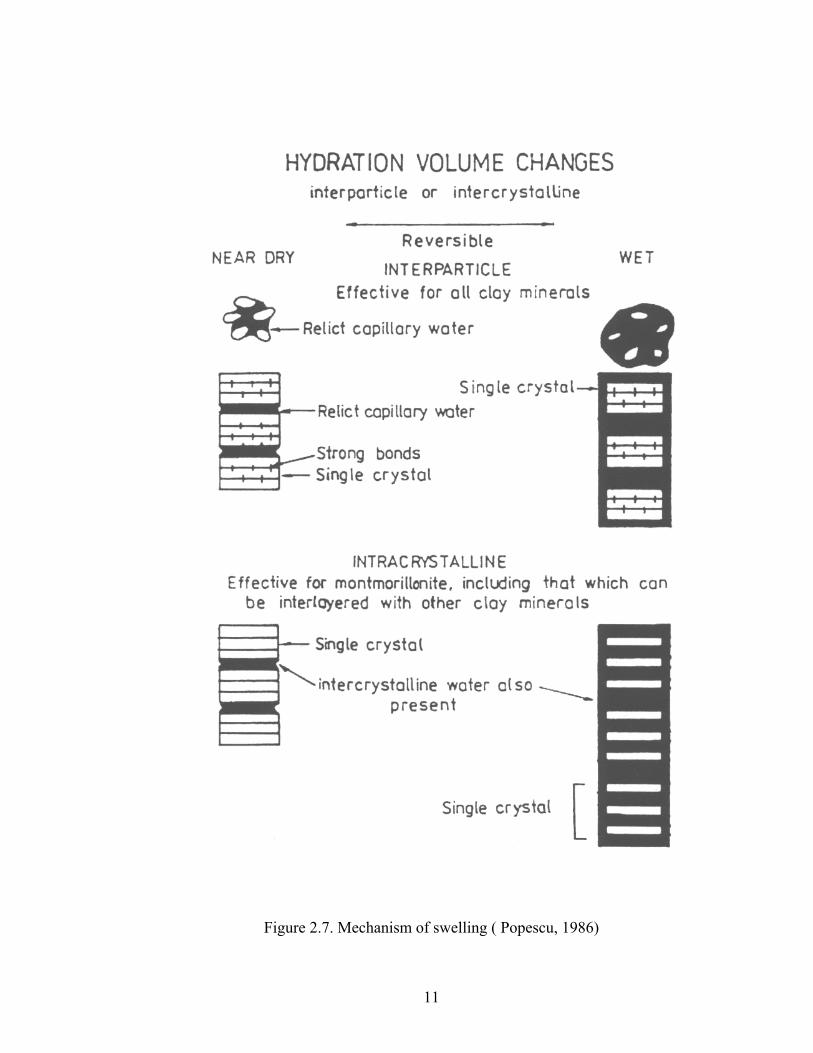
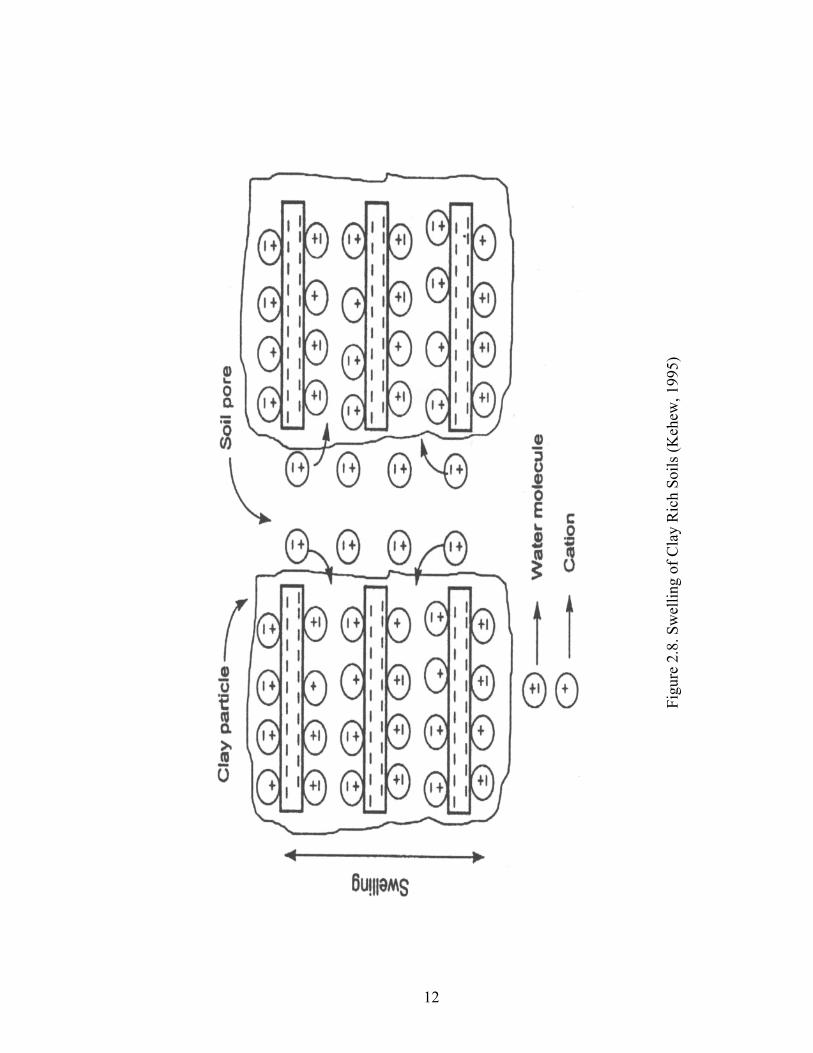
b) The cations attracted to the clay surfaces provide the other factor in
swelling behavior. Because of the attraction of the negatively charged clay-
particle surfaces for cations, small spaces within or between clay particles
may contain a higher concentration of cations than larger pores within the
soil. These conditions (Figure 2.8) create an osmotic potential between the
pore fluids and the clay-mineral surfaces. Normally, cations diffuse from a
higher concentration to a lower concentration in order to evenly distribute
the ions throughout the solution. In expansive soils, because ions are held by
11
Figure 2.7. Mechanism of swelling ( Popescu, 1986)
12
Fig
ure
2.8.
Sw
ellin
g of
Cla
y R
ich
Soils
(Keh
ew, 1
995)
13
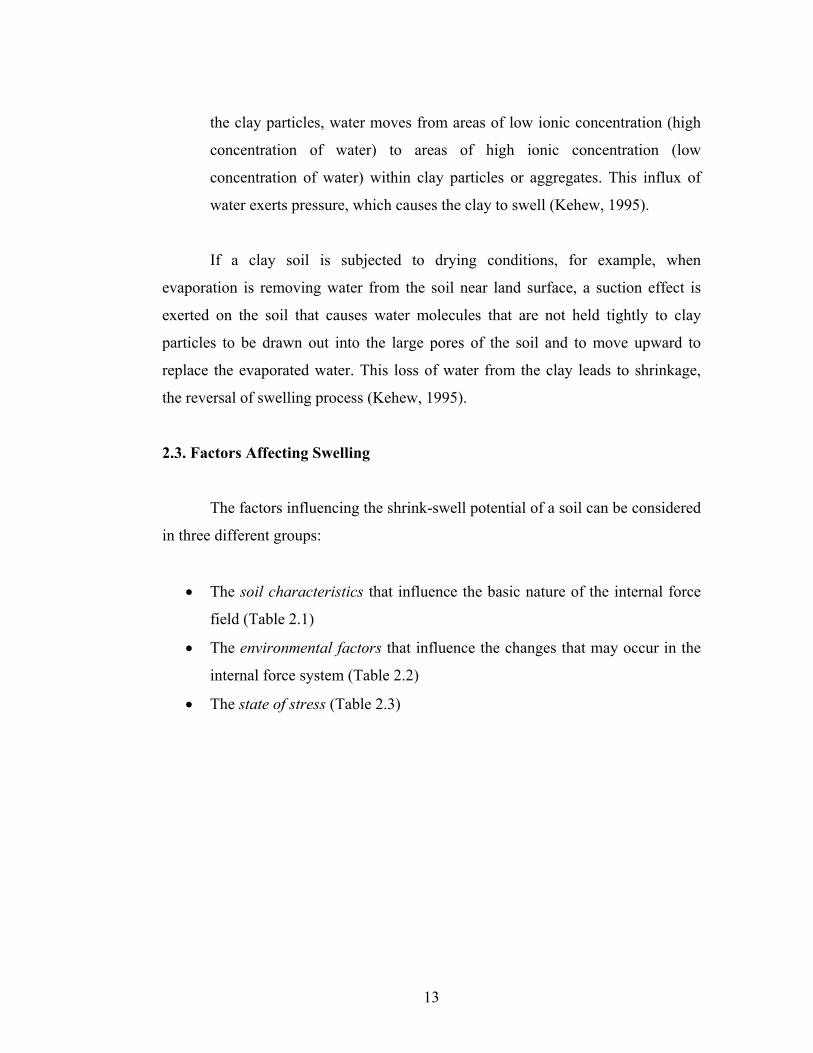
the clay particles, water moves from areas of low ionic concentration (high
concentration of water) to areas of high ionic concentration (low
concentration of water) within clay particles or aggregates. This influx of
water exerts pressure, which causes the clay to swell (Kehew, 1995).
If a clay soil is subjected to drying conditions, for example, when
evaporation is removing water from the soil near land surface, a suction effect is
exerted on the soil that causes water molecules that are not held tightly to clay
particles to be drawn out into the large pores of the soil and to move upward to
replace the evaporated water. This loss of water from the clay leads to shrinkage,
the reversal of swelling process (Kehew, 1995).
2.3. Factors Affecting Swelling
The factors influencing the shrink-swell potential of a soil can be considered
in three different groups:
• The soil characteristics that influence the basic nature of the internal force
field (Table 2.1)
• The environmental factors that influence the changes that may occur in the
internal force system (Table 2.2)
• The state of stress (Table 2.3)
14
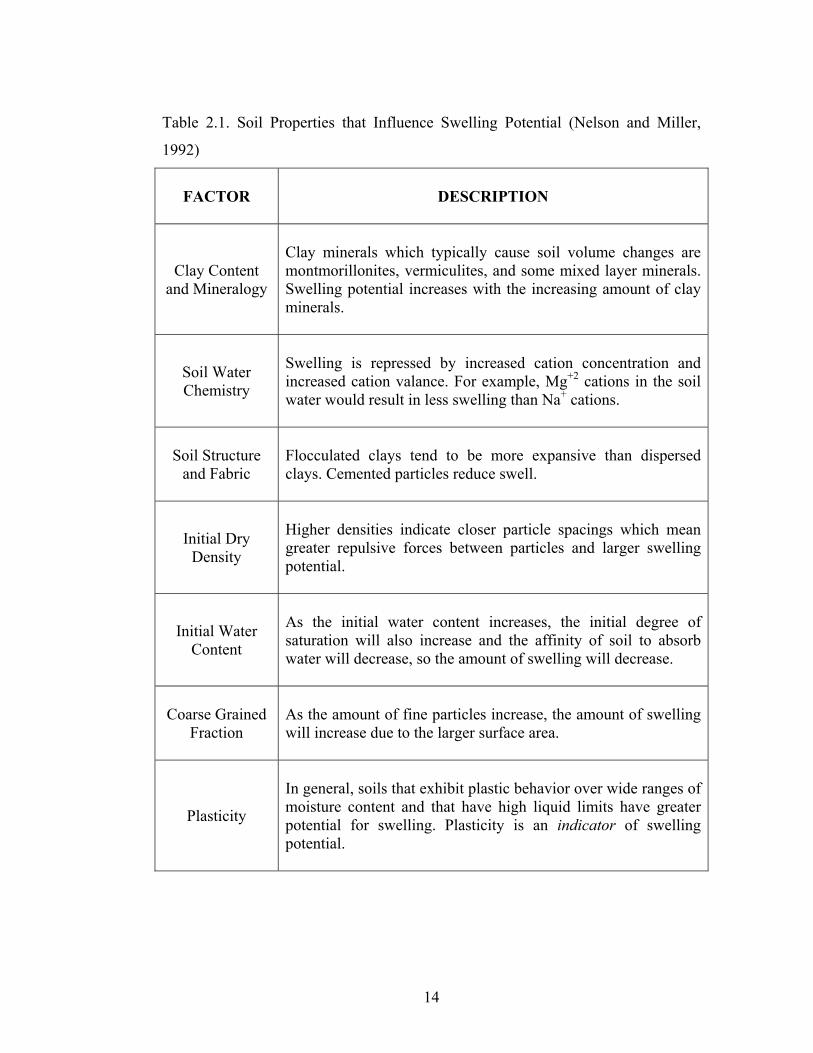
Table 2.1. Soil Properties that Influence Swelling Potential (Nelson and Miller,
1992)
FACTOR
DESCRIPTION
Clay Content and Mineralogy
Clay minerals which typically cause soil volume changes are montmorillonites, vermiculites, and some mixed layer minerals. Swelling potential increases with the increasing amount of clay minerals.
Soil Water Chemistry
Swelling is repressed by increased cation concentration and increased cation valance. For example, Mg+2 cations in the soil water would result in less swelling than Na+ cations.
Soil Structure and Fabric
Flocculated clays tend to be more expansive than dispersed clays. Cemented particles reduce swell.
Initial Dry Density
Higher densities indicate closer particle spacings which mean greater repulsive forces between particles and larger swelling potential.
Initial Water Content
As the initial water content increases, the initial degree of saturation will also increase and the affinity of soil to absorb water will decrease, so the amount of swelling will decrease.
Coarse Grained Fraction
As the amount of fine particles increase, the amount of swelling will increase due to the larger surface area.
Plasticity
In general, soils that exhibit plastic behavior over wide ranges of moisture content and that have high liquid limits have greater potential for swelling. Plasticity is an indicator of swelling potential.
15
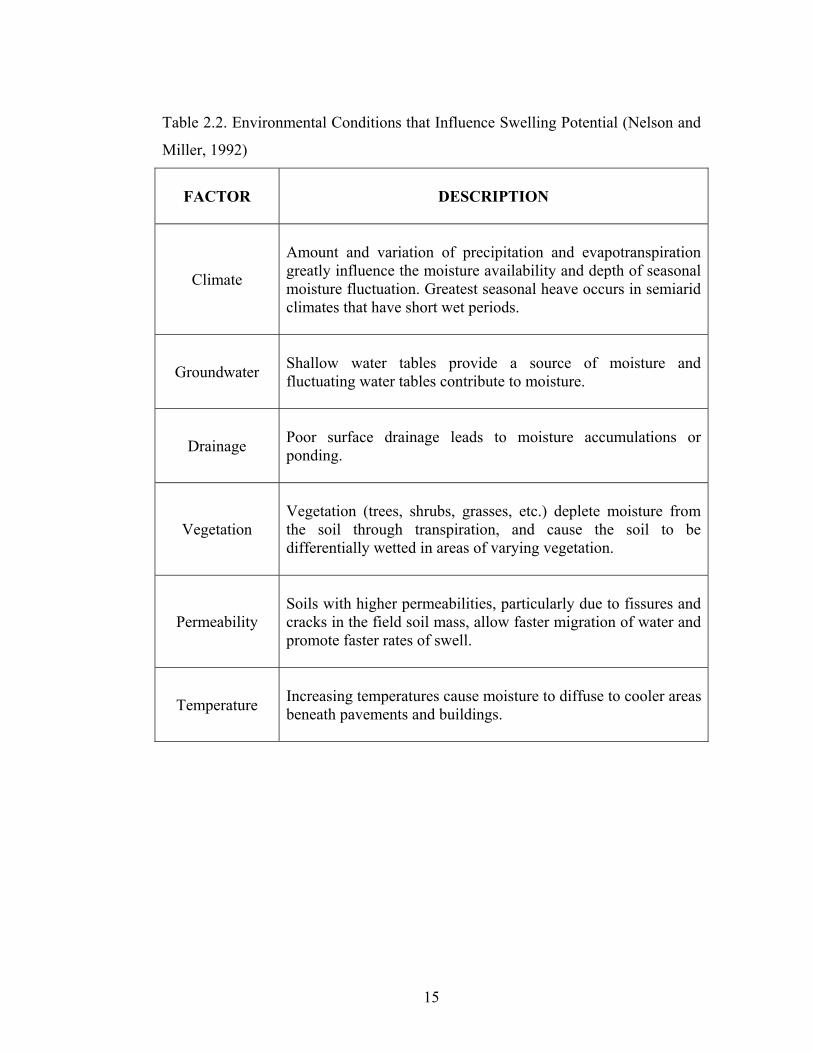
Table 2.2. Environmental Conditions that Influence Swelling Potential (Nelson and
Miller, 1992)
FACTOR
DESCRIPTION
Climate
Amount and variation of precipitation and evapotranspiration greatly influence the moisture availability and depth of seasonal moisture fluctuation. Greatest seasonal heave occurs in semiarid climates that have short wet periods.
Groundwater
Shallow water tables provide a source of moisture and fluctuating water tables contribute to moisture.
Drainage
Poor surface drainage leads to moisture accumulations or ponding.
Vegetation
Vegetation (trees, shrubs, grasses, etc.) deplete moisture from the soil through transpiration, and cause the soil to be differentially wetted in areas of varying vegetation.
Permeability
Soils with higher permeabilities, particularly due to fissures and cracks in the field soil mass, allow faster migration of water and promote faster rates of swell.
Temperature
Increasing temperatures cause moisture to diffuse to cooler areas beneath pavements and buildings.
16
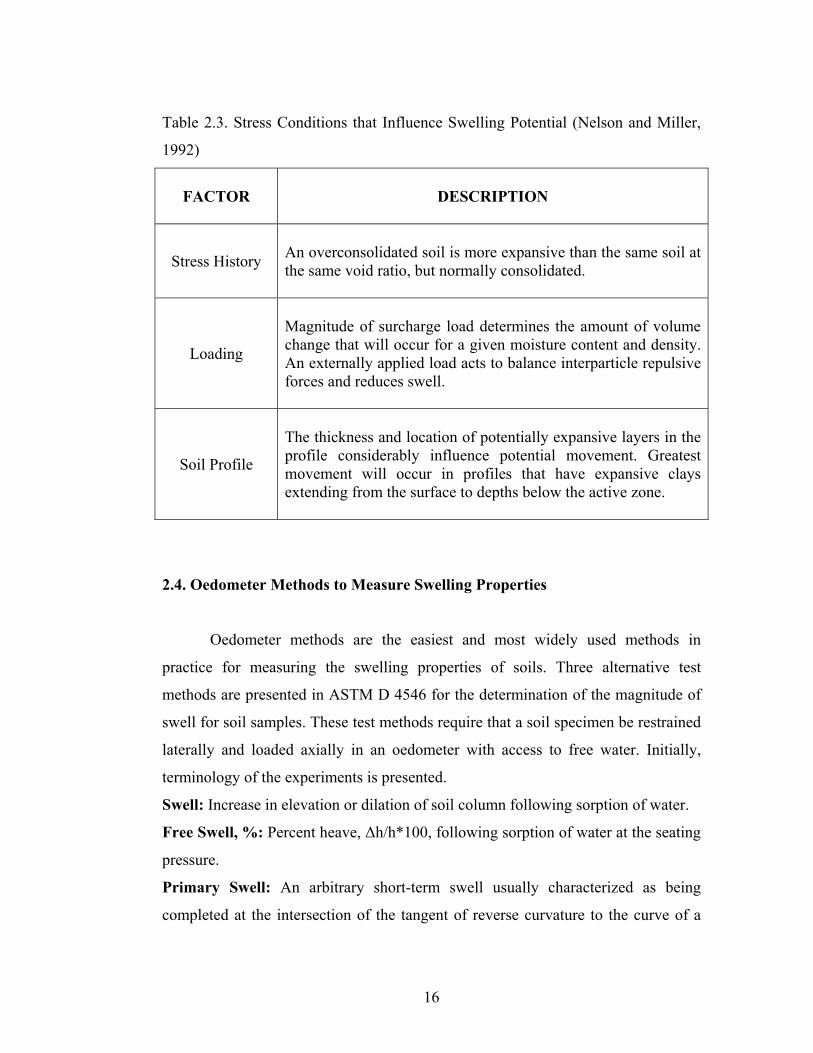
Table 2.3. Stress Conditions that Influence Swelling Potential (Nelson and Miller,
1992)
FACTOR
DESCRIPTION
Stress History
An overconsolidated soil is more expansive than the same soil at the same void ratio, but normally consolidated.
Loading
Magnitude of surcharge load determines the amount of volume change that will occur for a given moisture content and density. An externally applied load acts to balance interparticle repulsive forces and reduces swell.
Soil Profile
The thickness and location of potentially expansive layers in the profile considerably influence potential movement. Greatest movement will occur in profiles that have expansive clays extending from the surface to depths below the active zone.
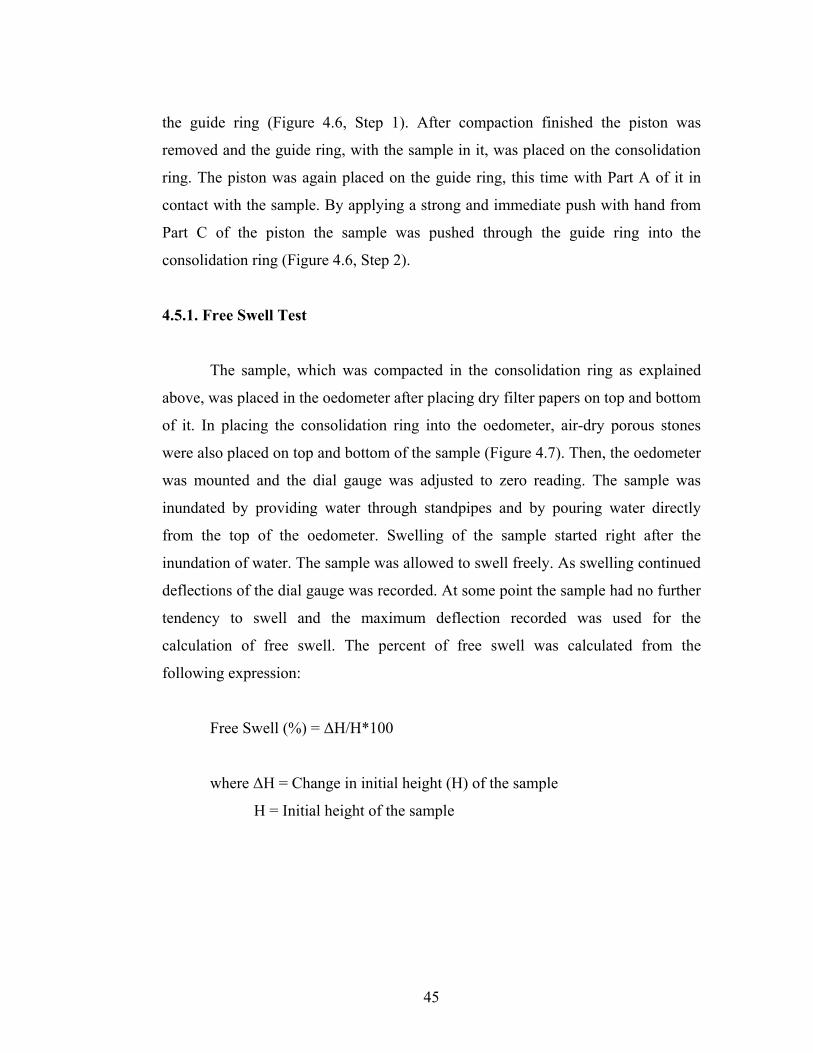
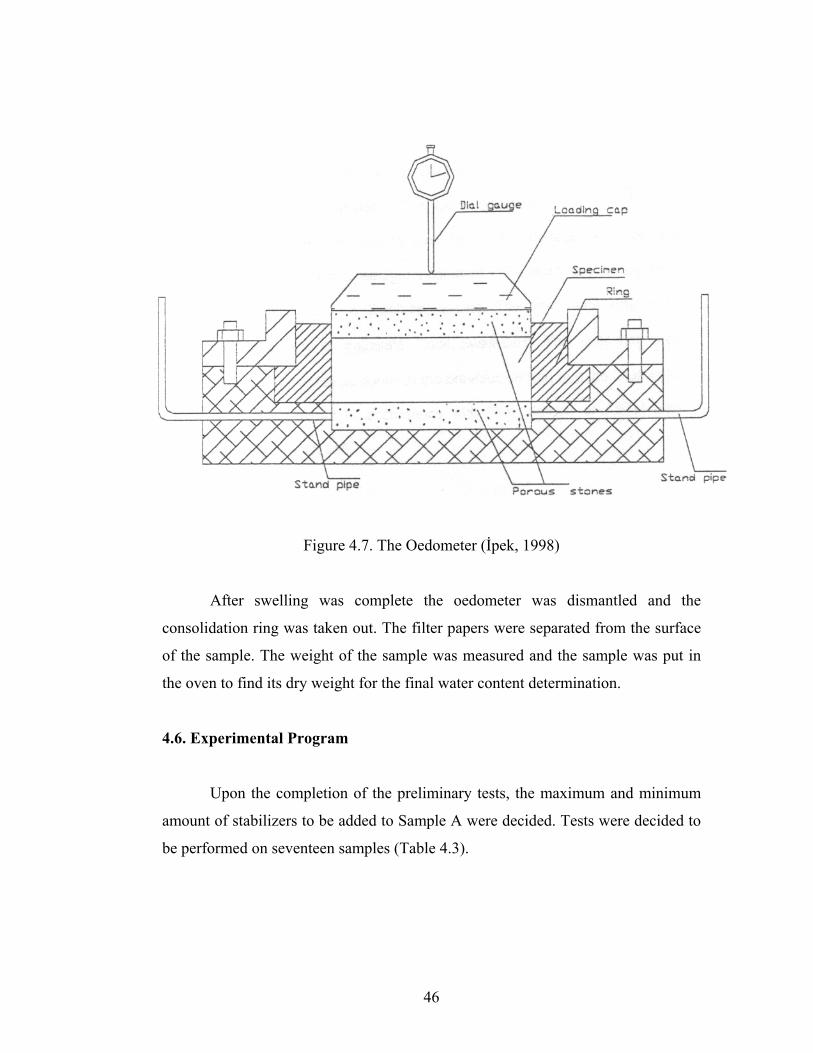
2.4. Oedometer Methods to Measure Swelling Properties
Oedometer methods are the easiest and most widely used methods in
practice for measuring the swelling properties of soils. Three alternative test
methods are presented in ASTM D 4546 for the determination of the magnitude of
swell for soil samples. These test methods require that a soil specimen be restrained
laterally and loaded axially in an oedometer with access to free water. Initially,
terminology of the experiments is presented.
Swell: Increase in elevation or dilation of soil column following sorption of water.
Free Swell, %: Percent heave, ∆h/h*100, following sorption of water at the seating
pressure.
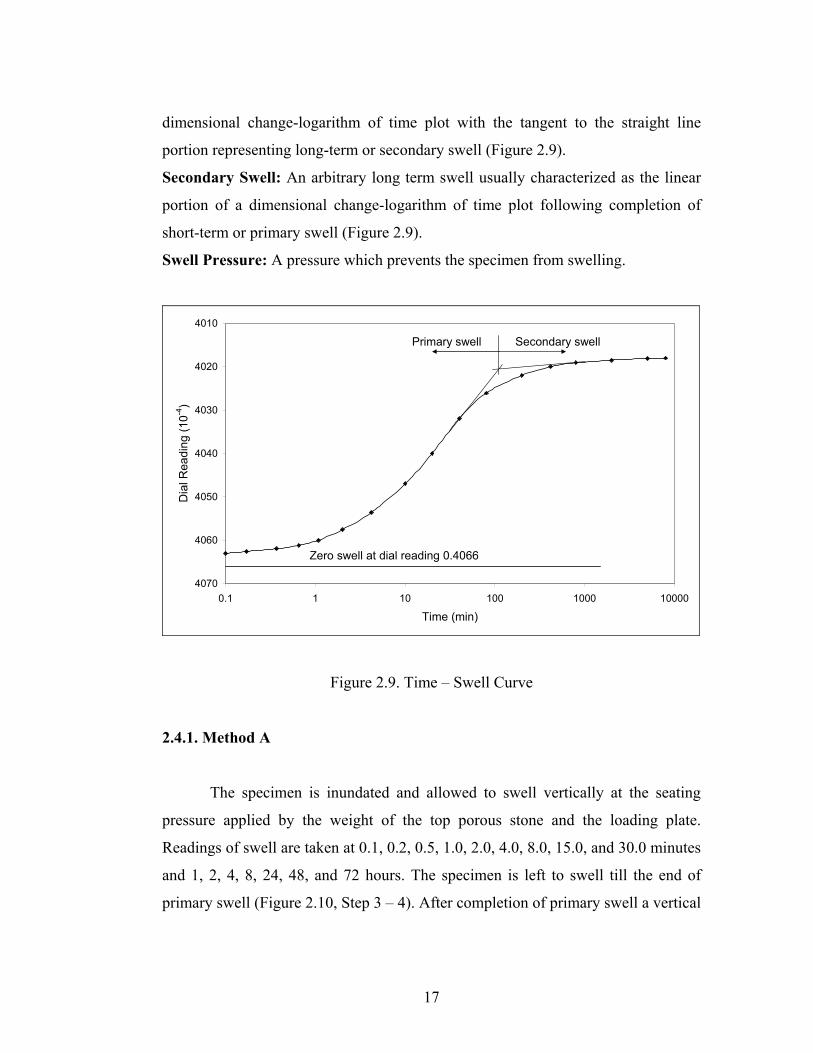
Primary Swell: An arbitrary short-term swell usually characterized as being
completed at the intersection of the tangent of reverse curvature to the curve of a
17
dimensional change-logarithm of time plot with the tangent to the straight line
portion representing long-term or secondary swell (Figure 2.9).
Secondary Swell: An arbitrary long term swell usually characterized as the linear
portion of a dimensional change-logarithm of time plot following completion of
short-term or primary swell (Figure 2.9).
Swell Pressure: A pressure which prevents the specimen from swelling.
4010
4020
4030
4040
4050
4060
40700.1 1 10 100 1000 10000
Time (min)
Dia
l Rea
ding
(10-4
)
Secondary swell
Zero swell at dial reading 0.4066
Primary swell
Figure 2.9. Time – Swell Curve
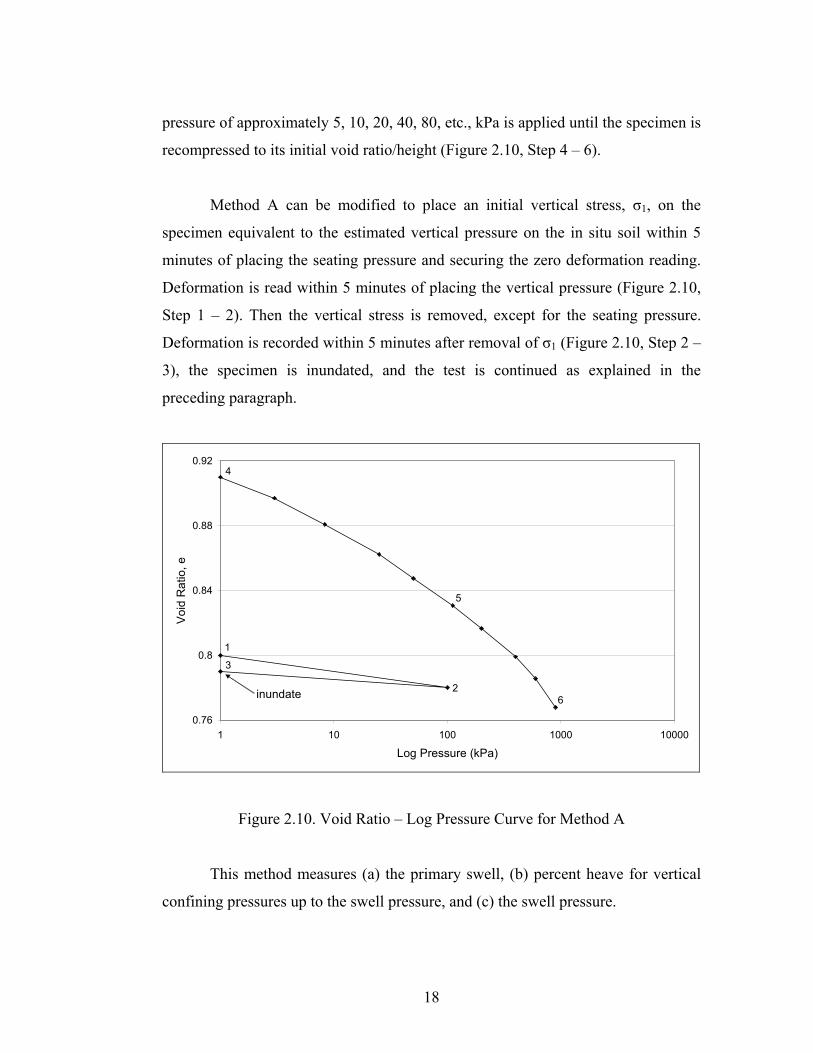
2.4.1. Method A
The specimen is inundated and allowed to swell vertically at the seating
pressure applied by the weight of the top porous stone and the loading plate.
Readings of swell are taken at 0.1, 0.2, 0.5, 1.0, 2.0, 4.0, 8.0, 15.0, and 30.0 minutes
and 1, 2, 4, 8, 24, 48, and 72 hours. The specimen is left to swell till the end of
primary swell (Figure 2.10, Step 3 – 4). After completion of primary swell a vertical
18
pressure of approximately 5, 10, 20, 40, 80, etc., kPa is applied until the specimen is
recompressed to its initial void ratio/height (Figure 2.10, Step 4 – 6).
Method A can be modified to place an initial vertical stress, σ1, on the
specimen equivalent to the estimated vertical pressure on the in situ soil within 5
minutes of placing the seating pressure and securing the zero deformation reading.
Deformation is read within 5 minutes of placing the vertical pressure (Figure 2.10,
Step 1 – 2). Then the vertical stress is removed, except for the seating pressure.
Deformation is recorded within 5 minutes after removal of σ1 (Figure 2.10, Step 2 –
3), the specimen is inundated, and the test is continued as explained in the
preceding paragraph.
0.76
0.8
0.84
0.88
0.92
1 10 100 1000 10000
Log Pressure (kPa)
Voi
d R
atio
, e
1
3
2inundate
4
5
6
Figure 2.10. Void Ratio – Log Pressure Curve for Method A
This method measures (a) the primary swell, (b) percent heave for vertical
confining pressures up to the swell pressure, and (c) the swell pressure.
19
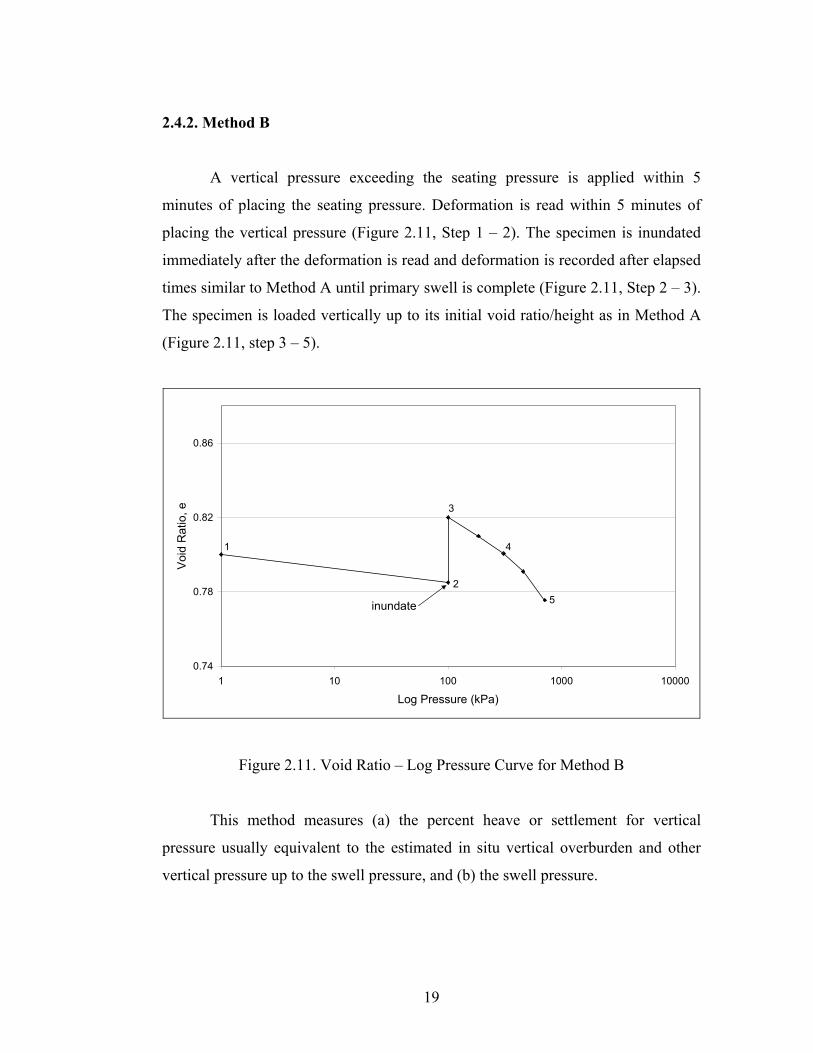
2.4.2. Method B
A vertical pressure exceeding the seating pressure is applied within 5
minutes of placing the seating pressure. Deformation is read within 5 minutes of
placing the vertical pressure (Figure 2.11, Step 1 – 2). The specimen is inundated
immediately after the deformation is read and deformation is recorded after elapsed
times similar to Method A until primary swell is complete (Figure 2.11, Step 2 – 3).
The specimen is loaded vertically up to its initial void ratio/height as in Method A
(Figure 2.11, step 3 – 5).
0.74
0.78
0.82
0.86
1 10 100 1000 10000
Log Pressure (kPa)
Voi
d R
atio
, e
1
2
3
4
5inundate
Figure 2.11. Void Ratio – Log Pressure Curve for Method B
This method measures (a) the percent heave or settlement for vertical
pressure usually equivalent to the estimated in situ vertical overburden and other
vertical pressure up to the swell pressure, and (b) the swell pressure.
20
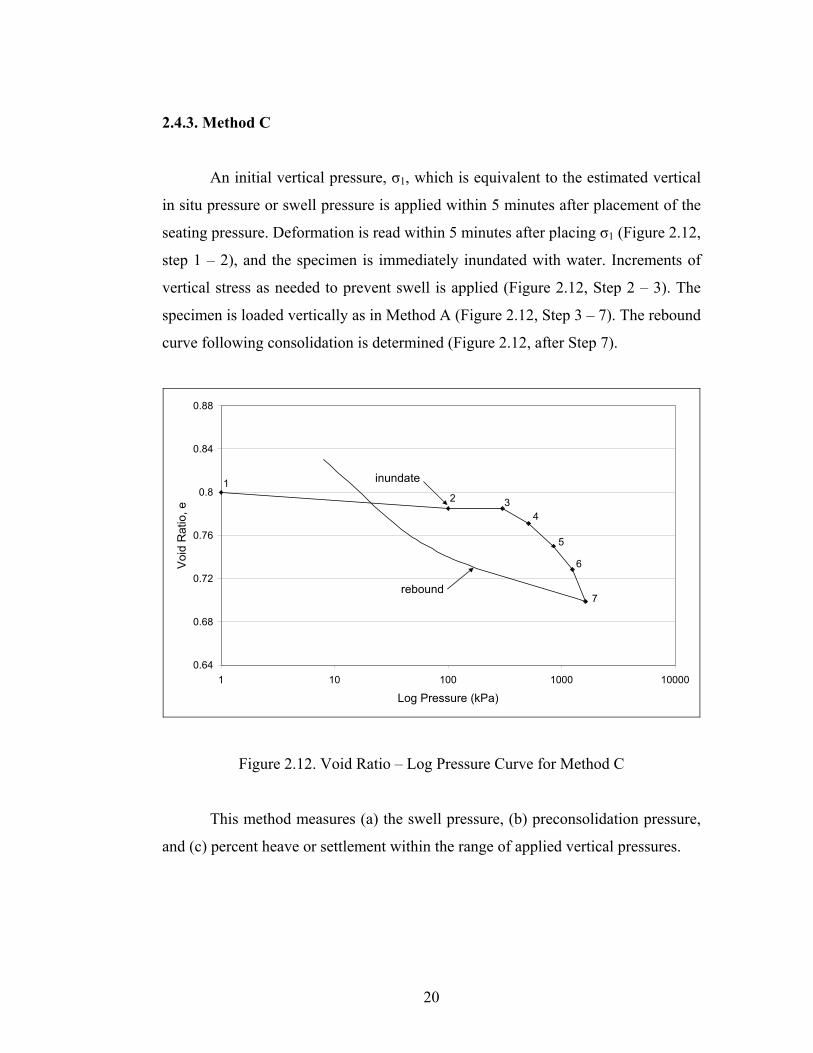
2.4.3. Method C
An initial vertical pressure, σ1, which is equivalent to the estimated vertical
in situ pressure or swell pressure is applied within 5 minutes after placement of the
seating pressure. Deformation is read within 5 minutes after placing σ1 (Figure 2.12,
step 1 – 2), and the specimen is immediately inundated with water. Increments of
vertical stress as needed to prevent swell is applied (Figure 2.12, Step 2 – 3). The
specimen is loaded vertically as in Method A (Figure 2.12, Step 3 – 7). The rebound
curve following consolidation is determined (Figure 2.12, after Step 7).
0.64
0.68
0.72
0.76
0.8
0.84
0.88
1 10 100 1000 10000
Log Pressure (kPa)
Voi
d R
atio
, e
12 3
4
5
6
7
inundate
rebound
Figure 2.12. Void Ratio – Log Pressure Curve for Method C
This method measures (a) the swell pressure, (b) preconsolidation pressure,
and (c) percent heave or settlement within the range of applied vertical pressures.
21
CHAPTER 3
SOIL STABILIZATION
Treatment procedures that are available for stabilizing expansive soils
include:
• Prewetting:
Prewetting is based on the theory that increasing the moisture content in the
expansive foundation soils will cause heave to occur prior to construction
and thereby eliminate problems afterward (Chen, 1975).
• Moisture Control:
Moisture control methods are applied around the perimeter of structures in
an attempt to minimize edge wetting or drying of foundations (Das, 1990).
• Soil Replacement:
Removal of expansive soils and replacement with nonexpansive soils is one
method to provide stable foundation material (Nelson and Miller, 1992).
• Compaction Control:
Expansive soils expand very little when compacted at low densities and high
water contents, but expand greatly when compacted at high densities and
low water contents ( Abduljauwad, 1993; Chen, 1975).
22
• Chemical Stabilization:
Chemical additives, such as lime, cement, fly ash, and other chemical
compounds, have been used in soil stabilization for many years at various
degrees of success. The effectiveness of these additives depends on the soil
conditions, stabilizer properties, and type of construction (i.e. houses, roads,
etc.). The selection of a particular additive depends on costs, benefits,
availability, and practicality of its application (Al-Rawas et al. 2002).
Fly ash, desulphogypsum, and lime were used to stabilize the expansive soil
in this study.
3.1. Fly Ash Stabilization
Large quantities of coal are being burnt in thermal power stations to meet
the ever increasing demand for thermal power. Combustion of coal results in a
residue consisting of inorganic mineral constituents and organic matter which is not
fully burned. The inorganic mineral constituents from ash: About 80% of this ash is
fly ash. Environmentally safe disposal of large quantities of ash is not only tedious
but also expensive. To reduce the problems of disposal, great efforts are being made
to utilize fly ash. The use of fly ash as a soil-stabilizing agent is beneficial for
improving the engineering properties of the soil, while at the same time it provides
an opportunity for the utilization of an industrial waste that will otherwise require
costly disposal (Ferreira et al. 2003; Nalbantoğlu and Güçbilmez, 2002;
Sivapullaiah et al. 1998).
Fly ash produced from the burning of pulverized coal in a coal-fired boiler is
a fine-grained, powdery particulate material that is carried off in the flue gas and
collected from the flue gas by means of electrostatic precipitators (TFHRC, 2003;
Vassilev et al. 2003).
23
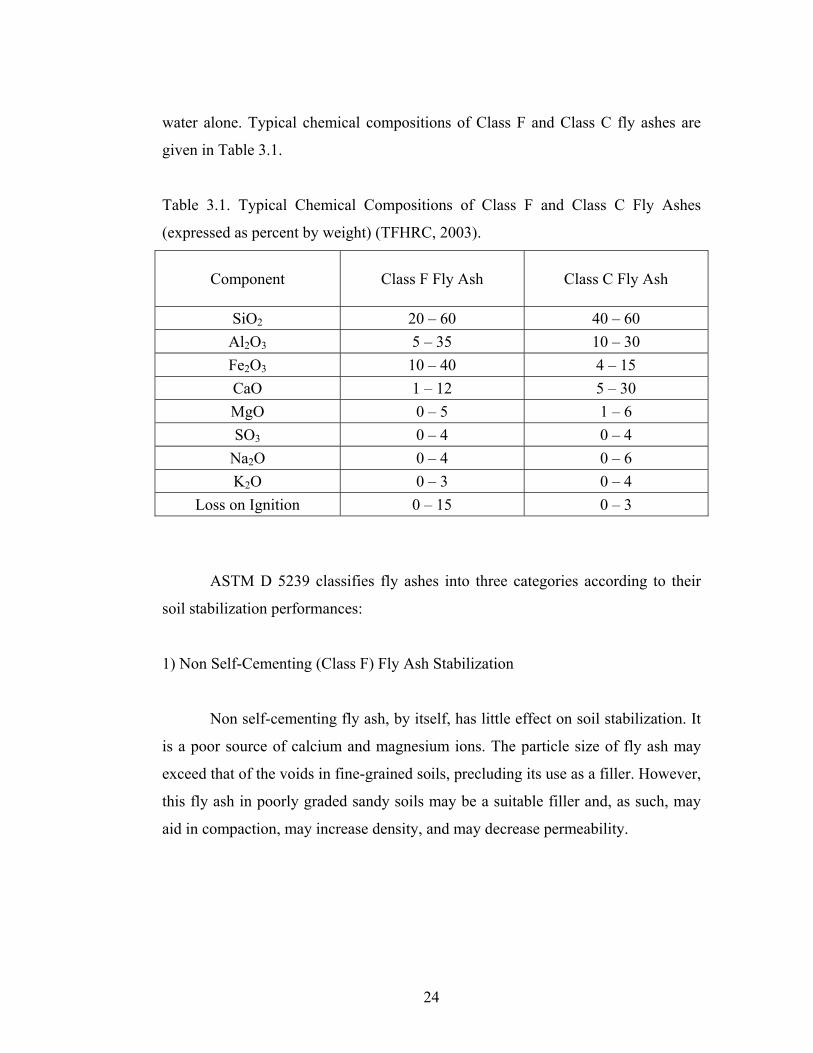
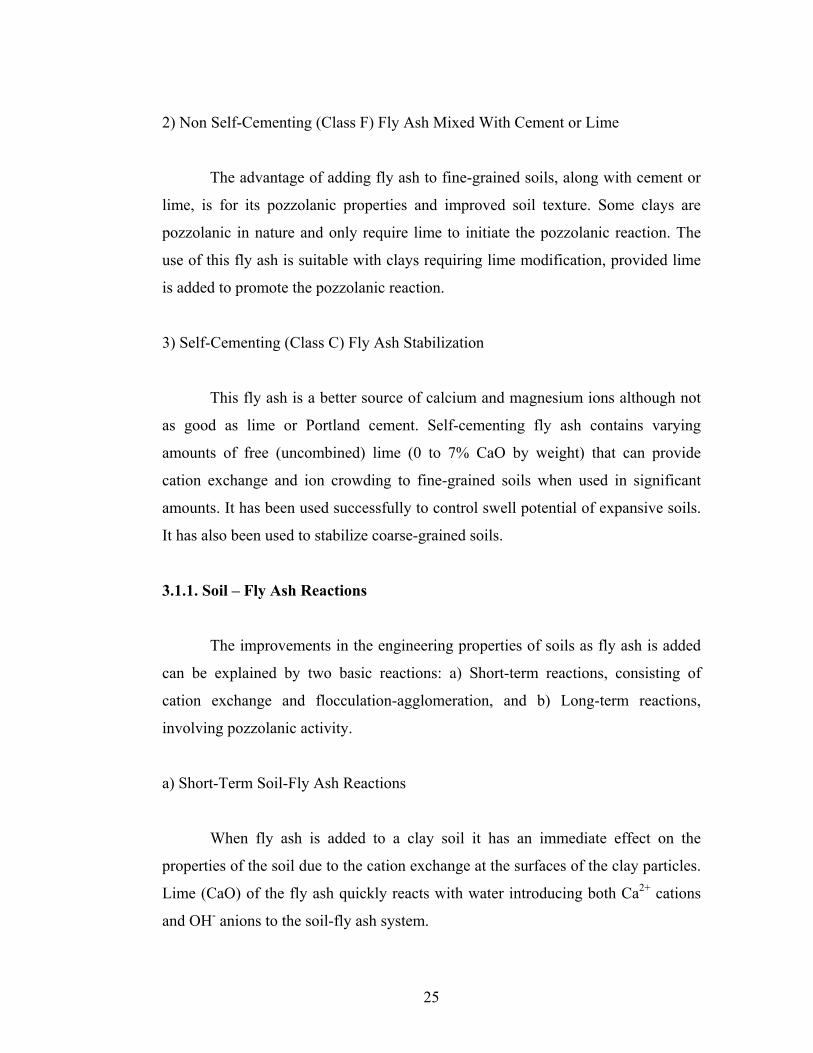
Fly ash is useful in many construction applications because it is a pozzolan,
meaning it is a siliceous or alimino-siliceous material which in itself possess little or
no cementitious value but will, in finely divided form and in the presence of
moisture, chemically react with calcium hydroxide at ordinary temperatures to form
3. Al-Rawas, A.A., Taha R., Nelson, J.D., Al-Shab, T.B. and Al-Siyabi, H.,
(2002), “A Comparative Evaluation of Various Additives Used in the Stabilization of Expansive Soils”, Geotechnical Testing Journal, Vol. 25, No. 2, pp. 199-209.
4. Arnold, M., (1984), “The Genesis, Mineralogy and Identification of
Expansive Soils”, Fifth International Conference on Expansive Soils, Adelaide, South Australia, pp. 32-36.
5. ASTM, (1993), “Standard Specification for Fly Ash and Raw or Calcined
Natural Pozzolan for Use as a Mineral Admixture in Portland Cement Concrete”, Annual Book of ASTM Standards, C 618-93, Vol. 04-02, pp. 310-312.
6. ASTM, (1993), “Standard Test Method for One-Dimensional Consolidation
Properties of Soils”, Annual Book of ASTM Standards, D 2435-90, Vol. 04-08, pp. 313-323.
7. ASTM, (1993), “Standard Test Methods for One-Dimensional Swell or
Settlement Potential of Cohesive Soils”, Annual Book of ASTM Standards, D 4546-90, Vol. 04-08, pp. 853-859.
8. ASTM, (1993), “Standard Practice for Characterizing Fly Ash for Use in
Soil Stabilization”, Annual Book of ASTM Standards, D 5239-92, Vol. 04-08, pp. 1277-1279.
9. Bell, F.G., (1993), “An Examination of the Use of Lime and Pulverized Fly
Ash to Stabilize Clay Materials”, Bulletin of the Association of Engineering Geologists, No. 4, pp. 469-479.
78
10. Bell, F.G., (1996), “Lime Stabilization of Clay Minerals and Soils”, Engineering Geology, Vol. 42, pp. 223-237.
11. Chen, F.H., (1975), Foundations on Expansive Soils, Elsevier Scientific
Publishing Company, 280 pages.
12. Chen, W.F., (1995), The Civil Engineering Hand Book, CRC Press Inc., 2609 pages.
13. Clark, R.B., Ritchey, K.D. and Baligar, V.C., (2001), “Benefits and
Constraints for Use of FGD Products on Agricultural Land”, Fuel, Vol. 80, pp. 821-828.
15. Çokça, E., (2001), “Use of Class C Fly Ashes for the Stabilization of an
Expansive Soil”, Journal of Geotechnical and Geoenvironmental Engineering, Vol. 127, No. 7, pp. 568-573.
16. Das, B.M., (1990), Principles of Foundation Engineering, Mc Graw-Hill,
810 pages.
17. El-Sohby, M.A. and Rabba, E.A., (1981), “Some Factors Affecting Swelling of Clayey Soils”, Geotechnical Engineering, Vol. 12, pp. 19-39.
18. El-Sohby, M.A. and Mazen, O., (1983), “Mineralogy and Swelling of
Expansive Clayey Soils”, Geotechnical Engineering, Vol. 14, pp. 79-87.
19. Ferreira, C., Riberio, A. and Ottosen, L., (2003), “Possible Applications for Municipal Solid Waste Fly Ash”, Journal of Hazardous Materials, Vol. B96, pp. 201-216.
20. Fredlund, D.G. and Rahardjo, H., (1993), Soil Mechanics for Unsaturated
Soils, John Wiley and Sons Inc., 517 pages.
21. Galos, K.A., Smakowski, T.S. and Szlugaj, J., (2003), “Flue-Gas Desulphurization Products from Polish Coal-Fired Power-Plants”, Applied Energy, Vol. 75, pp.257-265.
22. Gens, A. and Alonso, E.E., (1992), “A Framework for the Behavior of
Unsaturated Expansive Clays”, Canadian Geotechnical Journal, Vol. 29, pp. 1013-1032.
23. Gomes, S., François, M., Pellisier, C. and Evrard, O., (1998),
“Characterization and Comparative Study of Coal Combustion Residues
79
from a Primary and Additional Flue Gas Secondary Desulfurization Process”, Cement and Concrete Research, Vol. 28, No. 11, pp. 1605-1619.
24. Grim, R.E., (1962), Applied Clay Mineralogy, Mc Graw-Hill Series in the
Geotechnical Sciences, 422 pages.
25. Gromko, G.J., (1974), “Review of Expansive Soils”, ASCE Journal of the Geotechnical Engineering, Vol. 100, No. GT6, pp.667-687.
26. İpek, T., (1998), Stabilization of Expansive Soils Using Lime, Cement and
Fly Ash, M.S. Thesis, METU, Turkey, 119 pages. 27. Kehew, A.E., (1995), Geology for Engineers and Environmental Scientists,
Prentice Hall, 574 pages.
28. Kinithua, J.M., Wild, S. and Jones, G.I., (1999), “Effects of Monovalent and Divalent Metal Sulphates on Consistency and Compaction of Lime-Stabilized Kaolinite”, Applied Clay Science, Vol. 14, pp. 27-45.
29. Komine, H. and Ogata, N., (1996), “Prediction for Swelling Characteristics
of Compacted Bentonite”, Canadian Geotechnical Journal, Vol. 33, pp. 11-22.
30. Mathew, P.K. and Rao, S.N., (1997), “Effect of Lime on Cation Exchange
Capacity of Marine Clay”, Journal of Geotechnical and Geoenvironmental Engineering”, Vol. 123, No. 2, pp. 183-185.
31. Mitchell, J.K., (1993), Fundamentals of Soil Behavior, John Wiley and Sons
Inc., 422 pages.
32. Mohamed, A.M.O., (2000), “The Role of Clay Minerals in Marly Soils on its Stability”, Engineering Geology, Vol. 57, pp. 193-203.
33. Nalbantoğlu, Z. and Tuncer, E.R., (2001), “Compressibility and Hydraulic
Conductivity of a Chemically Treated Expansive Clay”, Canadian Geotechnical Journal, Vol. 38, pp. 154-160.
34. Nalbantoğlu, Z. and Güçbilmez, E., (2002), “Utilization of an Industrial
Waste in Calcareous Expansive Clay Stabilization”, Geotechnical Testing Journal, Vol. 25, No. 1, pp. 78-84.
35. Nelson, J.D. and Miller, D.J., (1992), Expansive Soils, Problems and
Practice in Foundation and Pavement Engineering, John Wiley and Sons Inc., 259 pages.
80
36. Oman, J., Dejanovic, B. and Tuma, M., (2002), “Solutions to the Problem of Waste Deposition at a Coal-Fired Power Plant”, Waste Management, Vol. 22, pp. 617-623.
37. Özkul, M.H., (2000), “Utilization of Citro- and Desulphogypsum as Set
Retarders in Portland Cement”, Cement and Concrete Research, Vol. 30, pp. 1755-1758.
38. Payette, R.M., Wolfe, W.E. and Beeghly, J., (1997), “Use of Clean Coal
Combustion By-Products in Highway Repairs”, Fuel, Vol. 76, No. 8, pp. 749-753.
39. Popescu, M.E., (1986), “A Comparison between the Behaviour of Swelling
and of Collapsing Soils”, Engineering Geology, Vol. 23, pp. 145-163.
40. Rao, S.N. and Rajasekaran, G., (1996), “Reaction Products Formed in Lime-Stabilized Marine Clays”, Journal of Geotechnical Engineering, Vol. 122, No. 5, pp. 329-336.
41. Rao, K.S.S. and Triphaty, S., (2003), “Effect of Aging on Swelling and
Swell-Shrink Behavior of a Compacted Expansive Soil”, Geotechnical Testing Journal, Vol. 26, No. 1, pp. 1-11.
42. Sahu, S., Brown, S.A. and Lee, R.J., (2002), “Thaumisite Formation in
43. Shuai, F. and Fredlund, D.G., (1998), “Model for the Simulation of
Swelling-Pressure Measurements on Expansive Soils”, Canadian Geotechnical Journal, Vol. 35, pp. 96-114.
44. Sivapullaiah, P.V., Sridharan,A. and Stalin, V.K., (1996), “Swelling
Behavior of Soil-Bentonite Mixtures”, Canadian Geotechnical Journal, Vol. 33, pp. 808-814.
45. Sivapullaiah, P.V., Prashanth, J.P., Sridharan, A. and Narayana, B.V.,
(1998), “Reactive Silica and Strength of Fly Ashes”, Geotechnical and Geological Engineering, Vol. 16, pp. 239-250.
46. Snethen, D.R., (1984), “Evaluation of Expedient Methods for Identification
and Classification of Potentially Expansive Soils”, Fifth International Conference on Expansive Soils, Adelaide, South Australia, pp. 22-26.
47. Tao, D., Chen, S., Parekh, B.K. and Hepworth, M.T., (2001), “An
Investigation of a Thermochemical Process for Conversion of Gypsum and
81
Pyrite Solid Wastes into Useful Products”, Advances in Environmental Research, Vol. 5, pp. 277-284.
48. TFHRC (Transportation and Federal Highways Research Council), (2003),
“Coal Fly Ash-User Guideline-Embankment or Fill”, http://www.tfhrc.gov/hnr20/recycle/waste/cfa54.htm.
49. Vassilev, S.V., Menendez, R., Alvarez, D., Somoano, M.D. and Tarazona, M.R.M., (2003), “Phase-Mineral and Chemical Composition of Coal Fly Ashes as a Basis for their Multicomponent Utilization. 1. Characterization of Feed Coals and Fly Ashes”, Fuel, Vol. 82, pp. 1793-1811.
50. Wayne, A.C., Mohamed, A.O. and El-Fatih, M.A., (1984), “Construction on
Expansive Soils in Sudan”, Journal of Construction Engineering and Management, Vol. 110, No. 3, pp. 359-374.
82
APPENDIX A
Swelling percentage vs. time relationships of the fly ash, desulphogypsum, and lime
added samples are given in Appendix A.
83
051015202530354045
110
100
1000
1000
010
0000
1000
000
Tim
e (s
ec)
Swelling Percentage, dH/H (%)
Fig
ure
A.1
. Sw
ellin
g Pe
rcen
tage
vs.
Tim
e R
elat
ions
hip
for S
ampl
e 5%
FA
84
051015202530354045
110
100
1000
1000
010
0000
1000
000
Tim
e (s
ec)
Swelling Percentage, dH/H (%)
Fig
ure
A.2
. Sw
ellin
g Pe
rcen
tage
vs.
Tim
e R
elat
ions
hip
for S
ampl
e 10
%FA
85
051015202530354045
110
100
1000
1000
010
0000
1000
000
Tim
e (s
ec)
Swelling Percentage, dH/H (%)
Fig
ure
A.3
. Sw
ellin
g Pe
rcen
tage
vs.
Tim
e R
elat
ions
hip
for S
ampl
e 15
%FA
86
051015202530354045
110
100
1000
1000
010
0000
1000
000
Tim
e (s
ec)
Swelling Percentage, dH/H (%)
Fig
ure
A.4
. Sw
ellin
g Pe
rcen
tage
vs.
Tim
e R
elat
ions
hip
for S
ampl
e 20
%FA
87
051015202530354045
110
100
1000
1000
010
0000
1000
000
Tim
e (s
ec)
Swelling Percentage, dH/H (%)
Fig
ure
A.5
. Sw
ellin
g Pe
rcen
tage
vs.
Tim
e R
elat
ions
hip
for S
ampl
e 25
%FA
88
051015202530354045
110
100
1000
1000
010
0000
1000
000
Tim
e (s
ec)
Swelling Percentage, dH/H (%)
Fig
ure
A.6
. Sw
ellin
g Pe
rcen
tage
vs.
Tim
e R
elat
ions
hip
for S
ampl
e 30
%FA
89
051015202530354045
110
100
1000
1000
010
0000
1000
000
Tim
e (s
ec)
Swelling Percentage, dH/H (%)
Fig
ure
A.7
. Sw
ellin
g Pe
rcen
tage
vs.
Tim
e R
elat
ions
hip
for S
ampl
e 5%
DSG
90
051015202530354045
110
100
1000
1000
010
0000
1000
000
Tim
e (s
ec)
Swelling Percentage, dH/H (%)
Fig
ure
A.8
. Sw
ellin
g Pe
rcen
tage
vs.
Tim
e R
elat
ions
hip
for S
ampl
e 10
%D
SG
91
051015202530354045
110
100
1000
1000
010
0000
1000
000
Tim
e (s
ec)
Swelling Percentage, dH/H (%)
Fig
ure
A.9
. Sw
ellin
g Pe
rcen
tage
vs.
Tim
e R
elat
ions
hip
for S
ampl
e 15
%D
SG
92
051015202530354045
110
100
1000
1000
010
0000
1000
000
Tim
e (s
ec)
Swelling Percentage, dH/H (%)
Fig
ure
A.1
0. S
wel
ling
Perc
enta
ge v
s. Ti
me
Rel
atio
nshi
p fo
r Sam
ple
20%
DSG
93
051015202530354045
110
100
1000
1000
010
0000
1000
000
Tim
e (s
ec)
Swelling Percentage, dH/H (%)
Fig
ure
A.1
1. S
wel
ling
Perc
enta
ge v
s. Ti
me
Rel
atio
nshi
p fo
r Sam
ple
25%
DSG
94
051015202530354045
110
100
1000
1000
010
0000
1000
000
Tim
e (s
ec)
Swelling Percentage, dH/H (%)
Fig
ure
A.1
2. S
wel
ling
Perc
enta
ge v
s. Ti
me
Rel
atio
nshi
p fo
r Sam
ple
30%
DSG
95
051015202530354045
110
100
1000
1000
010
0000
1000
000
Tim
e (s
ec)
Swelling Percentage, dH/H (%)
Fig
ure
A.1
3. S
wel
ling
Perc
enta
ge v
s. Ti
me
Rel
atio
nshi
p fo
r Sam
ple
1%L
96
051015202530354045
110
100
1000
1000
010
0000
1000
000
Tim
e (s
ec)
Swelling Percentage, dH/H (%)
Fig
ure
A.1
4. S
wel
ling
Perc
enta
ge v
s. Ti
me
Rel
atio
nshi
p fo
r Sam
ple
3%L
97
051015202530354045
110
100
1000
1000
010
0000
1000
000
Tim
e (s
ec)
Swelling Percentage, dH/H (%)
Fig
ure
A.1
5. S
wel
ling
Perc
enta
ge v
s. Ti
me
Rel
atio
nshi
p fo
r Sam
ple
5%L
98
051015202530354045
110
100
1000
1000
010
0000
1000
000
Tim
e (s
ec)
Swelling Percentage, dH/H (%)
Fig
ure
A.1
6. S
wel
ling
Perc
enta
ge v
s. Ti
me
Rel
atio
nshi
p fo
r Sam
ple
8%L
99
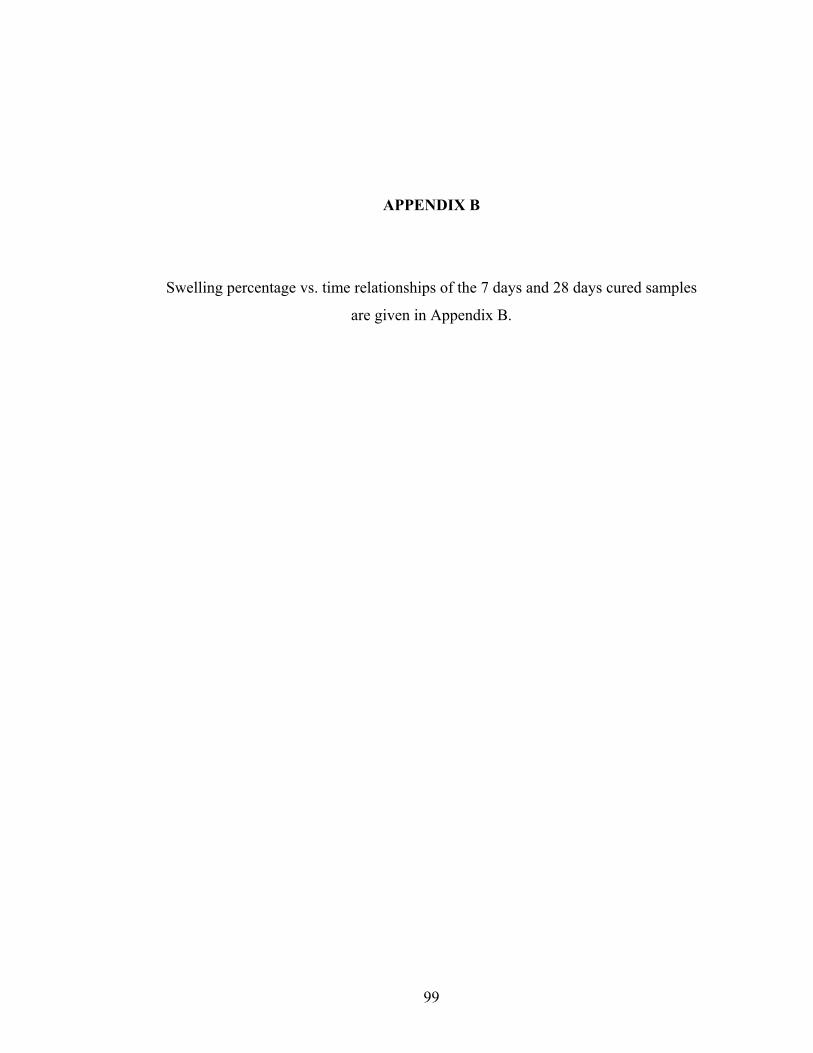
APPENDIX B
Swelling percentage vs. time relationships of the 7 days and 28 days cured samples
are given in Appendix B.
100
051015202530354045
110
100
1000
1000
010
0000
1000
000
Tim
e (s
ec)
Swelling Percentage, dH/H (%)
A 5%FA
10%
FA15
%FA
20%
FA25
%FA
30%
FA
Figu
re B
.1. S
wel
ling
Perc
enta
ge v
s. Ti
me
Rel
atio
nshi
ps fo
r the
Fly
Ash
Add
ed S
ampl
es a
fter 7
Day
s Cur
ing
101
051015202530354045
110
100
1000
1000
010
0000
1000
000
Tim
e (s
ec)
Swelling Percentage, dH/H (%)
A 5%FA
10%
FA15
%FA
20%
FA25
%FA
30%
FA
Figu
re B
.2. S
wel
ling
Perc
enta
ge v
s. Ti
me
Rel
atio
nshi
ps fo
r the
Fly
Ash
Add
ed S
ampl
es a
fter 2
8 D
ays C
urin
g
102
051015202530354045
110
100
1000
1000
010
0000
1000
000
Tim
e (s
ec)
Swelling Percentage, dH/H (%)
A 5%D
SG
10%
DS
G15
%D
SG
20%
DS
G25
%D
SG
30%
DS
G
Figu
re B
.3. S
wel
ling
Perc
enta
ge v
s. Ti
me
Rel
atio
nshi
ps fo
r the
Des
ulph
ogyp
sum
Add
ed S
ampl
es a
fter 7
Day
s Cur
ing
103
051015202530354045
110
100
1000
1000
010
0000
1000
000
Tim
e (s
ec)
Swelling Percentage, dH/H (%)
A 5%D
SG
10%
DS
G15
%D
SG
20%
DS
G25
%D
SG
30%
DS
G
Figu
re B
.4. S
wel
ling
Perc
enta
ge v
s. Ti
me
Rel
atio
nshi
ps fo
r the
Des
ulph
ogyp
sum
Add
ed S
ampl
es a
fter 2
8 D
ays C
urin
g
104
051015202530354045
110
100
1000
1000
010
0000
1000
000
Tim
e (s
ec)
Swelling Percentage, dH/H (%)
A 1%L
3%L
5%L
8%L
Figu
re B
.5. S
wel
ling
Perc
enta
ge v
s. Ti
me
Rel
atio
nshi
ps fo
r the
Lim
e A
dded
Sam
ples
afte
r 7 D
ays C
urin
g
105
051015202530354045
110
100
1000
1000
010
0000
1000
000
Tim
e (s
ec)
Swelling Percentage, dH/H (%)
A 1%L
3%L
5%L
8%L
Figu
re B
.6. S
wel
ling
Perc
enta
ge v
s. Ti
me
Rel
atio
nshi
ps fo
r the
Lim
e A
dded
Sam
ples
afte
r 28
Day
s Cur
ing
106
APPENDIX C
Grain Size distribution curves of Sample A, fly ash, measured 25%FA, and