Page 1
Indian Institute of Management, Ahmedabad
Stabilization Scenarios and Implications for India
P.R. Shukla
WORKSHOP on Greenhouse Gas Stabilization ScenariosJanuary 22-23, 2004, Tsukuba, Japan
Page 2
Stabilization Scenarios and Implications for India
Integrated Economy-Energy-Environment Modeling System for India
Page 3
Stabilization Scenarios and Implications for India
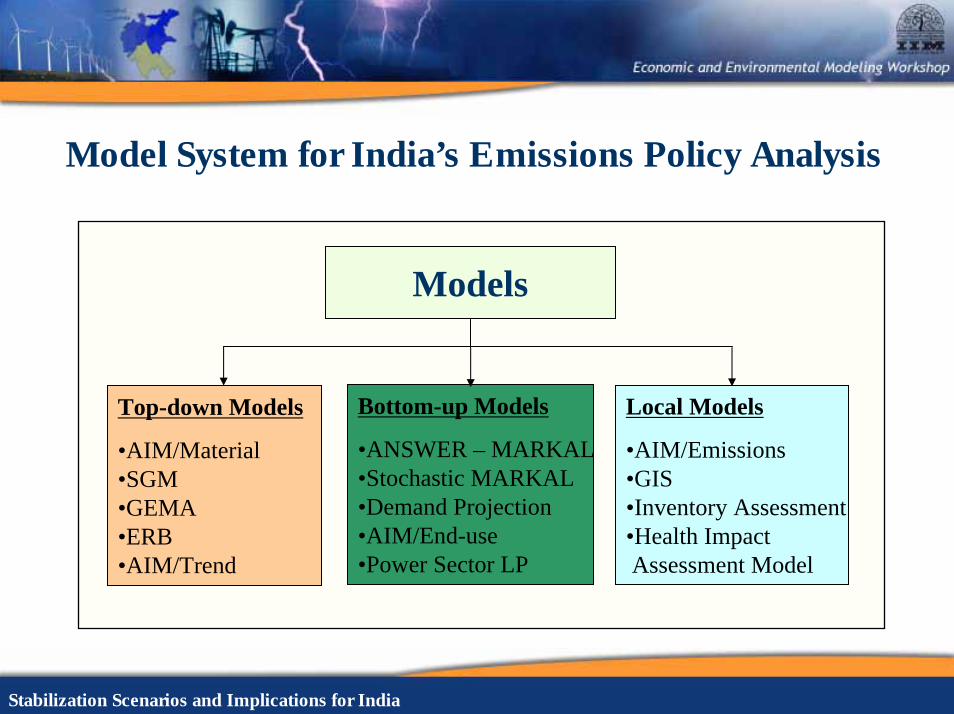
Model System for India’s Emissions Policy Analysis
Models
Top-down Models
•AIM/Material•SGM•GEMA•ERB•AIM/Trend
Local Models
•AIM/Emissions•GIS •Inventory Assessment•Health Impact Assessment Model
Bottom-up Models
•ANSWER – MARKAL•Stochastic MARKAL•Demand Projection•AIM/End-use•Power Sector LP
Page 4
Stabilization Scenarios and Implications for India
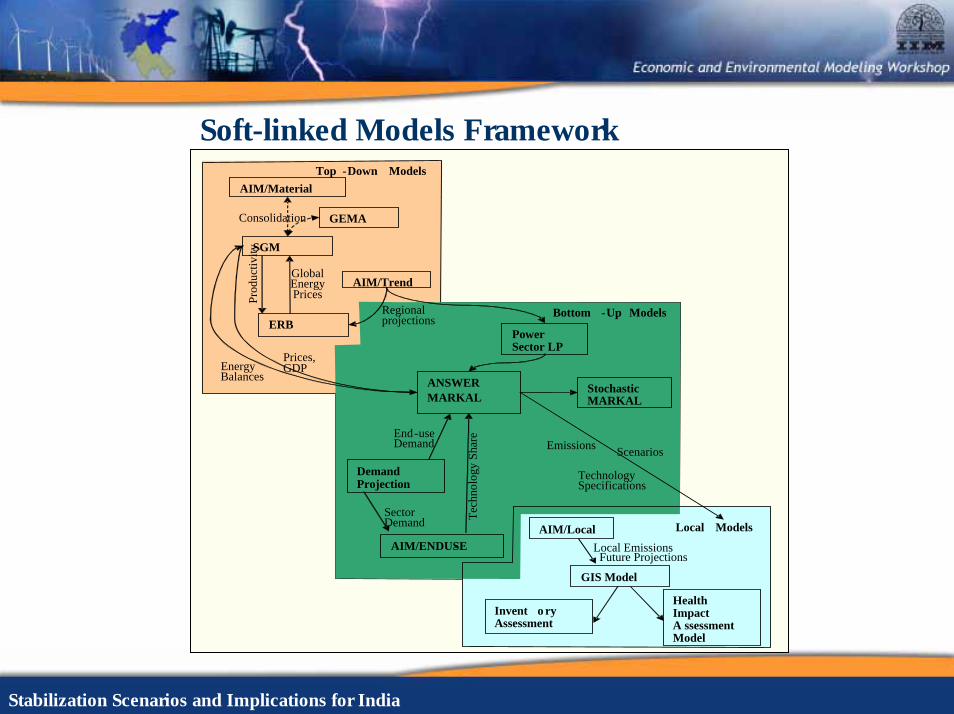
Soft-linked Models Framework
ERB
SGM
AIM/Material
AIM/Trend
Invent o ry Assessment
Health Impact A ssessment Model
GIS Model
Prod
uctiv
ity
Global Energy Prices
Regional projections
Power Sector LP
Demand Projection
AIM/ENDUSE-
ANSWER MARKAL
Stochastic MARKAL
AIM/Local
Bottom -Up Models
Energy Balances
SectorDemand
End-use Demand
Tech
nolo
gy S
hare
ScenariosEmissions
Consolidation
Prices, GDP
Local Models
Top -Down Models
GEMA
Local EmissionsFuture Projections
Technology Specifications
Page 5
Stabilization Scenarios and Implications for India
Medium-Term National Scenarios (for Emissions Projections)
Page 6
Stabilization Scenarios and Implications for India
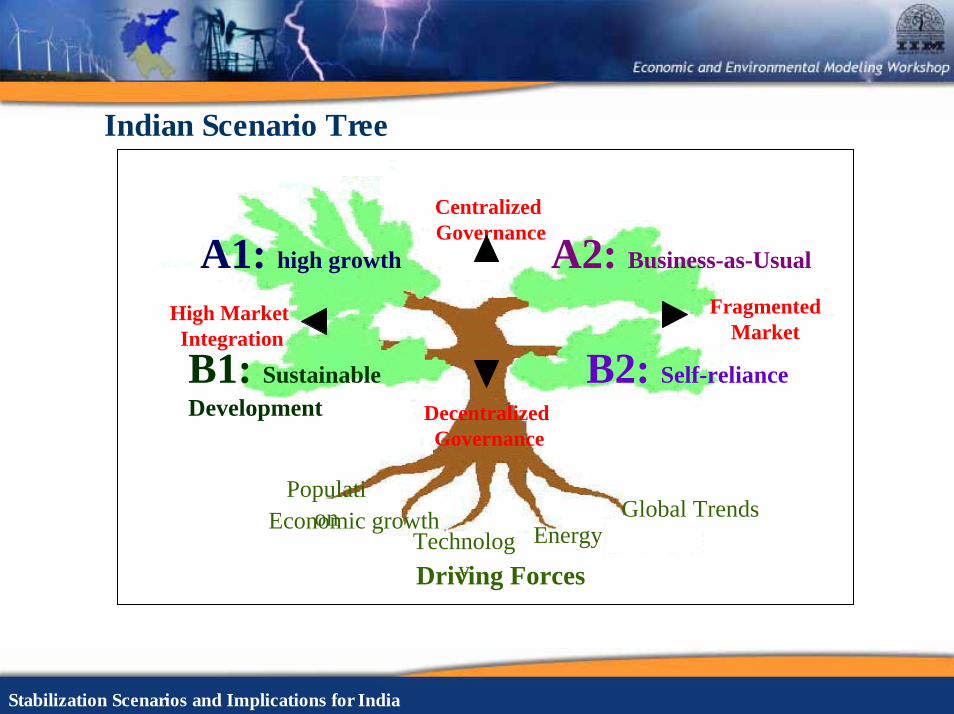
Indian Scenario Tree
Centralized Governance
Decentralized Governance
FragmentedMarket
High Market Integration
A2: Business-as-Usual
B1: Sustainable Development
B2: Self-reliance
PopulationEconomic growth
Technology
EnergyGlobal Trends
Driving Forces
A1: high growth
Page 7
Stabilization Scenarios and Implications for India
Indian Scenarios
Fragmented
IA1
China
IA2
Pre-reform(Mixed Economy Model)IB1
Sustainable Development
IB2
Self Reliance Model
Cen
tral
izat
ion
Dec
e ntr
ali z
atio
nMarket integration
Gov
erna
nce
Integrated
Page 8
Stabilization Scenarios and Implications for India
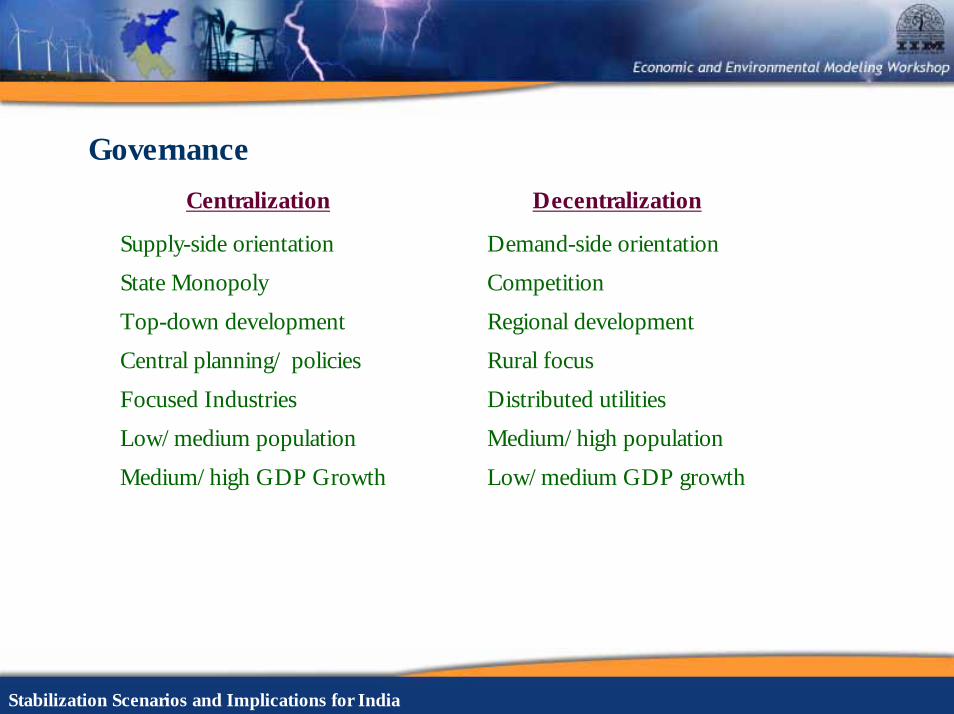
Governance
Decentralization
Demand-side orientation
Competition
Regional development
Rural focus
Distributed utilities
Medium/high population
Low/medium GDP growth
Centralization
Supply-side orientation
State Monopoly
Top-down development
Central planning/ policies
Focused Industries
Low/medium population
Medium/high GDP Growth
Page 9
Stabilization Scenarios and Implications for India
Market Integration
High integration
High-medium growth
Low tariffs
Technology transfer
External investment
Globalization/ competition
Low integration
Low-medium growth
High tariffs
Indigenous technology
Self reliance model
Fragmanted market
Page 10
Stabilization Scenarios and Implications for India
India: Population Projection
High
Medium
Low
1000
1100
1200
1300
1400
1500
2001 2011 2021 2031
Years
Pop
ulat
ion
(Mill
ion)
Page 11
Stabilization Scenarios and Implications for India
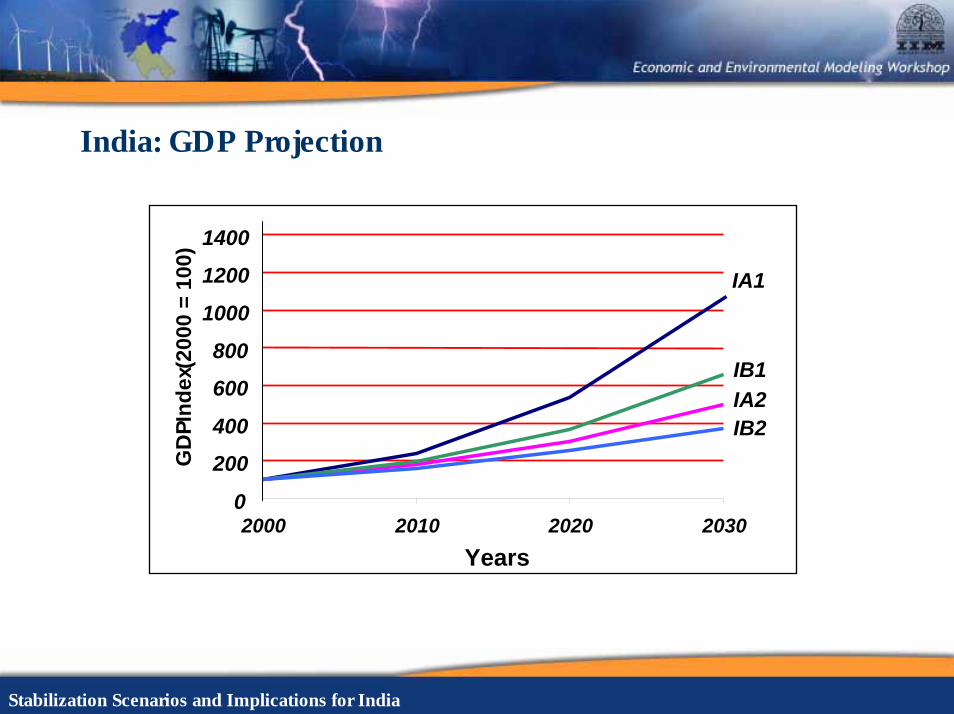
India: GDP Projection
0
200
400
600
800
1000
1200
1400
2000 2010 2020 2030Years
GD
P Ind
ex(2
000
= 10
0)
IA1
IB1IA2IB2
Page 12
Stabilization Scenarios and Implications for India
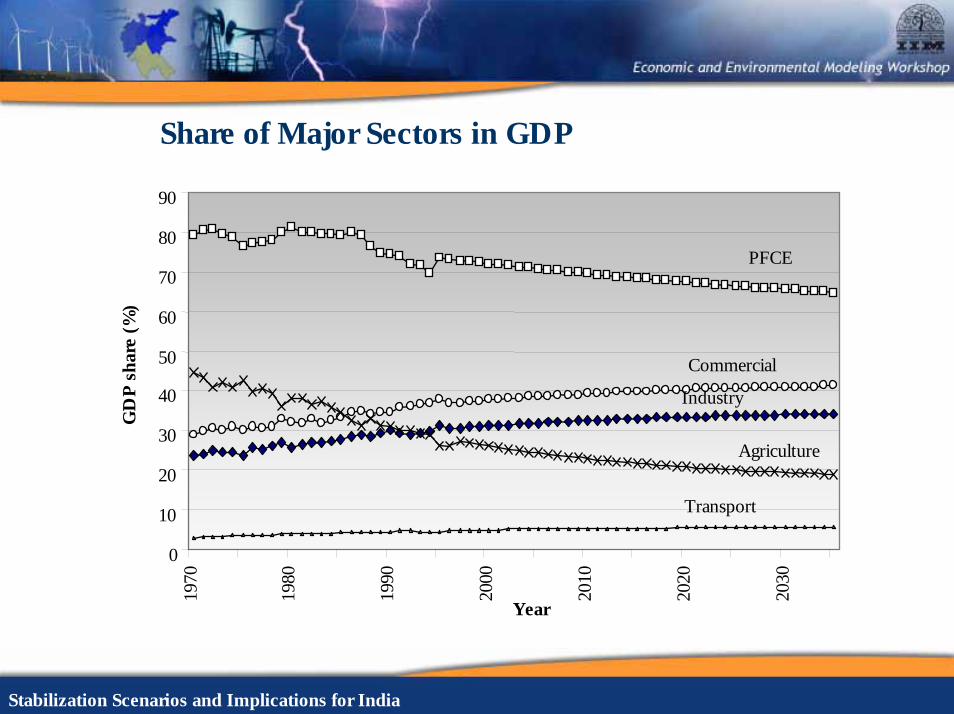
Share of Major Sectors in GDP
0
10
20
30
40
50
60
70
80
9019
70
1980
1990
2000
2010
2020
2030
Year
GD
P s
har
e (%
)
Industry
Commercial
Transport
Agriculture
PFCE
Page 13
Stabilization Scenarios and Implications for India
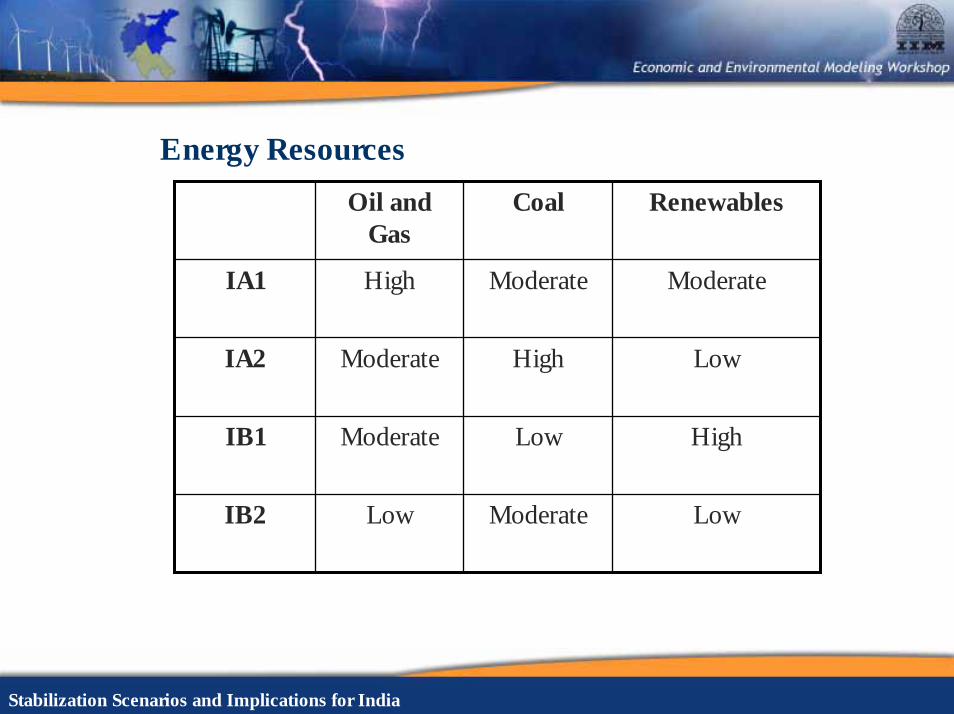
Energy Resources
Oil and Gas
Coal Renewables
IA1 High Moderate Moderate
IA2 Moderate High Low
IB1 Moderate Low High
IB2 Low Moderate Low
Page 14
Stabilization Scenarios and Implications for India
National Development Goals
1) Economic Security
2) Energy Security
3) Environment Security
4) Water Security
5) Food Security
6) Health Security
Page 15
Stabilization Scenarios and Implications for India
Future Energy and Emissions Projections for Scenarios
Page 16
Stabilization Scenarios and Implications for India
Integrated Bottom-Up Modeling System
Long-term Supply & Demand Technology-Mix, Fuel-Mix, Emission, Cost
Energy Sector Optimization Model ( MARKet ALlocation )
Long -Term Demand
Projection ModelTechnology Shares
End -use
Transport Agriculture Residential CommercialIndustry
Urban Rural Steel
Cement
Aluminum
Sugar
Chlor -Alkali PaperBrickTextiles Fertilizer Others
End -use Sub -Sector Models ( Asia -Pacific Integrated Model/ENDUSE)
Road Rail
Ship Air
Demands
Page 17
Stabilization Scenarios and Implications for India
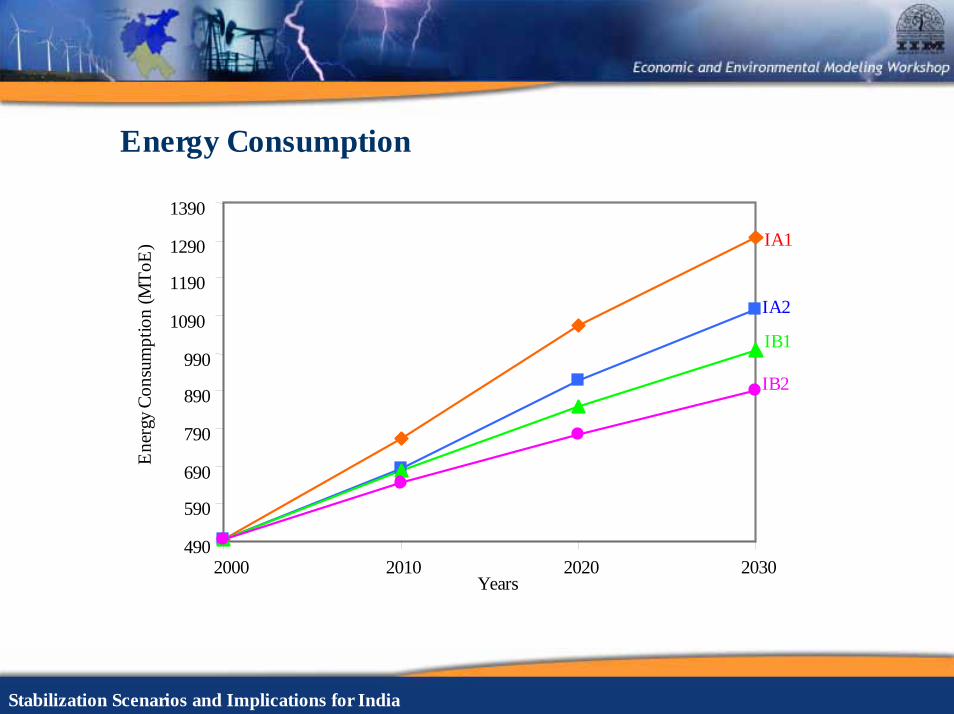
Energy Consumption
Years
490
590
690
790
890
990
1090
1190
1290
1390
2000 2010 2020 2030
Ene
rgy
Cons
umpt
ion
(MTo
E) IA1
IA2
IB1
IB2
Page 18
Stabilization Scenarios and Implications for India
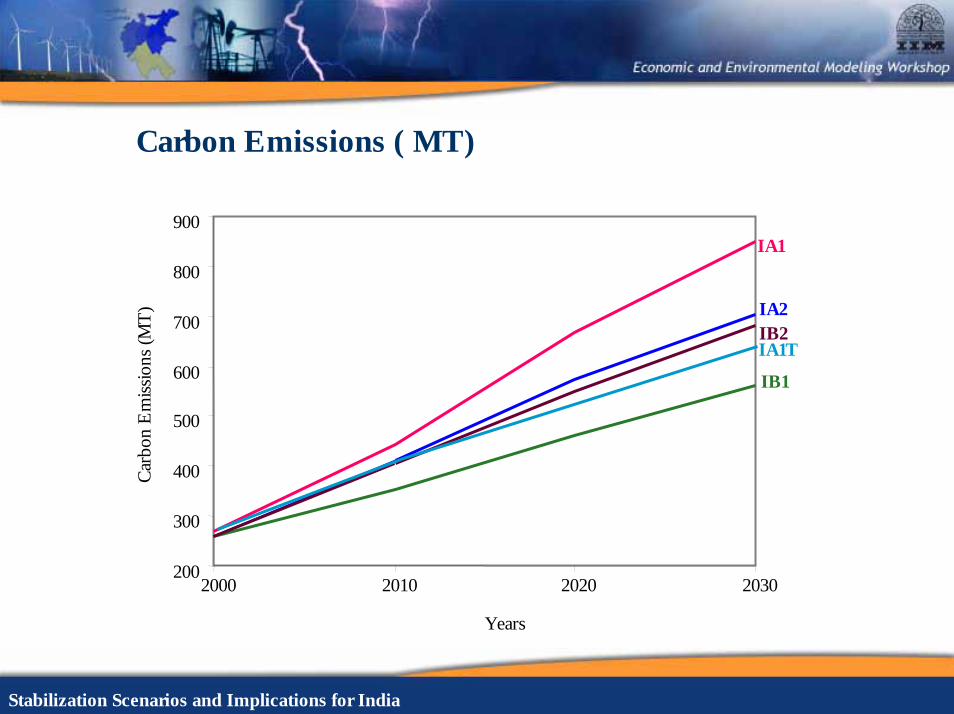
Carbon Emissions ( MT)
200
300
400
500
600
700
800
900
2000 2010 2020 2030
Carb
on E
miss
ions
(MT)
IA1
IA2
IB1
IB2IA1T
Years
Page 19
Stabilization Scenarios and Implications for India
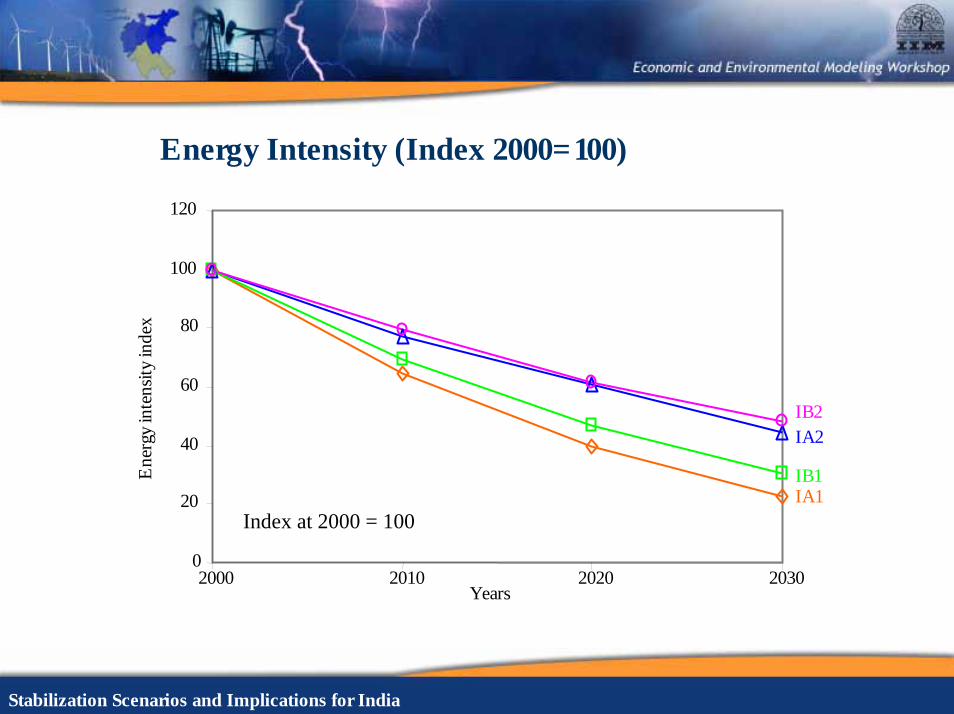
Energy Intensity (Index 2000=100)
0
20
40
60
80
100
120
2000 2010 2020 2030Years
Ene
rgy
inte
nsity
inde
x
IA1
IA2
IB1
IB2
Index at 2000 = 100
Page 20
Stabilization Scenarios and Implications for India
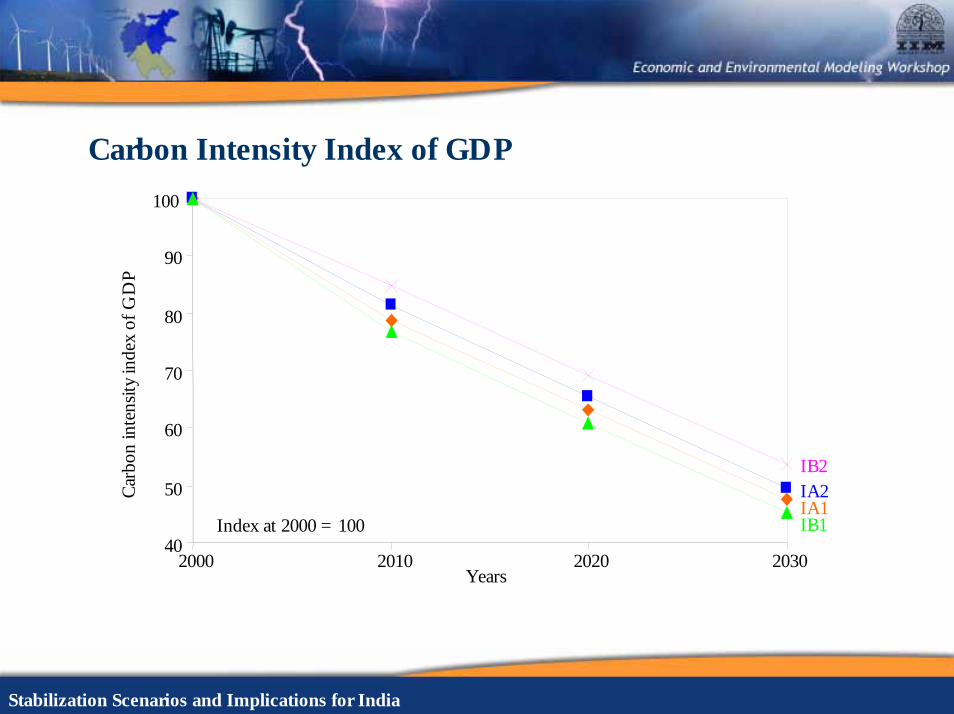
Carbon Intensity Index of GDP
40
50
60
70
80
90
100
2000 2010 2020 2030Years
Carb
on in
tens
ity in
dex
of G
DP
IA1IA2
IB1
IB2
Index at 2000 = 100
Page 21
Stabilization Scenarios and Implications for India
Per Capita Carbon Emissions (kgC/person)
250
300
350
400
450
500
550
600
650
700
2000 2010 2020 2030Years
Per
Cap
ita
Em
issi
ons
IA1
IA2
IB1
IB2
Page 22
Stabilization Scenarios and Implications for India
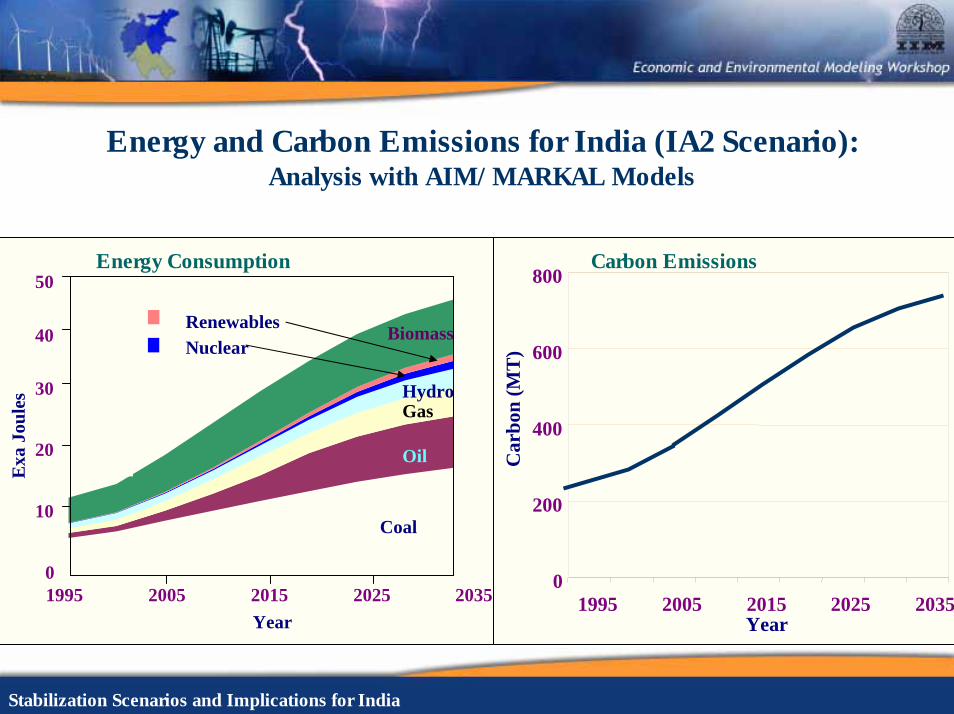
Energy and Carbon Emissions for India (IA2 Scenario): Analysis with AIM/MARKAL Models
0
200
400
600
800
1995 2005 2015 2025 2035Year
Car
bon
(MT
)
0
10
20
30
40
50
1995 2005 2015 2025 2035Year
Exa
Joul
es
Coal
Oil
GasHydro
NuclearRenewables Biomass
Carbon EmissionsEnergy Consumption
Page 23
Stabilization Scenarios and Implications for India
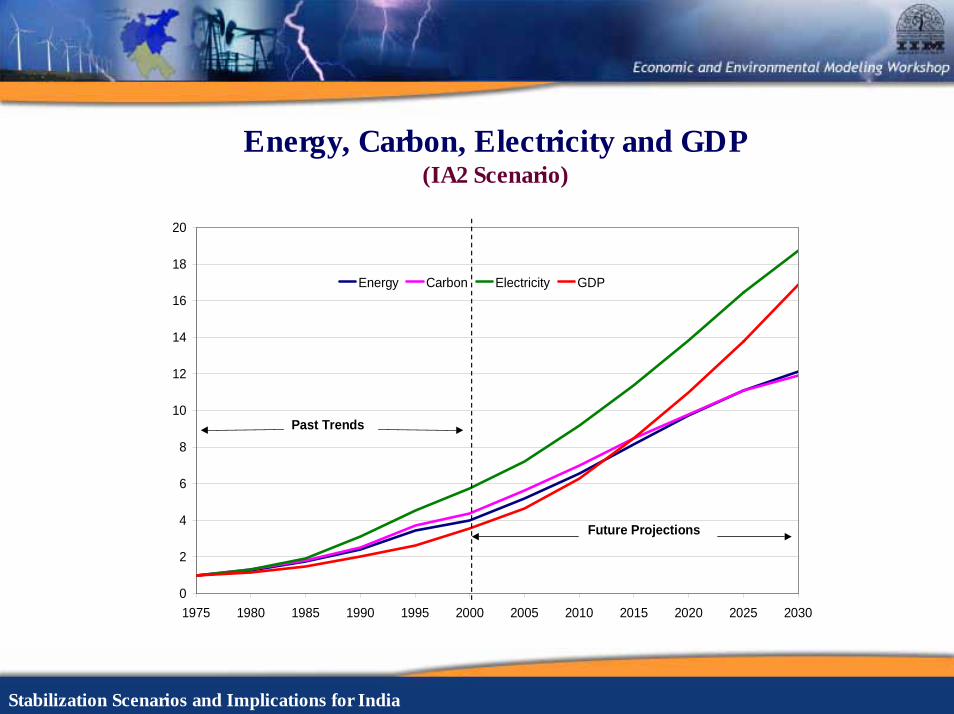
Energy, Carbon, Electricity and GDP(IA2 Scenario)
0
2
4
6
8
10
12
14
16
18
20
1975 1980 1985 1990 1995 2000 2005 2010 2015 2020 2025 2030
Energy Carbon Electricity GDP
Past Trends
Future Projections
Page 24
Stabilization Scenarios and Implications for India
GDP intensities of Energy, Electricity and Carbon(IA2 Scenario)
0
0.2
0.4
0.6
0.8
1
1.2
1.4
1.6
1.8
1975 1980 1985 1990 1995 2000 2005 2010 2015 2020 2025 2030
Electricity
CarbonEnergy
Past Trends Future Projections
Page 25
Stabilization Scenarios and Implications for India
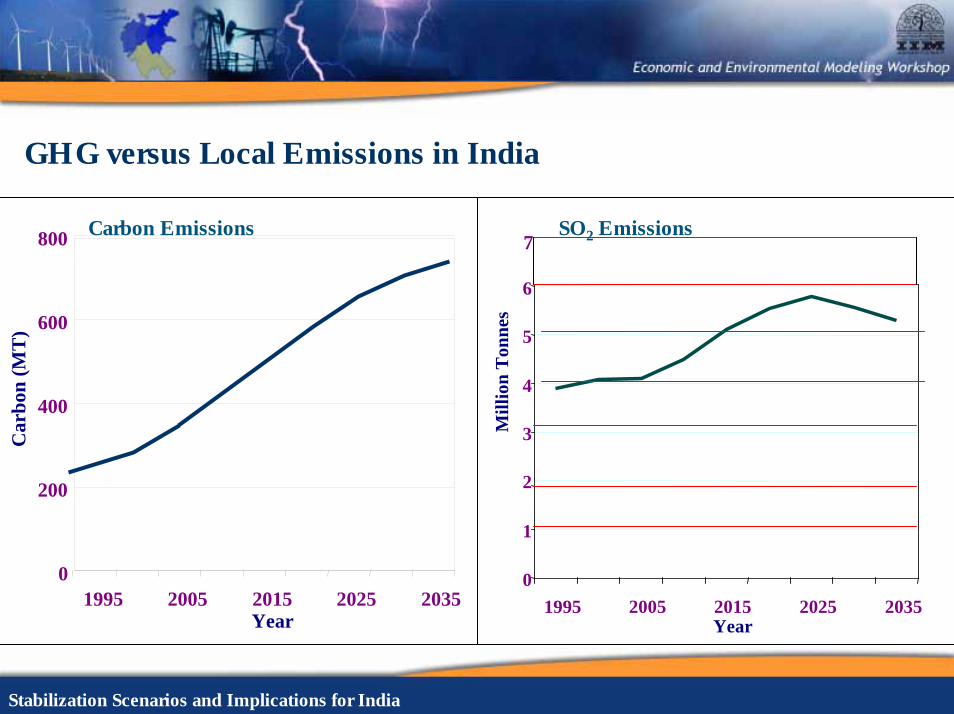
GHG versus Local Emissions in India
0
200
400
600
800
1995 2005 2015 2025 2035Year
Car
bon
(MT
)
Year
Mill
ion
Ton
nes
0
1
2
3
4
5
6
1995 2005 2015 2025 2035
7Carbon Emissions SO2 Emissions
Page 26
Stabilization Scenarios and Implications for India
Implications of Medium Term Mitigation
Assessment for IA2 Scenario for 2000-2030 Period
Page 27
Stabilization Scenarios and Implications for India
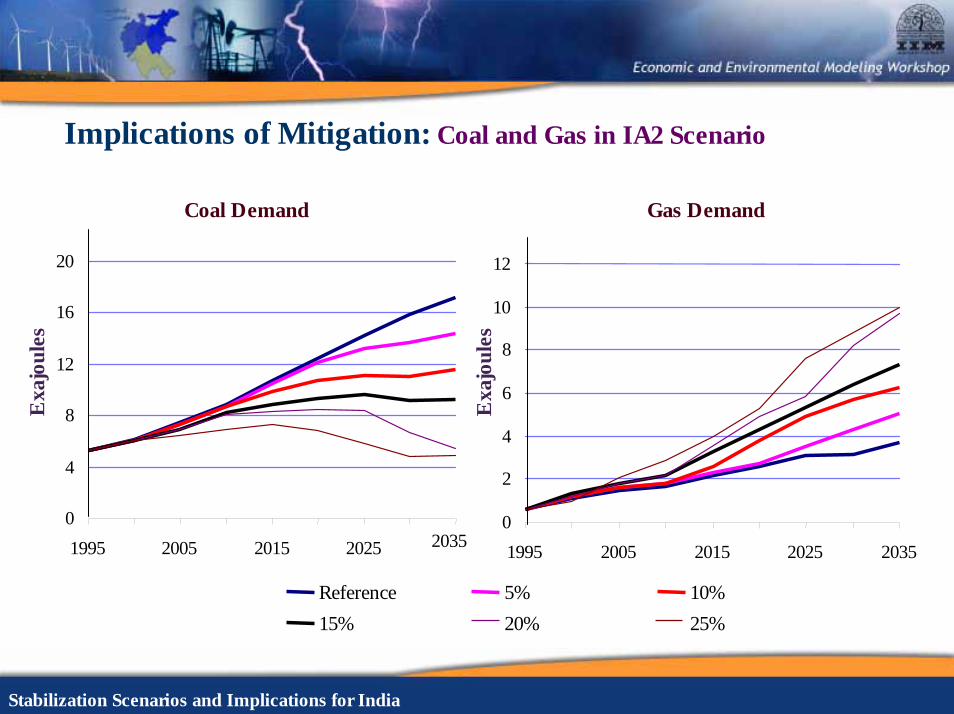
Implications of Mitigation: Coal and Gas in IA2 Scenario
Coal Demand
0
4
8
12
16
20
1995 2005 2015 2025 2035
Exa
jou
les
Reference15%
Gas Demand
0
2
4
6
8
10
12
1995 2005 2015 2025 2035
Exa
jou
les
5% 10%20% 25%
Page 28
Stabilization Scenarios and Implications for India
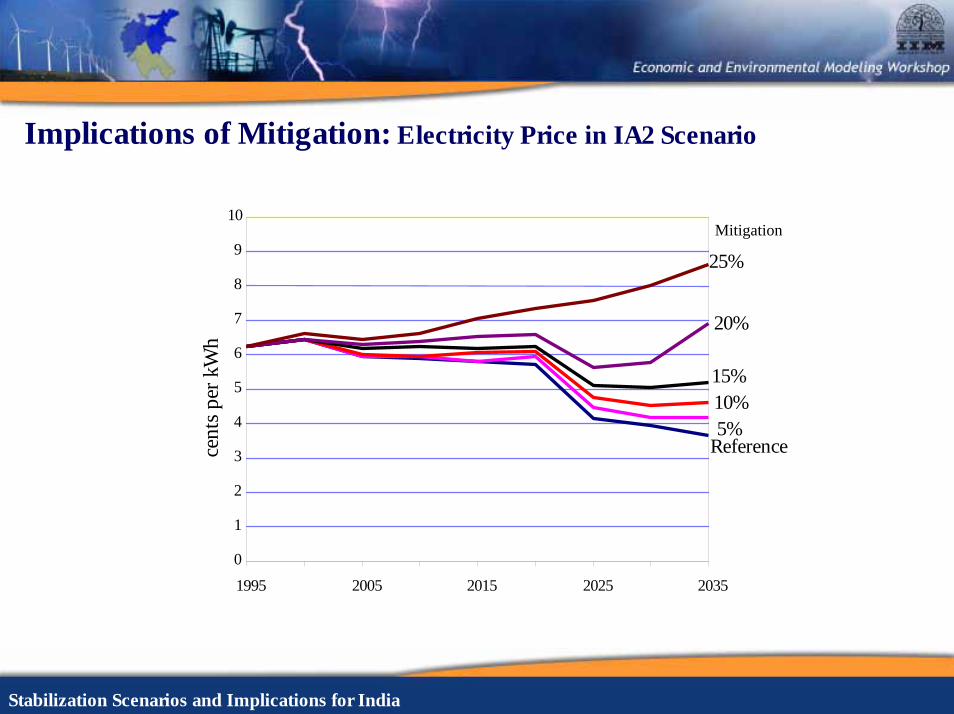
Implications of Mitigation: Electricity Price in IA2 Scenario
0
1
2
3
4
5
6
7
8
9
10
1995 2005 2015 2025 2035
cent
s per
kW
h
Reference5%10%15%
20%
25%
Mitigation
Page 29
Stabilization Scenarios and Implications for India
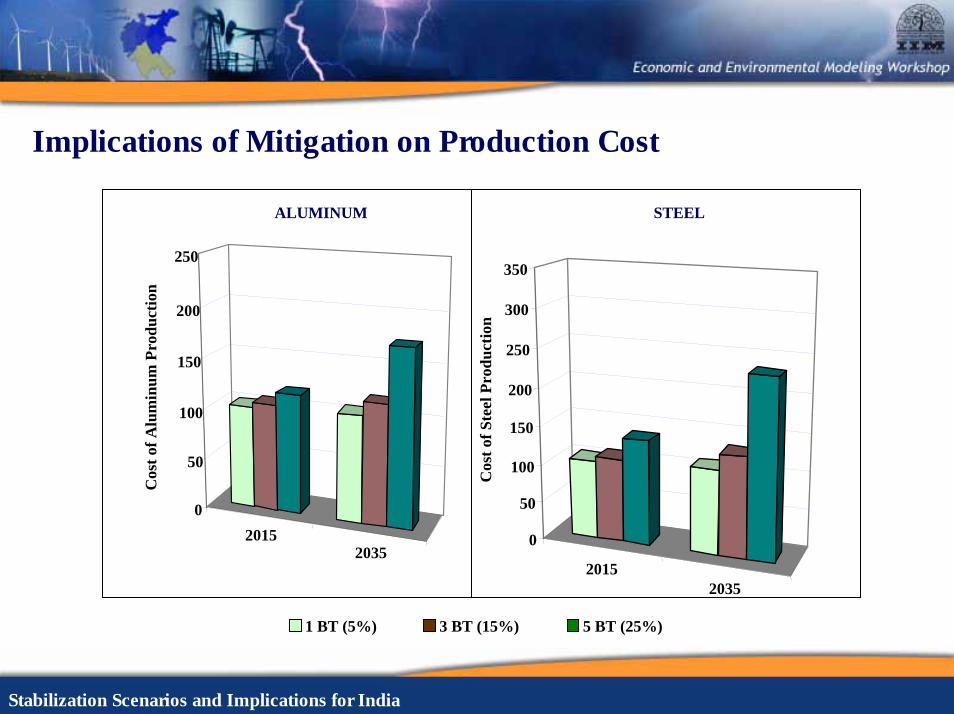
Implications of Mitigation on Production Cost
20152035
0
50
100
150
200
250
Cos
t of A
lum
inum
Pro
duct
ion
ALUMINUM
20152035
0
50
100
150
200
250
300
350
Cos
t of S
teel
Pro
duct
ion
STEEL
1 BT (5%) 3 BT (15%) 5 BT (25%)
Page 30
Stabilization Scenarios and Implications for India
Carbon Mitigation Supply Curve: (2005-2035)
0
10
20
30
40
50
60
1 2 3 4 5 6 7Carbon abatement (billion ton)
Cos
t ($/
Ton
of C
arbo
n)6 billion tons of mitigation below $25/ ton of carbon
Page 31
Stabilization Scenarios and Implications for India
Implications of Stabilization Regimes
Assessment for IA2 Scenario for 2000-2100 Period
Page 32
Stabilization Scenarios and Implications for India
Primary Energy Projections (IA2 Scenario)
21000
20
40
60
80
100
1995 2010 2025 2040 2055 2070 2085Years
Exa
Joul
es
Coal
Liquid
GasNuclear
Hydro
Renewables
Imports
Energy Security Concern
Page 33
Stabilization Scenarios and Implications for India
Carbon Emission Projections (IA2 Scenario)
0
300
600
900
1200
1500
1800
Milli
on T
onne
s
1995 2010 2025 2040 2055 2070 2085 2100
Power Agriculture Residential&Commercial Industry Transport
208
1655
Page 34
Stabilization Scenarios and Implications for India
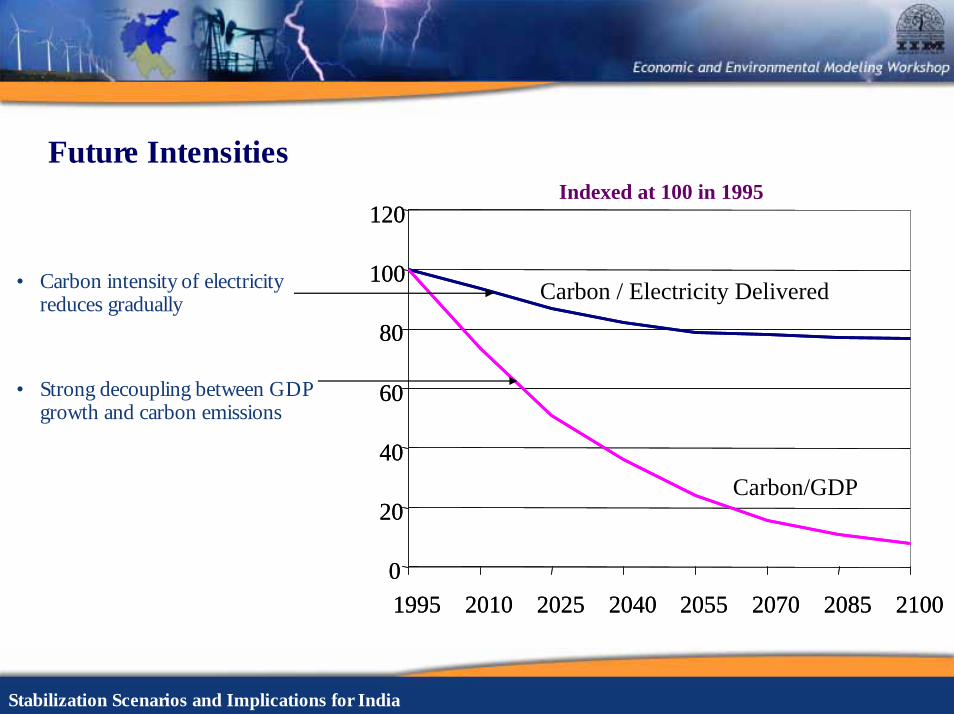
Future Intensities
• Carbon intensity of electricity reduces gradually
• Strong decoupling between GDP growth and carbon emissions
0
20
40
60
80
100
120
1995 2010 2025 2040 2055 2070 2085 21000
20
40
60
80
100
120
1995 2010 2025 2040 2055 2070 2085 2100
Carbon / Electricity Delivered
Carbon/GDP
Indexed at 100 in 1995
Page 35
Stabilization Scenarios and Implications for India
Carbon Emission Constraints
0
300
600
900
1200
1500
1800
1995 2010 2025 2040 2055 2070 2085 2100
Mill
ion
Ton
550 ppmv
650 ppmv
Base
Page 36
Stabilization Scenarios and Implications for India
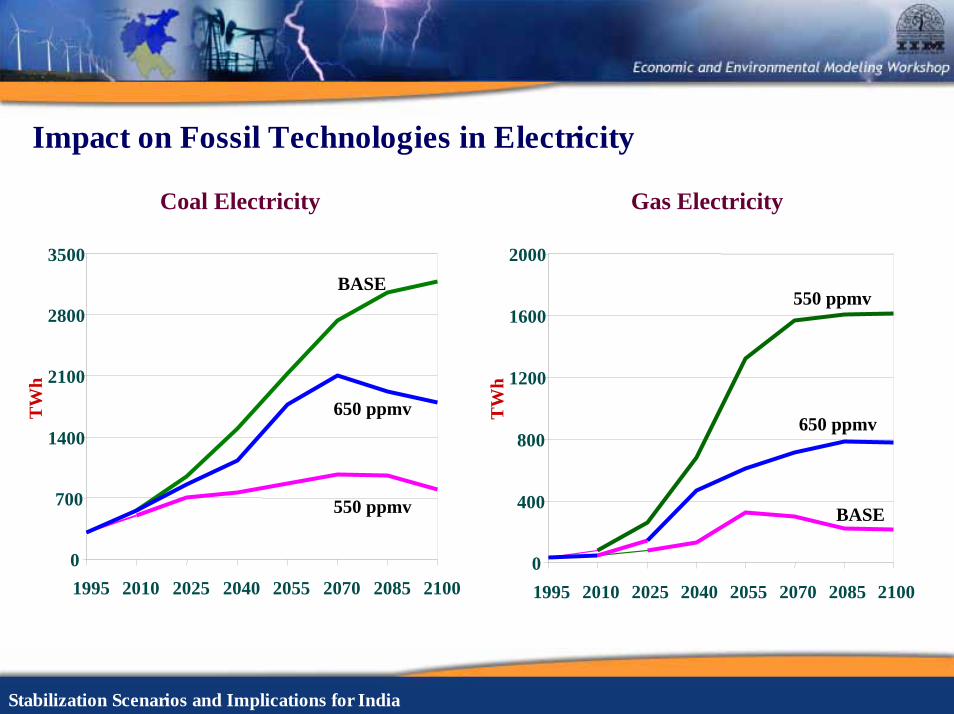
Impact on Fossil Technologies in Electricity
0
700
1400
2100
2800
3500
1995 2010 2025 2040 2055 2070 2085 2100
TW
h
BASE
550 ppmv
650 ppmv
Coal Electricity
0
400
800
1200
1600
2000
1995 2010 2025 2040 2055 2070 2085 2100
TW
h
550 ppmv
650 ppmv
Gas Electricity
BASE
Page 37
Stabilization Scenarios and Implications for India
Impact on New and Renewable Technologies
0
100
200
300
400
500
2070 2085 2100
TW
h
BASE
550 ppmv
650 ppmv
Nuclear Fusion
0
150
300
450
600
750
1995 2010 2025 2040 2055 2070 2085 2100
TW
h
BASE
550 ppmv
650 ppmv
Renewable Technologies
Page 38
Stabilization Scenarios and Implications for India
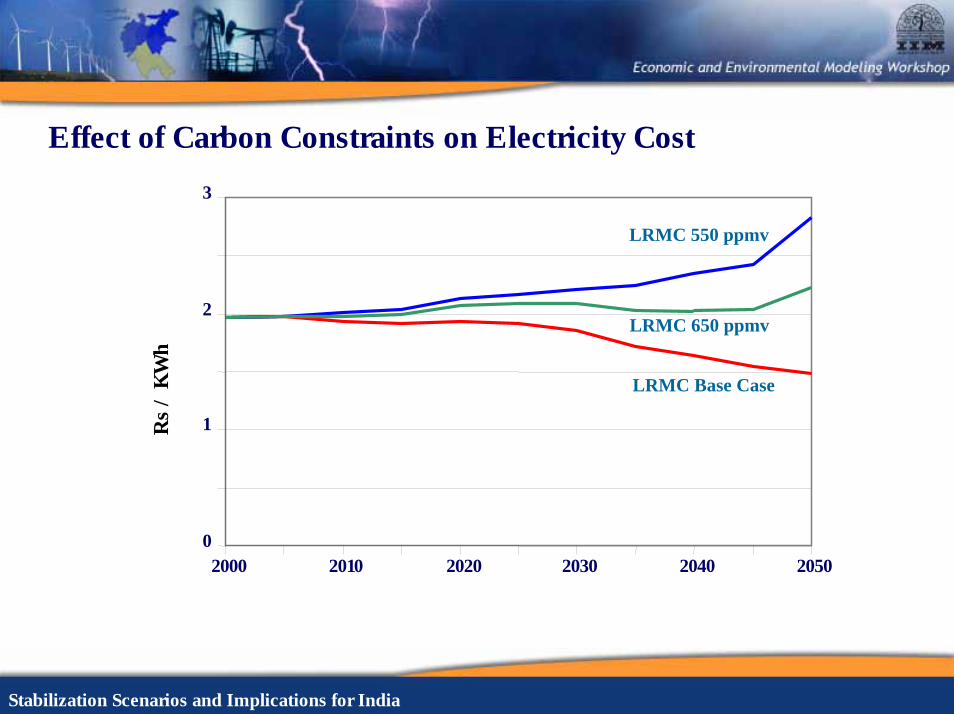
Effect of Carbon Constraints on Electricity Cost
0
1
2
3
2000 2010 2020 2030 2040 2050
Rs
/ K
Wh
LRMC Base Case
LRMC 550 ppmv
LRMC 650 ppmv
Page 39
Stabilization Scenarios and Implications for India
South-Asia Regional Cooperation: Implications for Stabilization
Page 40
Stabilization Scenarios and Implications for India
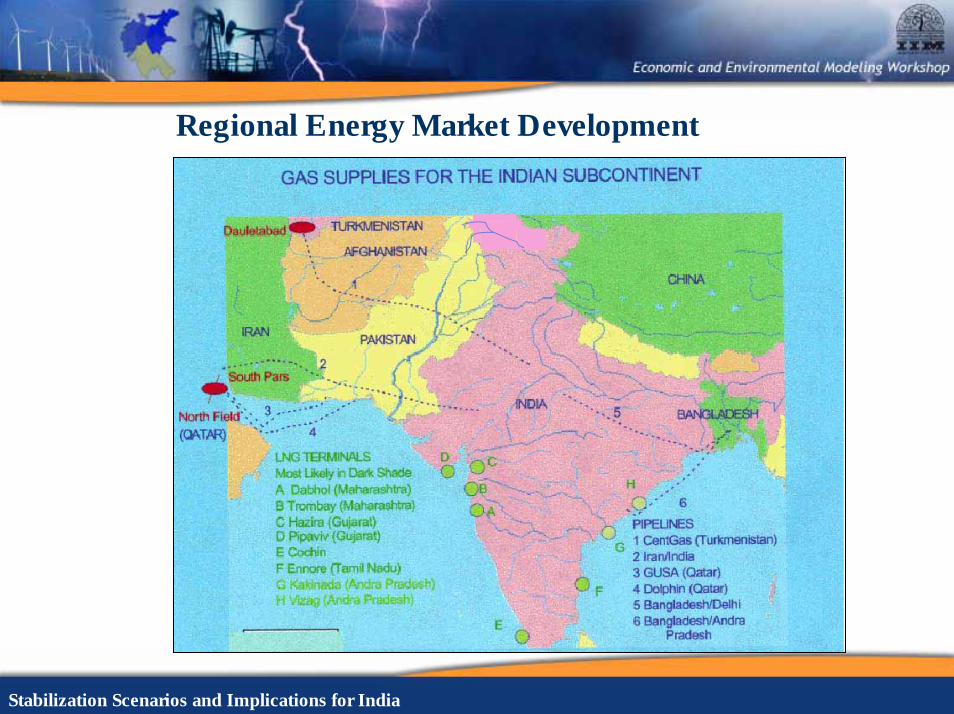
Regional Energy Market Development
Page 41
Stabilization Scenarios and Implications for India
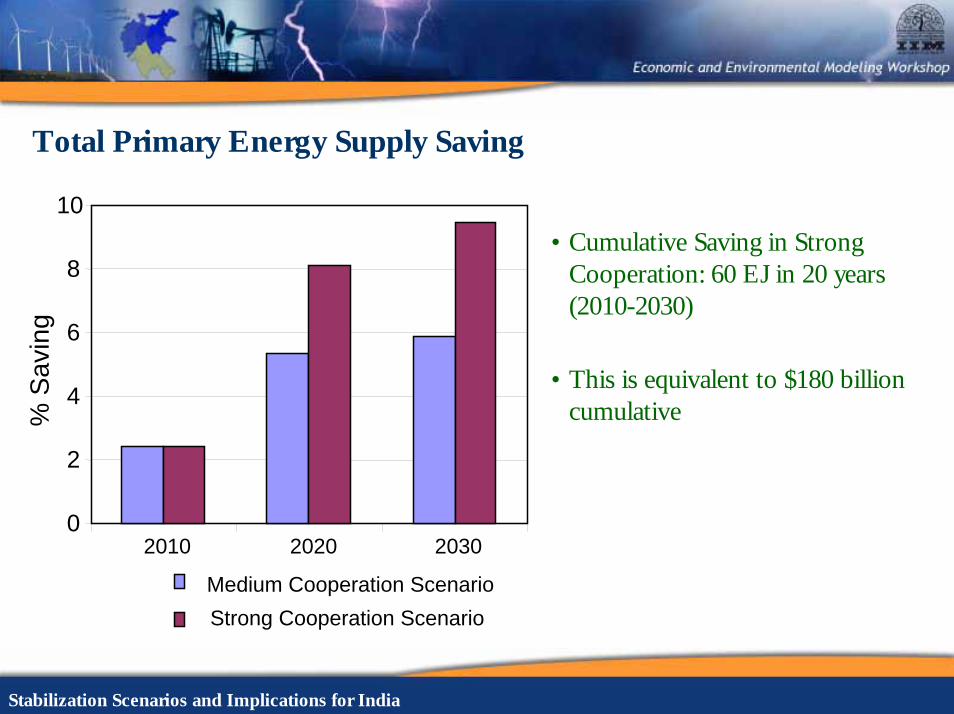
Total Primary Energy Supply Saving
• Cumulative Saving in Strong Cooperation: 60 EJ in 20 years (2010-2030)
• This is equivalent to $180 billion cumulative
0
2
4
6
8
10
2010 2020 2030
% S
avin
g
Medium Cooperation ScenarioStrong Cooperation Scenario
Page 42
Stabilization Scenarios and Implications for India
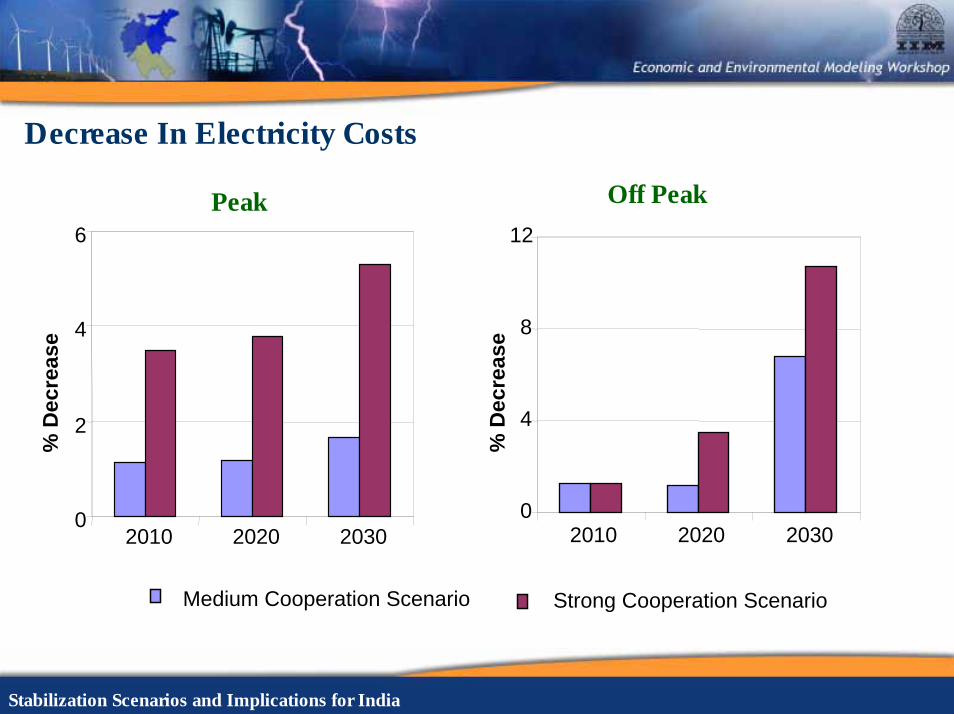
Decrease In Electricity Costs
0
2
4
6
2010 2020 2030
% D
ecre
ase
0
4
8
12
2010 2020 2030
Off PeakPeak
% D
ecre
ase
Medium Cooperation Scenario Strong Cooperation Scenario
Page 43
Stabilization Scenarios and Implications for India
Benefits from South-Asia Energy Cooperation (2010-2030)
Benefit (Saving)
$ Billion % of Region's GDP
Energy (Direct Benefits)
Energy 60 Exa Joule 180 0.48 Investment in Energy Supply Technologies
72 0.19
Investment in Energy Demand Technologies
69 0.18
Environment (Indirect Benefits) Carbon 1.4 Billion Ton 28 0.08 Sulfur Dioxide (SO2) 50 Million Ton 10 0.03
Total Direct and Indirect Benefits 359 0.98 Spillover Benefits
Water 16 GW additional hydro capacity Flood Control From additional dams Competitiveness Reduced unit energy/electricity cost
Page 44
Stabilization Scenarios and Implications for India
Stabilization and Technological Change
Page 45
Stabilization Scenarios and Implications for India
Technological Change in India to Stabilize CO2 at 550 ppmv
0
500
1000
1500
2000
2500
1990 2005 2020 2035 2050 2065 2080 2095
Carbon CaptureEnergy EfficiencyW indSolarBiomassHydroNuclearGasOilIndia 550 ppmv emission
Reference Case Emissions
400
800
1200
2000
1600
550 PPMV
Page 46
Stabilization Scenarios and Implications for India
Stabilization: Policy Issues and Concerns
• UNFCCC Article 2 definition (Balancing costs and benefits)
• Emissions Rights Regime
• Indigenous Coal
• Competitiveness
• Structural changes in the economy (autonomous and policy driven)
• Implications for Developmental Goals
Page 47
Stabilization Scenarios and Implications for India
Stabilization: Policy Actions
• Technology Portfolio
• “Fair” Allocation of Emissions Rights
• Linking Development and Climate Change
• Obtaining Multiple Dividends (Designing Pathways)