Variations in ratios of stable carbon isotopes haveprovided a wealth of information concerning theorigin and the history of carbon-containing mate-rial.",2 Reaction rates of '2C differ from those of '3Cowing to the kinetic isotope effect.3 For example,when carbon dioxide is fixed during green plantphotosynthesis, an approximately 2%-3% decrease of'3C/12C occurs in most plants.4 Reaction conditions,such as temperature and pressure, can influence the13C/ '2C ratio in the products. Also, geological process-ing can mix deposits, affecting isotopic ratios. Typicalvariations among different inorganic deposits are upto several tenths of one percent, and, among organicdeposits, the variations are even greater.' Thus, it ispossible to use the isotopic ratio measurements ofcarbon in such diverse samples as rocks, soil, andexpired breath from animals to gain insight into theorigin of the carbon or the conditions under which thesamples were formed. For example, 13C/l 2C measure-
J. F. Becker is with the Department of Physics, San Jose StateUniversity, 1 Washington Square, San Jose, California 95192-0106. T. B. Sauke is with the Solar System Exploration Branch,
Ames Research Center, National Aeronautics and Space Adminis-tration, Moffett Field, California 94035. M. Loewenstein is with the
Atmospheric Chemistry and Dynamics Branch, Ames ResearchCenter, National Aeronautics and Space Administration, MoffettField, California 94035.
ments help to trace the sources of petroleum andnatural gases.5
By using a tunable diode laser (TDL) spectrometerto record absorption spectra of 2CO2 and 3CO2 infra-red lines, we can measure the isotopic ratio of thecarbon in a sample. The usual method of measuring' 3C/ 2̀C ratios is by the well-accepted mass spectromet-ric technique.6'7 This method is extremely accuratebut requires substantial sample preparation and puri-fication to obtain reliable results.8 At the high spec-tral resolution provided by semiconductor diode la-sers, problems of impurity gas interference with themeasurement are essentially eliminated. The narrowspectral lines of impurity gases, such as H2 0, CH4, 03,and N20, for example, tend to lie far from the narrowrovibrational lines of the CO2 gas being studied. Thisrepresents a major advantage over the mass spectro-metric technique for measuring isotopic ratios. Forexample, organic material could be reacted undereither oxidizing or reducing conditions, and the result-ing gases analyzed directly without the additionalpurification steps required for mass spectrometricanalysis. This is an important advantage for in situanalysis and remote applications such as planetaryexploration missions. Tunable diode lasers are wellsuited in general for space and flight applications andare currently in use in several flight instruments, forexample, the airborne tunable laser absorption spec-trometer (ATLAS).9
In this paper we describe an optical technique tomeasure 13C/ 12C ratios in CO2 by TDL laser spectros-copy. The technique, as well as the optical system,
data acquisition, and data analysis are described anddiscussed. Preliminary experimental results are alsopresented.
II. Experimental Methods
Several approaches that use (TDL's) for carbon isoto-pic analysis have been reported."" The presentresearch uses a technique proposed in 1981 by Wall etal.," which involves the use of absorption lines of'2CO2 and "CO2 in the 4.3-p1m vibrational bands. Inthe spectral region where the v bands of the twoisotopes overlap, certain closely spaced 2CO2 and"CO2 rovibrational spectral lines have approximatelyequal absorbance at the anticipated 1:90 isotopicratio, as shown in Fig. 1. Several isotopic line pairsare suitable, such as the R(10) line of "CO at2291.681 cm-' and the P(60) line of 2CO2 at 2291.542cm'1, both of the v fundamental band of CO2. Thesetwo lines are separated by only 0.139 cm-' but can bewell resolved by using a TDL. Comparing the absorp-tions of such a line pair yields a measure of theisotopic ratio in the sample gas. It is important for theisotopic lines to have approximately equal absor-bances so that measurement errors can be mini-mized.
-18
-19 _
-20 -
-21
-22 _
8 -23C 2200WCu.0
-20 _
.0
-21 _2280
.N1jl
2250
2285
2300Frequency (cm_1)
2290Frequency (cm-1)
2350
2295
Fig. 1. Upper graph, integrated absorbances [cm'/(moleculecm-')] of individual rovibrational lines from the v, bands of 13CO2(dashed lines) and "CO2 (solid lines). The relative absorbance of thelines is indicated for an isotopic ratio (C/ C) of 1:90 as is thecase for Earth samples. The bands overlap in such a way as to haveapproximately equal absorbances for the two isotopes in the regionfrom 2280 to 2300 cm-'. Lower graph, expanded plot of theoverlap region of the v3 bands of "CO, (dashed lines) and "CO2(solid lines). A particularly suitable pair of 13C/ 1C lines is indicatedby an asterisk. The R(10) line of 13CO2 and the P(60) line of "CO,are only 0.139 cm-' apart and have nearly equal absorbances.These two lines may be scanned in one sweep and the relativeabsorbances measured can be used to determine the isotopiccomposition. Representative spectra of these lines are shown inFigs. 4 and 5.
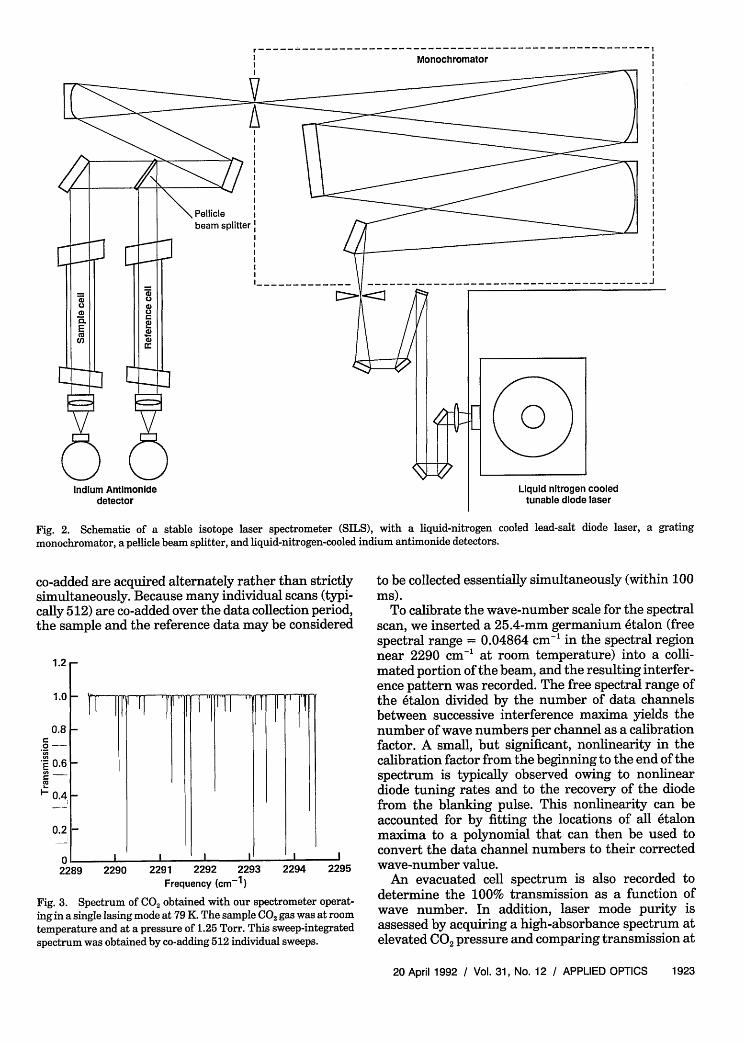
The TDL spectrometer used in our laboratory is amodified Model LS-3 (Laser Photonics, AnalyticsDivision, Bedford, Mass. 01730) and is shown schemat-ically in Fig. 2. The diode lasers (model L5621, LaserPhotonics, Analytics Division, Bedford, Mass. 01730)used in the spectrometer were of the buried hetero-structure type fabricated by the molecular beamepitaxy technique and were composition tuned tooperate in the region 2290-2305 cm-'. These diodeshave only recently become commercially availableand are an important component in achieving highlyaccurate measurements. They operate at tempera-tures above 77 K, eliminating the need for a closedcycle helium refrigerator with its associated mechani-cal vibrations, and they have improved single-modeemission characteristics compared with previouslyavailable diodes. The operating frequency of the laseroutput is tuned by varying the diode temperature andthe injection current. The laser beam is passedthrough a 0.5-m Czerny-Turner grating monochro-mator to ensure isolation of a single laser mode. Thelaser beam is split with a pellicle beam splitter, andthe two beams are directed through identical sampleand reference gas cells, each having a 16-cm pathlength and barium fluoride windows. The liquid-nitrogen cooled indium antimonide detectors (Infra-Red Associates, Cranbury, N.J. 08512) are dc coupledinto a transimpedance preamplifier. The amplifiedsignals from the detectors are fed into a 12-bit,100-kHz, analog-to-digital converter board (DAS-16F, Metrabyte Corp., Taunton, Mass. 02780) in-stalled in an AT&T personal computer Model 6300,which is IBM PC compatible.
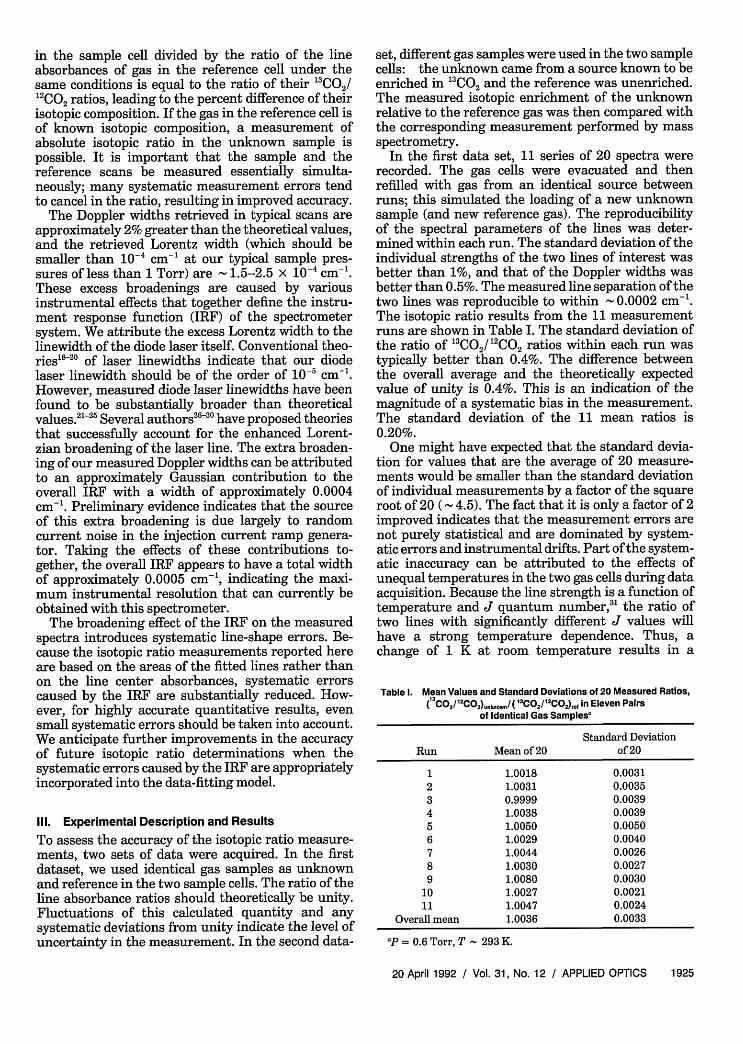
The laser temperature is adjusted to select anappropriate lasing mode, and the injection current isramped so that the laser output scans across thespectral region that includes the absorption lines ofinterest. We achieved continuous frequency tuning ina single mode over a frequency interval greater than 5cm , as shown in Fig. 3. This interval includes aline pair that is appropriate for isotopic ratio determi-nation. Verification of spectroscopic line identity wasmade by comparing measured spectral parameterswith corresponding parameters from the HITRAN data-base. 4
At the beginning of the current ramp, a blankingcurrent pulse briefly turns off the laser and provides azero signal level. The blanking pulse and the currentramp are repeated at a fixed frequency, typicallybetween 20 and 50 Hz. The detected signal from eachsweep is digitized and repeated sweeps are co-added toincrease signal-to-noise ratio. This technique is knownas sweep integration.'5 Rapid data acquisition, at 100k samples/s, is controlled by the built-in timing andthe direct memory access circuitry on the data acqui-sition board, proceeding as a hardware-controlledbackground process. Concurrent with the data acqui-sition, fast assembly language subroutines performsweep integration by co-adding the data points fromeach spectrum to previously acquired spectra.
w .qT11\q11111111l~~lllllllllll~llll.................................
I I I-. 1. �.................... I......, ............I..... .. ... .
lo:1
III
l.;
: : : I '.: I : : : I :
Mnnnechrnmntnr
Pellicle 1beam splitter
II
II
I - _ _ _ _ _-
Indlum Antimonidedetector
:i
Liquid nitrogen cooledtunable diode laser
Fig. 2. Schematic of a stable isotope laser spectrometer (SILS), with a liquid-nitrogen cooled lead-salt diode laser, a gratingmonochromator, a pellicle beam splitter, and liquid-nitrogen-cooled indium antimonide detectors.
co-added are acquired alternately rather simultaneously. Because many individua]cally 512) are co-added over the data collethe sample and the reference data may b
1.2 -
1.0
0.8
0 --
*g 0.6
'- 0.4
0.2
L22E
I a
19 2290 2291 2292 2293Frequency (cm- 1)
Fig. 3. Spectrum of CO, obtained with our spectiingin a single lasing mode at 79 K. The sample CO,,temperature and at a pressure of 1.25 Torr. This s)spectrum was obtained by co-adding 512 individual
than strictly to be collected essentially simultaneously (within 100I scans (typi- ms).ction period, To calibrate the wave-number scale for the spectrale considered scan, we inserted a 25.4-mm germanium 6talon (free
spectral range = 0.04864 cm-' in the spectral regionnear 2290 cm-' at room temperature) into a colli-mated portion of the beam, and the resulting interfer-ence pattern was recorded. The free spectral range ofthe 6talon divided by the number of data channelsbetween successive interference maxima yields thenumber of wave numbers per channel as a calibrationfactor. A small, but significant, nonlinearity in thecalibration factor from the beginning to the end of thespectrum is typically observed owing to nonlineardiode tuning rates and to the recovery of the diodefrom the blanking pulse. This nonlinearity can beaccounted for by fitting the locations of all 6talonmaxima to a polynomial that can then be used toconvert the data channel numbers to their corrected
2294 2295 wave-number value.An evacuated cell spectrum is also recorded to
rometer operat- determine the 100% transmission as a function ofgas was at room wave number. In addition, laser mode purity isweep-integrated assessed by acquiring a high-absorbance spectrum atsweeps. elevated CO2 pressure and comparing transmission at
the saturated absorbance peak with the zero signallevel. The above spectral calibration scans are used inthe analysis of the experimental data. Typical spectraare shown in Fig. 4. Mode purity can be assessed bynoting how closely the high-pressure (saturated) linesapproach zero transmission. The transmission at thecenters of saturated absorption lines is typically
0.2%. It can be shown that the extended wings ofeven a single narrow Lorentz laser emission line cancontribute to measurable deviations from zero trans-mission at the saturated centers of absorption lines.'6Most of the 0.2% transmission at saturated linecenters can be attributed to this source, implying thatmode impurities contribute much less than 0.2% toour measured signal. The absolute wave-numberaxis, as determined by the talon spectrum andknown spectral line frequencies, is estimated to beaccurate to better than 0.0002 cm-'. Another data setand its calibration scans are also obtained from thesecond (reference) beam. If the isotopic compositionof the gas in the second cell is known, these data canbe used as a reference to determine the isotopiccomposition of the sample gas.
The data are subsequently transferred to a DEC
25,000
20,000
15,000
10,000
.0
CU
02
.,
0
5,000
0
20,000
15,000
10,000
5,000
0
-5,000 _0
MicrovAx computer and analyzed by using programswritten in Interactive Data Language (Research Sys-tems, Inc., Boulder, Colo. 80207). The data are fittedin transmission space to a mathematical model thatconsists of Voigt profiles that have been transformedfrom absorption space to transmission space. Theparameters varied in the nonlinear least-squares fitare the Doppler and the Lorentz linewidths, thestrength, and the peak location of each absorptionline. The analytic function for the Voigt profile is thereal part of the complex error function for whichthere exists an accurate and well-accepted rationalfraction approximation.7
Specifically, in the present case our data scans wereselected to include the "CO2 R(10) and 2CO2 P(60) v,fundamental rovibrational absorption lines that aresuitable for isotopic ratio measurements when oursystem is used. A typical spectrum of this pair isshown in Fig. 5. The transmission data shown (whichare equal to the ratio of the raw data scan and theevacuated, 100% transmission scan shown in Fig. 4)were fit to three Voigt profiles on a linear baseline. Acorrection of the nonuniformity in the frequencyinterval between data points was performed as indi-cated above. Also shown in Fig. 5 is a plot of the fit,which lies too close to the data to be distinguished onthis scale, and the residual (data minus fit) times 10.
The areas (in absorbance units) of the "CO, and'2CO2 lines can be determined from the Voigt fittingparameters. The ratio of the line absorbances of gas
1.2
-.212291.5
500 1000 1500Channel number
Fig. 4. Raw spectra covering the region of the 3CO, R(10) and"CO, P(60) spectral lines of the v, rovibrational band. Eachspectrum consists of 512 co-added sweeps. a, Evacuated cellindicating 100% transmission; b, spectrum of CO, lines at 0.77torr; c, spectrum of CO, lines at high pressure (high absorbance)(the saturated absorbance peaks indicate zero transmission); d,spectrum of the germanium talon inserted into the beam of theevacuated cell. The accurate wave-number spacing of the interfer-ence fringes (0.04864 cm-' per fringe) permits a reconstruction ofthe corrected wave-number axis.
Fig. 5. Transmission spectrum of the CO, lines shown in Fig. 4.This spectrum is the ratio of the raw data spectrum and the rawevacuated cell spectrum yielding the transmission. The zero trans-mission level has been shifted by taking into account the saturatedspectrum of Fig. 4 (spectrum c), which indicated 0.2% back-ground signal at the saturated absorption line center, possibly frommode impurities or laser line Lorentz tails. The wave-number axishas been assigned by taking into account the talon sweep shown inFig. 4, spectrum d. The data have a signal-to-noise ratio of severalthousand. Also shown is a plot of the fit to the data, which lies tooclose to the data to be distinguished in this figure. The residual(data minus fit) times 10 is plotted below. The small systematicdeviations between data and fit presumably are due to instrumen-tal imperfections, for example, the small but detectable width ofthe instrument response function.
in the sample cell divided by the ratio of the lineabsorbances of gas in the reference cell under thesame conditions is equal to the ratio of their 3CO2/'2CO2 ratios, leading to the percent difference of theirisotopic composition. If the gas in the reference cell isof known isotopic composition, a measurement ofabsolute isotopic ratio in the unknown sample ispossible. It is important that the sample and thereference scans be measured essentially simulta-neously; many systematic measurement errors tendto cancel in the ratio, resulting in improved accuracy.
The Doppler widths retrieved in typical scans areapproximately 2% greater than the theoretical values,and the retrieved Lorentz width (which should besmaller than 10-4 cm-' at our typical sample pres-sures of less than 1 Torr) are - 1.5-2.5 x 10⁻⁴ cm'.These excess broadenings are caused by variousinstrumental effects that together define the instru-ment response function (IRF) of the spectrometersystem. We attribute the excess Lorentz width to thelinewidth of the diode laser itself. Conventional theo-ries"20 of laser linewidths indicate that our diodelaser linewidth should be of the order of 10-' cm-'.However, measured diode laser linewidths have beenfound to be substantially broader than theoreticalvalues.21'
2 ' Several authors 2 3" have proposed theoriesthat successfully account for the enhanced Lorent-zian broadening of the laser line. The extra broaden-ing of our measured Doppler widths can be attributedto an approximately Gaussian contribution to theoverall IRF with a width of approximately 0.0004cm'1. Preliminary evidence indicates that the sourceof this extra broadening is due largely to randomcurrent noise in the injection current ramp genera-tor. Taking the effects of these contributions to-gether, the overall IRF appears to have a total widthof approximately 0.0005 cm-', indicating the maxi-mum instrumental resolution that can currently beobtained with this spectrometer.
The broadening effect of the IRF on the measuredspectra introduces systematic line-shape errors. Be-cause the isotopic ratio measurements reported hereare based on the areas of the fitted lines rather thanon the line center absorbances, systematic errorscaused by the IRF are substantially reduced. How-ever, for highly accurate quantitative results, evensmall systematic errors should be taken into account.We anticipate further improvements in the accuracyof future isotopic ratio determinations when thesystematic errors caused by the IRF are appropriatelyincorporated into the data-fitting model.
Ill. Experimental Description and Results
To assess the accuracy of the isotopic ratio measure-ments, two sets of data were acquired. In the firstdataset, we used identical gas samples as unknownand reference in the two sample cells. The ratio of theline absorbance ratios should theoretically be unity.Fluctuations of this calculated quantity and anysystematic deviations from unity indicate the level ofuncertainty in the measurement. In the second data-
set, different gas samples were used in the two samplecells: the unknown came from a source known to beenriched in "CO2 and the reference was unenriched.The measured isotopic enrichment of the unknownrelative to the reference gas was then compared withthe corresponding measurement performed by massspectrometry.
In the first data set, 11 series of 20 spectra wererecorded. The gas cells were evacuated and thenrefilled with gas from an identical source betweenruns; this simulated the loading of a new unknownsample (and new reference gas). The reproducibilityof the spectral parameters of the lines was deter-mined within each run. The standard deviation of theindividual strengths of the two lines of interest wasbetter than 1%, and that of the Doppler widths wasbetter than 0.5%. The measured line separation of thetwo lines was reproducible to within - 0.0002 cm-'.The isotopic ratio results from the 11 measurementruns are shown in Table I. The standard deviation ofthe ratio of "CO2/ 2CO2 ratios within each run wastypically better than 0.4%. The difference betweenthe overall average and the theoretically expectedvalue of unity is 0.4%. This is an indication of themagnitude of a systematic bias in the measurement.The standard deviation of the 11 mean ratios is0.20%.
One might have expected that the standard devia-tion for values that are the average of 20 measure-ments would be smaller than the standard deviationof individual measurements by a factor of the squareroot of 20 (- 4.5). The fact that it is only a factor of 2improved indicates that the measurement errors arenot purely statistical and are dominated by system-atic errors and instrumental drifts. Part of the system-atic inaccuracy can be attributed to the effects ofunequal temperatures in the two gas cells during dataacquisition. Because the line strength is a function oftemperature and J quantum number," the ratio oftwo lines with significantly different J values willhave a strong temperature dependence. Thus, achange of 1 K at room temperature results in a
Table I. Mean Values and Standard Deviations of 20 Measured Ratios,('3 CO2 /12CO2)u"nk,,,/( '3CO/12CO2)re, in Eleven Pairs
'For comparison, the actual isotopic enrichment, as determinedby mass spectrometry, is 1.0525 (P = 0.6 Torr, T 293 K).
change of approximately 2% in the absorbance ratioof lines such as the R(J = 10)/P(J = 60) pair.
Table II shows the results of the second data set inwhich the unknown sample was enriched in "3CO2The standard deviation of the ratio of 3CO2/12CO2ratios within each run was better than 0.4%. Theaverage value determined for the percent of "'CO2isotopic enrichment was 5.18 (average deviation 0.3).The actual percent of isotopic enrichment, as deter-mined by mass spectrometry,'2 was 5.25 0.01.
IV. Conclusion
Ratios of "1C/'2C in carbon dioxide have been mea-sured with our TDL spectrometer to a present accu-racy of better than 0.4%. These results were madepossible by using state-of-the-art high-temperatureTDL's, an talon and wave-number calibration tech-nique, high-speed assembly language controlled dataacquisition, and the ratioing of absorbances fromsimultaneously acquired sample and reference datascans. Increased accuracy will result from improve-ments in temperature stabilization of the gas cellsand by incorporating the IRF into the data-fittingmodel to account for known instrumental distortions.The data for an individual ratio determination areobtained over a time of less than 1 min, while thesequence of 20 pairs of spectra was obtained over atime of approximately 30 min. The length of timerequired to acquire the data can be drastically re-duced by more efficient data file handling and by useof a faster computer. Because the accuracy of thepresent measurement is limited by systematic ratherthan statistical errors, the number of co-added scansper spectrum can be reduced to speed up the dataacquisition without seriously compromising the accu-racy. In fact, faster data acquisition may improveaccuracy by limiting the time over which systemdrifts can occur. Overall optimization in choice ofsample pressure, scanning repetition rate, number ofscans to signal average, and other experimental de-tails should yield further improvements in accuracyand speed. It is expected that these and other improve-ments in technique that we are now implementingwill permit determinations of isotopic ratios to betterthan 0.1% for measurement times substantiallyshorter than 1 min, perhaps several seconds. This
laser technique permits isotopic ratios to be mea-sured without the extensive sample purification re-quired for mass spectrometric analysis; many of thecommonly expected impurity gases can be present inthe sample without adversely affecting the measure-ment. By optimizing sample cell configuration, theamount of carbon required to make an isotopic ratiodetermination can be less than a microgram. Therugged, lightweight, and reliable TDL is ideally suitedfor use in instruments both in the laboratory and inthe field. TDL spectroscopy should prove to be auseful technique for in situ measurements of isotopicratios in such diverse fields as medical diagnostics byusing expired CO2 in human breath, petroleum explo-ration, and planetary exploration missions.
The authors thank Thomas Gutierrez for his helpwith data acquisition and analysis. The mass spectro-metric analysis was generously provided by DavidDesMarais. This research was supported in part bythe National Aeronautics and Space Administration's(NASA's) Exobiology Flight Program, the Solar Sys-tem Exploration Branch at NASA Ames ResearchCenter, NASA grant NCA2-407 and NSF-REU grantPHY90-00697. This research was performed whileTodd Sauke was supported by a National ResearchCouncil NASA postdoctoral fellowship.
References1. M. Schidlowski, J. M. Hayes, and I. R. Kaplan, "Isotopic
inferences in ancient biochemistries: carbon, sulfur, hydro-gen, and nitrogen," in Earth's Earliest Biosphere, Its Originsand Evolution, J. W. Schopf, ed. (Princeton U. Press, Prince-ton, N.J., 1983).
2. D. J. DesMarais and J. G. Moore, "Carbon and its isotopes inmid-oceanic basaltic glasses," Earth Planet. Sci. Lett. 69,43-57 (1984).
3. L. Melander and W. H. Saunders, Reaction Rates of IsotopicMolecules (Wiley, New York, 1980).
4. M. H. O'Leary, "Carbon isotope fractionation in plants,"Phytochemistry 20, 553-567 (1981).
5. B. P. Tissot and D. H. Welte, Petroleum Formation andOccurrence (Springer-Verlag, Berlin, 1984).
6. A. 0. Nier, "A mass spectrometer for isotope and gas analysis,"Rev. Sci. Instrum. 18, 398-411 (1947).
7. D. E. Matthews and J. M. Hayes, "Isotope-ratio-monitoringgas chromatography-mass spectrometry," Anal. Chem. 50,1465-1473 (1978).
8. K. W. Wedeking, J. M. Hayes, and U. Matzigkeit, "Proceduresof organic geochemical analysis," in Earth's Earliest Bio-sphere, Its Origins and Evolution, J. W. Schopf, ed. (PrincetonU. Press, Princeton, N.J., 1983).
9. M. Lowenstein, J. R. Podolske, K. R. Chan, and S. E. Strahan,"Nitrous oxide as a dynamical tracer in the 1987 airborneantarctic ozone experiment," J. Geophys. Res. 94, 11,589-11,598 (1989).
10. G. J. Kemeny, R. S. Eng, and A. W. Mantz, "Utilization oftunable infrared diode lasers for the determination of labelledmolecules in gas mixtures," Acta Phys. Acad. Sci. Hung. 48,93-102 (1980).
11. D. Labrie and J. Reid, "Radiocarbon dating by infrared laserspectroscopy-a feasibility study," Appl. Phys. 24, 381-386(1981).
12. D. L. Wall, R. S. Eng, and A. W. Mantz, "Development of a
tunable diode laser isotope ratio measurement system," pre-sented at the Thirty-second Pittsburgh Conference on Analyt-ical Chemistry and Applied Spectroscopy, Pittsburgh, Pa.,March, 1981.
13. P. S. Lee and R. F. Majkowski, "High resolution infrared diodelaser spectroscopy for isotope analysis-measurement of isoto-
pic carbon monoxide," Appl. Phys. Lett. 48, 619-621 (1986).14. L. S. Rothman, R. R. Gamache, A. Goldman, L. R. Brown, R. A.
Toth, H. M. Pickett, R. L. Poynter, J-M. Flaud, C. Camy-Peyret, A. Barbe, N. Husson, C. P. Rinsland, and M. A. H.Smith, "The HITRAN database: 1986 edition," Appl. Opt. 26,4058-4097 (1987).
15. D. E. Jennings, "Absolute line strengths in 4 2CH 4 : adual-beam diode laser spectrometer with sweep integration,"Appl. Opt. 19, 2695-2700 (1980).
16. J. R. Podolske, Atmospheric Chemistry and Dynamics Branch,Ames Research Center, National Aeronautics and Space Admin-istration, Moffett Field, Calif. 94035 (personal communica-tion).
17. A. K. Hui, B. H. Armstrong, and A. A. Wray, "Rapid computa-tion of the Voigt and complex error functions," J. Quant.Spectrosc. Radiat. Transfer 19, 509-516 (1977).
18. A. L. Schawlow and C. H. Townes, "Infrared and opticalmasers," Phys. Rev. 112, 1940-1949 (1958).
19. M. Lax, "Classical noise. V. Noise in self-sustained oscillators,"Phys. Rev. 160, 290-307 (1967).
20. R. D. Hempstead and M. Lax, "Classical noise. VI. Noise inself-sustained oscillators near threshold," Phys. Rev. 161,350-366 (1967).
21. J. J. Hillman, D. E. Jennings, andJ. L. Faris, "Diode laser-CO 2
laser heterodyne spectrometer: measurement of 2sQ (1, 1) in2v, - v2 of NH 3 ," Appl. Opt. 18, 1808-1811 (1979).
22. M. W. Flemming and A. Mooradian, "Spectral characteristicsof external-cavity controlled semiconductor lasers," IEEE J.Quantum Electron. QE-17, 44-59 (1981).
23. D. Welford and A. Mooradian, "Output power and tempera-ture dependence of the linewidth of single-frequency CW(GaAI)As diode lasers," Appl. Phys. Lett. 40, 865-867 (1982).
24. Y. Kotaki and H. Ishikawa, "Spectral characteristics of athree-section wavelength-tunable DBR laser," IEEE J. Quan-tum Electron. 25, 1340-1345 (1989).
25. A. Hemmerich, D. H. McIntyre, D. Schopp, Jr., D. Meschede,and T. W. Hansch, "Optically stabilized narrow linewidthsemiconductor laser for high resolution spectroscopy," Opt.Commun. 75, 118-122 (1990).
26. C. H. Henry "Theory of the linewidth of semiconductorlasers," IEEE J. Quantum Electron. QE-18, 259-264 (1982).
27. C. H. Henry "Theory of the phase noise and power spectrum ofa single mode injection laser," IEEE J. Quantum Electron.QE-19, 1391-1397 (1983).
28. C. Freed, J. W. Bielinski, and W. Lo, "Fundamental linewidthin solitary, ultra-narrow output PbS, -Se,, diode lasers," Appl.Phys. Lett. 43, 629-631 (1983).
29. G. Bjork and 0. Nilsson, "A tool to calculate the linewidth ofcomplicated semiconductor lasers," IEEE J. Quantum Elec-tron. QE-23, 1303-1313 (1987).
30. J. Arnaud "Contribution of shot noise to laser diode linewidth,"Opt. Commun. 68, 423-426 (1988).
31. S. S. Penner, Quantitative Molecular Spectroscopy and GasEmissivities (Addison-Wesley, Reading, Mass. 1959).
32. D. J. DesMarais, Planetary Biology Branch, Ames ResearchCenter, National Aeronautics and Space Administration, Mof-fett Field, Calif. 94035 (personal communication).


![SpectraSensors Proprietary Information [ 1 ] Water Vapor Sensing System (WVSS-II) Bryce Ford Nov 9, 2011 Tunable Diode Laser Technology supporting AMDAR.](https://static.documents.pub/doc/80x56/551ab6f2550346b2288b4da6/spectrasensors-proprietary-information-1-water-vapor-sensing-system-wvss-ii-bryce-ford-nov-9-2011-tunable-diode-laser-technology-supporting-amdar.jpg)


![Chapter 1: Diode circuits vt 15ec32].pdfChapter 1: Diode circuits ... • Diode testing • Zener diode • Diode data sheets and specifications ... Fig – b Vi characteristics of a diode](https://static.documents.pub/doc/80x56/5aedefea7f8b9a9031905d54/chapter-1-diode-circuits-vt-15ec32pdfchapter-1-diode-circuits-diode.jpg)


