53
STADLER FINANCIAL REPORT 2018

STADLER FINANCIAL REPORT 2018

Stadler – Financial Report 2018
1
Financial Management Report
Business development – order backlog 4
Staff (total full-time equivalents) 4
Research and Development 4
Special events 4
Risk analysis 4
Situation and outlook 4
Consolidated financial statements
Consolidated income statement 5
Consolidated balance sheet 6
Consolidated cash flow statement 7
Consolidated statement of changes in equity 8
Notes to the consolidated financial statements
Information on the report and general information 9
1 Operating performance
1.1 Segment reporting 11
1.2 Work in progress 13
1.3 Compensation claims from work in progress 14
1.4 Personnel expenses 15
1.5 Earnings per share 16
2 Operating assets and liabilities
2.1 Trade receivables and payables 17
2.2 Inventories 17
2.3 Property, plant and equipment 18
2.4 Financial assets 21
2.5 Intangible assets 22
2.6 Provisions and contingent liabilities 24
2.7 Other operating assets and liabilities 26
3 Financing and risk management
3.1 Financial liabilities 27
3.2 Guarantees and pledged assets 27
3.3 Share capital and reserves 28
3.4 Derivative financial instruments 29
4 Group structure
4.1 Changes in the scope of consolidation 31
4.2 Scope of consolidation and consolidation principles 33
4.3 Investments in associated companies and joint ventures 35
4.4 List of investments 36
4.5 Related parties and companies 37
4.6 Goodwill 37
5 Other information
5.1 Financial result 38
5.2 Other operating income / expenses 38

Stadler – Financial Report 2018
2
5.3 Income taxes 39
5.4 Employee benefits 40
5.5 Events after the reporting date 41
5.6 Approval of the consolidated financial statements 41
Report of the Statutory Auditor
Report of the Statutory Auditor 42

Stadler – Financial Report 2018
3
Financial statements of Stadler Rail AG
Income statement 44
Balance sheet 45
Notes to the financial statements 46
Appropriation of profit proposed to the Annual General Meeting 50
Report of the Statutory Auditor 51

Stadler – Financial Report 2018
4
Financial Management Report
Business development – order backlog
In the financial year 2018 Stadler recorded an order intake of CHF 4.4 billion and had an order backlog of more than CHF 13.2 billion at the end of the year. At CHF 2 billion, the Group’s annual revenue was lower than in the previous year (CHF 2.4 billion). This figure is in contrast to the increase in the level of employment due to the high order backlog. In 2018, a consider-able number of hours were already spent on orders that will not be invoiced until 2019. This is due to Stadler’s very conserva-tive revenue recognition policy. As a rule, revenue from orders is not recognized until the individual units have been accepted by the customer.
Operating profit (EBIT) amounted to CHF 151 million, corresponding to a margin of 7.5% (previous year: 7.9%). The costs of bank guarantees are no longer reported as project management costs, but instead as financing costs. This effect amounts to approx. 0.5%. EBIT was negatively impacted by higher sales expenses due to the high order intake and higher depreciation following investments in property, plant and equipment and software for the next growth phase in the coming years.
Group liquidity remains high. Net current assets remain structurally negative, but are higher than in the previous year. It is in the nature of our business that there may be temporary deferrals in advance payments for new orders received.
Staff (total full-time equivalents)
The Stadler Group had 8,874 employees at the end of the year (annual average). The previous year’s figure was 7,748. The year-on-year increase (+14.5%) is attributable to strong organic growth. The provision of services for deliveries in 2019 is in full progress.
Research and Development
Stadler strives to create sustainable added value for its customers with its innovative solutions and products. To this end, Stadler is investing considerable effort in the further development of existing solutions. Stadler’s goal is to understand the situation from the customer’s perspective in order to optimize the customer’s total costs. This also enables us to provide cus-tomers with further innovations. The majority of development costs are incurred on orders and are therefore not shown sepa-rately in the income statement.
Special events
No special events occurred in the year under review.
Risk analysis
Stadler carries out a formal risk assessment each year. The most important business risks are assessed and classified ac-cording to damage potential and probability of occurrence. In the year under review, the following risks were assessed in par-ticular: currency risks, investment risks, IT failures and dependence on the global economic situation.
Situation and outlook
The situation in the rail industry remains dynamic and the markets are still competitive. Further consolidation is to be ex-pected among providers. Price pressure must be countered with innovative and competitive solutions. Stadler is well equipped to meet these challenges.
The very high order backlog will lead to a strong increase in revenue in the coming years. Assuming that the economic envi-ronment remains stable, we anticipate a stable EBIT margin for the coming year with the prospect of further improvement in the years to come.
Production capacities must be expanded. For this reason, investment activity in the coming year will again remain above the long-term average. The number of employees will increase steadily. The service business will continue to grow at an above-average rate. Automation will become increasingly important for Stadler.

Stadler – Financial Report 2018 – Consolidated Financial Statements
5
Consolidated Income Statement
in thousands of CHF Note 2018 2017
restated
Net revenue 1.1 2’000’806 100.0% 2’428’038 100.0%
Material and external services (1’105’444) (1’441’512) Material overheads (68’885) (77’452) Warranty costs 2.6 (29’585) (45’260) Production costs (386’334) (436’200) Engineering costs (101’800) (100’724) Project management costs (18’032) (16’561)
Cost of goods sold and services provided (1’710’080) -85.5% (2’117’709) -87.2%
Gross margin 290’726 14.5% 310’329 12.8%
Development costs (6’138) (6’682) Marketing & Sales costs (56’196) (48’439) Administration costs (79’528) (70’773) Other operating income 5.2 9’509 12’655 Other operating expenses 5.2 (7’430) (6’239)
Operating result (EBIT) 150’943 7.5% 190’851 7.9%
Financial result 5.1 (21’351) 10’867 Share of results from associates 4.3 2’325 708
Profit before taxes 131’917 6.6% 202’426 8.3%
Income taxes 5.3 (12’724) (30’526)
Profit for the year 119’193 6.0% 171’900 7.1%
- thereof attributable to shareholders of Stadler Rail AG 117’779 171’457
- thereof attributable to non-controlling interests (minority
shareholders)
1’414 443
Basic and diluted earnings per share (in CHF)
(after consideration of share split)
1.5 1.18 1.74

Stadler – Financial Report 2018 – Consolidated Financial Statements
6
Consolidated Balance Sheet
in thousands of CHF Note 31.12.2018 31.12.2017
restated
Assets
Cash and cash equivalents 694’638 1’058’023 Trade receivables 2.1 251’580 264’379 Other current receivables 2.7 80’852 72’209 Compensation claims from work in progress 1.3 279’933 42’604 Inventories 2.2 260’587 180’813 Work in progress 1.2 592’629 398’645 Accrued income and deferred expenses 4’750 7’248
Total current assets 2’164’969 75.1% 2’023’921 76.0%
Property, plant and equipment 2.3 545’776 432’287 Financial assets 2.4 125’397 160’922 Investments in associates and joint ventures 4.3 12’027 10’059 Intangible assets 2.5 36’458 35’886
Total non-current assets 719’658 24.9% 639’154 24.0%
Total assets 2’884’627 100.0% 2’663’075 100.0%
Liabilities & equity
Current financial liabilities 3.1 81’094 17’015 Trade payables 2.1 173’779 91’696 Liabilities from work in progress 1.2 1’349’872 1’275’048 Other current liabilities 2.7 73’592 109’620 Current provisions 2.6 98’310 110’900 Deferred income and accrued expenses 2.7 97’521 88’297
Total current liabilities 1’874’168 65.0% 1’692’576 63.6%
Non-current financial liabilities 3.1 81’626 81’358 Other non-current liabilities 2.7 28’501 28’417 Non-current provisions 2.6 96’829 95’285
Total non-current liabilities 206’956 7.2% 205’060 7.7%
Total liabilities 2’081’124 72.1% 1’897’636 71.3%
Share capital 3.3 20’000 20’000 Capital reserves 16’376 17’650 Treasury shares 3.3 (2’187) (4’091) Retained earnings 646’320 552’988 Profit for the year 117’779 171’457
Stadler Rail AG shareholders’ equity 798’288 27.7% 758’004 28.5%
Non-controlling interests (minority interests) 5’215 7’435
Total equity 803’503 27.9% 765’439 28.7%
Total liabilities & equity 2’884’627 100.0% 2’663’075 100.0%

Stadler – Financial Report 2018 – Consolidated Financial Statements
7
Consolidated Cash Flow Statement
Accounting principles
Cash and cash equivalents include cash on hand, postal and bank deposits as well as sight deposits and deposits with a residual term of 90 days or less. These are valued at nominal values.
in thousands of CHF Note 2018 2017
restated
Cash flow from operating activities
Profit for the year 119’193 171’900 Depreciation and amortization 57’481 54’547 Non-recurring impairment (1’155) - Share of results from associates 4.3 (2’325) (708) Reversal of non-cash items 9’630 (21’032) Addition / (Reduction) other non-current liabilities 2.7 1’182 4’920 Addition / (Reduction) non-current provisions 2.6 3’583 6’653 Reduction / (Addition) employer contribution reserve 2.4 4’145 (30’000)
Change in net current assets
– Reduction / (Addition) trade receivables 2.1 7’492 (36’457) – Reduction / (Addition) other current receivables 2.7 (13’354) (6’129) – Reduction / (Addition) compensation claims from work in progress 1.3 (237’329) 113’514 – Reduction / (Addition) inventories 2.2 (87’133) (21’501) – Reduction / (Addition) work in progress 1.2 (190’694) 11’270 – Reduction / (Addition) accrued income and deferred expenses 1’507 (2’150) – Addition / (Reduction) trade payables 2.1 85’016 (55’550) – Addition / (Reduction) liabilities from work in progress 1.2 82’270 183’540 – Addition / (Reduction) other current liabilities 2.7 (33’155) 49’492 – Addition / (Reduction) current provisions 2.6 (11’022) 23’462 – Addition / (Reduction) deferred income and accrued expenses 2.7 11’389 6’025
Net cash flow from operating activities (193’279) 451’796
Cash flow from investing activities
Investments in property, plant and equipment 2.3 (174’406) (64’972) Proceeds from sales of property, plant and equipment 2.3 4’290 2’328 Investments in financial assets 2.4 (21’419) (45’946) Proceeds from sales of financial assets 2.4 62’720 14’611 Acquisition of subsidiaries, net of cash acquired 4.1 (7’269) 458 Proceeds from sales of subsidiaries, net of cash received 4.1 (23) 7’414 Investments in associates and joint ventures 4.3 - (18’144) Purchase of minority interests 4.1 (1’153) - Investments in intangible assets 2.5 (13’749) (10’925) Proceeds from sales of intangible assets 2.5 60 2
Net cash flow from investing activities (150’949) (115’174)
Cash flow from financing activities
Proceeds from / (repayment of) current financial liabilities 3.1 48’677 (74’467) Proceeds from / (repayment of) non-current financial liabilities 3.1 19’193 634 (Purchase) / Sale of treasury shares 3.3 (1’941) 45’443 Dividends paid to shareholders 3.3 (69’708) (58’320)
Net cash flow from financing activities (3’779) (86’710)
Total net cash flow (348’007) 249’912
Cash and cash equivalents at 1 January 1’058’023 801’012 Currency translation differences on cash and cash equivalents (15’378) 7’099
- - Cash and cash equivalents at 31 December 694’638 1’058’023

Stadler – Financial Report 2018 – Consolidated Financial Statements
8
Consolidated Statement of Changes in Equity
in thousands of CHF Note
Share
capital
Capital
reserves
Treasury
shares
Goodwill
offset
Other
retained
earnings
Total
retained
earnings
Stadler Rail
AG share-
holders’ equity
Non-
controlling
interest
Total
equity
Balance at 1 January 2017 20’000 (10’206) (24’023) (148’617) 752’056 603’439 589’211 2’600 591’811
Profit for the year - - - - 171’457 171’457 171’457 443 171’900 Dividends paid - - - - -58’320 -58’320 -58’320 - -58’320 Offsetting goodwill - - - -7’763 - -7’763 -7’763 - -7’763 Transactions with non-controlling interests - - - - - - - 4’142 4’142 Purchase of treasury shares - - -143 - - -143 - -143 Sale of treasury shares - 28’929 16’657 - - - 45’586 - 45’586 Allocation of treasury shares to employees -1’073 3’418 - - - 2’345 - 2’345 Currency translation differences - - - - 15’631 15’631 15’631 250 15’881
Balance at 31 December 2017 20’000 17’650 (4’091) (156’380) 880’824 724’444 758’004 7’435 765’439
Profit for the year - - - - 117’779 117’779 117’779 1’414 119’193 Dividends paid - - - - -69’708 -69’708 -69’708 - -69’708 Offsetting goodwill - - - -1’800 - -1’800 -1’800 - -1’800 Transactions with non-controlling interests - - - - - - - -3’228 -3’228 Purchase of treasury shares - - -2’006 - - - -2’006 - -2’006 Sale of treasury shares - -31 96 - - - 65 - 65 Allocation of treasury shares to employees -1’243 3’814 - - - 2’571 - 2’571 Currency translation differences - - - - -6’617 -6’617 -6’617 -406 -7’023
Balance at 31 December 2018 20’000 16’376 (2’187) (158’180) 922’278 764’098 798’288 5’215 803’503

Stadler – Financial Report 2018 – Consolidated Financial Statements
9
Notes to the Consolidated Financial Statements
Information on the report
This section describes the basis for preparing the financial statements and gives an overview of the key assumptions and estimates made by Management. It also provides an insight into the main events in the financial year that affected the financial report.
The Stadler Rail Group
Stadler Rail AG (“Holding” or “Company”), headquartered in 9565 Bussnang, Ernst-Stadler-Strasse 1, is a company incorpo-rated under Swiss law. The Stadler Rail Group (hereinafter Stadler) is an international, independent rail vehicle manufacturer with the focus on Europe and the development of further regions, which pursues a targeted segment and market strategy with high-quality and customer-specific products.
The consolidated financial statements as at 31 December 2018 present the net assets, financial position and results of opera-tions of Stadler Rail AG and its subsidiaries disclosed in Note 4.4 “List of investments” (collectively referred to as Stadler).
Basis for the preparation of the financial statements
The consolidated financial statements have been prepared in accordance with the Accounting and Reporting Recommenda-tions of Swiss GAAP FER (full standards). They provide a true and fair view of the net assets, financial position and results of operations and meet the requirements of Swiss law. FER 31, “Complementary recommendation for listed companies”, was also applied retroactively from 1 January 2017 for the first time. The effects of the initial application are explained in detail below.
The consolidated financial statements are presented in Swiss francs. Unless otherwise stated, all financial information in Swiss francs has been rounded to the nearest thousand. For this reason, rounding differences may occur.
The valuation basis used in these consolidated financial statements is based on historical acquisition or production costs, unless a standard requires a different valuation basis for an item or a different valuation basis has been used to exercise an option. In this case, it is explicitly mentioned in the accounting principles. Accounting principles that are relevant to the under-standing of the consolidated financial statements are set out in the specific notes. The income statement is presented according to the cost of sales method.
Reporting format, changes to accounting principles and presentation
The content and structure of the consolidated financial statements have been fundamentally revised compared with the previ-ous year in order to make the information on the net assets, financial position and results of operations more transparent and relevant to decision-making for readers of the financial report. These adjustments include, in particular, a modification to the structure of the notes, supplementary notes to existing accounting principles and adjustments to the presentation. In order to improve the presentation of the consolidated financial statements, the classification and disclosure of certain balance sheet and income statement items have been modified, as explained below in “Effects of other changes in accounting principles”.
Effects of the initial application of Swiss GAAP FER 31
Stadler applies Swiss GAAP FER 31, “Complementary recommendation for listed companies” as at 31 December 2018.
The date of initial application is 1 January 2017. Stadler fully applies all the provisions in force from the first consolidated financial statements including Swiss GAAP FER 31 in 2017. For reasons of comparability and consistency, both the current reporting year and the previous years have been adapted to the new provisions of Swiss GAAP FER 31.
In connection with the application of Swiss GAAP FER 31, these consolidated financial statements present for the first time the required disclosures on “Segment reporting” (Note 1.1), “Share-based payments” (Note 1.4), “Earnings per ownership right” (Note 1.5), “Financial liabilities” (Note 3.1) and “Income taxes” (Note 5.3). The initial application of FER 31/3, “Share-based payments”, did not result in any changes with regard to the recognition and measurement of the existing employee share plan (see Note 1.4).
Stadler – Financial Report 2018 – Consolidated Financial Statements
10
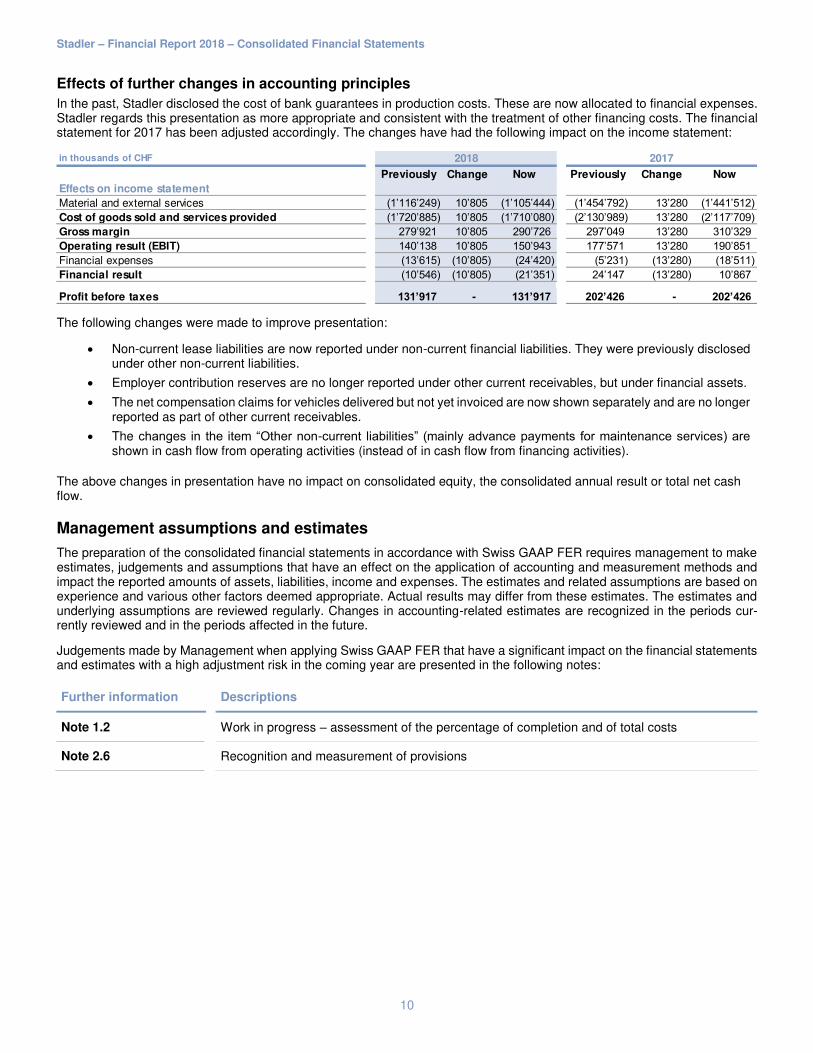
Effects of further changes in accounting principles
In the past, Stadler disclosed the cost of bank guarantees in production costs. These are now allocated to financial expenses. Stadler regards this presentation as more appropriate and consistent with the treatment of other financing costs. The financial statement for 2017 has been adjusted accordingly. The changes have had the following impact on the income statement:
The following changes were made to improve presentation:
Non-current lease liabilities are now reported under non-current financial liabilities. They were previously disclosed under other non-current liabilities.
Employer contribution reserves are no longer reported under other current receivables, but under financial assets.
The net compensation claims for vehicles delivered but not yet invoiced are now shown separately and are no longer reported as part of other current receivables.
The changes in the item “Other non-current liabilities” (mainly advance payments for maintenance services) are shown in cash flow from operating activities (instead of in cash flow from financing activities).
The above changes in presentation have no impact on consolidated equity, the consolidated annual result or total net cash flow.
Management assumptions and estimates
The preparation of the consolidated financial statements in accordance with Swiss GAAP FER requires management to make estimates, judgements and assumptions that have an effect on the application of accounting and measurement methods and impact the reported amounts of assets, liabilities, income and expenses. The estimates and related assumptions are based on experience and various other factors deemed appropriate. Actual results may differ from these estimates. The estimates and underlying assumptions are reviewed regularly. Changes in accounting-related estimates are recognized in the periods cur-rently reviewed and in the periods affected in the future.
Judgements made by Management when applying Swiss GAAP FER that have a significant impact on the financial statements and estimates with a high adjustment risk in the coming year are presented in the following notes:
Further information Descriptions
Note 1.2 Work in progress – assessment of the percentage of completion and of total costs
Note 2.6 Recognition and measurement of provisions
in thousands of CHF
Previously Change Now Previously Change Now
Effects on income statement
Material and external services (1’116’249) 10’805 (1’105’444) (1’454’792) 13’280 (1’441’512) Cost of goods sold and services provided (1’720’885) 10’805 (1’710’080) (2’130’989) 13’280 (2’117’709) Gross margin 279’921 10’805 290’726 297’049 13’280 310’329 Operating result (EBIT) 140’138 10’805 150’943 177’571 13’280 190’851 Financial expenses (13’615) (10’805) (24’420) (5’231) (13’280) (18’511) Financial result (10’546) (10’805) (21’351) 24’147 (13’280) 10’867
- Profit before taxes 131’917 - 131’917 202’426 - 202’426
2018 2017

Stadler – Financial Report 2018 – Consolidated Financial Statements
11
1 Operating performance
This section presents Stadler’s operating performance. Segment reporting reflects the segment revenue taken into consideration at top management level for corporate management purposes. Details of work in progress, personnel expenses and earnings per share are also shown.
1.1 Segment reporting
External segment reporting is based on internal reporting, which is used by Group Management for corporate management purposes. Group Management consists of the Group Executive Board and the Board of Directors.
The following two segments exist:
Segment Activity
Rolling Stock The “Rolling Stock” business segment manufactures various types of rail vehicles. This segment in-cludes the various product types in the following sectors: high-speed, intercity, regional trains, city transport, locomotives and tailor made.
Service & Components
The “Service & Components” business segment offers full service, modernization and revision, spare parts service and vehicle repairs, including the maintenance and assessment of defects. This business segment also includes the supply of vehicle components such as car bodies or bogies.
With reference to the complementary recommendation for listed companies (FER 31/8) on segment reporting, Stadler does not report segment results in the interests of shareholders for the following reasons:
1. Detrimental effect on the negotiating position:
The disclosure of segment results would allow conclusions to be drawn on pricing, which could significantly impair Stadler’s negotiating position.
2. Competitive disadvantage in relation to competitors:
Stadler’s competitors generally do not report segment information and detailed segment results. The disclosure of segment results would put Stadler at a competitive disadvantage towards its competitors, thus allowing conclusions to be drawn about the margin and cost situation for each segment.

Stadler – Financial Report 2018 – Consolidated Financial Statements
12
The Corporate Centre is not an operating segment, but is chiefly a service provider within Stadler. The net revenue is mainly attributable to services rendered to subsidiaries of the majority shareholder, provided at market conditions.
in thousands of CHF
2018 2017 2018 2017 2018 2017 2018 2017
Net revenue
Net revenue per segment 1’789’436 2’253’986 536’262 468’743 (324’892) (294’691) 2’000’806 2’428’038 Intersegment revenue (37’023) (38’644) (288’587) (256’233) 325’610 294’877 - -
Total net revenue (third parties) 1’752’413 2’215’342 247’675 212’510 718 186 2’000’806 2’428’038
Net revenue by geographical
market
Germany, Austria, Switzerland 1’244’269 954’590 57’182 111’155 777 176 1’302’228 1’065’921 Western Europe 237’019 919’742 153’032 90’441 - - 390’051 1’010’183 Eastern Europe 107’073 1’422 18’630 5’264 (59) 10 125’644 6’696 CIS 51’053 249’810 2’949 695 - - 54’002 250’505 America 112’153 89’778 3’535 1’418 - - 115’688 91’196 Rest of the world 846 - 12’347 3’537 - - 13’193 3’537
Total net revenue by market 1’752’413 2’215’342 247’675 212’510 718 186 2’000’806 2’428’038
Net revenue by product group
Trains 1’234’614 1’514’947 Locomotives 48’303 165’302 LRV 223’961 329’218 Metros 114’305 67’350 Tailor-made 131’230 138’525
Total net revenue by product 1’752’413 2’215’342
Order intake
Order intake 3’767’160 2’482’665 621’445 958’655 - 4’388’605 3’441’320
Total order intake 3’767’160 2’482’665 621’445 958’655 - - 4’388’605 3’441’320
Order intake by geographical
market
Germany, Austria, Switzerland 1’354’525 1’084’434 119’857 158’640 - 1’474’382 1’243’074 Western Europe 1’500’423 990’989 479’422 746’353 - 1’979’845 1’737’342 Eastern Europe 782’354 271’478 19’110 36’813 - 801’464 308’291 CIS 98’998 54’254 262 - - 99’260 54’254 America 30’860 40’910 1’035 200 - 31’895 41’110 Rest of the world - 40’600 1’759 16’649 - 1’759 57’249
Total order intake by market 3’767’160 2’482’665 621’445 958’655 - - 4’388’605 3’441’320
Order backlog
Order backlog 10’916’635 9’026’675 2’262’209 2’017’716 - 13’178’844 11’044’391
Total order backlog 10’916’635 9’026’675 2’262’209 2’017’716 - - 13’178’844 11’044’391
Order backlog by geographical
market
Germany, Austria, Switzerland 4’797’064 4’780’534 634’604 581’633 - 5’431’668 5’362’167 Western Europe 3’886’477 2’592’594 1’547’060 1’174’701 - 5’433’537 3’767’295 Eastern Europe 1’045’321 307’372 67’973 251’390 - 1’113’294 558’762 CIS 234’276 232’503 - - - 234’276 232’503 America 915’193 830’715 1’069 5’243 - 916’262 835’958 Rest of the world 38’304 282’957 11’503 4’749 - 49’807 287’706
Total order backlog by market 10’916’635 9’026’675 2’262’209 2’017’716 - - 13’178’844 11’044’391
Investments in PPE
Investments in PPE 143’794 35’284 27’139 25’515 3’473 4’173 174’406 64’972
Total investments in PPE 143’794 35’284 27’139 25’515 3’473 4’173 174’406 64’972
Staff as FTEs
Permanent employees 6’123 5’627 1’621 1’259 159 145 7’903 7’031 Temporary employees 637 475 185 104 2 2 824 581 Apprentices 124 119 23 17 - - 147 136
Total staff as FTEs 6’884 6’221 1’829 1’380 161 147 8’874 7’748
Rolling Stock Service & Components Corporate Centre & Eliminations Total

Stadler – Financial Report 2018 – Consolidated Financial Statements
13
Accounting principles
Recognition of revenue Rolling Stock
Income from the sale of rail vehicles is recognized according to the percentage of completion method (see Note 1.2), as this usually involves long-term contracts under which the vehicles are manufactured over a period of more than twelve months.
Recognition of revenue Service and Components
Revenue in the “Components” sub-segment is recognized upon delivery or transfer of the benefits and risks to the purchaser. Revenue from the “Service” sub-segment is recognized upon the provision of a service.
Income received for subsequent overhauls is recognized in “Non-current liabilities – maintenance”. If revenue for overhauls is part of km remuneration, the expected revenue is also booked to “Liabilities – Maintenance” to the extent of the forecast costs for the overhaul and an expected profit share. Classification is based on the estimated timing of the revision work and is recognized in revenue when the service is provided.
1.2 Work in progress
Accounting principles
Recognition and measurement of work in progress and revenue recognition
Revenue (net proceeds) from the sale of rail vehicles is recognized on the basis of the percentage of completion on the balance sheet date, provided the relevant conditions are met. The percentage of completion is determined individually for each order on the basis of the units of delivery method. Final acceptance by the customer marks the completion of a unit, whereby a unit usually corresponds to a car or vehicle, and the percentage of completion is calculated according to the ratio of delivered units to the total contractually agreed-upon delivery quantity. In individual cases, if final acceptance by the
in thousands of CHF 31.12.2018 31.12.2017
Work in progress
Costs accumulated on orders 3’381’727 3’671’714 Production costs of vehicles delivered and invoiced (2’124’438) (2’637’486) Work in progress, gross 1’257’289 1’034’228
Advance payments to suppliers 113’169 172’210 Advance payments from customers (777’829) (807’793)
Total work in progress 592’629 398’645
Liabilities from work in progress
Costs accumulated on orders 3’788’879 3’037’920 Production costs of vehicles delivered and invoiced (2’914’733) (2’685’297) Work in progress, gross 874’146 352’623
Advance payments to suppliers 104’534 - Advance payments from customers (2’328’552) (1’627’671)
Total liabilities from work in progress (1’349’872) (1’275’048)
Net work in progress/liabilities from work in progress (757’243) (876’403)

Stadler – Financial Report 2018 – Consolidated Financial Statements
14
customer is significantly delayed by administrative circumstances only (e.g. approval procedures), the company manage-ment assesses the economic situation and may decide to recognize revenue prior to final acceptance. As a rule, a unit is fully invoiced upon its acceptance (and netted with the advance payments received or recognized as a trade receivable for the amount exceeding the advance payments).
Order costs consist of material and external service costs (incl. bank guarantee costs), material overheads (procurement and logistics) as well as production, engineering and project management costs. The cost rates for measuring productive hours are based on a period of several years at normal employment levels. Costs in connection with development work are allocated to orders to the extent that they are required for customer-specific production.
Costs incurred for bank guarantees in connection with customer-specific projects are reported under financial expenses on the date of revenue recognition for the corresponding order.
For loss-free valuations, work in progress is assessed individually. As soon as a loss becomes apparent, a value adjustment is recognized to the full extent of the expected loss. If the value adjustment exceeds the value of the asset for the order, a provision is recognized for the excess amount.
The costs of interest-bearing liabilities are recognized directly in the income statement under financial expenses and are not part of order-related expenses. Work in progress comprises projects for which the cumulative services exceed the payments already made. If the advance payments received are higher than the cumulative services provided, they are reported under liabilities from work in progress.
Advance payments received are recognized in the balance sheet and not through the income statement. They are offset against the corresponding orders or compensation claims for which the advance payments were made.
1.3 Compensation claims from work in progress
Accounting principles
Recognition and measurement of compensation claims from work in progress
If individual cases listed in the accounting principles set out in Note 1.2 “Recognition and measurement of work in progress” result in the recognition of revenue prior to an invoicing entitlement, a compensation claim is recognized in the amount of this revenue. Otherwise, the accounting principles described in “Recognition and measurement of work in progress” accord-ing to Note 1.2 apply.
in thousands of CHF 31.12.2018 31.12.2017
Compensation claims from work in progress
Compensation claims for vehicles delivered but not yet invoiced 533’614 42’604 Advance payments from customers for vehicles delivered but not yet invoiced (253’681) -
Total compensation claims from work in progress 279’933 42’604

Stadler – Financial Report 2018 – Consolidated Financial Statements
15
1.4 Personnel expenses
In the 2018 financial year, 7,916 shares (without consideration of the share split) were allocated as bonus payments within the framework of share-based payments (previous year: 8,031). Personnel expenses were charged accordingly with CHF 2.6 million in 2018 (previous year: CHF 2.3 million).
The defined value of the shares allocated is calculated on the basis of consolidated equity, plus goodwill offset against equity, less the proposed dividend payments.
Please refer to Note 5.4 for information on expenses for employee benefits.
Accounting principles
Share-based payment
An employee share plan allows selected members of Management and the Board of Directors to acquire shares in Stadler Rail AG at a defined value fixed annually on a specific date each year. The shares are allocated to selected employees, for example as part of a bonus payment, provided that the employees in question meet individually defined basic requirements and a corresponding decision has been made by the relevant body (plan committee). There is no automatic entitlement to allocation. The shares are subject to a lock-up period of 6 years. Stadler Rail AG also has a call option to repurchase the shares issued, which can be exercised at any time, at the defined value on the date of repurchase. Employees have full shareholder rights from the date of allocation onwards, with the exception of the right to sell the shares during the lock-up period.
Shares allocated to employees as a bonus are charged to personnel expenses at the defined value on the date of alloca-tion. The “treasury shares” item in equity represents the corresponding offsetting item, whereby the difference between the defined value and the average acquisition cost of the shares is recorded in the capital reserves. There is no subsequent valuation following the allocation of shares. Due to Stadler’s call option, which can be exercised at any time, the defined value corresponds to the current value as de-fined in FER 31/3.
in thousands of CHF 2018 2017
Personnel expenses
Wages and salaries (529’933) (447’681) Social security costs (66’914) (56’607) Pension costs (24’403) (21’958) Other personnel expenses (29’423) (25’307)
Total personnel expenses (650’673) (551’553)
Value in CHF
after AGM before AGM after AGM before AGM
Defined value 15.06.2018 15.06.2018 15.06.2017 15.06.2017
Defined value applied in the period after share split 7.92 - - - Defined value applied in the period before share split - 325.00 325.00 292.00
2018 2017

Stadler – Financial Report 2018 – Consolidated Financial Statements
16
1.5 Earnings per share
Treasury shares held by the company are not taken into account when calculating profit for the year (earnings) per share. There are no circumstances leading to a dilution of earnings per share. Shares allocated to employees under the employee share plan (see Note 3.3) are entitled to dividends.
in thousands of CHF or as noted 2018 2017
Earnings per share (after consideration of share split)
Profit for the year attributable to shareholders 117’779 171’457 Weighted average number of shares outstanding 99’727’852 98’333’400
Basic and diluted earnings per share (in CHF) 1.18 1.74
in thousands of CHF or as noted 2018 2017
Earnings per share (without consideration of share split)
Profit for the year attributable to shareholders 117’779 171’457 Weighted average number of shares outstanding 1’994’557 1’966’668
Basic and diluted earnings per share (in CHF) 59.05 87.18
Stadler – Financial Report 2018 – Consolidated Financial Statements
17
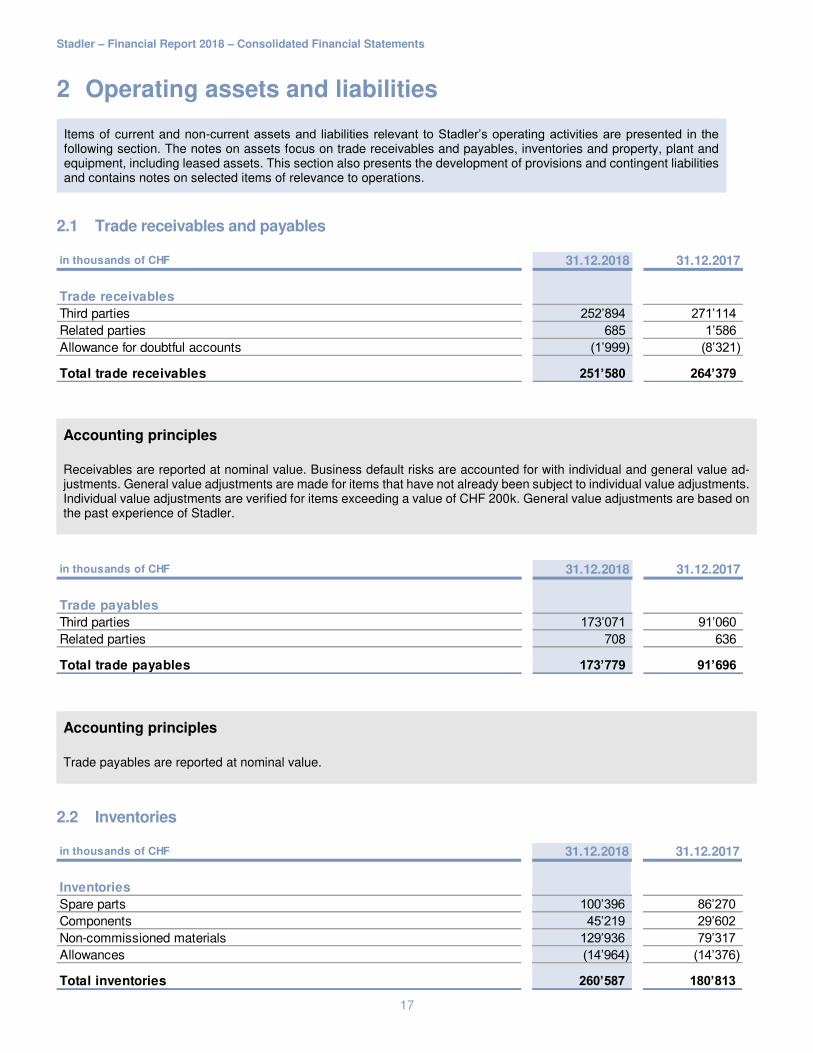
2 Operating assets and liabilities
Items of current and non-current assets and liabilities relevant to Stadler’s operating activities are presented in the following section. The notes on assets focus on trade receivables and payables, inventories and property, plant and equipment, including leased assets. This section also presents the development of provisions and contingent liabilities and contains notes on selected items of relevance to operations.
2.1 Trade receivables and payables
Accounting principles
Receivables are reported at nominal value. Business default risks are accounted for with individual and general value ad-justments. General value adjustments are made for items that have not already been subject to individual value adjustments. Individual value adjustments are verified for items exceeding a value of CHF 200k. General value adjustments are based on the past experience of Stadler.
Accounting principles
Trade payables are reported at nominal value.
2.2 Inventories
in thousands of CHF 31.12.2018 31.12.2017
Trade receivables
Third parties 252’894 271’114 Related parties 685 1’586 Allowance for doubtful accounts (1’999) (8’321)
Total trade receivables 251’580 264’379
in thousands of CHF 31.12.2018 31.12.2017
Trade payables
Third parties 173’071 91’060 Related parties 708 636
Total trade payables 173’779 91’696
in thousands of CHF 31.12.2018 31.12.2017
Inventories
Spare parts 100’396 86’270 Components 45’219 29’602 Non-commissioned materials 129’936 79’317 Allowances (14’964) (14’376)
Total inventories 260’587 180’813
Stadler – Financial Report 2018 – Consolidated Financial Statements
18
Accounting principles
Inventories are composed of spare parts, components and non-commissioned materials. Acquisition or production costs include all direct and indirect expenses related to bringing the inventories to their present location or to their present state (full costs). In principle, the actual costs incurred are decisive for the determination of the acquisition and production costs. They are calculated according to the average cost method. Cash discounts (i.e. discounts for early payment) are booked as acquisition price reductions. The difference between the acquisition or production costs and any lower net market value is recorded as a value adjustment (lower of cost or market value principle).
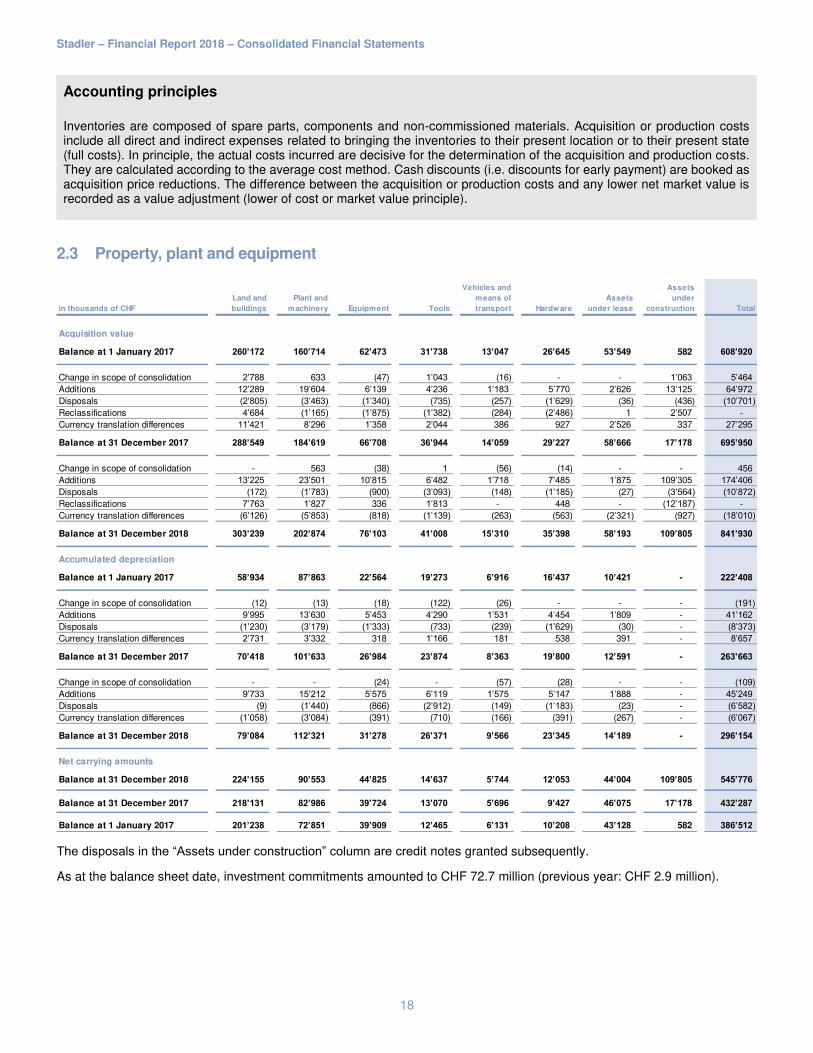
2.3 Property, plant and equipment
The disposals in the “Assets under construction” column are credit notes granted subsequently.
As at the balance sheet date, investment commitments amounted to CHF 72.7 million (previous year: CHF 2.9 million).
in thousands of CHF
Land and
buildings
Plant and
machinery Equipment Tools
Vehicles and
means of
transport Hardware
Assets
under lease
Assets
under
construction Total
Acquisition value
Balance at 1 January 2017 260’172 160’714 62’473 31’738 13’047 26’645 53’549 582 608’920
Change in scope of consolidation 2’788 633 (47) 1’043 (16) - - 1’063 5’464 Additions 12’289 19’604 6’139 4’236 1’183 5’770 2’626 13’125 64’972 Disposals (2’805) (3’463) (1’340) (735) (257) (1’629) (36) (436) (10’701) Reclassifications 4’684 (1’165) (1’875) (1’382) (284) (2’486) 1 2’507 - Currency translation differences 11’421 8’296 1’358 2’044 386 927 2’526 337 27’295
Balance at 31 December 2017 288’549 184’619 66’708 36’944 14’059 29’227 58’666 17’178 695’950
Change in scope of consolidation - 563 (38) 1 (56) (14) - - 456 Additions 13’225 23’501 10’815 6’482 1’718 7’485 1’875 109’305 174’406 Disposals (172) (1’783) (900) (3’093) (148) (1’185) (27) (3’564) (10’872) Reclassifications 7’763 1’827 336 1’813 - 448 - (12’187) - Currency translation differences (6’126) (5’853) (818) (1’139) (263) (563) (2’321) (927) (18’010)
Balance at 31 December 2018 303’239 202’874 76’103 41’008 15’310 35’398 58’193 109’805 841’930
Accumulated depreciation
Balance at 1 January 2017 58’934 87’863 22’564 19’273 6’916 16’437 10’421 - 222’408
Change in scope of consolidation (12) (13) (18) (122) (26) - - - (191) Additions 9’995 13’630 5’453 4’290 1’531 4’454 1’809 - 41’162 Disposals (1’230) (3’179) (1’333) (733) (239) (1’629) (30) - (8’373) Currency translation differences 2’731 3’332 318 1’166 181 538 391 - 8’657
Balance at 31 December 2017 70’418 101’633 26’984 23’874 8’363 19’800 12’591 - 263’663
Change in scope of consolidation - - (24) - (57) (28) - - (109) Additions 9’733 15’212 5’575 6’119 1’575 5’147 1’888 - 45’249 Disposals (9) (1’440) (866) (2’912) (149) (1’183) (23) - (6’582) Currency translation differences (1’058) (3’084) (391) (710) (166) (391) (267) - (6’067)
- Balance at 31 December 2018 79’084 112’321 31’278 26’371 9’566 23’345 14’189 - 296’154
Net carrying amounts
Balance at 31 December 2018 224’155 90’553 44’825 14’637 5’744 12’053 44’004 109’805 545’776
Balance at 31 December 2017 218’131 82’986 39’724 13’070 5’696 9’427 46’075 17’178 432’287
Balance at 1 January 2017 201’238 72’851 39’909 12’465 6’131 10’208 43’128 582 386’512

Stadler – Financial Report 2018 – Consolidated Financial Statements
19
Accounting principles
Property, plant and equipment is valued at acquisition or production costs less depreciation and impairment necessary for business reasons. Own manufactured assets are only capitalized once they are clearly identifiable, the costs can be deter-mined reliably and they bring the company a measurable benefit over several years. Depreciation is charged on a straight-line basis over the economic useful life of the asset.
The depreciation periods are as follows:
Category Estimated useful life (years)
Land and buildings 33 max.
Plant and machinery 8 - 20
Equipment 10 - 15
Tools 2 - 3
Vehicles and means of transport 6 - 8
Hardware 3 - 6
Assets under lease the shorter of useful life or contract duration
Assets under construction no depreciation
Impairment
An assessment is made on each balance sheet date as to whether there are any indications that the carrying amount of an asset exceeds its recoverable amount (the higher of its fair value and value in use) (impairment). If there is an impairment, the carrying amount is reduced to the recoverable amount, with the impairment charged to profit or loss for the period. If there is a significant improvement in the indications, the recoverable amount is recalculated. If the net carrying amount of the asset is lower than the newly determined recoverable amount, the impairment recognized in prior periods is reversed through profit or loss. The new carrying amount resulting from the reversal is the lower of the recoverable amount and the carrying amount after normal depreciation that would have resulted if no impairment had been recorded.
Stadler – Financial Report 2018 – Consolidated Financial Statements
20
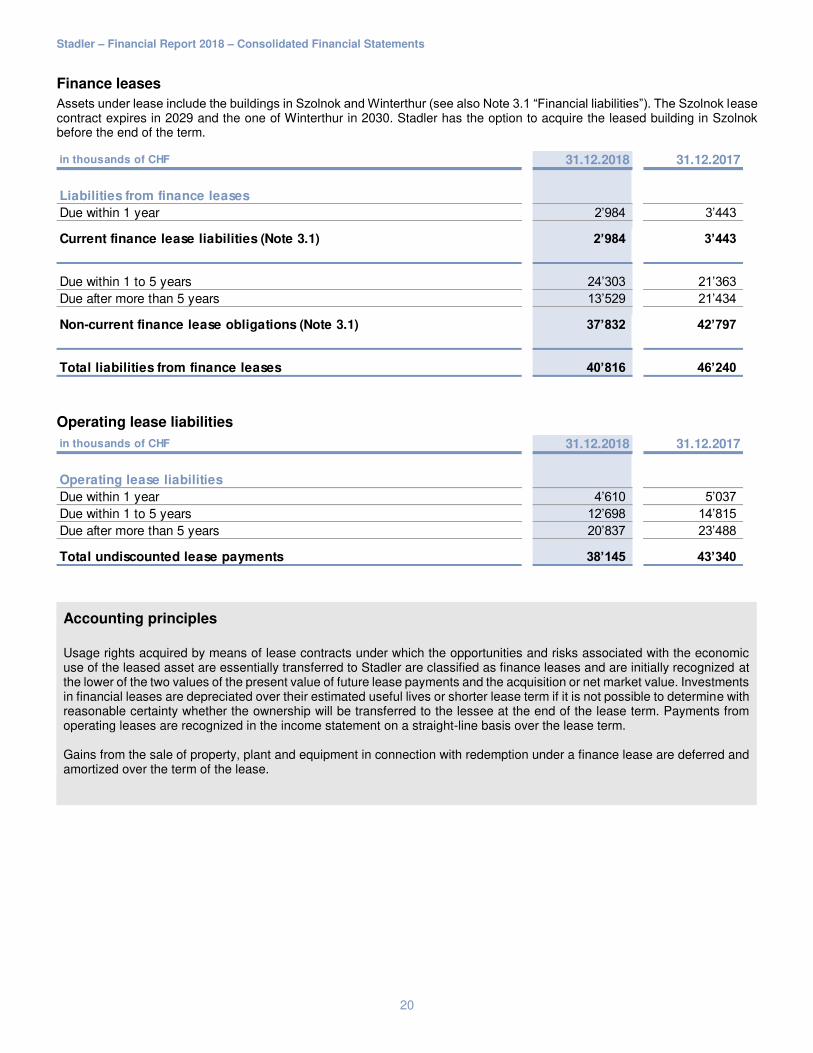
Finance leases
Assets under lease include the buildings in Szolnok and Winterthur (see also Note 3.1 “Financial liabilities”). The Szolnok lease contract expires in 2029 and the one of Winterthur in 2030. Stadler has the option to acquire the leased building in Szolnok before the end of the term.
Operating lease liabilities
Accounting principles
Usage rights acquired by means of lease contracts under which the opportunities and risks associated with the economic use of the leased asset are essentially transferred to Stadler are classified as finance leases and are initially recognized at the lower of the two values of the present value of future lease payments and the acquisition or net market value. Investments in financial leases are depreciated over their estimated useful lives or shorter lease term if it is not possible to determine with reasonable certainty whether the ownership will be transferred to the lessee at the end of the lease term. Payments from operating leases are recognized in the income statement on a straight-line basis over the lease term. Gains from the sale of property, plant and equipment in connection with redemption under a finance lease are deferred and amortized over the term of the lease.
in thousands of CHF 31.12.2018 31.12.2017
Liabilities from finance leases
Due within 1 year 2’984 3’443
Current finance lease liabilities (Note 3.1) 2’984 3’443
Due within 1 to 5 years 24’303 21’363 Due after more than 5 years 13’529 21’434
Non-current finance lease obligations (Note 3.1) 37’832 42’797
Total liabilities from finance leases 40’816 46’240
in thousands of CHF 31.12.2018 31.12.2017
Operating lease liabilities
Due within 1 year 4’610 5’037 Due within 1 to 5 years 12’698 14’815 Due after more than 5 years 20’837 23’488
Total undiscounted lease payments 38’145 43’340

Stadler – Financial Report 2018 – Consolidated Financial Statements
21
2.4 Financial assets
Financial assets, related parties are loans to another subsidiary of the majority shareholder. Interest is charged at market conditions.
Accounting principles
Securities Securities are securities such as share rights not recorded as investments, borrower’s notes, etc. They are recognized at acquisition cost less any impairment. Other financial assets Other financial assets, third parties and other financial assets, related parties include loans and receivables recognized at acquisition cost less any necessary impairment. Deferred income tax assets This item includes deferred tax assets from losses carried forward and from deductible temporary differences. Further details may be found in Note 5.3.
in thousands of CHF 31.12.2018 31.12.2017
Financial assets
Securities - 9’316 Other financial assets, third parties 25’114 46’577 Other financial assets, related parties 34’218 40’151 Deferred income tax assets 40’182 34’850 Employer contribution reserve 25’883 30’028
Total financial assets 125’397 160’922

Stadler – Financial Report 2018 – Consolidated Financial Statements
22
2.5 Intangible assets
Accounting principles
Intangible assets include software, licenses and patents purchased from third parties, as well as capitalized developments. These are valued at acquisition or production cost less necessary depreciation and impairment. Depreciation is carried out on a straight-line basis over a conservatively estimated useful life. Intangible assets generated internally are capitalized once the required recognition criteria are met (essentially the identifiability of the asset, the existence of a measurable future benefit, the availability of the necessary funds for completion and use, and the measurability of the expenses).
in thousands of CHF Software
Licenses,
patents
Development
costs
Assets in
development Total
Acquisition value
Balance at 1 January 2017 27’199 10’696 40’886 611 79’392
Change in scope of consolidation (29) - - - (29) Additions 5’381 1’137 4’407 - 10’925 Disposals (121) (10) - - (131) Reclassifications - - 448 (448) - Currency translation differences 745 (756) 3’529 (15) 3’503
Balance at 31 December 2017 33’175 11’067 49’270 148 93’660
Change in scope of consolidation 30 23 - - 53 Additions 6’561 3’922 3’266 - 13’749 Disposals (662) - - - (662) Reclassifications - - 148 (148) - Currency translation differences (834) 512 (2’115) - (2’437)
Balance at 31 December 2018 38’270 15’524 50’569 - 104’363
Accumulated depreciation
Balance at 1 January 2017 20’417 7’369 15’494 - 43’280
Change in scope of consolidation (29) - - - (29) Additions 3’029 1’019 9’337 - 13’385 Disposals (121) (8) - - (129) Currency translation differences 443 (558) 1’382 - 1’267
Balance at 31 December 2017 23’739 7’822 26’213 - 57’774
Additions 3’744 1’244 7’173 - 12’161 Disposals (602) - - - (602) Currency translation differences (677) 243 (994) - (1’428)
Balance at 31 December 2018 26’204 9’309 32’392 - 67’905
Net carrying amounts
Balance at 31 December 2018 12’066 6’215 18’177 - 36’458
Balance at 31 December 2017 9’436 3’245 23’057 148 35’886
Balance at 1 January 2017 6’782 3’327 25’392 611 36’112

Stadler – Financial Report 2018 – Consolidated Financial Statements
23
The depreciation periods are as follows:
Goodwill resulting from an acquisition is recorded in retained earnings on the date of acquisition. When shares of a group company are sold, the goodwill historically recorded in retained earnings is transferred to the income statement. The effects of a theoretical capitalization and amortization, including any impairment resulting from the assessment of recoverability, are explained in Note 4.6. For this shadow accounting, in principle the goodwill is depreciated on a straight-line basis over the economic useful life; normally five years. Impairment is treated in the same way as for property, plant and equipment (Note 2.3).
Category
Software 3 - 6Patents, licenses 5Development costs 5
Estimated useful life (years)
Stadler – Financial Report 2018 – Consolidated Financial Statements
24
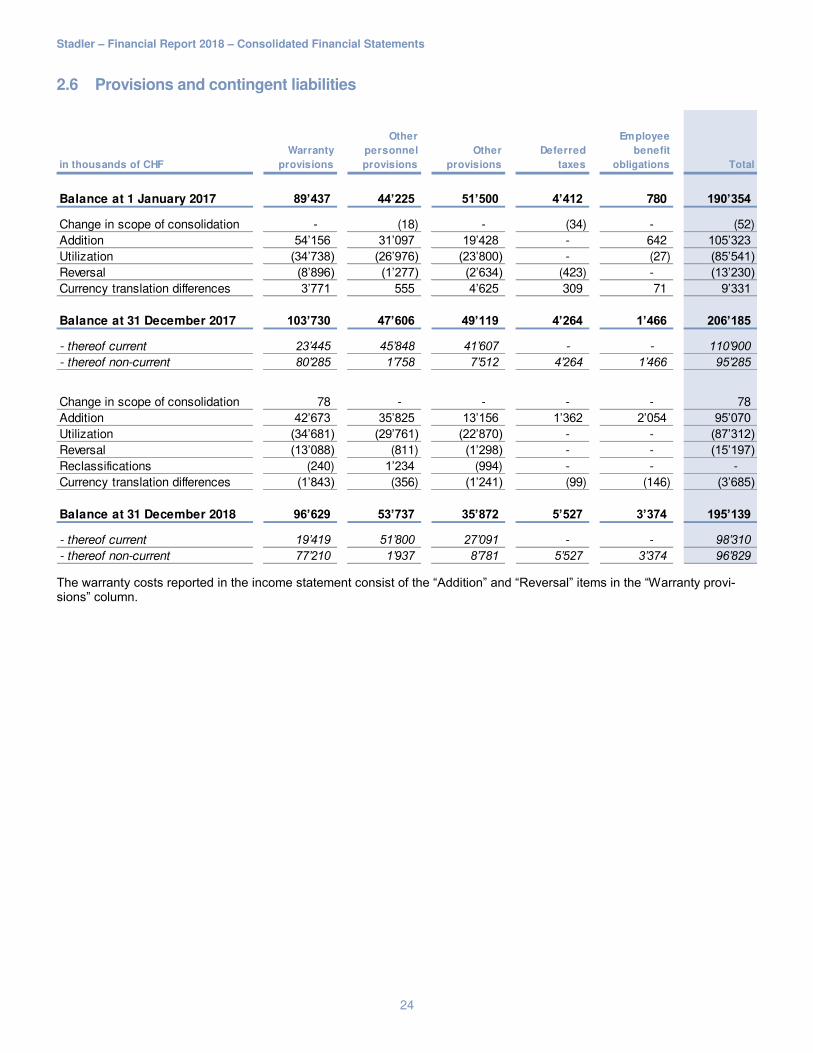
2.6 Provisions and contingent liabilities
The warranty costs reported in the income statement consist of the “Addition” and “Reversal” items in the “Warranty provi-sions” column.
in thousands of CHF
Warranty
provisions
Other
personnel
provisions
Other
provisions
Deferred
taxes
Employee
benefit
obligations Total
Balance at 1 January 2017 89’437 44’225 51’500 4’412 780 190’354
Change in scope of consolidation - (18) - (34) - (52) Addition 54’156 31’097 19’428 - 642 105’323 Utilization (34’738) (26’976) (23’800) - (27) (85’541) Reversal (8’896) (1’277) (2’634) (423) - (13’230) Currency translation differences 3’771 555 4’625 309 71 9’331
Balance at 31 December 2017 103’730 47’606 49’119 4’264 1’466 206’185
- thereof current 23’445 45’848 41’607 - - 110’900
- thereof non-current 80’285 1’758 7’512 4’264 1’466 95’285
Change in scope of consolidation 78 - - - - 78 Addition 42’673 35’825 13’156 1’362 2’054 95’070 Utilization (34’681) (29’761) (22’870) - - (87’312) Reversal (13’088) (811) (1’298) - - (15’197) Reclassifications (240) 1’234 (994) - - - Currency translation differences (1’843) (356) (1’241) (99) (146) (3’685)
Balance at 31 December 2018 96’629 53’737 35’872 5’527 3’374 195’139
- thereof current 19’419 51’800 27’091 - - 98’310
- thereof non-current 77’210 1’937 8’781 5’527 3’374 96’829

Stadler – Financial Report 2018 – Consolidated Financial Statements
25
Contingent liabilities and other obligations not to be recognized in the balance sheet
Contingent liabilities and other obligations not recognized in the balance sheet are disclosed directly in the respective sec-tions of the relevant items:
Further information Descriptions
Note 2.3 Investment obligations
Note 2.3 Operating lease liabilities
Note 3.2 Sureties and guarantee obligations
Note 3.2 Pledged assets to secure own obligations
Note 3.3 Employee participation plan
Accounting principles
General aspects – provisions Provisions are made for current obligations with an indefinite settlement date or a non-determinable amount where they are due to a past event and a future outflow of funds is likely. Provisions are measured on the basis of the probable cash outflows and are increased, maintained or released as a result of the reassessment. If the effect of discounting is material, then the provision is recognized at present value. Warranty provisions Warranty provisions are recognized at the beginning of the guarantee period for each individual vehicle according to the best possible estimate (addition warranty provisions). Warranty claims are offset from this amount as they occur (utilization of warranty provisions). The amount of the provision to be recognized is estimated on past experience. Any residual balance at the end of the guarantee period is released to income (reversal warranty provisions). Other personnel provisions and other provisions Provisions for “other personnel matters” are primarily provisions for overtime, holidays and bonuses. The “other provisions” mainly include possible risk and rework provisions as well as possible costs for legal procedures. For non-current provisions, the probability of an outflow of funds is assumed to be an average of 2 to 3 years. Deferred taxes Deferred income tax liabilities are reported under deferred tax provisions. Further information may be found in Note 5.3. Employee benefit liabilities The financial obligations arising from employee benefits are reported under this item. Further information may be found in Note 5.4. Contingent liabilities Contingent liabilities and other obligations not recognized are valued and disclosed at each balance sheet date. If contingent liabilities and other obligations not recognized lead to an outflow of funds without a compensating inflow, and the outflow is probable and can be estimated reliably, a provision is recognized.

Stadler – Financial Report 2018 – Consolidated Financial Statements
26
2.7 Other operating assets and liabilities
Other current receivables
Other current liabilities
Other non-current liabilities
Deferred income and accrued expenses
in thousands of CHF 31.12.2018 31.12.2017
Other current receivables
VAT receivables 44’132 32’374 Income tax receivables 20’003 19’034 Other receivables from related parties - 1’341 Other receivables from associates 9 7’022 Other receivables from third parties 16’708 12’438
Total other current receivables 80’852 72’209
in thousands of CHF 31.12.2018 31.12.2017
Other current liabilities
Social insurance, source and wage taxes 13’569 11’315 Value added taxes 25’495 48’940 Pension fund current account 2’425 239 Tax liabilities 13’277 36’212 Other current liabilities from third parties 18’826 12’914
Total other current liabilities 73’592 109’620
in thousands of CHF 31.12.2018 31.12.2017
Other non-current liabilities
Non-current liabilities - maintenance 27’438 27’240 Other non-current liabilities 1’063 1’177
Total other non-current liabilities 28’501 28’417
in thousands of CHF 31.12.2018 31.12.2017
Deferred income and accrued expenses
Outstanding invoices 27’963 30’293 Manufacturing costs 27’860 7’686 Vacation- and overtime 15’821 11’979 Sales commissions, Royalties, Penalties 15’333 24’033 Other deferred income and accrued expenses 10’544 14’306
Total deferred income and accrued expenses 97’521 88’297

Stadler – Financial Report 2018 – Consolidated Financial Statements
27
3 Financing
The following section explains the most important aspects of financing. Stadler aims to safeguard an adequate equity base in order to maintain the confidence of investors, creditors and the market and to continue the further expansion of the Group. It uses hedging instruments to manage foreign currency risks.
3.1 Financial liabilities
Accounting principles
Financial liabilities are reported at nominal value.
Other current financial liabilities are short-term mortgages.
3.2 Guarantees and pledged assets
Sureties and guarantee obligations
As at the balance sheet date, guarantees (warranties and sureties) amounting to CHF 4,709 million (previous year: CHF 3,946 million) were outstanding.
in thousands of CHF Interest rate Maturity 31.12.2018 31.12.2017
Current financial liabilities
Current financial liabilities to banks 0.85 - 2.0% < 1 year 74’710 10’172 Current lease liabilities 2.0 - 3.99% < 1 year 2’984 3’443 Other current financial liabilities 1.2% < 1 year 3’400 3’400
Total current financial liabilities 81’094 17’015
Non-current financial liabilities
Lease liabilities for buildings and property, plant and equipment 3.5 - 3.8% 1-12 years 37’832 42’797 Bank loans for buildings 1.2 - 2.3% 1-5 years 32’380 38’561 Loans from governmental institutions 1.0% > 5 years 11’414 -
Total non-current financial liabilities 81’626 81’358
Breakdown by currency
CHF 108’713 55’693 EUR 22’294 27’685 USD 11’414 - HUF 6’884 4’620 PLN 13’415 10’375
Total financial liabilities 162’720 98’373

Stadler – Financial Report 2018 – Consolidated Financial Statements
28
Pledged assets to secure own obligations
3.3 Share capital and reserves
Share capital
A 1:50 share split was carried out on 15 June 2018. The par value was reduced from CHF 10.00 to CHF 0.20. As at 31 December 2018, the share capital of the parent company Stadler Rail AG consisted of 100 million registered shares with a par value of CHF 0.20 each (2017: 2 million registered shares with a par value of CHF 10.00 each). Shareholders are entitled to receive the dividends decided upon and have one vote per share at the company’s Annual General Meeting.
Reserves
Non-distributable legal reserves amounted to CHF 4 million as at 31 December 2018 (previous year: CHF 4 million).
Dividends
The following dividends were decided upon and paid out by Stadler:
After 31 December 2018, the Board of Directors proposed dividends of CHF 0.70 per registered share totalling CHF 70 million for 2018. The dividend proposal will be submitted to the Annual General Meeting on 18 March 2019 for approval.
Capital management
The Board of Directors issues guidelines to safeguard an adequate equity base in order to maintain the confidence of investors, creditors and the market and to continue further expansion. The Board of Directors monitors return on investment, which Stadler defines on the basis of total equity and the development of dividends paid.
in thousands of CHF Collateral for: 31.12.2018 31.12.2017
Property Mortgages 104’463 109’408 Assets under lease Finance lease 28’142 29’567 Cash and cash equivalents Bank guarantees - 996 Cash and cash equivalents Advance payments from customers - 24
Total pledged assets 132’605 139’995
Pledged assets
in thousands of CHF or as noted 2018 2017
Dividends paid
Number of registered shares entitled to dividend (in pcs.) 1’991’671 1’943’984 Ordinary dividend per registered share (in CHF) 35 30
Total dividends paid 69’708 58’320
Stadler – Financial Report 2018 – Consolidated Financial Statements
29
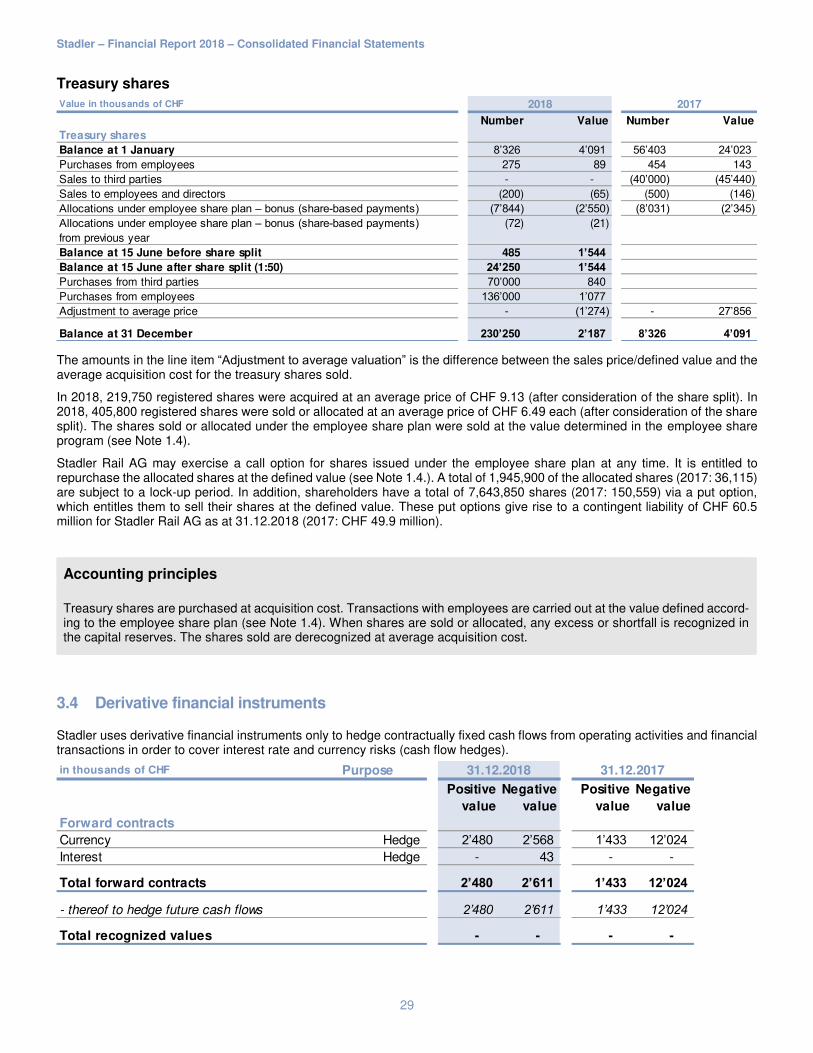
Treasury shares
The amounts in the line item “Adjustment to average valuation” is the difference between the sales price/defined value and the average acquisition cost for the treasury shares sold.
In 2018, 219,750 registered shares were acquired at an average price of CHF 9.13 (after consideration of the share split). In 2018, 405,800 registered shares were sold or allocated at an average price of CHF 6.49 each (after consideration of the share split). The shares sold or allocated under the employee share plan were sold at the value determined in the employee share program (see Note 1.4).
Stadler Rail AG may exercise a call option for shares issued under the employee share plan at any time. It is entitled to repurchase the allocated shares at the defined value (see Note 1.4.). A total of 1,945,900 of the allocated shares (2017: 36,115) are subject to a lock-up period. In addition, shareholders have a total of 7,643,850 shares (2017: 150,559) via a put option, which entitles them to sell their shares at the defined value. These put options give rise to a contingent liability of CHF 60.5 million for Stadler Rail AG as at 31.12.2018 (2017: CHF 49.9 million).
Accounting principles
Treasury shares are purchased at acquisition cost. Transactions with employees are carried out at the value defined accord-ing to the employee share plan (see Note 1.4). When shares are sold or allocated, any excess or shortfall is recognized in the capital reserves. The shares sold are derecognized at average acquisition cost.
3.4 Derivative financial instruments
Stadler uses derivative financial instruments only to hedge contractually fixed cash flows from operating activities and financial transactions in order to cover interest rate and currency risks (cash flow hedges).
Value in thousands of CHF
Number Value Number Value
Treasury shares
Balance at 1 January 8’326 4’091 56’403 24’023 Purchases from employees 275 89 454 143 Sales to third parties - - (40’000) (45’440) Sales to employees and directors (200) (65) (500) (146) Allocations under employee share plan – bonus (share-based payments) (7’844) (2’550) (8’031) (2’345) Allocations under employee share plan – bonus (share-based payments) from previous year
(72) (21)
Balance at 15 June before share split 485 1’544
Balance at 15 June after share split (1:50) 24’250 1’544
Purchases from third parties 70’000 840 Purchases from employees 136’000 1’077 Adjustment to average price - (1’274) - 27’856
Balance at 31 December 230’250 2’187 8’326 4’091
2018 2017
in thousands of CHF Purpose
Positive
value
Negative
value
Positive
value
Negative
value
Forward contracts
Currency Hedge 2’480 2’568 1’433 12’024 Interest Hedge - 43 - -
Total forward contracts 2’480 2’611 1’433 12’024
- thereof to hedge future cash flows 2’480 2’611 1’433 12’024
Total recognized values - - - -
31.12.2018 31.12.2017

Stadler – Financial Report 2018 – Consolidated Financial Statements
30
Accounting principles
Hedging transactions are disclosed in the notes. As soon as the hedged cash flows occur, the fair value of the hedge instru-ment is transferred to the income statement or as an adjustment of the carrying amount of the related asset or liability. If the future transaction is no longer expected to happen, accumulated profits or losses are recognized immediately.

Stadler – Financial Report 2018 – Consolidated Financial Statements
31
4 Group structure
The following section explains Stadler’s structure including the main changes and the resulting effects on the consoli-dated financial statements. This section also contains disclosures on transactions with related parties and companies, and specifies the general consolidation principles.
4.1 Changes in scope of consolidation
4.1.1 Changes in 2018
Additions (companies founded) in 2018
• As at 3 December 2018: Stadler Service Denmark ApS, Aarhus C, Denmark (Purpose: Service)
Acquisitions of subsidiaries in 2018
With effect from 1 April 2018, Stadler Rail AG acquired 100% of the capital shares of Stadler MR Sweden AB from Knorr-Bremse Nordic Rail Services AB. With this acquisition, Stadler is expanding its service activities in the areas of modernization and maintenance in Sweden.
The acquired assets and liabilities are composed of the following:
Buyout of minority interests in 2018
With effect from 7 November 2018, Stadler Rail AG acquired the remaining 40% of the capital shares of Stadler Sroda Sp. z o.o. (formerly Solaris Tram Sp. z o.o.), Sroda Wielkopolska, Poland. This acquisition will allow the necessary expansion of capacities (car bodies).
The acquired assets and liabilities are composed of the following:
in thousands of CHF Total
Acquisition of Stadler MR Sweden AB
Current assets 23’221 Non-current assets 622 Current liabilities (20’383)
Total net assets 3’460
Purchase price 7’302
Goodwill 3’842
Cash acquired (33)
Net cash outflow (7’269)
in thousands of CHF Total
Acquisition of Stadler Sroda Sp. z o.o.
Purchase price 1’153 minority interests held (40%) (3’195)
Badwill (negative goodwill) (2’042)
Cash acquired -
Net cash outflow (1’153)

Stadler – Financial Report 2018 – Consolidated Financial Statements
32
With effect from 17 December 2018, STAP Grundstücks-Vermietungs GmbH acquired the consolidated minority interest of 6% in SILEX Grundstücks-Vermietungs GmbH & CO. KG for EUR 1.00.
Disposals in 2018
With effect from 1 January 2018, Stadler Rail AG sold 40% of its total 80% share in the capital of Stadler Trains Magyarorszàg Kft.
As at 17 December 2018, the net assets of SILEX Grundstücks-Vermietungs GmbH & CO. KG were transferred to the parent company STAP Grundstücks-Vermietungs GmbH (merger within the scope of consolidation).
4.1.2 Changes in 2017
Additions (companies founded) in 2017
• As at 31 March 2017: Stadler Chemnitz GmbH, Chemnitz, Germany (purpose: engineering)
• As at 1 May 2017: Stadler CIS AG (share in capital: 51%), Bussnang, Switzerland (purpose: sales)
• As at 1 November 2017: OOO Stadler, Moscow (share in capital: 90%), Russia (purpose: sales)
• As at 1 December 2017: Stadler Service Norway AS, Oslo, Norway (purpose: service)
Acquisitions of subsidiaries in 2017
With effect from 1 January 2017, Stadler Rail AG acquired 60% of the capital shares of Solaris Tram Sp. z o.o. Owinska, Poland.
This company operates a plant in Sroda where car bodies are manufactured and varnished. In future, Solaris Tram and Stadler Polska will take part in tenders in Poland and other Central European countries as a syndicate, with Stadler as leading partner. This will enable both companies to strengthen their positions in the Polish and Central European markets.
The acquired assets and liabilities are composed of the following:
Subsidiaries disposed of in 2017
With effect from 1 July 2017, Stadler Service AG sold 60% of its capital shares in Stadler Linz GmbH to ÖBB-Technische Services GmbH.
As such, ÖBB-Technische Services GmbH and Stadler Service AG formed a joint venture in ÖBB Stadler Service GmbH for the maintenance of the KISS fleet of WESTbahn Management GmbH. The key data on the transaction date 1 July 2017 were as follows:
in thousands of CHF Total
Acquisition of Solaris Tram Sp. z o.o.
Current assets 4’603 Non-current assets 5’830 Current liabilities (688)
Total net assets 9’745
Purchase price 3’750 Proportional net assets 60% (5’847)
Badwill (negative goodwill) (2’097)
Cash acquired (4’208)
Net cash outflow 458

Stadler – Financial Report 2018 – Consolidated Financial Statements
33
4.2 Scope of consolidation and consolidation principles
Accounting principles
The consolidated financial statements include the annual financial statements of Stadler Rail AG and the companies controlled by Stadler Rail AG. Control exists if Stadler Rail AG can impose the financial and business policy, thus also benefiting from business activities. This is the case if more than 50% of the voting rights are held or if control can be exercised otherwise (see Note 4.4, “List of investments”). Capital consolidation follows the Anglo-Saxon purchasing method. The equity of the group companies on the date of acquisition or date of founding is offset against the carrying amount of the investment in the holding company. As of this date, the assets and liabilities of the group company are valued at current values. No purchase price allocation has been undertaken. As a result, any difference between the acquisition costs and the equity of the acquired company is recorded as positive or negative goodwill directly in retained earnings. Transaction costs incurred in connection with the acquisition of a company are included in acquisition costs. The purchase of minority interests is also recognized using the purchasing method. Positive or negative goodwill is the difference between the purchase price and the proportionate carrying amount of the minority interests and is offset directly against retained earnings. Assets, liabilities, income and expenses of the consolidated companies are recognized in full using the full consolidation method. Minority interests in equity and earnings are shown separately in the consolidated balance sheet and consol-idated income statement. All intragroup transactions and relationships are netted with each other and eliminated in the consolidated financial statements. Unrealized gains contained in inventories resulting from intragroup deliveries are eliminated in full. Unre-alized losses on intragroup transactions are also eliminated, unless there is evidence of impairment. Investments over which a significant influence can be exercised are not fully consolidated. Significant influence is presumed if the share in voting rights is at least 20% but less than 50% and control cannot be exercised. Associated organizations are accounted for using the equity method. The acquisition costs of the acquired company are netted with the net assets measured at current values on the date of acquisition. Any difference between the acquisition costs and the proportional equity of the acquired investment remaining after this revaluation is recorded as positive or nega-tive goodwill directly in retained earnings. Transaction costs incurred in connection with the acquisition are part of the acquisition costs. The carrying amount is subsequently adjusted to reflect Stadler’s share of the associated company’s profit or loss for the year and changes in capital. They are shown in the consolidated balance sheet under investments in associated companies.
in thousands of CHF Total
Sale of Stadler Linz GmbH
Net revenue 4’269 Earnings before interest and taxes (EBIT) 487
Current assets 15’251 Non-current assets 193 Current liabilities (11’988) Non-current liabilities (882)
Total net assets 2’573
Sales price 10’098 Proportional net assets 60% (1’544) Transaction costs (355)
Profit from sale of 60% stake 8’199
Less cash disposed of (2’329)
Net cash inflow 7’414
Stadler – Financial Report 2018 – Consolidated Financial Statements
34
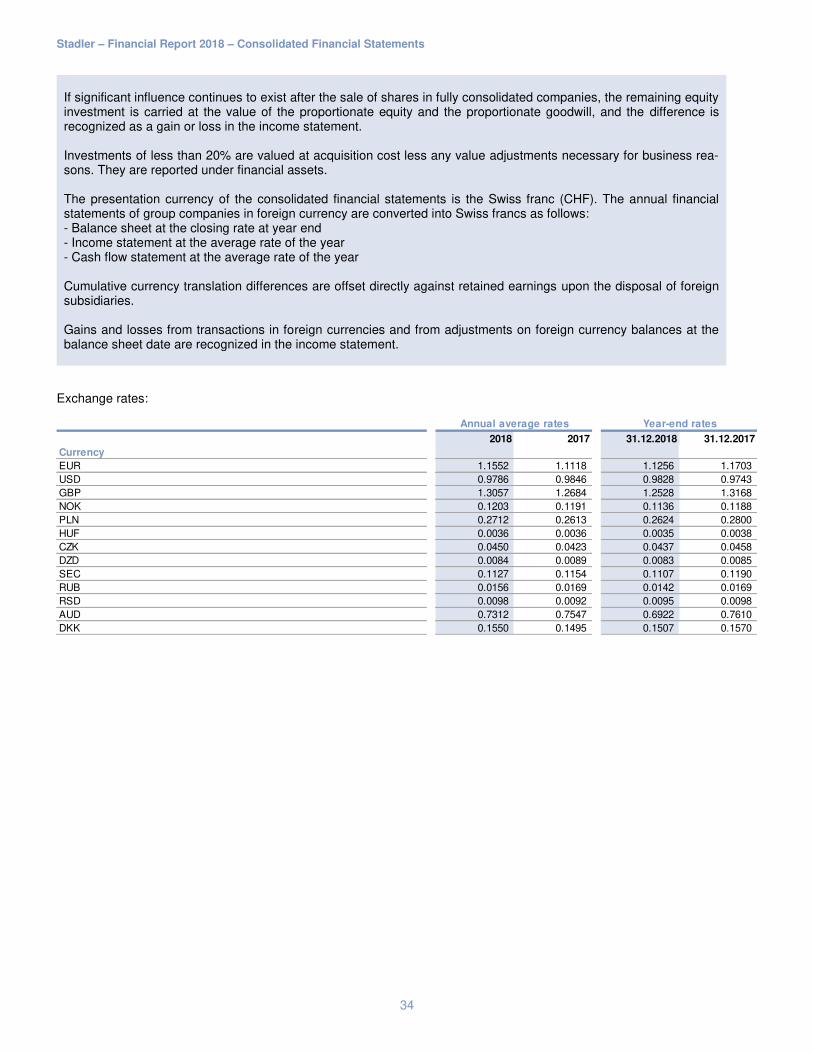
If significant influence continues to exist after the sale of shares in fully consolidated companies, the remaining equity investment is carried at the value of the proportionate equity and the proportionate goodwill, and the difference is recognized as a gain or loss in the income statement. Investments of less than 20% are valued at acquisition cost less any value adjustments necessary for business rea-sons. They are reported under financial assets. The presentation currency of the consolidated financial statements is the Swiss franc (CHF). The annual financial statements of group companies in foreign currency are converted into Swiss francs as follows: - Balance sheet at the closing rate at year end - Income statement at the average rate of the year - Cash flow statement at the average rate of the year Cumulative currency translation differences are offset directly against retained earnings upon the disposal of foreign subsidiaries. Gains and losses from transactions in foreign currencies and from adjustments on foreign currency balances at the balance sheet date are recognized in the income statement.
Exchange rates:
2018 2017 31.12.2018 31.12.2017
Currency
EUR 1.1552 1.1118 1.1256 1.1703 USD 0.9786 0.9846 0.9828 0.9743 GBP 1.3057 1.2684 1.2528 1.3168 NOK 0.1203 0.1191 0.1136 0.1188 PLN 0.2712 0.2613 0.2624 0.2800 HUF 0.0036 0.0036 0.0035 0.0038 CZK 0.0450 0.0423 0.0437 0.0458 DZD 0.0084 0.0089 0.0083 0.0085 SEC 0.1127 0.1154 0.1107 0.1190 RUB 0.0156 0.0169 0.0142 0.0169 RSD 0.0098 0.0092 0.0095 0.0098 AUD 0.7312 0.7547 0.6922 0.7610 DKK 0.1550 0.1495 0.1507 0.1570
Annual average rates Year-end rates
Stadler – Financial Report 2018 – Consolidated Financial Statements
35
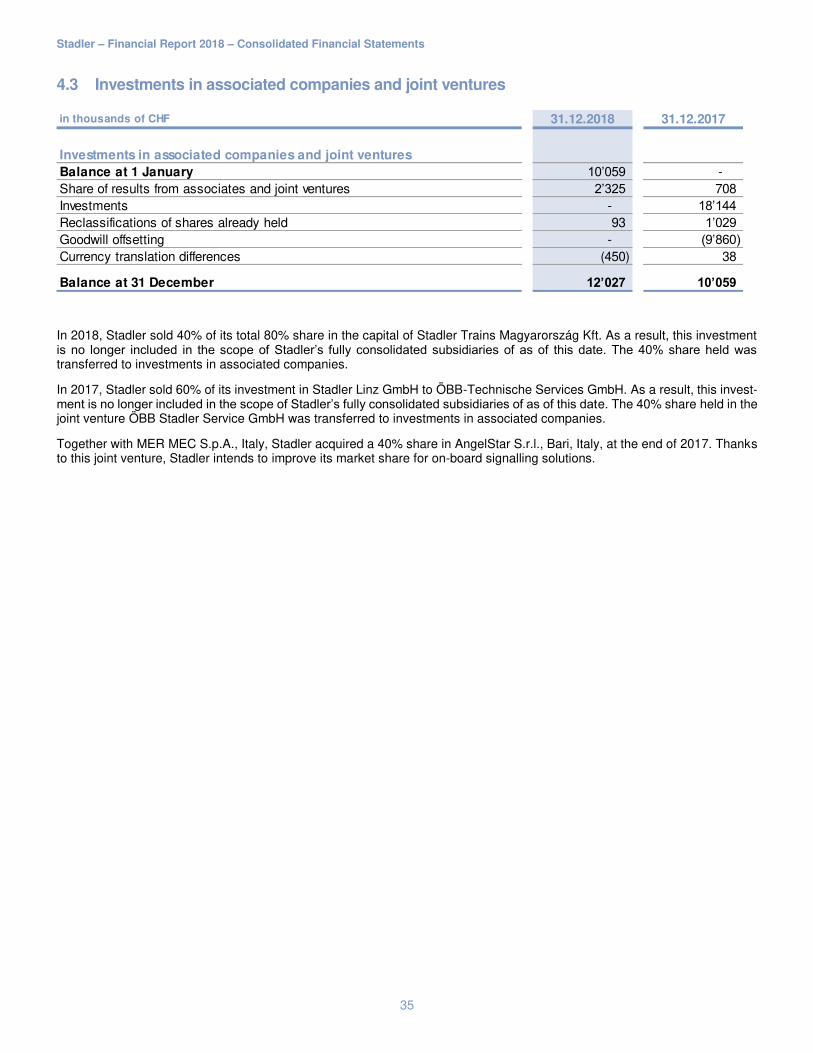
4.3 Investments in associated companies and joint ventures
In 2018, Stadler sold 40% of its total 80% share in the capital of Stadler Trains Magyarország Kft. As a result, this investment is no longer included in the scope of Stadler’s fully consolidated subsidiaries of as of this date. The 40% share held was transferred to investments in associated companies.
In 2017, Stadler sold 60% of its investment in Stadler Linz GmbH to ÖBB-Technische Services GmbH. As a result, this invest-ment is no longer included in the scope of Stadler’s fully consolidated subsidiaries of as of this date. The 40% share held in the joint venture ÖBB Stadler Service GmbH was transferred to investments in associated companies.
Together with MER MEC S.p.A., Italy, Stadler acquired a 40% share in AngelStar S.r.l., Bari, Italy, at the end of 2017. Thanks to this joint venture, Stadler intends to improve its market share for on-board signalling solutions.
in thousands of CHF 31.12.2018 31.12.2017
Investments in associated companies and joint ventures
Balance at 1 January 10’059 - Share of results from associates and joint ventures 2’325 708 Investments - 18’144 Reclassifications of shares already held 93 1’029 Goodwill offsetting - (9’860) Currency translation differences (450) 38
Balance at 31 December 12’027 10’059
Stadler – Financial Report 2018 – Consolidated Financial Statements
36
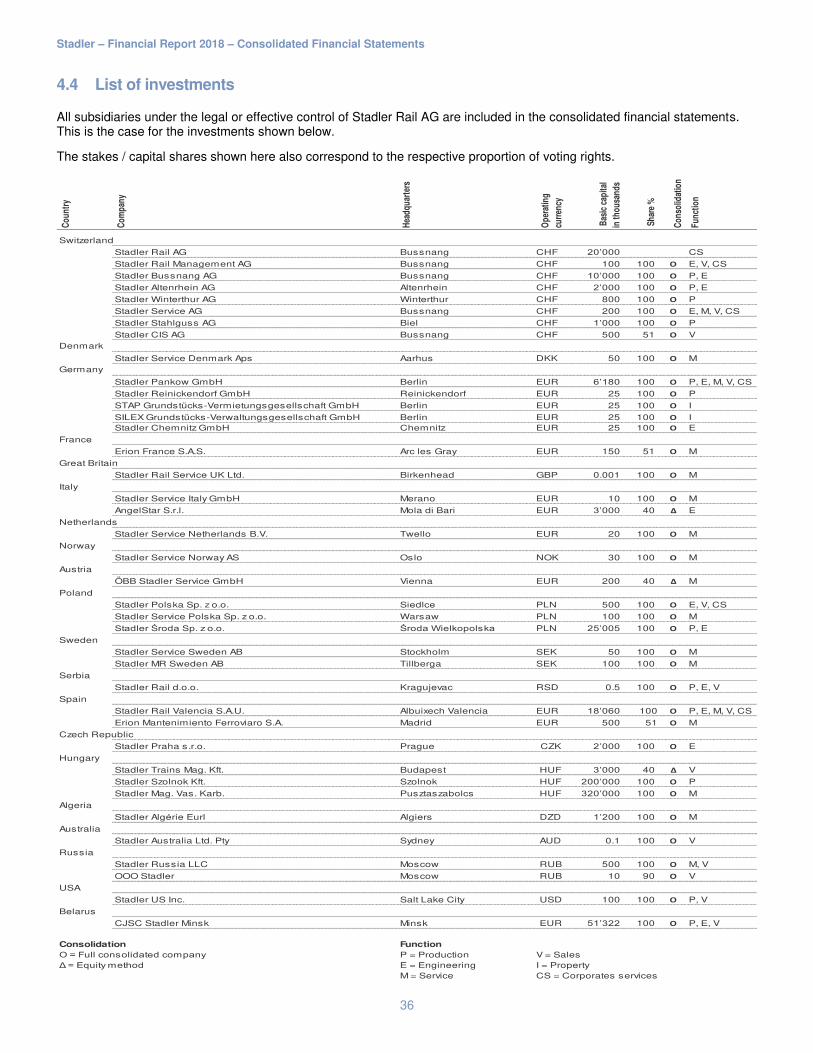
4.4 List of investments
All subsidiaries under the legal or effective control of Stadler Rail AG are included in the consolidated financial statements. This is the case for the investments shown below.
The stakes / capital shares shown here also correspond to the respective proportion of voting rights.
Co
un
try
Co
mp
any
Hea
dq
uar
ters
Op
erat
ing
curr
ency
Bas
ic c
apit
al
in t
ho
usa
nd
s
Sh
are
%
Co
nso
lidat
ion
Fu
nct
ion
Switzerland
Stadler Rail AG Bussnang CHF 20’000 CS
Stadler Rail Management AG Bussnang CHF 100 100 Ο E, V, CS
Stadler Bussnang AG Bussnang CHF 10’000 100 Ο P, E
Stadler Altenrhein AG Altenrhein CHF 2’000 100 Ο P, E
Stadler Winterthur AG Winterthur CHF 800 100 Ο P
Stadler Service AG Bussnang CHF 200 100 Ο E, M, V, CS
Stadler Stahlguss AG Biel CHF 1’000 100 Ο P
Stadler CIS AG Bussnang CHF 500 51 Ο V
Denmark
Stadler Service Denmark Aps Aarhus DKK 50 100 Ο M
Germany
Stadler Pankow GmbH Berlin EUR 6’180 100 Ο P, E, M, V, CS
Stadler Reinickendorf GmbH Reinickendorf EUR 25 100 Ο P
STAP Grundstücks-Vermietungsgesellschaft GmbH Berlin EUR 25 100 Ο I
SILEX Grundstücks-Verwaltungsgesellschaft GmbH Berlin EUR 25 100 Ο IStadler Chemnitz GmbH Chemnitz EUR 25 100 Ο E
France
Erion France S.A.S. Arc les Gray EUR 150 51 Ο M
Great Britain
Stadler Rail Service UK Ltd. Birkenhead GBP 0.001 100 Ο M
Italy
Stadler Service Italy GmbH Merano EUR 10 100 Ο M
AngelStar S.r.l. Mola di Bari EUR 3’000 40 Δ E
Netherlands
Stadler Service Netherlands B.V. Twello EUR 20 100 Ο M
Norway
Stadler Service Norway AS Oslo NOK 30 100 Ο M
Austria
ÖBB Stadler Service GmbH Vienna EUR 200 40 Δ M
Poland
Stadler Polska Sp. z o.o. Siedlce PLN 500 100 Ο E, V, CS
Stadler Service Polska Sp. z o.o. Warsaw PLN 100 100 Ο M
Stadler Środa Sp. z o.o. Środa Wielkopolska PLN 25’005 100 Ο P, E
Sweden
Stadler Service Sweden AB Stockholm SEK 50 100 Ο M
Stadler MR Sweden AB Tillberga SEK 100 100 Ο M
Serbia
Stadler Rail d.o.o. Kragujevac RSD 0.5 100 Ο P, E, V
Spain
Stadler Rail Valencia S.A.U. Albuixech Valencia EUR 18’060 100 Ο P, E, M, V, CS
Erion Mantenimiento Ferroviaro S.A. Madrid EUR 500 51 Ο M
Czech Republic
Stadler Praha s.r.o. Prague CZK 2’000 100 Ο E
Hungary
Stadler Trains Mag. Kft. Budapest HUF 3’000 40 Δ V
Stadler Szolnok Kft. Szolnok HUF 200’000 100 Ο P
Stadler Mag. Vas. Karb. Pusztaszabolcs HUF 320’000 100 Ο M
Algeria
Stadler Algérie Eurl Algiers DZD 1’200 100 Ο M
Australia
Stadler Australia Ltd. Pty Sydney AUD 0.1 100 Ο V
Russia
Stadler Russia LLC Moscow RUB 500 100 Ο M, V
OOO Stadler Moscow RUB 10 90 Ο V
USA
Stadler US Inc. Salt Lake City USD 100 100 Ο P, V
Belarus
CJSC Stadler Minsk Minsk EUR 51’322 100 Ο P, E, V
Consolidation Function
Ο = Full consolidated company P = Production V = SalesΔ = Equity method E = Engineering I = Property
M = Service CS = Corporates services

Stadler – Financial Report 2018 – Consolidated Financial Statements
37
4.5 Related parties and companies
Related parties are associated companies, shareholders, pension funds and the bodies of group companies. Transactions with related parties are generally based on market conditions. Services amounting to CHF 3.8 million (previous year: CHF 5.2 million) were purchased from related parties. Services provided to related parties amounted to CHF 0.7 million (previous year: CHF 0.2 million). Further information about assets and liabilities from or to related parties and associated companies may be found in Notes 2.1, 2.4, 2.7, 4.3 and 5.4.
4.6 Goodwill
Goodwill resulting from an acquisition is recorded in retained earnings on the date of acquisition. When shares of a group company are sold, the goodwill historically recorded in retained earnings is transferred to the income statement. The effects of theoretical capitalization and amortization, including any impairment resulting from the assessed recoverability, are shown below. For the shadow accounting, in principle the goodwill is depreciated on a straight-line basis over the economic useful life, normally five years.
Effects of a theoretical capitalization of goodwill on the balance sheet:
Effects of a theoretical amortization of goodwill on profit for the year:
in thousands of CHF 31.12.2018 31.12.2017
Effects of theoretical capitalization of goodwill on the balance sheet
Shareholders’ equity including minority interests 803’503 765’439 Equity ratio 27.85% 28.74%
Acquisition value of goodwill at the beginning of the year 156’380 148’617 Additions 1’800 7’763
Acquisition value of goodwill at the end of the year 158’180 156’380
Accumulated depreciation of goodwill at the beginning of the year 59’501 29’560 Depreciation current year 30’808 29’941
Accumulated depreciation of goodwill at the end of the year 90’309 59’501
Theoretical net carrying amount of goodwill 67’871 96’879
Theoretical equity including minority interests and net carrying amount
of goodwill
871’374 862’318
Theoretical equity ratio 29.51% 31.24%
in thousands of CHF 2018 2017
Effects of theoretical capitalization of goodwill on profit for the year
Reported profit for the year 119’193 171’900 Theoretical depreciation of goodwill (30’808) (29’941)
Annual profit after depreciation of goodwill 88’385 141’959

Stadler – Financial Report 2018 – Consolidated Financial Statements
38
5 Other information
5.1 Financial result
5.2 Other operating income / expenses
Other operating income
Other operating expenses
in thousands of CHF 2018 2017
Financial income
Interest income 3’014 1’697 Interest income from shareholders 2 - Other interests (Loans) 53 1’784 Foreign exchange gains - 25’897
Total financial revenue 3’069 29’378
Financial expenses
Interest expenses (3’288) (2’423) Interest expenses on finance leases (1’611) (1’624) Investment expenses on cash equivalents - (36) Bank charges (769) (1’148) Order-related bank guarantee costs (10’805) (13’280) Foreign exchange losses (7’947) -
Total financial expenses (24’420) (18’511)
Net financial result (21’351) 10’867
in thousands of CHF 2018 2017
Other operating income
Government grants 43 48 Reversal of process provisions 169 1’000 Profit from sales of subsidiaries - 8’199 Reversal of impairment on financial assets 1’155 - Reversal of social security and personnel-related accruals 2’376 - Proceeds from receivables written off 773 - Proceeds from recycling 1’261 872 Miscellaneous 3’732 2’536
Total other operating income 9’509 12’655
in thousands of CHF 2018 2017
Other operating expenses
Change in allowance of inventories (588) (1’469) Depreciation of SILEX properties, Stadler Rail AG patents (1’977) (1’732) Loss on sales of subsidiaries (93) - Capital taxes, miscellaneous (4’772) (3’038)
Total other operating expenses (7’430) (6’239)

Stadler – Financial Report 2018 – Consolidated Financial Statements
39
5.3 Income taxes
The average applicable tax rate in relation to the ordinary result and deferred taxes is 14.6% (previous year: 14.7%).
Accounting principles
Income taxes include both current and deferred income taxes. Current income taxes are calculated applying current tax rates to the taxable annual income or expected taxable income for the year depending on the respective fiscal regulations for calculating profit. Deferred income taxes are recognized for valuation differences between assets and liabilities measured according to uniform group-wide guidelines in relation to the respective fiscal values. Deferred tax liabilities are recognized in the balance sheet under the item provisions. Deferred tax assets from losses carried forward and from deductible tempo-rary differences are recognized to the extent that they are likely to be offset against future taxable profits. Deferred taxes are calculated on the basis of the expected tax rates applicable to the individual companies for the corre-sponding assets and liabilities.
in thousands of CHF 2018 2017
Income taxes
Current income taxes (16’353) (26’337) Deferred income taxes 3’629 (4’189)
Total income taxes (12’724) (30’526)
in thousands of CHF 2018 2017
Income taxes
Income taxes before consideration of losses carried forward (12’125) (30’557) Effect of non-capitalization of losses carried forward (912) (48) Effect of the use of non-capitalized losses carried forward 313 79
Income taxes after consideration of losses carried forward (12’724) (30’526)
in thousands of CHF 31.12.2018 31.12.2017
Non-capitalized losses carried forward
Expiration after 2018 (or 2017 for previous year) 44’654 44’916
Total non-capitalized losses carried forward 44’654 44’916

Stadler – Financial Report 2018 – Consolidated Financial Statements
40
5.4 Employee benefits
The employer contribution reserves at the end of the year were as follows:
Economic benefit/obligation and employee benefit expenses:
Accounting principles
Assets and liabilities from employee benefit plans (incl. employer contribution reserve)
The employee benefit plans are either financially independent entities and foundations outside of Stadler (funded plans) or unfunded plans with a corresponding liability in the balance sheet. They are financed by employee and employer contribu-tions. The actual economic impact of all employee benefit plans that provide benefits for retirement, death or disability are calculated as at the balance sheet date. A benefit resulting from employer contribution reserves is recognized as an asset. Any additional economic benefit (from a surplus in pension fund cover) is not capitalized. An economic obligation is recog-nized as a liability if the conditions for the recognition of a provision are met.
in thousands of CHFNominal value Waiver of use Balance sheet Accumulation Balance sheet
31.12.2018 2018 31.12.2018 2018 31.12.2017 2018 2017
Employer contribution reserves (ECR)
Pension plans with surplus 25’883 - 25’883 - 30’028 4’145 -
Total employer contribution reserves 25’883 - 25’883 - 30’028 4’145 -
in thousands of CHFNominal value Waiver of use Balance sheet Accumulation Balance sheet
31.12.2017 2017 31.12.2017 2017 31.12.2016 2017 2016
Employer contribution reserves (ECR)
Pension plans with surplus 30’028 - 30’028 30’000 28 - -
Total employer contribution reserves 30’028 - 30’028 30’000 28 - -
Result from ECR in personnel
expenses
Result from ECR in personnel
expenses
in thousands of CHF
Surplus/
Deficit
Change from
previous year
Contributions
concerning
the business
period
31.12.2018 31.12.2018 31.12.2017 2018 2018 2018 2017
Economical benefit/economical
obligation and pension benefit
expenses
Pension plans with surplus 35’588 - - - 22’495 22’495 21’272 Pension fund without own assets - 3’374 1’466 1’908 - 1’908 686
Total economical benefit/economical
obligation and pension benefit
expenses
35’588 3’374 1’466 1’908 22’495 24’403 21’958
in thousands of CHF
Surplus/
Deficit
Change from
previous year
Contributions
concerning
the business
period
31.12.2017 31.12.2017 31.12.2016 2017 2017 2017 2016
Economical benefit/economical
obligation and pension benefit
expenses
Pension plans with surplus 54’451 - - - 21’272 21’272 23’816 Pension fund without own assets - 1’466 780 686 - 686 33
Total economical benefit/economical
obligation and pension benefit
expenses
54’451 1’466 780 686 21’272 21’958 23’849
Pension benefit expenses
within personnel expenses
Pension benefit expenses
within personnel expenses
Economical part of the
organisation
Economical part of the
organisation

Stadler – Financial Report 2018 – Consolidated Financial Statements
41
5.5 Events after the reporting date
No events occurred after the reporting date that could have a significant impact on the 2018 consolidated financial statements.
5.6 Approval of the consolidated financial statements
The 2018 financial statements were approved by the Board of Directors on 25 February 2019 and will be recommended for approval at the Annual General Meeting on 18 March 2019.
The English version of the financial statements is a translation of the original in German for information purposes only. In case of a discrepancy, the German original will prevail.

Stadler – Financial Report 2018 – Consolidated Financial Statements
42
Report of the Statutory to the General Meeting of Shareholders of Stadler Rail AG, Bussnang
Report of the Statutory Auditor on the Consolidated Financial Statements As statutory auditor, we have audited the consolidated financial statements of Stadler Rail AG presented on the pages 5 to 41, which comprise the balance sheet, income statement, cash flow statement, statement of changes in equity and notes for the year ended 31 December 2018. Board of Directors’ Responsibility The board of directors is responsible for the preparation of the consolidated financial statements in accordance with Swiss GAAP FER and the requirements of Swiss law. This responsibility in-cludes designing, implementing and maintaining an internal control system relevant to the prep-aration of consolidated financial statements that are free from material misstatement, whether due to fraud or error. The board of directors is further responsible for selecting and applying ap-propriate accounting policies and making accounting estimates that are reasonable in the circum-stances. Auditor’s Responsibility Our responsibility is to express an opinion on these consolidated financial statements based on our audit. We conducted our audit in accordance with Swiss law and Swiss Auditing Standards. Those standards require that we plan and perform the audit to obtain reasonable assurance whether the consolidated financial statements are free from material misstatement. An audit involves performing procedures to obtain audit evidence about the amounts and disclo-sures in the consolidated financial statements. The procedures selected depend on the auditor’s judgment, including the assessment of the risks of material misstatement of the consolidated fi-nancial statements, whether due to fraud or error. In making those risk assessments, the auditor considers the internal control system relevant to the entity’s preparation of the consolidated finan-cial statements in order to design audit procedures that are appropriate in the circumstances, but not for the purpose of expressing an opinion on the effectiveness of the entity’s internal control system. An audit also includes evaluating the appropriateness of the accounting policies used and the reasonableness of accounting estimates made, as well as evaluating the overall presen-tation of the consolidated financial statements. We believe that the audit evidence we have ob-tained is sufficient and appropriate to provide a basis for our audit opinion. Opinion In our opinion, the consolidated financial statements for the year ended 31 December 2018 give a true and fair view of the financial position, the results of operations and the cash flows in ac-cordance with Swiss GAAP FER and comply with Swiss law.

Stadler – Financial Report 2018 – Consolidated Financial Statements
KPMG AG, Badenerstrasse 172, Postfach, CH-8036 Zürich
KPMG AG ist eine Tochtergesellschaft der KPMG Holding AG. KPMG Holding AG ist Mitglied des KPMG Netzwerks unabhängiger Mitgliedsfirmen, der KPMG Internatio-
nal Cooperative (“KPMG International”), einer juristischen Person schweizerischen Rechts. Alle Rechte vorbehalten.
43
Report on Other Legal Requirements We confirm that we meet the legal requirements on licensing according to the Auditor Oversight Act (AOA) and independence (article 728 CO) and that there are no circumstances incompatible with our independence. In accordance with article 728a paragraph 1 item 3 CO and Swiss Auditing Standard 890, we confirm that an internal control system exists, which has been designed for the preparation of consolidated financial statements according to the instructions of the board of directors. We recommend that the consolidated financial statements submitted to you be approved. KPMG AG Kurt Stocker Simon Niklaus Licensed Audit Expert Licensed Audit Expert Auditor in Charge Zurich, 25 February 2019
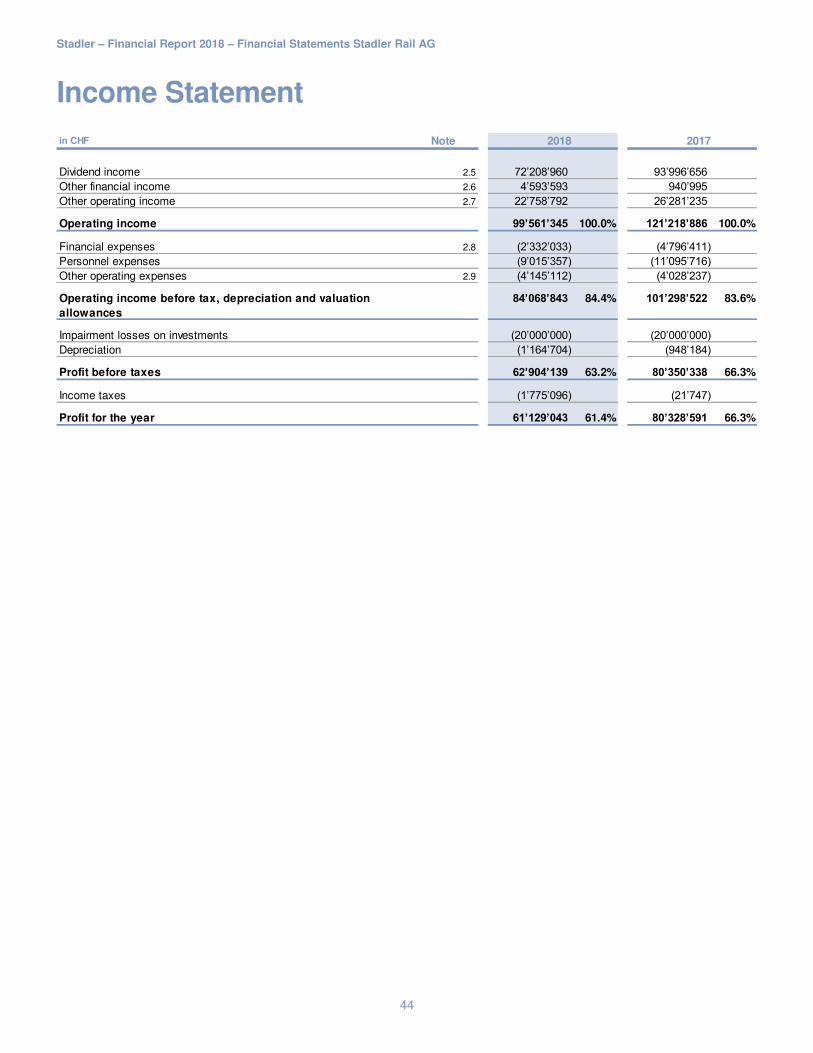
Stadler – Financial Report 2018 – Financial Statements Stadler Rail AG
44
Income Statement
in CHF Note 2018 2017
Dividend income 2.5 72’208’960 93’996’656 Other financial income 2.6 4’593’593 940’995 Other operating income 2.7 22’758’792 26’281’235
Operating income 99’561’345 100.0% 121’218’886 100.0%
Financial expenses 2.8 (2’332’033) (4’796’411) Personnel expenses (9’015’357) (11’095’716) Other operating expenses 2.9 (4’145’112) (4’028’237)
Operating income before tax, depreciation and valuation
allowances
84’068’843 84.4% 101’298’522 83.6%
Impairment losses on investments (20’000’000) (20’000’000) Depreciation (1’164’704) (948’184)
Profit before taxes 62’904’139 63.2% 80’350’338 66.3%
Income taxes (1’775’096) (21’747)
Profit for the year 61’129’043 61.4% 80’328’591 66.3%

Stadler – Financial Report 2018 – Financial Statements Stadler Rail AG
45
Balance Sheet
in CHF Note 31.12.2018 31.12.2017
Assets
Cash and cash equivalents 540’186 2’482’037 Other current receivables- from third parties 20’717 119 - from related parties 8’616 - - from group companies 4’385’679 1’984’205 Accrued income and deferred expenses 21’024 -
Total current assets 4’976’222 1.5% 4’466’361 1.5%
Financial assets 2.1 35’482’086 26’162’200 Investments 2.2 276’958’548 272’946’444 Intangible assets 5’999’378 3’420’414
Total non-current assets 318’440’012 98.5% 302’529’058 98.5%
Total assets 323’416’234 100.0% 306’995’419 100.0%
Liabilities & equity
Other current liabilities- from third parties 714’142 1’523’634 - from related parties 568’514 446 - from group companies 47’370’070 19’775’568 Current provisions 2’920’286 1’900’000 Deferred income and accrued expenses 215’970 2’204’606
Total current liabilities 51’788’982 16.0% 25’404’254 8.3%
Non-current interest-bearing liabilities- from group companies 50’649’750 52’663’050
Total non-current liabilities 50’649’750 15.7% 52’663’050 17.2%
Total liabilities 102’438’732 31.7% 78’067’304 25.4%
Share capital 2.3 20’000’000 20’000’000 Legal retained earnings- General legal retained earnings 4’000’000 4’000’000 Voluntary retained earnings- Available earnings - Result carried forward 138’035’922 128’690’382 - Profit for the year 61’129’043 80’328’591 Treasury shares 2.4 (2’187’463) (4’090’858)
Total equity 220’977’502 68.3% 228’928’115 74.6%
Total liabilities & equity 323’416’234 100.0% 306’995’419 100.0%

Stadler – Financial Report 2018 – Financial Statements Stadler Rail AG
46
Notes to the Financial Statements
1. Principles
General information
These financial statements have been prepared in accordance with the provisions of Swiss Accounting Law (32nd title of the Swiss Code of Obligations). The main valuation principles that are not required by law are described below:
Financial assets
Financial assets include long-term loans and securities with market prices. Loans granted in foreign currencies are valued at the current balance sheet date, whereby unrealized losses are recorded, whereas unrealized gains are not recognized (im-parity principle). Short-term securities are valued at their market prices on the balance sheet date. No fluctuation reserve was formed.
Investments
Investments were valued at acquisition cost less any necessary value adjustments. The principle of individual valuation is applied.
Intangible assets
Purchased intangible assets are capitalized at acquisition or production costs if they are identifiable and can be measured reliably. All intangible assets are amortized on a straight-line basis over five years.
Intangible assets consist mainly of licences acquired.
Treasury shares
Treasury shares are recognized at acquisition cost and deducted from equity on the date of acquisition. In case of a resale, the gain or loss is recognized in retained earnings without affecting the income statement.
Share-based payments
If treasury shares are used for share-based payments by Stadler Rail AG, the difference between the defined value and any consideration paid by the employee on the allocation date is recognized in personnel expenses.
Forgoing a cash flow statement and additional disclosures in the notes
Since Stadler Rail AG has prepared consolidated financial statements in accordance with a recognized accounting standard (Swiss GAAP FER), it was decided to forgo presenting additional information in the notes on interest-bearing liabilities and audit fees, or to provide a cash flow statement, in accordance with the legal requirements in these financial statements.

Stadler – Financial Report 2018 – Financial Statements Stadler Rail AG
47
2. Information on balance sheet and income statement items
2.1 Financial assets
2.2 Investments
Direct investments:
Indirect investments:
in CHF 31.12.2018 31.12.2017
Loans to third parties 17’234’145 - Loans to group companies 18’247’941 25’761’800 Securities - 400’400
Total financial assets 35’482’086 26’162’200
Company Domicile
31.12.2018 31.12.2017
Stadler Rail Management AG Bussnang (CH) 100 100 Stadler Trains Mag. Kft. Budapest (HU) 40 80 Stadler Bussnang AG Bussnang (CH) 100 100 Stadler Altenrhein AG Altenrhein (CH) 100 100 Stadler US Inc. Salt Lake (USA) 100 100 Stadler Winterthur AG Winterthur (CH) 100 100 Stadler Szolnok Kft. Szolnok (HU) 100 100 Stadler Pankow GmbH Berlin (DE) 100 100 Stadler Polska Sp. z o.o. Siedlce (PL) 100 100 Stadler Praha s.r.o. Prague (CZ) 100 100 CJSC Stadler Minsk Minsk (BY) 100 100 Stadler Service AG Bussnang (CH) 100 100 Stadler Australia Ltd. Pty Sydney (AUS) 100 100 Stadler Rail Valencia S.A.U. Valencia (ES) 100 100 Stadler Środa Sp. z o.o. Środa Wielkopolska (PL) 100 60 Stadler CIS AG Bussnang (CH) 51 51 AngelStar S.r.l. Mola di Bari (IT) 40 40
Share of capital and voting rights in %
Company Domicile
31.12.2018 31.12.2017
Stadler Stahlguss AG Biel (CH) 100 100 Stadler Rail d.o.o. Kragujevac (RS) 100 100 Stadler Reinickendorf GmbH Reinickendorf (DE) 100 100 STAP Grundstücks-Vermietungsgesellschaft GmbH Berlin (DE) 100 100 SILEX Grundstücks-Verwaltungsgesellschaft GmbH Berlin (DE) 100 100 SILEX Grundstücks-Vermietungsgesellschaft GmbH & CO. KG Objekt Frankfurt KG
Berlin (DE) - 94
Stadler Russia LLC Moscow (RU) 100 100 Stadler Mag. Vas. Karb. Pusztaszabolcs (HU) 100 100 Stadler Algérie Eurl Algiers (DZ) 100 100 Stadler Service Italy GmbH Meran (IT) 100 100 ÖBB Stadler Service GmbH Vienna (AT) 40 40 Stadler Service Netherlands B.V. Twello (NL) 100 100 Stadler Service Sweden AB Stockholm (SE) 100 100 Stadler Rail Service UK Ltd. Birkenhead (GB) 100 100 Stadler Service Polska Sp. z o.o. Warsaw (PL) 100 100 Erion France S.A.S. Arc les Gray (FR) 51 51 Erion Mantenimiento Ferroviaro S.A. Madrid (ES) 51 51 Stadler Chemnitz GmbH Chemnitz (DE) 100 100 OOO Stadler Moscow (RU) 90 90 Stadler Service Norway AS Oslo (NO) 100 100 Stadler MR Sweden AB Tillberga (SE) 100 - Stadler Service Denmark Aps Aarhus (DK) 100 -
Share of capital and voting rights in %

Stadler – Financial Report 2018 – Financial Statements Stadler Rail AG
48
2.3 Share capital
Share capital in the amount of CHF 20,000k consists of 100,000,000 registered shares at a par value of CHF 0.20 each (pre-vious year: 2,000,000 registered shares at a par value of CHF 10.00 each).
2.4 Treasury shares
2.5 Dividends received
In the reporting year, the dividend income amounted to CHF 72,209k (previous year: CHF 93,997k). It includes the dividends paid by Stadler Bussnang AG, Stadler Altenrhein AG, Stadler Service AG, Stadler Winterthur AG, Stadler Polska Sp. z o.o and Stadler Pankow GmbH.
2.6 Other financial income
Other financial income stands at CHF 4,594k (previous year: CHF 941k) and consists of interest income on loans to group companies (CHF 66k) and third parties (CHF 20k), currency gains (CHF 3,438k) as well as proceeds from securities (CHF 1,070k).
2.7 Other operating income
2.8 Financial expenses
Number (pcs.) Par value (CHF)
Average transaction
price (CHF)
Carrying
amount (CHF)
Stock at 1.1.2017 56’403 10.00 425.92 24’023’233 Sales to third parties (40’000) 10.00 1’136.00 (45’440’000) Sales to employees and directors (500) 10.00 292.00 (146’000) Purchases from employees 454 10.00 315.48 143’227 Allocations under employee share plan – bonus (share-based payments) (8’031) 10.00 292.00 (2’345’052) Adjustment to average price 27’855’450
Stock at 31.12.2017 8’326 10.00 491.34 4’090’858
Stock at 1.1.2018 8’326 10.00 491.34 4’090’858 Sales to employees and directors (200) 10.00 325.00 (65’000) Purchases from employees 275 10.00 325.00 89’375 Allocations under employee share plan – bonus (share-based payments) from previous year
(72) 10.00 292.00 (21’024)
Allocations under employee share plan – bonus (share-based payments) (7’844) 10.00 325.00 (2’549’300) Stock at 15.6.2018 before share split (1:50) 485 10.00
Stock at 15.6.2018 after share split (1:50) 24’250 0.20
Purchases from employees 136’000 0.20 7.92 1’077’120 Purchases from third parties 70’000 0.20 12.00 840’000 Adjustment to average price (1’274’566)
Stock at 31.12.2018 230’250 0.20 9.50 2’187’463
in CHF 2018 2017
Income from services 12’272’000 11’684’000 Income from royalties 10’486’792 14’597’235
Total other operating income 22’758’792 26’281’235
in CHF 2018 2017
Bank interest and fees - 718 Interest on investments 478’129 446’069 Foreign exchange losses 1’853’904 4’349’624
Total financial expenses 2’332’033 4’796’411

Stadler – Financial Report 2018 – Financial Statements Stadler Rail AG
49
2.9 Other operating expenses
3. Other information
Declaration of the average number of full-time employees during the year
The average number of full-time equivalents for the current as well as the prior year was over ten but less than 50.
Collateral provided for third-party liabilities
The collateral provided by the company amounts to CHF 5,086 million (previous year: CHF 4,476 million). These are sure-ties, letters of comfort and guarantees issued in favour of customers, suppliers and financial institutions.
Significant events after the reporting date
No events occurred after the reporting date that could have a significant impact on the 2018 financial statements.
in CHF 2018 2017
Administrative expenses 1’067’748 1’080’705 Consulting expenses 404’585 1’682’651 Other operating expenses 2’672’779 1’264’881
Total other operating expenses 4’145’112 4’028’237

Stadler – Financial Report 2018 – Financial Statements Stadler Rail AG
50
Appropriation of profit proposed to the Annual General Meeting
The English version of the financial statements is a translation of the original in German for information purposes only. In case of a discrepancy, the German original will prevail.
in CHF 31.12.2018
For disposition by the General Meeting
Results carried forward 138’035’922 Profit for the year 61’129’043
Accumulated profits 199’164’965
./. Treasury shares (2’187’463)
Total available earnings 196’977’502
in CHF 31.12.2018
Proposal of the Board of Directors
Distribution of a dividend of 350% of the share capital of CHF 20,000,000
70’000’000
To be carried forward 129’164’965
Total proposed appropriation by the Board of Directors 199’164’965
./. Treasury shares (2’187’463)
196’977’502

Stadler – Financial Report 2018 – Financial Statements Stadler Rail AG
51
Report of the Statutory to the General Meeting of Shareholders of Stadler Rail AG, Bussnang
Report of the Statutory Auditor on the Financial Statements As statutory auditor, we have audited the accompanying financial statements of Stadler Rail AG, Bussnang presented on the pages 44 to 50, which comprise the balance sheet, income statement and notes for the year ended 31 December 2018. Board of Directors’ Responsibility The board of directors is responsible for the preparation of the financial statements in accordance with the requirements of Swiss law and the company’s articles of incorporation. This responsibility includes designing, implementing and maintaining an internal control system relevant to the prep-aration of financial statements that are free from material misstatement, whether due to fraud or error. The board of directors is further responsible for selecting and applying appropriate account-ing policies and making accounting estimates that are reasonable in the circumstances. Auditor’s Responsibility Our responsibility is to express an opinion on these financial statements based on our audit. We conducted our audit in accordance with Swiss law and Swiss Auditing Standards. Those stand-ards require that we plan and perform the audit to obtain reasonable assurance whether the fi-nancial statements are free from material misstatement. An audit involves performing procedures to obtain audit evidence about the amounts and disclo-sures in the financial statements. The procedures selected depend on the auditor’s judgment, including the assessment of the risks of material misstatement of the financial statements, whether due to fraud or error. In making those risk assessments, the auditor considers the internal control system relevant to the entity’s preparation of the financial statements in order to design audit procedures that are appropriate in the circumstances, but not for the purpose of expressing an opinion on the effectiveness of the entity’s internal control system. An audit also includes eval-uating the appropriateness of the accounting policies used and the reasonableness of accounting estimates made, as well as evaluating the overall presentation of the financial statements. We believe that the audit evidence we have obtained is sufficient and appropriate to provide a basis for our audit opinion. Opinion In our opinion, the financial statements for the year ended 31 December 2018 comply with Swiss law and the company’s articles of incorporation.

Stadler – Financial Report 2018 – Financial Statements Stadler Rail AG
KPMG AG, Badenerstrasse 172, Postfach, CH-8036 Zürich
KPMG AG ist eine Tochtergesellschaft der KPMG Holding AG. KPMG Holding AG ist Mitglied des KPMG Netzwerks unabhängiger Mitgliedsfirmen, der KPMG Internatio-
nal Cooperative (“KPMG International”), einer juristischen Person schweizerischen Rechts. Alle Rechte vorbehalten.
52
Report on Other Legal Requirements We confirm that we meet the legal requirements on licensing according to the Auditor Oversight Act (AOA) and independence (article 728 CO) and that there are no circumstances incompatible with our independence. In accordance with article 728a paragraph 1 item 3 CO and Swiss Auditing Standard 890, we confirm that an internal control system exists, which has been designed for the preparation of financial statements according to the instructions of the board of directors. We further confirm that the proposed appropriation of available earnings complies with Swiss law and the company’s articles of incorporation. We recommend that the financial statements submit-ted to you be approved. KPMG AG Kurt Stocker Simon Niklaus Licensed Audit Expert Licensed Audit Expert Auditor in Charge Zurich, 25 February 2019


