1 23 Quality & Quantity International Journal of Methodology ISSN 0033-5177 Volume 47 Number 1 Qual Quant (2013) 47:465-483 DOI 10.1007/s11135-011-9530-1 Quality improvement and redesign of performance measurement systems: an application to the academic field Fiorenzo Franceschini & Elisa Turina
Transcript
1 23
Quality & QuantityInternational Journal of Methodology ISSN 0033-5177Volume 47Number 1 Qual Quant (2013) 47:465-483DOI 10.1007/s11135-011-9530-1
Quality improvement and redesign ofperformance measurement systems: anapplication to the academic field
Fiorenzo Franceschini & Elisa Turina
1 23
Your article is protected by copyright and
all rights are held exclusively by Springer
Science+Business Media B.V.. This e-offprint
is for personal use only and shall not be self-
archived in electronic repositories. If you
wish to self-archive your work, please use the
accepted author’s version for posting to your
own website or your institution’s repository.
You may further deposit the accepted author’s
version on a funder’s repository at a funder’s
request, provided it is not made publicly
available until 12 months after publication.
Qual Quant (2013) 47:465–483DOI 10.1007/s11135-011-9530-1
Quality improvement and redesign of performancemeasurement systems: an application to the academicfield
Abstract The increasing competition both in the public and private sectors gave rise toa growing interest in quality improvement and in designing and implementing PerformanceMeasurement Systems (PMS). Academic organizations also recognized the need for imple-menting performance measurement systems. Some recent works on PMS in the higher edu-cation make use of the Kaplan and Norton’s Balanced Scorecard (BSC) to translate thecharacteristic strategic goals (e.g. research and teaching excellence) into performance mea-sures. However, a PMS needs to be updated when external or internal changes influence theorganization modus operandi. In this way a continuous quality improvement of organizationperformance is required. This paper describes a methodology based on the BSC model toredesign a current PMS. In detail, a reference BSC-check matrix is proposed. A “mappinganalysis” of the current PMS is developed to understand if all the operational aspects involvedin goals achievement are considered and if proper indicators have been defined. As an exam-ple, the methodology is applied to a Department of the authors’ own University. The papershows also how the proposed approach can be extended to other contexts.
Increasing competition both in the public and private sectors raises the interest in measuringperformance to better allocate resources (Jordan and Mortensen 1997; Juhl and Christensen2008). Many organizations concentrated their efforts on designing and implementing ade-quate Performance Measurement Systems (PMS) to manage and improve their Quality per-formance.
F. Franceschini (B) · E. TurinaPolitecnico di Torino, DISPEA, Corso Duca degli Abruzzi 24, 10129 Torino, Italye-mail: [email protected]
123
Author's personal copy
466 F. Franceschini, E. Turina
Sectors as scientific research and higher education have also been involved in thisphenomenon. In the U.S. 90s laws and executive orders established the need for systematicdevelopment and application of performance information to continuously improve researchprograms. In detail, the programs were requested to demonstrate the relevance and valueadded to national social and economic needs (Jordan and Mortensen 1997). Another exampleis that of Canadian Federal Government which institutionalized a Performance FrameworkApproach for Science and Technology organizations (Teather and Montague 1997). Targetclients, key co-delivery partners and stakeholders as well as the mechanism through whichactivities and outputs are transformed into results are considered. In the same context, greatattention received also the evaluation of multi-departmental programs (Montague and Teather2007).
The dominant idea of higher education as a social institution has also changed. NowUniversities are perceived as a specific sector of the economy. Their purpose is to educatesome of the workforce, advance economic development and perform research (Juhl andChristensen 2008).
This transformation started 25 years ago in U.S. (Gumport 2000) and now is a globaltendency which influence the way universities are organized and managed. As an example,Karathanos and Karathanos (2005) analyze the Baldrige Award Criteria in the context ofeducation and Yu et al. (2009) cite the application of performance measurement systems inthe University of Edinburgh, University of Southern California, Ohio State University andUniversity of Akron.
Recently also in Italy and other European countries were defined national models forresearch evaluation (CIVR 2010; RAE 2010; AERES 2010). In some cases, Universities andresearch centres developed proprietary ad-hoc PMS (Tutuncu and Kucukusta 2010; Cocciaand Rolfo 2002).
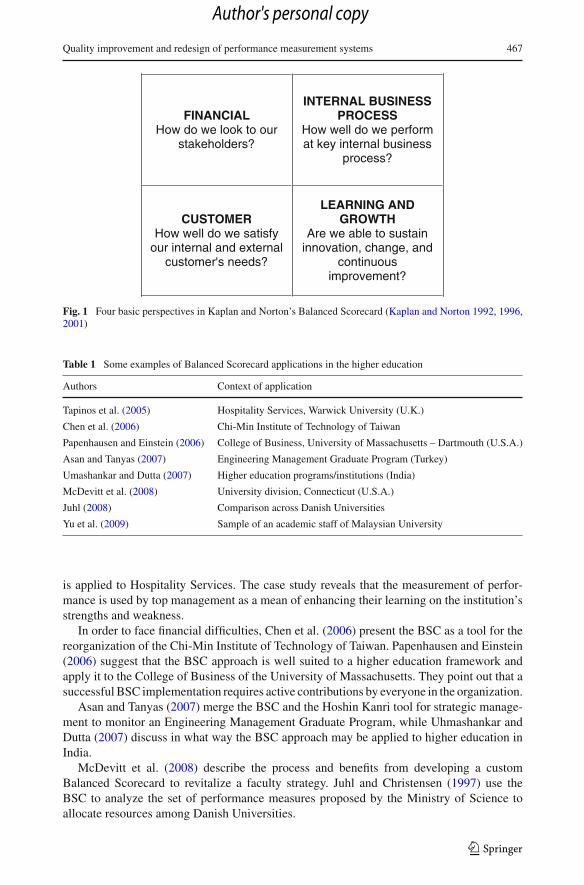
Overall, a model often used by organizations to identify performance measures is theKaplan and Norton’s Balanced scorecard (Kaplan and Norton 1992, 1996, 2001). The authorsintroduced the balancing concept with the aim to overcome the shortcomings of traditionalPMSs which rely only on financial outcomes. Balanced scorecard consider four perspectives(see Fig. 1):
(1) Financial: it is relative to the organization financial aspects.(2) Customer: it considers what an organization has to do for its customers in order to ensure
financial success.(3) Internal business process: it concerns which processes most influence customer satis-
faction.(4) Learning and growth: it concerns what improvements can be made to ensure sound
business processes and satisfied customers.
The strategic objectives of an organization are translated into performance measures on thebasis of these four perspectives. This ensures a balance between the perspectives and theirindicators as well as between short and long term objectives, leading and lagging indicators,financial and not financial measures.
One of the first applications of the BSC for evaluating research programs was that ofJordan and Mortensen (1997). In their work the authors described the performance manage-ment approach developed in collaboration with the U.S. Department of Energy (DOE).
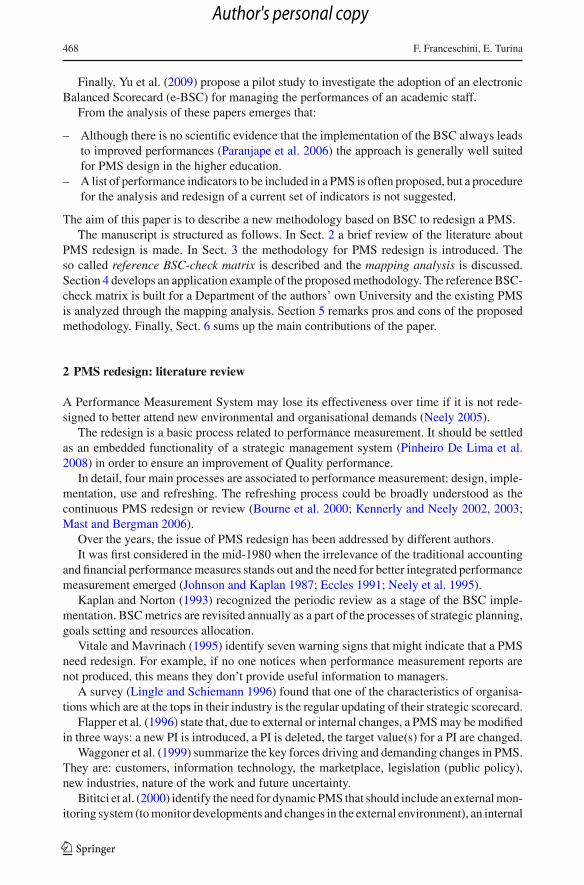
Some of the most recent papers on performance measurement based on the BSC modelin the higher education are reported in Table 1.
Tapinos et al. (2005) discussing the alignment between an organization strategy and per-formance measurement, report the example of the Warwick University (UK), where the BSC
123
Author's personal copy
Quality improvement and redesign of performance measurement systems 467
FINANCIALHow do we look to our
stakeholders?
INTERNAL BUSINESS PROCESS
How well do we perform at key internal business
process?
CUSTOMERHow well do we satisfy
our internal and external customer's needs?
LEARNING AND GROWTH
Are we able to sustain innovation, change, and
continuous improvement?
Fig. 1 Four basic perspectives in Kaplan and Norton’s Balanced Scorecard (Kaplan and Norton 1992, 1996,2001)
Table 1 Some examples of Balanced Scorecard applications in the higher education
Authors Context of application
Tapinos et al. (2005) Hospitality Services, Warwick University (U.K.)
Chen et al. (2006) Chi-Min Institute of Technology of Taiwan
Papenhausen and Einstein (2006) College of Business, University of Massachusetts – Dartmouth (U.S.A.)
Asan and Tanyas (2007) Engineering Management Graduate Program (Turkey)
Umashankar and Dutta (2007) Higher education programs/institutions (India)
McDevitt et al. (2008) University division, Connecticut (U.S.A.)
Juhl (2008) Comparison across Danish Universities
Yu et al. (2009) Sample of an academic staff of Malaysian University
is applied to Hospitality Services. The case study reveals that the measurement of perfor-mance is used by top management as a mean of enhancing their learning on the institution’sstrengths and weakness.
In order to face financial difficulties, Chen et al. (2006) present the BSC as a tool for thereorganization of the Chi-Min Institute of Technology of Taiwan. Papenhausen and Einstein(2006) suggest that the BSC approach is well suited to a higher education framework andapply it to the College of Business of the University of Massachusetts. They point out that asuccessful BSC implementation requires active contributions by everyone in the organization.
Asan and Tanyas (2007) merge the BSC and the Hoshin Kanri tool for strategic manage-ment to monitor an Engineering Management Graduate Program, while Uhmashankar andDutta (2007) discuss in what way the BSC approach may be applied to higher education inIndia.
McDevitt et al. (2008) describe the process and benefits from developing a customBalanced Scorecard to revitalize a faculty strategy. Juhl and Christensen (1997) use theBSC to analyze the set of performance measures proposed by the Ministry of Science toallocate resources among Danish Universities.
123
Author's personal copy
468 F. Franceschini, E. Turina
Finally, Yu et al. (2009) propose a pilot study to investigate the adoption of an electronicBalanced Scorecard (e-BSC) for managing the performances of an academic staff.
From the analysis of these papers emerges that:
– Although there is no scientific evidence that the implementation of the BSC always leadsto improved performances (Paranjape et al. 2006) the approach is generally well suitedfor PMS design in the higher education.
– A list of performance indicators to be included in a PMS is often proposed, but a procedurefor the analysis and redesign of a current set of indicators is not suggested.
The aim of this paper is to describe a new methodology based on BSC to redesign a PMS.The manuscript is structured as follows. In Sect. 2 a brief review of the literature about
PMS redesign is made. In Sect. 3 the methodology for PMS redesign is introduced. Theso called reference BSC-check matrix is described and the mapping analysis is discussed.Section 4 develops an application example of the proposed methodology. The reference BSC-check matrix is built for a Department of the authors’ own University and the existing PMSis analyzed through the mapping analysis. Section 5 remarks pros and cons of the proposedmethodology. Finally, Sect. 6 sums up the main contributions of the paper.
2 PMS redesign: literature review
A Performance Measurement System may lose its effectiveness over time if it is not rede-signed to better attend new environmental and organisational demands (Neely 2005).
The redesign is a basic process related to performance measurement. It should be settledas an embedded functionality of a strategic management system (Pinheiro De Lima et al.2008) in order to ensure an improvement of Quality performance.
In detail, four main processes are associated to performance measurement: design, imple-mentation, use and refreshing. The refreshing process could be broadly understood as thecontinuous PMS redesign or review (Bourne et al. 2000; Kennerly and Neely 2002, 2003;Mast and Bergman 2006).
Over the years, the issue of PMS redesign has been addressed by different authors.It was first considered in the mid-1980 when the irrelevance of the traditional accounting
and financial performance measures stands out and the need for better integrated performancemeasurement emerged (Johnson and Kaplan 1987; Eccles 1991; Neely et al. 1995).
Kaplan and Norton (1993) recognized the periodic review as a stage of the BSC imple-mentation. BSC metrics are revisited annually as a part of the processes of strategic planning,goals setting and resources allocation.
Vitale and Mavrinach (1995) identify seven warning signs that might indicate that a PMSneed redesign. For example, if no one notices when performance measurement reports arenot produced, this means they don’t provide useful information to managers.
A survey (Lingle and Schiemann 1996) found that one of the characteristics of organisa-tions which are at the tops in their industry is the regular updating of their strategic scorecard.
Flapper et al. (1996) state that, due to external or internal changes, a PMS may be modifiedin three ways: a new PI is introduced, a PI is deleted, the target value(s) for a PI are changed.
Waggoner et al. (1999) summarize the key forces driving and demanding changes in PMS.They are: customers, information technology, the marketplace, legislation (public policy),new industries, nature of the work and future uncertainty.
Bititci et al. (2000) identify the need for dynamic PMS that should include an external mon-itoring system (to monitor developments and changes in the external environment), an internal
123
Author's personal copy
Quality improvement and redesign of performance measurement systems 469
monitoring system (to monitor developments and changes in the internal environment) anda review system which use the internal and external monitors to redesign internal objectivesand priorities.
Bourne et al. (2000), considering the updating process of PMSs in different companies,highlight two different aspects. First, performance measures evolve since the managementteam reflects on their use. Second, targets, measurements and the set of measurementschanged as a result of the review process.
Kennerly and Neely (2003) state that measurement systems have to be modified as currentenvironment and strategies change. There should be a continuous evolutionary circle of aPMS which follows three phases: reflection (on the existing PMS to identify where it is nolonger appropriate and where enhancements need to be made), modification (to ensure align-ment to new circumstances) and deployment (to manage the new organization performance).Moreover, the authors recognized external and internal drivers to change (e.g. actual per-formance, dysfunctional behaviour) and barriers to change (e.g. corporate culture, internalcapabilities, technology) (Paranjape et al. 2006). The presence of barriers to redesign a PMSin SMEs (Small and Medium Enterprises) is also discussed by Hudson et al. (2001).
Nowadays the problem of PMS redesign is still open. Basing on an extensive literaturereview, Gomes et al. (2004) claim that many manufacturing companies are attempting toredesign their PMS in order to make them more practical, realistic and integrated.
Neely, proposing a research agenda in the field of performance measurement for the nextyears, includes as a main issue how to develop dynamic rather than static PMS (Neely 2005).
A survey from a sample of manufacturing firms (Henri 2009) suggests that even though thecurrent business environment is characterized by fast changes, manufacturing organizationsdo not appear to revise their PMS to a great extent.
Pinheiro et al (2009). also recognize that the enterprises’ operations systems and environ-ments are characterized by an high degree of complexity and dynamics. This is challengingthe strategic operations management models which need a redesign.
From the analysis of the previous papers, it may be observed that there are many fac-tors enabling or contrasting PMS review as well as warning signals that suggest the needfor redesign. However, a structured procedure to deploy the redesign of a PMS is still notproposed.
In this paper we present a methodology for PMS redesign. This activity concerns thecheck of the consistency of the conceptual model underlying performance measures and theanalysis of the appropriateness of the overall sets of performance indicators.
3 The reference BSC-check matrix and the mapping analysis
A performance measurement system provides data to be collected, analyzed, reported andultimately used to make sound decisions. The strategic plan of an organization is the basicelement to be considered in establishing a PMS.
We remind that building a PMS aims at operationalizing organizational goals. Performanceindicators are tools to operationalize such goals (Franceschini et al. 2006, 2007). However,due to the business environment changing, new strategic goals may be defined over time.
As an example, suppose that the new strategic goals of an academic institution are set outas follows (Papenhausen and Einstein 2006):
– offering high quality graduate and undergraduate programs;– conducting valuable basic, applied and pedagogical research;– supporting regional economic health and development.
123
Author's personal copy
470 F. Franceschini, E. Turina
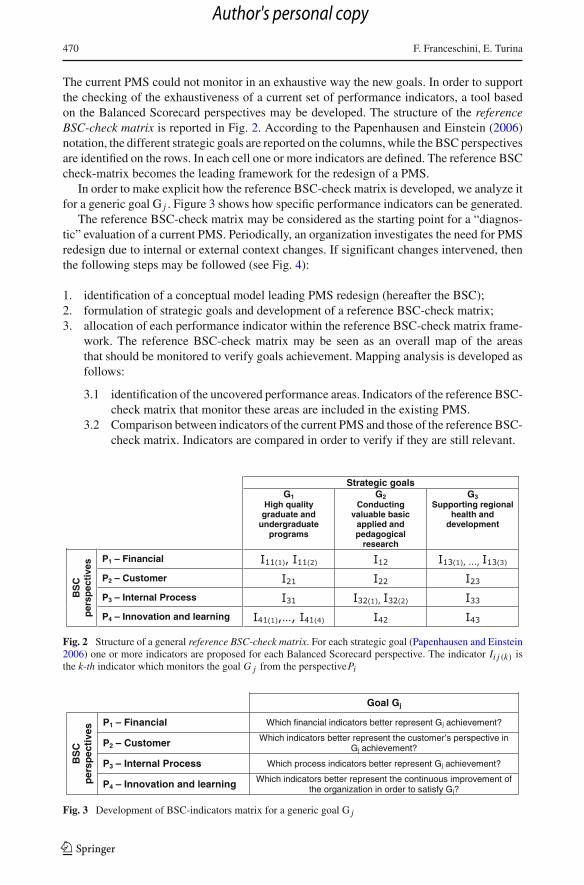
The current PMS could not monitor in an exhaustive way the new goals. In order to supportthe checking of the exhaustiveness of a current set of performance indicators, a tool basedon the Balanced Scorecard perspectives may be developed. The structure of the referenceBSC-check matrix is reported in Fig. 2. According to the Papenhausen and Einstein (2006)notation, the different strategic goals are reported on the columns, while the BSC perspectivesare identified on the rows. In each cell one or more indicators are defined. The reference BSCcheck-matrix becomes the leading framework for the redesign of a PMS.
In order to make explicit how the reference BSC-check matrix is developed, we analyze itfor a generic goal G j . Figure 3 shows how specific performance indicators can be generated.
The reference BSC-check matrix may be considered as the starting point for a “diagnos-tic” evaluation of a current PMS. Periodically, an organization investigates the need for PMSredesign due to internal or external context changes. If significant changes intervened, thenthe following steps may be followed (see Fig. 4):
1. identification of a conceptual model leading PMS redesign (hereafter the BSC);2. formulation of strategic goals and development of a reference BSC-check matrix;3. allocation of each performance indicator within the reference BSC-check matrix frame-
work. The reference BSC-check matrix may be seen as an overall map of the areasthat should be monitored to verify goals achievement. Mapping analysis is developed asfollows:
3.1 identification of the uncovered performance areas. Indicators of the reference BSC-check matrix that monitor these areas are included in the existing PMS.
3.2 Comparison between indicators of the current PMS and those of the reference BSC-check matrix. Indicators are compared in order to verify if they are still relevant.
Strategic goalsG1
High quality graduate and
undergraduate programs
G2Conducting
valuable basic applied and pedagogical
research
G3Supporting regional
health and development
BS
C
per
spec
tive
s P1 – Financial
P2 – Customer
P3 – Internal Process
P4 – Innovation and learning
Fig. 2 Structure of a general reference BSC-check matrix. For each strategic goal (Papenhausen and Einstein2006) one or more indicators are proposed for each Balanced Scorecard perspective. The indicator Ii j (k) isthe k-th indicator which monitors the goal G j from the perspectivePi
Goal Gj
BS
C
per
spec
tive
s P1 – Financial Which financial indicators better represent Gj achievement?
P2 – Customer Which indicators better represent the customer’s perspective in Gj achievement?
P3 – Internal Process Which process indicators better represent Gj achievement?
P4 – Innovation and learning Which indicators better represent the continuous improvement of the organization in order to satisfy Gj?
Fig. 3 Development of BSC-indicators matrix for a generic goal G j
123
Author's personal copy
Quality improvement and redesign of performance measurement systems 471
Fig. 4 Methodology for a PMSredesign. The BSC is consideredas the conceptual model leadingredesign. Once the strategic goalshave been identified, thereference BSC-check matrix isbuilt. Then the mapping analysisis carried out. The indicators ofthe current PMS are allocatedwithin the reference BSC-checkmatrix framework and the areaswhich are not covered areidentified. Finally, indicatorsreferred to common areas arecompared to check if indicatorsare still relevant
No
First PMS design
Current PMS
Redesign is needed?
Identification of the conceptual model leading the redesign
(e.g. BSC)
Allocation of the indicators of the actual PMS in the
reference BSC-check matrix framework
Check of indicators relevance
Introduce new indicators?
Coverage check
Uncovered areas?
Reference BSC-check matrixdevelopment
Yes
YesYes
Rep
lace
old
indi
cato
rs w
ith n
ew o
nes
Add
cov
erin
g in
dica
tors
Cur
rent
PM
S
is s
till e
ffect
ive
The outcome of this analysis are respectively:
– the performance areas that are not covered by the current PMS;– new indicators covering the various performance areas.
In the following Sections an application example concerning reference BSC-check matrixbuilding and its employment for mapping analysis is reported. The redesign of the currentPMS of the authors’ Academic Department is considered.
4 Application example
4.1 The current PMS
Before delving into the description of the current PMS, the organizational structure of theconsidered University is described.
Synthetically speaking, the University is organized in Faculties and Departments, whichare not hierarchically dependent (see Fig. 5).
123
Author's personal copy
472 F. Franceschini, E. Turina
Res
earc
h pr
ogra
m 1
Res
earc
h pr
ogra
m 2
ProfessorsResearchers
Researchmanagement
Department Y
FACULTY A
FACULTY B
Teaching offer management
Course 1
Course 2
Fig. 5 Scheme of the organizational structure of the authors’ own University. Departments manage researchactivities and Faculties provide the teaching offer
Table 2 Strategic goals for a generic Department of the Authors’ own University
G 1 Goal 1 Research excellence Excellence in scientificperformance and internationalacknowledgment of thedeveloped research programs
G 2 Goal 2 Teaching Fulfilment of Faculties require-ments
G 3 Goal 3 Resource management and funding Efficient management of humanand material resources
Fund-raising
Faculties main functions are (Politecnico di Torino 2010a,b):
– annual review of course contents;– management of the assigned economic resources in order to organize academic programs;– coordination and monitoring of the teaching offer;– tenure assignment for new researchers and professors;– conferment of graduations.
On the contrary, Departments main activities are respectively (Politecnico di Torino 2010a,b):
– promotion and coordination of research activities;– according to Faculties requirements, assignment of teaching duties to the academic staff;– recruitment of academic staff;– fund-raising for research activities.
Table 2 shows a structured list of strategic goals for a generic Department.The current University Performance Measurement System is used to evaluate the results
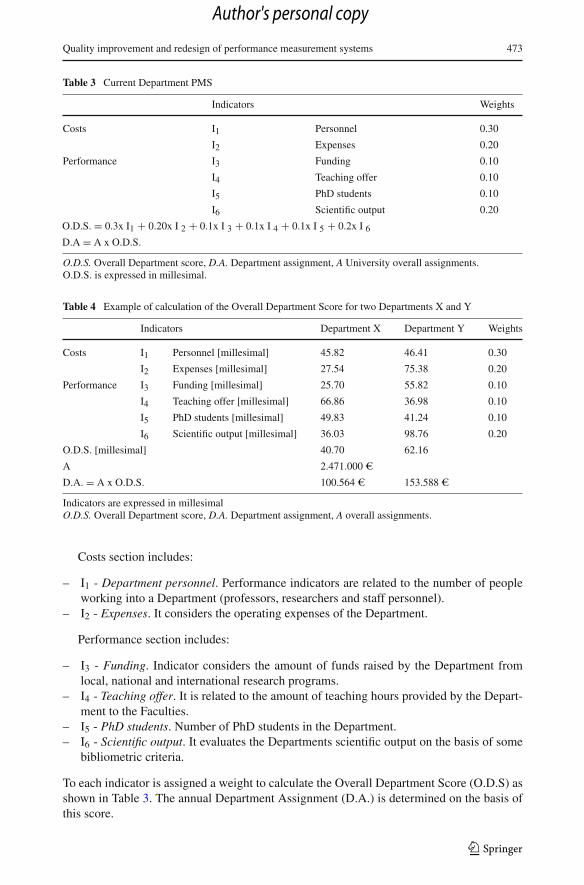
achieved by each Department and to allocate new human and economic resources. EachDepartment is assessed considering an overall score which is determined by a set of indica-tors. The higher this score, the larger the amount of human and economic resources assigned tothe Department. Indicators are calculated every academic year. The current PMS is organizedinto two main parts as reported in Table 3.
123
Author's personal copy
Quality improvement and redesign of performance measurement systems 473
Table 3 Current Department PMS
Indicators Weights
Costs I1 Personnel 0.30
I2 Expenses 0.20
Performance I3 Funding 0.10
I4 Teaching offer 0.10
I5 PhD students 0.10
I6 Scientific output 0.20
O.D.S. = 0.3x I1 + 0.20x I 2 + 0.1x I 3 + 0.1x I 4 + 0.1x I 5 + 0.2x I 6
D.A = A x O.D.S.
O.D.S. Overall Department score, D.A. Department assignment, A University overall assignments.O.D.S. is expressed in millesimal.
Table 4 Example of calculation of the Overall Department Score for two Departments X and Y
A 2.471.000 eD.A. = A x O.D.S. 100.564 e 153.588 e
Indicators are expressed in millesimalO.D.S. Overall Department score, D.A. Department assignment, A overall assignments.
Costs section includes:
– I1 - Department personnel. Performance indicators are related to the number of peopleworking into a Department (professors, researchers and staff personnel).
– I2 - Expenses. It considers the operating expenses of the Department.
Performance section includes:
– I3 - Funding. Indicator considers the amount of funds raised by the Department fromlocal, national and international research programs.
– I4 - Teaching offer. It is related to the amount of teaching hours provided by the Depart-ment to the Faculties.
– I5 - PhD students. Number of PhD students in the Department.– I6 - Scientific output. It evaluates the Departments scientific output on the basis of some
bibliometric criteria.
To each indicator is assigned a weight to calculate the Overall Department Score (O.D.S) asshown in Table 3. The annual Department Assignment (D.A.) is determined on the basis ofthis score.
123
Author's personal copy
474 F. Franceschini, E. Turina
Indicators for each Department are expressed in millesimal. This value is obtained com-paring the Department performance to the overall University results. An example is reportedin Table 4. Two departments and their results are considered. Department X presents the45.82 0/00 of the total University human resources (I1). The Overall Department Score iscalculated as described in Table 3. Since the O.D.S. of Department Y is higher then that ofDepartment X, its economic assignment will be greater.
4.2 Development of the reference BSC-check matrix
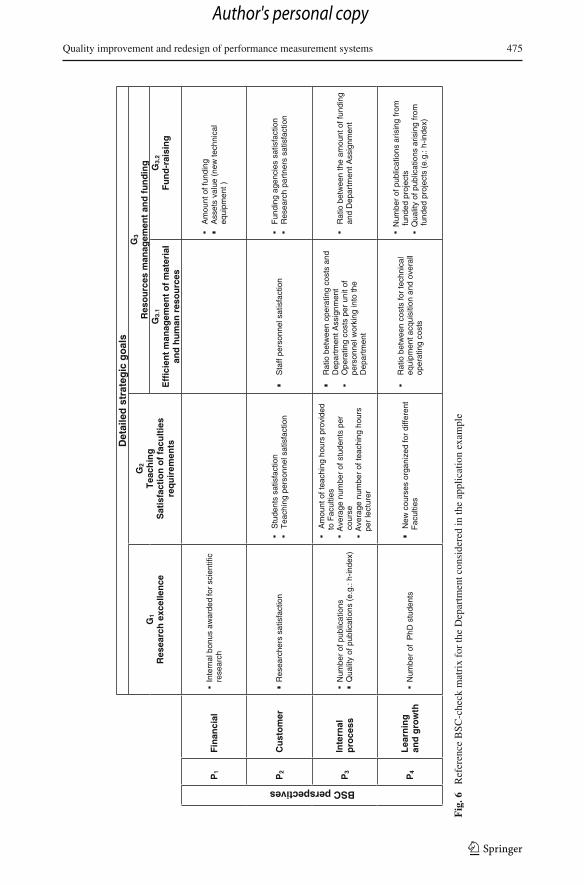
As a starting point, we construct a reference BSC-check matrix to monitor Department per-formance. Each strategic goal (G1, G2, G3) is monitored by one ore more indicators for eachBSC perspective (see Fig. 6).
BSC perspectives are personalized to the specific academic context as follows:
– Financial: In general, this dimension considers the main incomes such as fees from stu-dents and funding from research programs of local, national and international interest aswell as from collaborations with industry (Chen et al. 2006; Papenhausen and Einstein2006). In this specific example, fees from students are not managed by Departments.They are handled by the University Central Administration.
– Customer: In literature one distinguishes between internal customers (teachers, adminis-trators and students) and external customers (business, government, families, . . .) (Chenet al. 2006). In this paper we consider: public and private partners in research programs,funding agencies, research and teaching personnel and staff personnel.
– Internal process: It considers efficiency and efficacy of the most critical internal pro-cess that drive stakeholders satisfaction (Jordan and Mortensen 1997; Papenhausen andEinstein 2006).
– Learning and growth: it analyses the learning and growth opportunities for all the stake-holders (Jordan and Mortensen 1997; Chen et al. 2006; Papenhausen and Einstein 2006;Asan and Tanyas 2007).
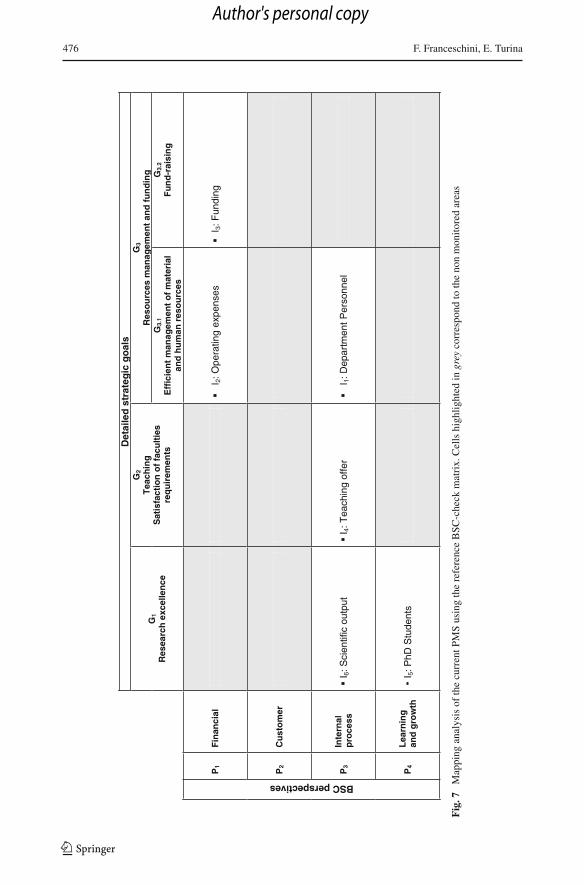
4.3 Mapping analysis
The first step of the mapping analysis entails the identification of uncovered areas in thecurrent PMS (see Fig. 4). Figure 7 shows how indicators are allocated within the BSC-checkmatrix framework. The presence of unfilled cells suggests that some goals are not monitoredby all the BSC perspectives.
A second step of the mapping analysis consists of comparing indicators monitoring thesame performance areas. The main aim is to verify if indicators of the current PMS are stillrelevant to monitor the system (see Fig. 4).
Different criteria to analyze the relevance of performance measures are proposed in liter-ature such as the SMART test (University Of California, Laboratory Administration Office2010), the Three Criteria test (Performance-Based Management Special Interest Group 2001),The Treasury Department Criteria test (U.S. Department of the Treasury 1994). According tothese tests indicators should satisfy a set of properties in order to represent a system properly(Kennerly and Neely 2003; Franceschini et al. 2006, 2007; Caplice and Sheffi 1994). Table 5reports a taxonomy of indicators properties.
In detail, properties are classified as general properties, properties of derived indicators (i.e.obtained combining the information of one or more sub-indicators) and properties referredto sets of indicators. They should be all considered in the mapping analysis. For example,exhaustiveness is checked in the coverage analysis, and so on.
123
Author's personal copy
Quality improvement and redesign of performance measurement systems 475
Det
aile
dst
rate
gic
go
als
G1
Res
earc
hex
celle
nce
G2
Tea
chin
gS
atis
fact
ion
of
facu
ltie
s re
qu
irem
ents
G3
Res
ou
rces
man
agem
ent
and
fu
nd
ing
G3.
1
Eff
icie
nt
man
agem
ent
of
mat
eria
l an
d h
um
an r
eso
urc
es
G3.
2
Fu
nd
-rai
sin
g
BSC perspectives
P1
Fin
anci
alIn
tern
al b
onus
aw
arde
d fo
r sc
ient
ific
rese
arch
Am
ount
of fu
ndin
gA
sset
s va
lue
(new
tech
nica
l eq
uipm
ent )
P2
Cu
sto
mer
Res
earc
hers
satis
fact
ion
Stu
dent
s sa
tisfa
ctio
n T
each
ing
pers
onne
l sat
isfa
ctio
nS
taff
pers
onne
l sat
isfa
ctio
nF
undi
ng a
genc
ies
satis
fact
ion
Res
earc
h pa
rtne
rs s
atis
fact
ion
P3
Inte
rnal
p
roce
ssN
umbe
r of
pub
licat
ions
Qua
lity
of p
ublic
atio
ns(e
.g.:
h-in
dex)
Am
ount
of t
each
ing
hour
s pr
ovid
ed
to F
acul
ties
Ave
rage
num
ber
of s
tude
nts
per
cour
seA
vera
ge n
umbe
r of
teac
hing
hou
rs
per
lect
urer
Rat
io b
etw
een
oper
atin
g co
sts
and
Dep
artm
ent A
ssig
nmen
t O
pera
ting
cost
s pe
r un
it of
pe
rson
nel w
orki
ng in
to th
e D
epar
tmen
t
Rat
io b
etw
een
the
amou
nt o
f fun
ding
an
d D
epar
tmen
t Ass
ignm
ent
P4
Lea
rnin
g
and
gro
wth
Num
ber
of P
hD s
tude
nts
New
cou
rses
org
aniz
ed fo
r di
ffere
nt
Fac
ultie
s
Rat
io b
etw
een
cost
s fo
r te
chni
cal
equi
pmen
t acq
uisi
tion
and
over
all
oper
atin
g co
sts
Num
ber
of p
ublic
atio
ns a
risin
g fr
omfu
nded
pro
ject
sQ
ualit
y of
pub
licat
ions
aris
ing
from
fu
nded
pro
ject
s(e
.g.:
h-in
dex)
Fig
.6R
efer
ence
BSC
-che
ckm
atri
xfo
rth
eD
epar
tmen
tcon
side
red
inth
eap
plic
atio
nex
ampl
e
123
Author's personal copy
476 F. Franceschini, E. Turina
Det
aile
d s
trat
egic
go
als
G1
Res
earc
hex
celle
nce
G2
Tea
chin
gS
atis
fact
ion
of
facu
ltie
s re
qu
irem
ents
G3
Res
ou
rces
man
agem
ent
and
fu
nd
ing
G3.
1
Eff
icie
nt
man
agem
ent
of
mat
eria
l an
d h
um
an r
eso
urc
es
G3.
2
Fu
nd
-rai
sin
g
BSC perspectives
P1
Fin
anci
alI 2
: Ope
ratin
g ex
pens
esI 3
: Fun
ding
P2
Cu
sto
mer
P3
Inte
rnal
p
roce
ssI 6
: Sci
entif
ic o
utpu
tI 4
: Tea
chin
g of
fer
I 1: D
epar
tmen
t P
erso
nnel
P4
Lea
rnin
g
and
gro
wth
I 5: P
hD S
tude
nts
Fig
.7M
appi
ngan
alys
isof
the
curr
entP
MS
usin
gth
ere
fere
nce
BSC
-che
ckm
atri
x.C
ells
high
light
edin
grey
corr
espo
ndto
the
non
mon
itore
dar
eas
123
Author's personal copy
Quality improvement and redesign of performance measurement systems 477
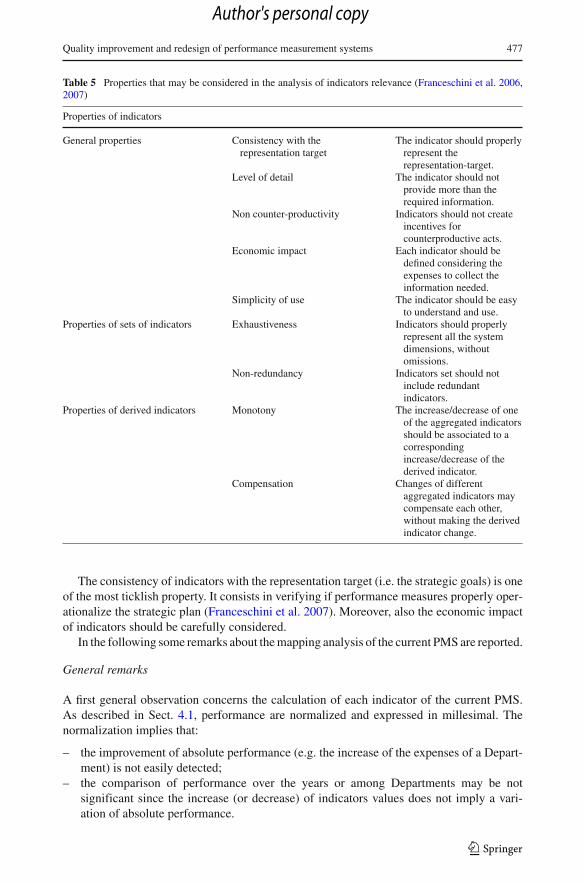
Table 5 Properties that may be considered in the analysis of indicators relevance (Franceschini et al. 2006,2007)
Properties of indicators
General properties Consistency with therepresentation target
The indicator should properlyrepresent therepresentation-target.
Level of detail The indicator should notprovide more than therequired information.
Non counter-productivity Indicators should not createincentives forcounterproductive acts.
Economic impact Each indicator should bedefined considering theexpenses to collect theinformation needed.
Simplicity of use The indicator should be easyto understand and use.
Properties of sets of indicators Exhaustiveness Indicators should properlyrepresent all the systemdimensions, withoutomissions.
Non-redundancy Indicators set should notinclude redundantindicators.
Properties of derived indicators Monotony The increase/decrease of oneof the aggregated indicatorsshould be associated to acorrespondingincrease/decrease of thederived indicator.
Compensation Changes of differentaggregated indicators maycompensate each other,without making the derivedindicator change.
The consistency of indicators with the representation target (i.e. the strategic goals) is oneof the most ticklish property. It consists in verifying if performance measures properly oper-ationalize the strategic plan (Franceschini et al. 2007). Moreover, also the economic impactof indicators should be carefully considered.
In the following some remarks about the mapping analysis of the current PMS are reported.
General remarks
A first general observation concerns the calculation of each indicator of the current PMS.As described in Sect. 4.1, performance are normalized and expressed in millesimal. Thenormalization implies that:
– the improvement of absolute performance (e.g. the increase of the expenses of a Depart-ment) is not easily detected;
– the comparison of performance over the years or among Departments may be notsignificant since the increase (or decrease) of indicators values does not imply a vari-ation of absolute performance.
123
Author's personal copy
478 F. Franceschini, E. Turina
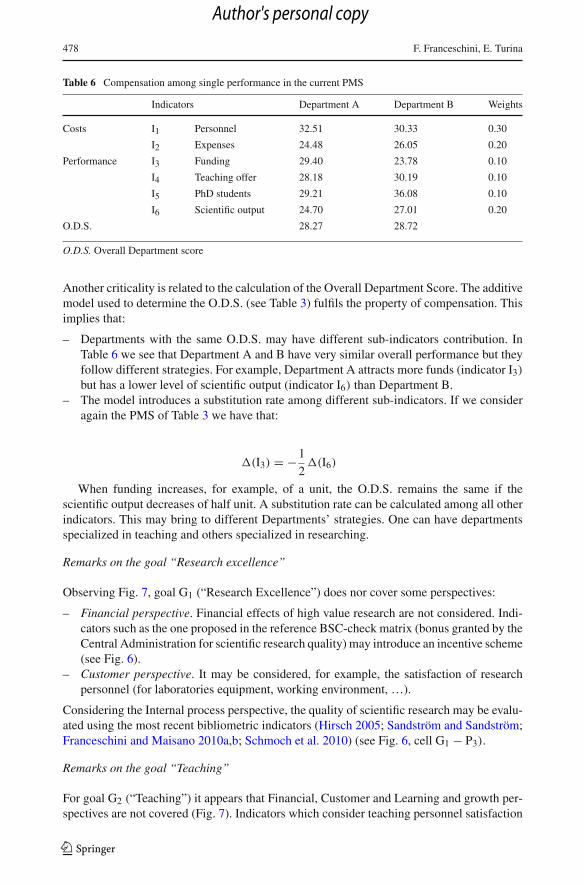
Table 6 Compensation among single performance in the current PMS
Indicators Department A Department B Weights
Costs I1 Personnel 32.51 30.33 0.30
I2 Expenses 24.48 26.05 0.20
Performance I3 Funding 29.40 23.78 0.10
I4 Teaching offer 28.18 30.19 0.10
I5 PhD students 29.21 36.08 0.10
I6 Scientific output 24.70 27.01 0.20
O.D.S. 28.27 28.72
O.D.S. Overall Department score
Another criticality is related to the calculation of the Overall Department Score. The additivemodel used to determine the O.D.S. (see Table 3) fulfils the property of compensation. Thisimplies that:
– Departments with the same O.D.S. may have different sub-indicators contribution. InTable 6 we see that Department A and B have very similar overall performance but theyfollow different strategies. For example, Department A attracts more funds (indicator I3)
but has a lower level of scientific output (indicator I6) than Department B.– The model introduces a substitution rate among different sub-indicators. If we consider
again the PMS of Table 3 we have that:
�(I3) = −1
2�(I6)
When funding increases, for example, of a unit, the O.D.S. remains the same if thescientific output decreases of half unit. A substitution rate can be calculated among all otherindicators. This may bring to different Departments’ strategies. One can have departmentsspecialized in teaching and others specialized in researching.
Remarks on the goal “Research excellence”
Observing Fig. 7, goal G1 (“Research Excellence”) does nor cover some perspectives:
– Financial perspective. Financial effects of high value research are not considered. Indi-cators such as the one proposed in the reference BSC-check matrix (bonus granted by theCentral Administration for scientific research quality) may introduce an incentive scheme(see Fig. 6).
– Customer perspective. It may be considered, for example, the satisfaction of researchpersonnel (for laboratories equipment, working environment, …).
Considering the Internal process perspective, the quality of scientific research may be evalu-ated using the most recent bibliometric indicators (Hirsch 2005; Sandström and Sandström;Franceschini and Maisano 2010a,b; Schmoch et al. 2010) (see Fig. 6, cell G1 − P3).
Remarks on the goal “Teaching”
For goal G2 (“Teaching”) it appears that Financial, Customer and Learning and growth per-spectives are not covered (Fig. 7). Indicators which consider teaching personnel satisfaction
123
Author's personal copy
Quality improvement and redesign of performance measurement systems 479
(cell G2 − P2), lecturers workload (cell G2 − P3), new or updated courses organized withFaculties for the improvement of the teaching offer (cell G2 − P4) should be introduced (seeFig. 6).
Remarks on the goal “Resources management and funding”
The goal G3 (“Resources management and funding”) is not covered by the Customer per-spective (see Fig. 7). In detail:
– the satisfaction of the staff personnel is not assessed (cell G3.1 − P2);– the satisfaction of funding Agencies and research partners is not evaluated (cell G3.2 −
P2). A low satisfaction may induce a future reduction of funding.
Moreover, the goal G3.1 (“Fund-raising”) is not monitored by the Internal process dimen-sion (P3point of view). In this case, indicators to evaluate the attractiveness of a Departmentexpressed as the ratio between the amount of fund-raising and the Overall Assignment maybe introduced (see Fig. 6).
Also the perspective Learning and growth (P4) is not covered for Goal G3. The followingindicators may be considered (Fig. 6):
– investments in laboratories equipment (cell G3.1 − P4);– quality and productivity scientific output (i.e. number and quality of papers deriving from
funded research program) (cell G3.2 − P4).
Referring to the Financial perspective, the goal G3.2 may be better represented by the intro-duction of the indicator “Assets” (i.e. equipment used in the research activities). Assets maybe considered as a factor of attractiveness for a Department.
A critical aspect is the correlation among indicators. The current PMS evaluates both oper-ating expenses and personnel (cells G3.1 − P1 and G3.1 − P3 of Fig. 7). However, these twoindicators are correlated. At the increasing of the personnel, operating expenses are expectedto growth too. The property of non-redundancy is not respected. The main consequence isthat Departments with the highest operating expenses and personnel receive more economicassignments. This effect is reinforced by the high weights assigned to indicators I1 and I2 inthe Department Overall Score (see Table 3).
Considering the efficiency of the Department, the Goal G3.1 may be better represented byindicators such as the cost per personnel and/or the ratio between costs and the DepartmentAssignment. These suggest how well resources are managed.
Figure 8 shows the redesigned PMS.
5 Pros and cons of the proposed methodology for PMS redesign
The main Pros of the proposed methodology can be summed up as follows:
– International rankings (e.g. THES—Times Higher Education Supplement’s ranking,Shanghai Jiao Tong University’s ranking, Webometrics Ranking of World Universities,SCImago institutions rankings) are increasingly considered in the comparison betweenUniversities. A high position in the ranking allows a University to attract more fund-ing and students from around the world. A well-designed and updated PMS enables tounderstand the reasons of a specific positioning and improve its Quality performance.
123
Author's personal copy
480 F. Franceschini, E. Turina
Det
aile
dst
rate
gic
go
als
G1
Res
earc
hex
celle
nce
G2
Tea
chin
gS
atis
fact
ion
of
facu
ltie
s re
qu
irem
ents
G3
Res
ou
rces
man
agem
ent
and
fu
nd
ing
G3.
1
Eff
icie
nt
man
agem
ent
of
mat
eria
l an
d h
um
an r
eso
urc
es
G3.
2
Fu
nd
-rai
sin
g
BSC perspectives
P1
Fin
anci
alIn
tern
al b
onus
aw
arde
d fo
r sc
ient
ific
rese
arch
I 3: A
mou
ntof
fund
ing
Ass
ets
valu
e (n
ew te
chni
cal
equi
pmen
t )
P2
Cu
sto
mer
Res
earc
hers
satis
fact
ion
Stu
dent
s sa
tisfa
ctio
n T
each
ing
pers
onne
l sat
isfa
ctio
nS
taff
pers
onne
l sat
isfa
ctio
nF
undi
ng a
genc
ies
satis
fact
ion
Res
earc
h pa
rtne
rs s
atis
fact
ion
P3
Inte
rnal
p
roce
ssN
umbe
r of
pub
licat
ions
Qua
lity
of p
ublic
atio
ns (
e.g.
: h-in
dex)
I 4: A
mou
nt o
f tea
chin
g ho
urs
prov
ided
to F
acul
ties
Ave
rage
num
ber
of s
tude
nts
per
cour
seA
vera
ge n
umbe
r of
teac
hing
hou
rs
per
lect
urer
Rat
io b
etw
een
oper
atin
g co
sts
and
Dep
artm
ent A
ssig
nmen
t O
pera
ting
cost
s pe
r un
it of
pe
rson
nel w
orki
ng in
to th
e D
epar
tmen
t
Rat
io b
etw
een
the
amou
nt o
f fun
ding
an
d D
epar
tmen
t Ass
ignm
ent
P4
Lea
rnin
g
and
gro
wth
I 5: N
umbe
r of
PhD
stu
dent
sN
ew c
ours
es o
rgan
ized
for
diffe
rent
Fac
ultie
s
Rat
io b
etw
een
cost
s fo
r te
chni
cal
equi
pmen
t acq
uisi
tion
and
over
all
oper
atin
g co
sts
Num
ber
of p
ublic
atio
ns a
risin
g fr
om
fund
ed p
roje
cts
Qua
lity
of p
ublic
atio
ns a
risin
g fr
om
fund
ed p
roje
cts
(e.g
.: h-
inde
x)
Fig
.8R
edes
igne
dPM
S.T
hepe
rfor
man
cear
eas
unco
vere
dby
indi
cato
rsof
the
prev
ious
PMS
are
high
light
edin
grey
.New
orre
vise
din
dica
tors
are
init
alic
123
Author's personal copy
Quality improvement and redesign of performance measurement systems 481
– It is a structured approach which identifies a set of steps and tools supporting the redesignprocess. In particular, the reference BSC check-matrix enables to verify periodically ifthe current set of indicators is still relevant to monitor the organization performance.
– It is based on a leading model which is well suited for performance measurement in thehigher education. However, it is worth noting that the BSC is not the unique referencemodel. The suggested methodology is flexible to the context of application. For example,possible reference models might be the European Foundation for Quality Managementmodel (European Foundation for Quality Management 2010) or the Baldridge criteria(Baldridge National Quality program 2010) which may be applied independently of thetype, size, and structure of the organization.
– Performance measurement in the academic field may be very critical for the presence ofmany intangible assets. The reference BSC-check matrix and the analysis of indicatorsproperties support the reflection on what issues should be measured and how.
On the opposite, a list of the main cons is the following:
– Factors and frequency of redesign are not easily definable. The seven warning signalsproposed by Vitale and Mavrinach (1995) may be for example considered.
– In the application example the barriers to PMS change are only partially considered. Onthe whole, a detailed analysis of the impact exerted on the organization by a redesignedPMS should be developed. Different criteria of impact should be identified and the effectsof each indicator evaluated (Franceschini et al. 2007).
6 Conclusions
In this paper a methodology for Quality improvement of an academic organization by meansof the redesign of its Performance Measurement System is presented.
Basing on the Kaplan and Norton’s Balanced Scorecard (BSC), a reference BSC-checkmatrix is defined in order to analyze in a systematic way how each organizational strategicgoal may be monitored by a BSC perspective.
A mapping-analysis is proposed in order to understand what performance areas are notcovered or not adequately considered. By the structured comparison of the PMS and theproposed reference BSC-check matrix, the set of existing performance measures may beredesigned.
Due to the increasing interest in performance measurement in the academy field, an appli-cation example of the proposed methodology in the authors’ own University is presented. Thesuggested approach enables to translate a Department’s goals into indicators and to checkthe current PMS.
Future work will consider the analysis of the impact exerted on the Department behaviourby the redesigned set of indicators.
References
Agence de l’évaluation de la recherche et de l’enseignement supérieur (AERES).: Évaluationdes établissements, des unités de recherche et des formations de la vague A (2011–2014).http://www.aeres-evaluation.frEvaluation/Evaluation-par-l-AERES/Modalites-d-evaluationde-la-camp-agne-en-cours-Vague-A-2011-2014 (2010). Accessed 1 Sep 2010
Asan, S.E., Tanyas, M.: Integrating Hoshin Kanri and the balanced scorecard for strategic management:The case of higher education. Total Qual. Manag. Bus. Excell. 18(9), 999–1014 (2007). doi:10.1080/14783360701592604
Baldridge National Quality program.: Criteria for Performance excellence. http://www.baldrige.nist.gov/PDF_files/2009_2010Business_Nonprofit_Criteria.pdf (2010). Accessed 1 Sep 2010
Bititci, U., Turner, T., Begemann, C.: Dynamics of performance measurement systems. Int. J. Oper. Prod.Manag. 20(6), 692–704 (2000). doi:10.1108/01443570010321676
Bourne, M., Mills, J., Wilcox, M., Neely, A., Platts, K.: Designing, implementing and updatingperformance measurement systems. Int. J. Oper. Prod. Manag. 20(7), 754–771 (2000). doi:10.1108/01443570010330739
Caplice, C., Sheffi, Y.: A review and evaluation of logistics metrics. Int. J. Logist. Manag. 5(2), 11–28 (1994).doi:10.1108/09574099410805171
Chen, S., Yang, C., Shiau, J.: The application of balanced scorecard in the performance evaluation of highereducation. TQM Mag. 18(2), 190–205 (2006). doi:10.1108/09544780610647892
Comitato di Indirizzo per la Valutazione della Ricerca (CIVR).: Linee guida per la valutazione della ricerca.http://vtr2006.cineca.it/documenti/linee_guida.pdf (2006). Accessed 1 Sep 2010
Coccia, M., Rolfo, S.: Technology transfer analysis in the Italian National Research Council. Technova-tion 22(5), 291–299 (2002). doi:10.1016/S0166-4972(01)00018-9
De Mast, J., Bergman, M.: Hypothesis generation in quality improvement projects: Approaches for exploratorystudies. Qual. Reliab. Eng. Int. 22(7), 839–850 (2006). doi:10.1002/qre.767
Eccles, R.G.: The performance measurement manifesto. Harv. Bus. Rev. 69, 131–137 (1991)European Foundation for Quality Management.: Introducing the EFQM model 2010. http://www.efqm.org/
en/PdfResources/EFQMModel_Presentation.pdf (2010). Accessed 1 Sep 2010Flapper, S.D.R., Fortuin, L., Stoop, P.P.M.: Towards consistent performance management systems. Int. J. Oper.
Prod. Manag. 16(7), 27–37 (1996). doi:10.1108/01443579610119144Franceschini, F., Galetto, M., Maisano, D.: Classification of performance and quality indicators in manufac-
turing. Int. J. Serv. Oper. Manag. 2(3), 294–311 (2006). doi:10.1504/IJSOM.2006.009862Franceschini, F., Galetto, M., Maisano, D.: Management by measurement: Designing key indicators and per-
formance measurements. Springer, Berlin (2007)Franceschini, F., Maisano, D.: Analysis of the Hirsch index’s operational properties. Eur. J. Oper.
Res. 203(2), 494–504 (2010). doi:10.1016/j.ejor.2009.08.001Franceschini, F., Maisano, D.: A survey of quality engineering-management journals by bibliometric indica-
tors. Qual. Reliab. Eng. Int. 26(6), 593–604 (2010). doi:10.1002/Qre.1083Gomes, C.F., Yasin, M.M., Lisboa, J.V.: A literature review of manufacturing performance measures and mea-
surement in an organizational context: a framework and direction for future research. J. Manuf. Technol.Manag. 15(6), 511–530 (2004). doi:10.1108/17410380410547906
Henri, J.: The periodic review of performance indicators: An empirical investigation of the dynamism of perfor-mance measurement systems. Eur. Account. Rev. 19(1), 73–94 (2009). doi:10.1080/09638180902863795
Hirsch, J.E.: An index to quantify an individual’s scientific research output. Proc. Natl. Acad. Sci. USA. 102,16569–16572 (2005)
Hudson, M., Smart, A., Bourne, M.: Theory and practice in SME performance measurement systems. Int.J. Oper. Prod. Manag. 21(8), 1096–1115 (2001). doi:10.1108/EUM0000000005587
Johnson, H.T., Kaplan, R.S.: Relevance lost: The rise and fall of management accounting. Harvard BusinessSchool Press, Boston, MA (1987)
Jordan, G.B., Mortensen, J.C.: Measuring the performance of research and technology programs: A balancedscorecard approach. J. Technol. Trans. 22(2), 13–20 (1997). doi:10.1007/BF02509640
Juhl, H.J., Christensen, M.: Quality management in a Danish business school—A head of department per-spective. Total Qual. Manag. Bus. Excell. 19(7–8), 719–732 (2008). doi:10.1080/14783360802159394
Kaplan, R.S., Norton, D.P.: The balanced scorecard-measures that drive performance. Harv. Bus. Rev. 7071–79 (1992)
Kaplan, R.S., Norton, D.P.: Putting the balanced scorecard to work. Harv. Bus. Rev. 71, 134–147 (1993)Kaplan, R.S., Norton, D.P.: The balanced scorecard: Translating strategy into action. Harvard Business School
Press, Cambridge (1996)Kaplan, R.S., Norton, D.P.: The strategy focused organisation: How balanced scorecard companies thrive in
the new business environment. Harvard Business School Press, Boston (2001)Karathanos, D., Karathanos, P.: Applying the balanced scorecard to education. J. Educ. Bus. 80, 222–231
Quality improvement and redesign of performance measurement systems 483
Kennerly, M., Neely, A.: A framework of the factors affecting the evolution of performance measurementsystems. Int. J. Oper. Prod. Manag. 22(11), 1222–1246 (2002). doi:10.1108/01443570210450293
Kennerly, M., Neely, A.: Measuring performance in a changing business environment. Int. J. Oper. Prod.Manag. 23(2), 213–229 (2003). doi:10.1108/01443570210450293
Lingle, J.H., Schiemann, W.A.: From balanced scorecard to strategy gauge: is measurement worth it? Manag.Rev. 85, 56–62 (1996)
McDevitt, R., Giapponi, C., Solomon, N.: Strategy revitalization in academe: A balanced scorecardapproach. Int. J. Educ. Manag. 22(1), 32–47 (2008). doi:10.1108/09513540810844549
Montague, S., Teather, G.G.: Evaluation and management of multi-departmental (horizontal) science andtechnology programs. Res. Eval. 16(3), 183–190 (2007). doi:10.3152/095820207X235106
Neely, A., Gregory, M., Platts, K.: Performance measurement systems design. A literature review and aresearch agenda. Int. J. Oper. Prod. Manag. 15(4), 80–116 (1995). doi:10.1108/01443570510633648
Neely, A.: The evolution of performance measurement research. Developments in the last decade and aresearch agenda for the next. Int. J. Oper. Prod. Manag. 25(12), 1264–1277 (2005). doi:10.1108/01443570510633648
Papenhausen, C., Einstein, W.: Insights from the balanced scorecard - implementing the balanced scorecardat a college of business. Meas. Bus. Excell. 10(3), 15–22 (2006). doi:10.1108/13683040610685757
Paranjape, B., Rossiter, M., Pantano, V.: Insights from the Balanced Scorecard. Performance measurementsystems: successes, failures and future – a review. Meas. Bus. Excell. 10(3), 4–14 (2006). doi:10.1108/13683040610685748
Performance-Based Management Special Interest Group.: Using performance information to drive improve-ment. In: U.S. Department of Energy (eds.) The performance-based management handbook, vol. 6. OakRidge Institute for Science and Education, Oak Ridge (2001)
Pinheiro De Lima, E., Goueva Da Costa, S., Angelis, J.E.: The strategic management of operation systemperformance. Int. J. Bus. Perform. Manag. 10(1), 108–132 (2008). doi:10.1504/IJBPM.2008.015924
Pinheiro De Lima, E., Goueva Da Costa, S., Angelis, J.E.: Strategic performance measurement systems: adiscussion about their roles. Meas. Bus. Excell. 13(3), 39–48 (2009). doi:10.1108/13683040910984310
Politecnico di Torino.: Regolamento generale del Politecnico di Torino. www.swas.polito.it/_library/downloadfile.asp?id=10384 (2010a). Accessed 1 Sep 2010
Politecnico di Torino.: Statuto del Politecnico di Torino. http://www.unisi.it/dl2/20090518110041906/downloadfile_statuto_torino.pdf (2010b). Accessed 1 Sep 2010
Research Assessment Exercise (RAE).: Research Assessment Exercise 2008: The outcome. http://www.rae.ac.uk/results/outstore/RAEOutcomeFull.pdf (2008). Accessed 1 Sep 2010
Sandström, U., Sandström, E.: The field factor: Towards a metric for academic institutions. Res. Eval. 18(3):243–250. doi:10.3152/095820209X466892
Schmoch, U., Schubert, T., Jansen, D., Heidler, R., von Görtz, R.: How to use indicators to measure scientificperformance: a balanced approach. Res. Eval. 19(1), 2–18 (2010). doi:10.3152/095820210X492477
Tapinos, E., Dyson, R.G., Meadows, M.: The impact of the performance measurement systems in settingthe ’direction’ in the University of Warwick. Prod. Plan. Control 16(2), 189–198 (2005). doi:10.1080/09537280512331333084
Teather, G.G., Montague, S.: Performance measurement, management and reporting for S&T organization:An overview. J. Technol. Trans. 22(2), 13–20 (1997). doi:10.1007/BF02509639
Tutuncu, O., Kucukusta, D.: Canonical correlation between job satisfaction and EFQM business excellencemodel. Qual. Quant. 44(6), 1227–1238 (2010)
Umashankar, V., Dutta, K.: Balanced scorecards in managing higher education institutions: An Indian per-spective. Int. J. Educ. Manag. 21(1), 54–67 (2007). doi:10.1108/09513540710716821
University Of California, Laboratory Administration Office. Objective Standards of Performance(Appendix F). http://www.ucop.edu/labs/labprimecontracts/LBNL/appendices/archives/apndx_f_lbnl_m345.pdf (2010c). Accessed 1 Sep 2010
U.S. Department of the Treasury.: Criteria for developing performance measurement systems in the publicsector. US Department of the Treasury, Washington DC (1994)
Vitale, M.R., Mavrinach, S.C.: How effective is your performance measurement system?. Manag. Account.USA 77(2), 43–48 (1995)
Waggoner, D.B., Neely, A.D., Kennerley, M.: The forces that shape organizational performance measure-ment systems: an interdisciplinary review. Int. J. Prod. Econ. 60–61, 53–60 (1999). doi:10.1016/S0925-5273(98)00201-1