19
WATER GOVERNANCE INDICATORS STAKEHOLDER CONSULTATION 8th Meeting of the OECD Water Governance Initiative 12 January 2017 Rabat, Morocco
| Date post: | 17-Jan-2017 |
| Category: |
Government & Nonprofit |
| Upload: | oecd-governance |
| View: | 11 times |
| Download: | 0 times |
WATER GOVERNANCE INDICATORS
STAKEHOLDER CONSULTATION
8th Meeting of the OECD Water Governance Initiative 12 January 2017 Rabat, Morocco
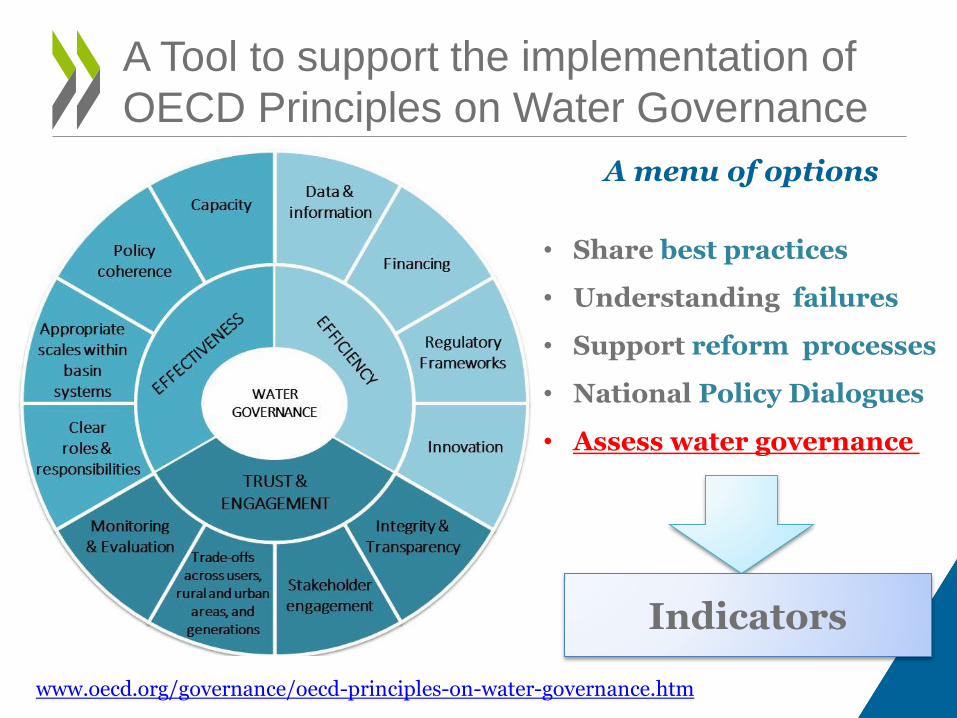
A Tool to support the implementation of
OECD Principles on Water Governance
www.oecd.org/governance/oecd-principles-on-water-governance.htm
A menu of options
• Share best practices
• Understanding failures
• Support reform processes
• National Policy Dialogues
• Assess water governance
Indicators
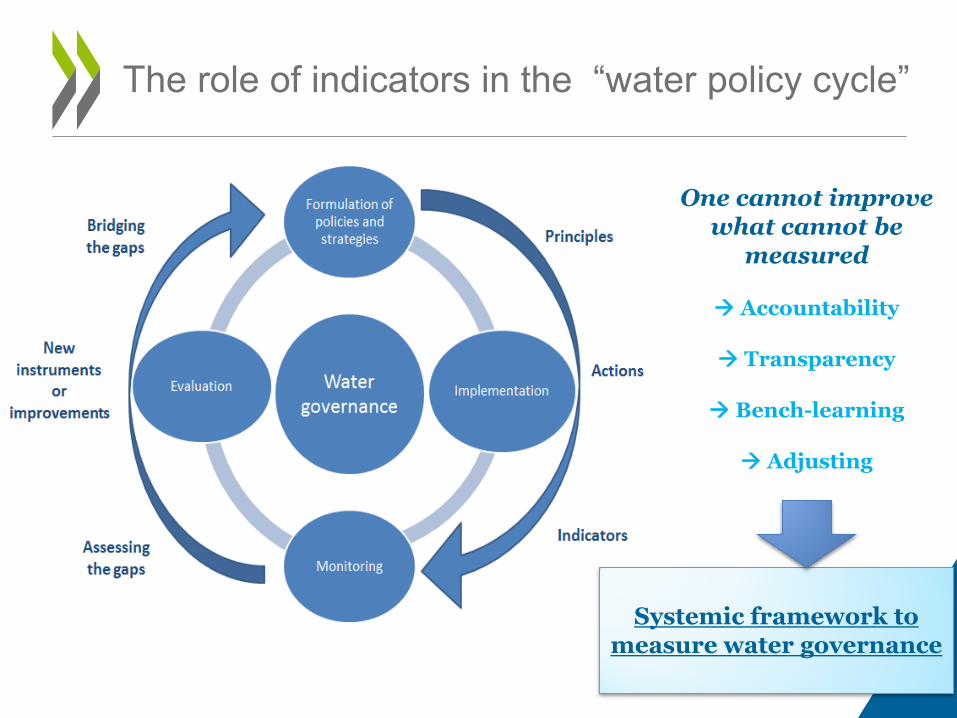
The role of indicators in the “water policy cycle”
One cannot improve what cannot be
measured
Accountability
Transparency
Bench-learning
Adjusting
Systemic framework to
measure water governance
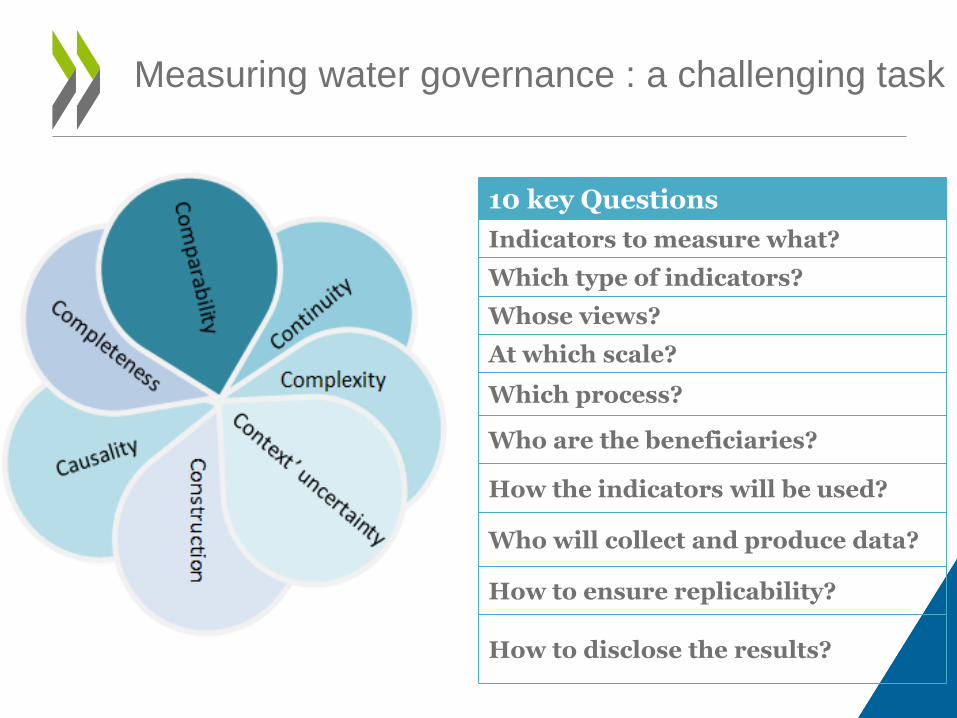
Measuring water governance : a challenging task
10 key Questions
Indicators to measure what?
Which type of indicators?
Whose views?
At which scale?
Which process?
Who are the beneficiaries?
How the indicators will be used?
Who will collect and produce data?
How to ensure replicability?
How to disclose the results?
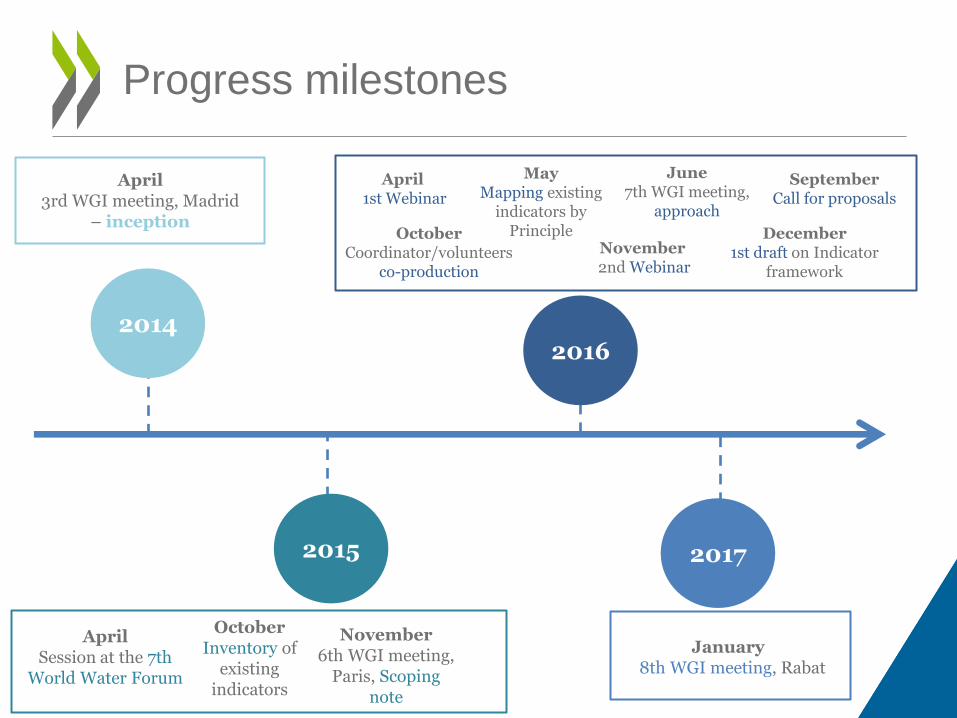
Progress milestones
April 3rd WGI meeting, Madrid
– inception
April Session at the 7th
World Water Forum
October Inventory of
existing indicators
November 6th WGI meeting,
Paris, Scoping note
2015
2014 2016
April 1st Webinar
May Mapping existing
indicators by Principle
June 7th WGI meeting,
approach
September Call for proposals
October Coordinator/volunteers
co-production
November 2nd Webinar
December 1st draft on Indicator
framework
2017
January 8th WGI meeting, Rabat
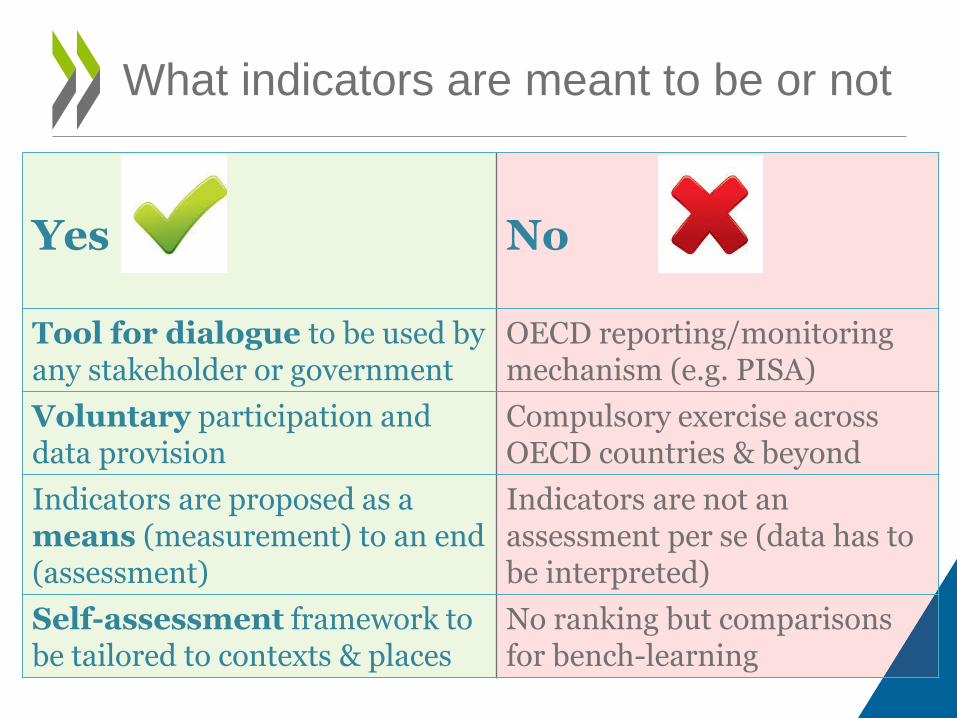
What indicators are meant to be or not
Yes
No
Tool for dialogue to be used by any stakeholder or government
OECD reporting/monitoring mechanism (e.g. PISA)
Voluntary participation and data provision
Compulsory exercise across OECD countries & beyond
Indicators are proposed as a means (measurement) to an end (assessment)
Indicators are not an assessment per se (data has to be interpreted)
Self-assessment framework to be tailored to contexts & places
No ranking but comparisons for bench-learning
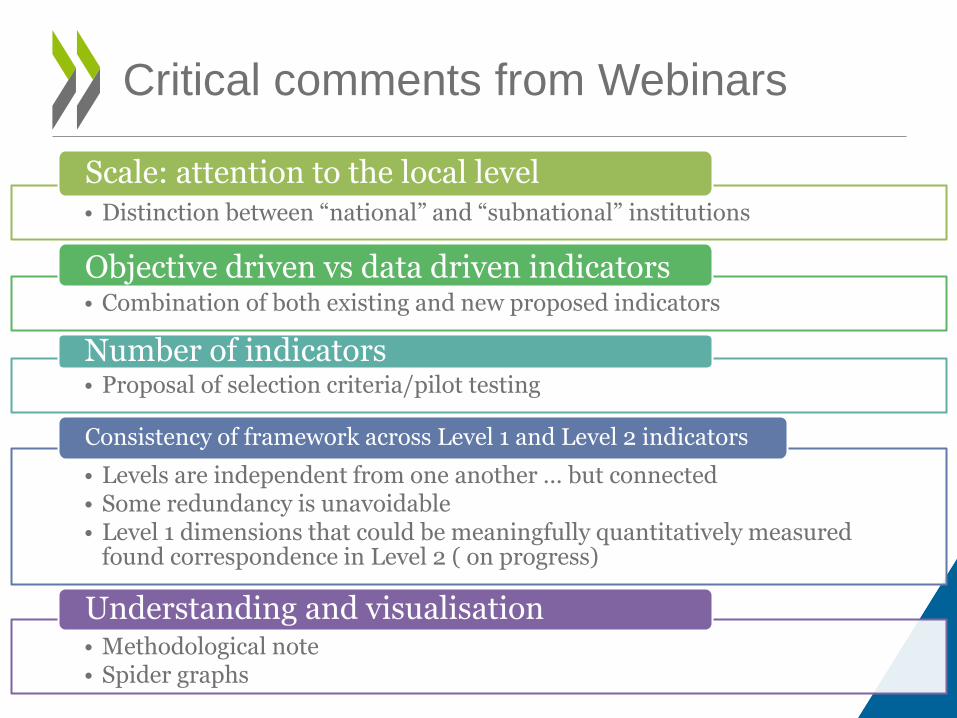
Critical comments from Webinars
• Distinction between “national” and “subnational” institutions
Scale: attention to the local level
• Combination of both existing and new proposed indicators
Objective driven vs data driven indicators
• Proposal of selection criteria/pilot testing
Number of indicators
• Levels are independent from one another … but connected • Some redundancy is unavoidable • Level 1 dimensions that could be meaningfully quantitatively measured
found correspondence in Level 2 ( on progress)
Consistency of framework across Level 1 and Level 2 indicators
• Methodological note • Spider graphs
Understanding and visualisation
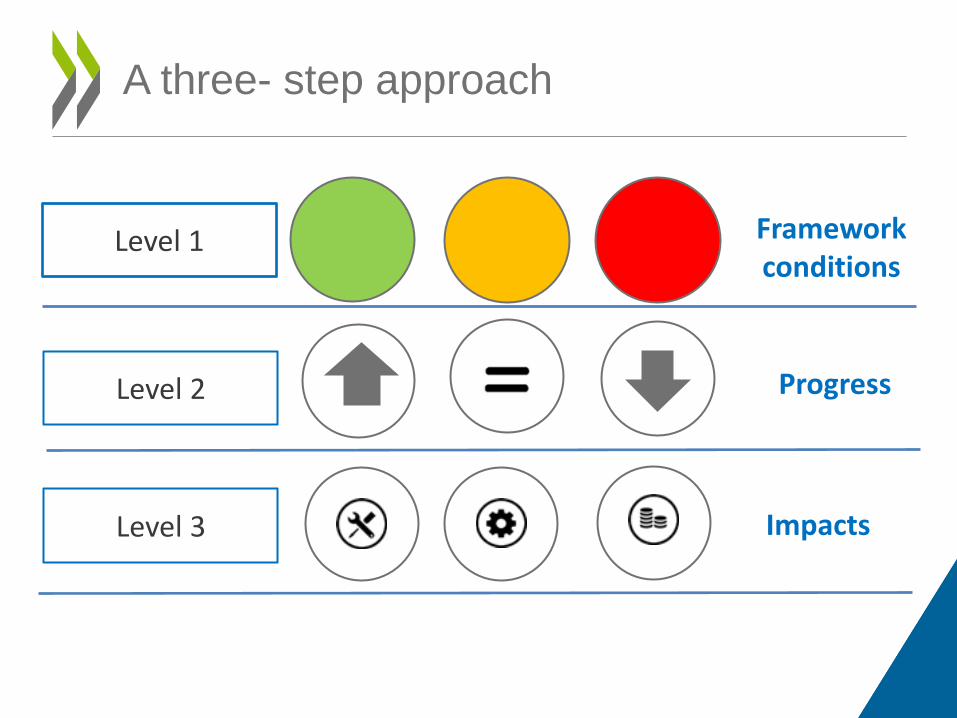
A three- step approach
Level 1
Level 2
Level 3
Framework conditions
Progress
Impacts
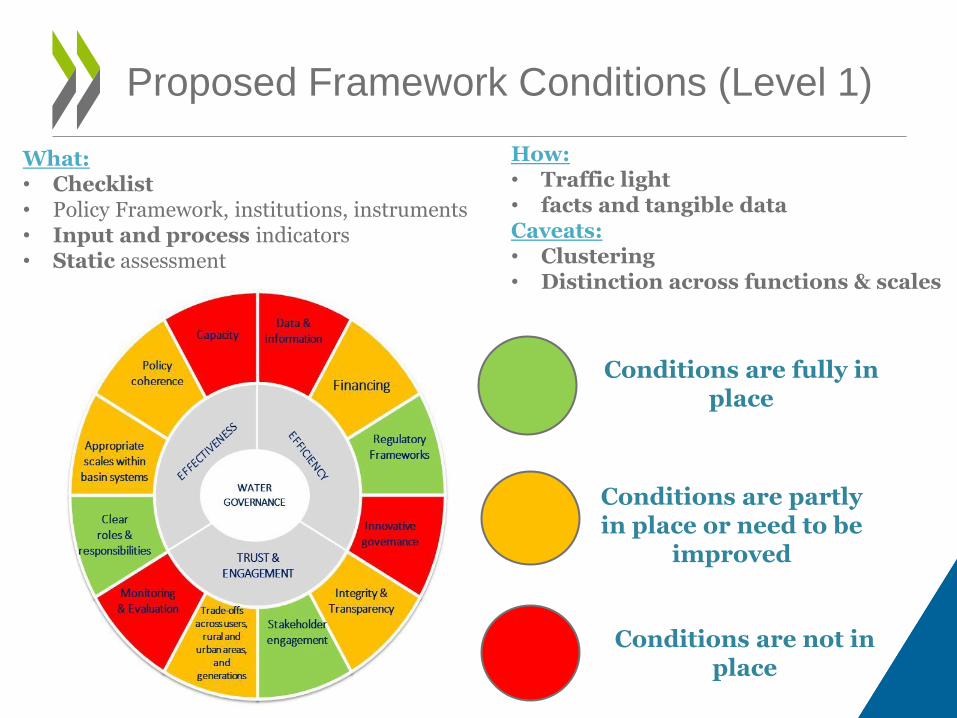
Proposed Framework Conditions (Level 1)
What: • Checklist • Policy Framework, institutions, instruments • Input and process indicators • Static assessment
How: • Traffic light • facts and tangible data Caveats: • Clustering • Distinction across functions & scales
Conditions are fully in place
Conditions are partly in place or need to be
improved
Conditions are not in place
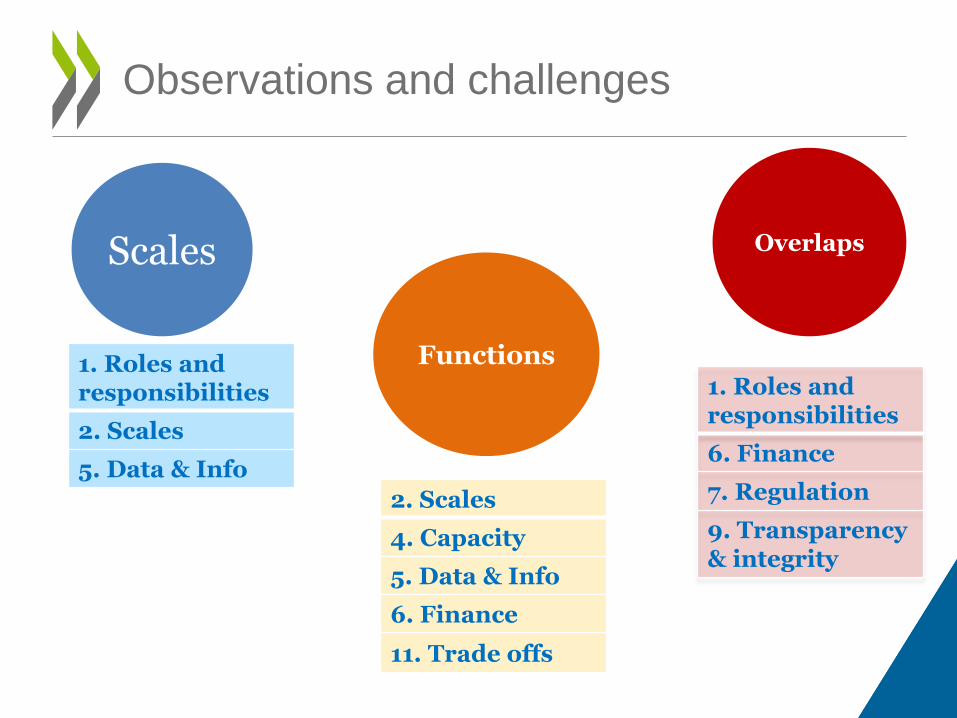
Observations and challenges
1. Roles and responsibilities
2. Scales
5. Data & Info
2. Scales
4. Capacity
5. Data & Info
6. Finance
11. Trade offs
1. Roles and responsibilities
6. Finance
7. Regulation
9. Transparency & integrity
Scales
Functions
Overlaps
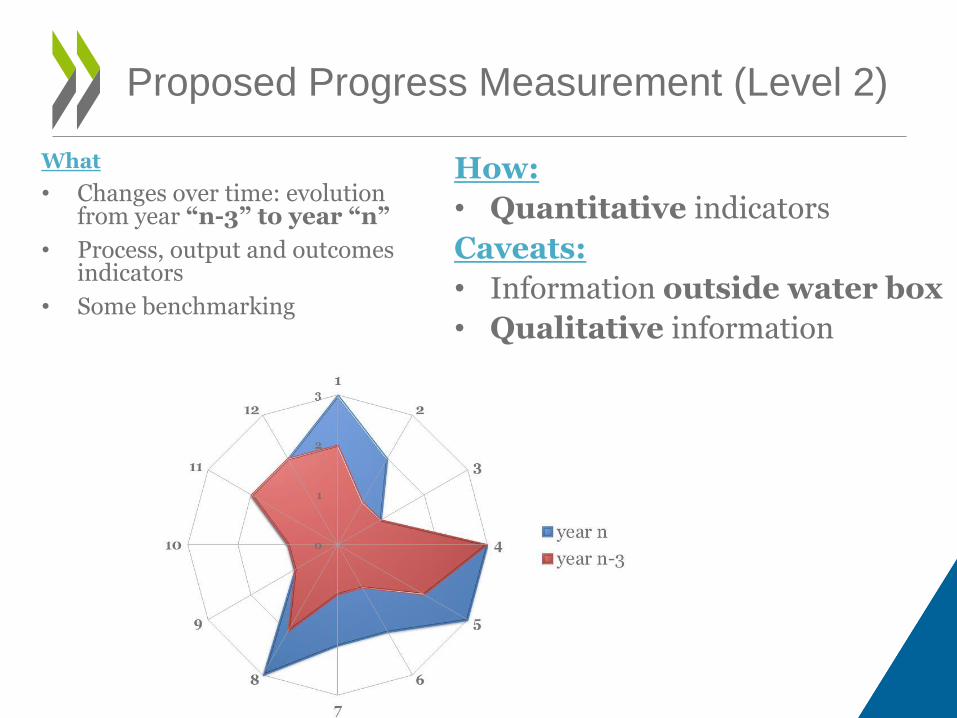
What
• Changes over time: evolution from year “n-3” to year “n”
• Process, output and outcomes indicators
• Some benchmarking
How:
• Quantitative indicators
Caveats:
• Information outside water box
• Qualitative information
Proposed Progress Measurement (Level 2)
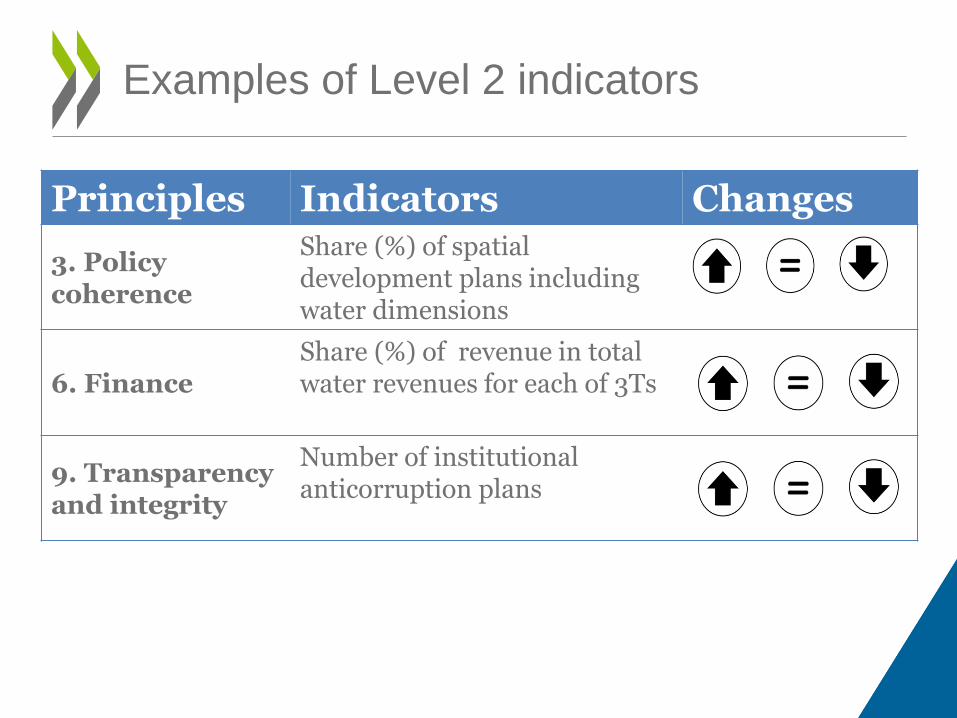
Examples of Level 2 indicators
Principles Indicators Changes
3. Policy coherence
Share (%) of spatial development plans including water dimensions
6. Finance Share (%) of revenue in total water revenues for each of 3Ts
9. Transparency and integrity
Number of institutional anticorruption plans
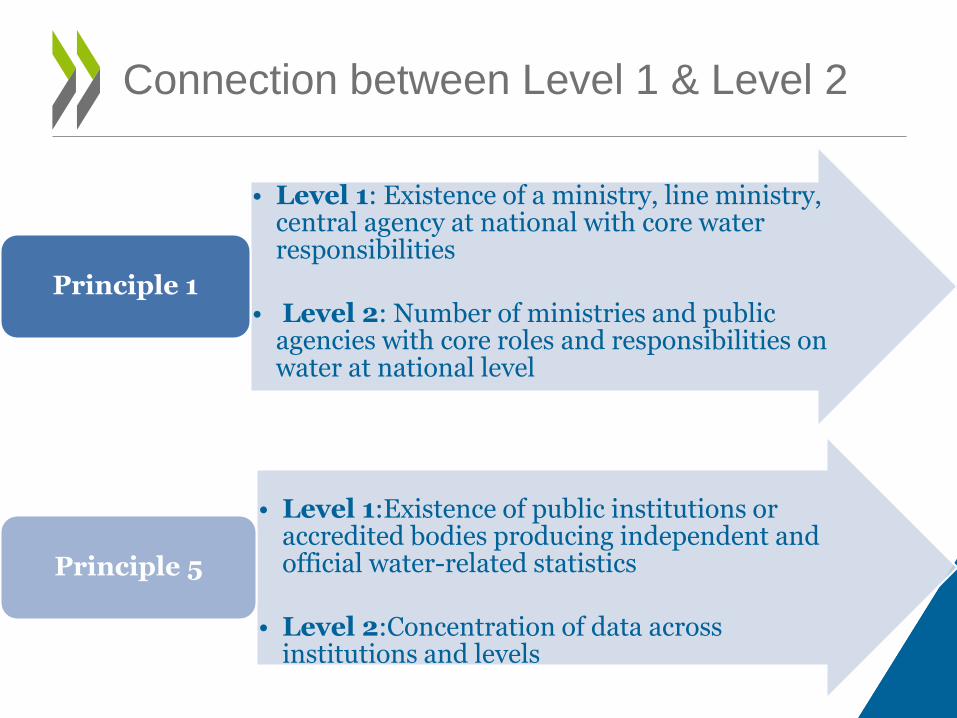
Connection between Level 1 & Level 2
• Level 1: Existence of a ministry, line ministry, central agency at national with core water responsibilities
• Level 2: Number of ministries and public agencies with core roles and responsibilities on water at national level
Principle 1
• Level 1:Existence of public institutions or accredited bodies producing independent and official water-related statistics
• Level 2:Concentration of data across institutions and levels
Principle 5
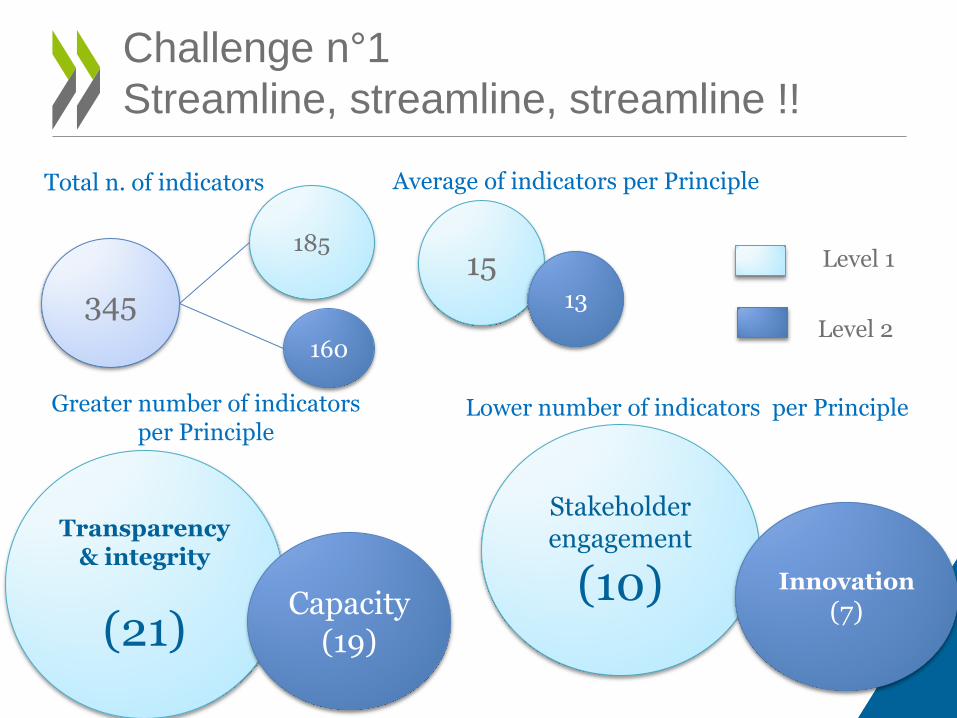
Challenge n°1
Streamline, streamline, streamline !!
345
185
160
15 13
Transparency & integrity
(21) Capacity
(19)
Stakeholder engagement
(10) Innovation
(7)
Total n. of indicators Average of indicators per Principle
Greater number of indicators per Principle
Lower number of indicators per Principle
Level 1
Level 2
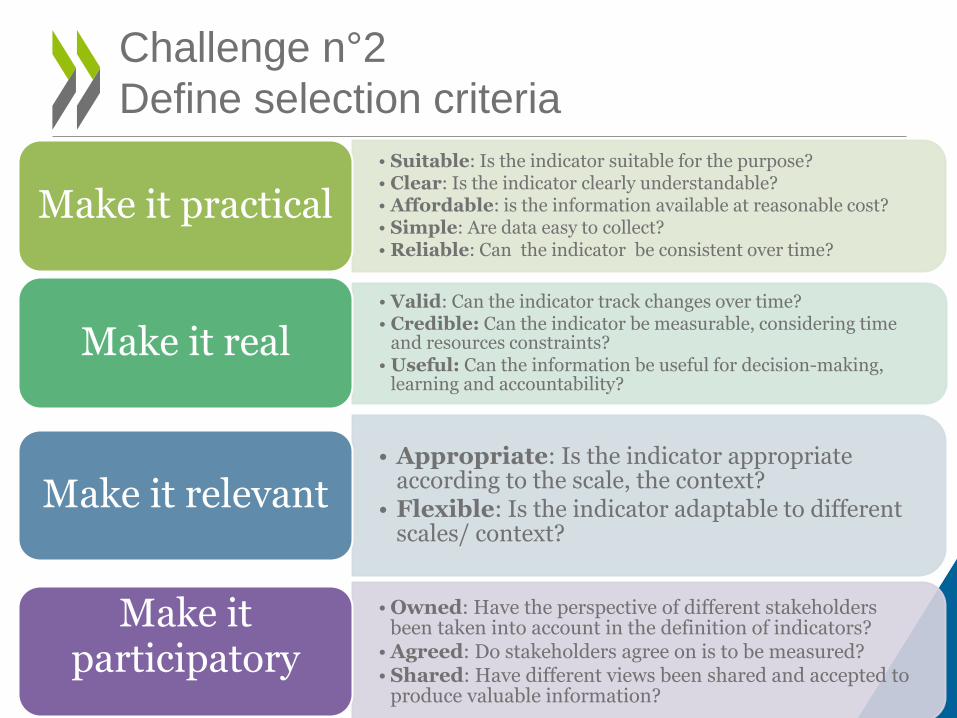
Challenge n°2
Define selection criteria
• Suitable: Is the indicator suitable for the purpose? • Clear: Is the indicator clearly understandable? • Affordable: is the information available at reasonable cost? • Simple: Are data easy to collect? • Reliable: Can the indicator be consistent over time?
Make it practical
• Valid: Can the indicator track changes over time? • Credible: Can the indicator be measurable, considering time
and resources constraints? • Useful: Can the information be useful for decision-making,
learning and accountability?
Make it real
• Appropriate: Is the indicator appropriate according to the scale, the context?
• Flexible: Is the indicator adaptable to different scales/ context?
Make it relevant
• Owned: Have the perspective of different stakeholders been taken into account in the definition of indicators?
• Agreed: Do stakeholders agree on is to be measured? • Shared: Have different views been shared and accepted to
produce valuable information?
Make it participatory
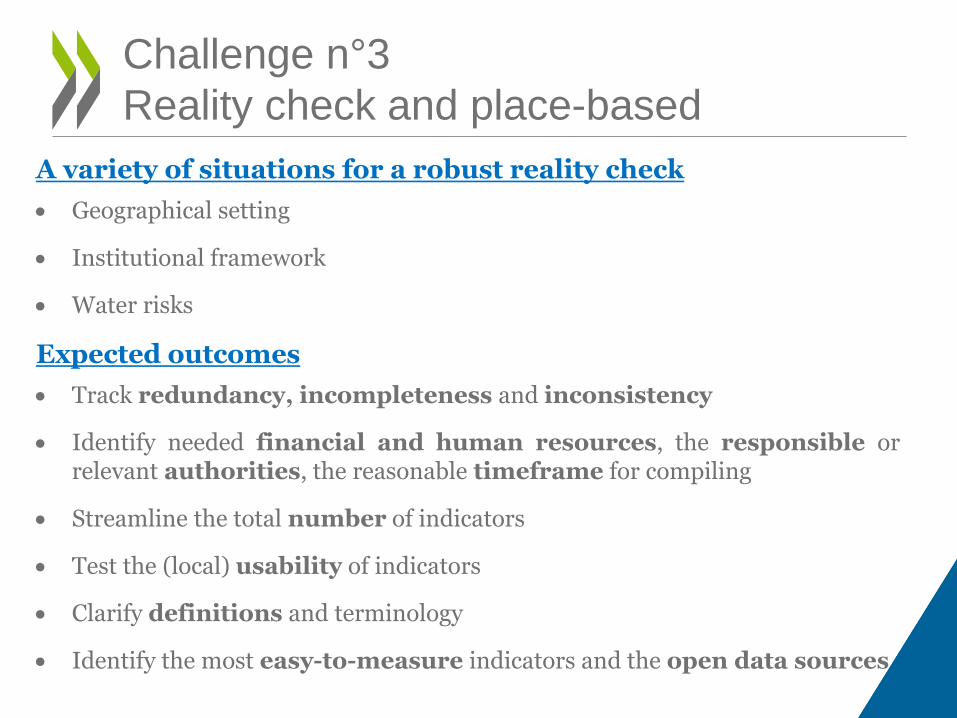
Challenge n°3
Reality check and place-based
A variety of situations for a robust reality check
Geographical setting
Institutional framework
Water risks
Expected outcomes
Track redundancy, incompleteness and inconsistency
Identify needed financial and human resources, the responsible or relevant authorities, the reasonable timeframe for compiling
Streamline the total number of indicators
Test the (local) usability of indicators
Clarify definitions and terminology
Identify the most easy-to-measure indicators and the open data sources
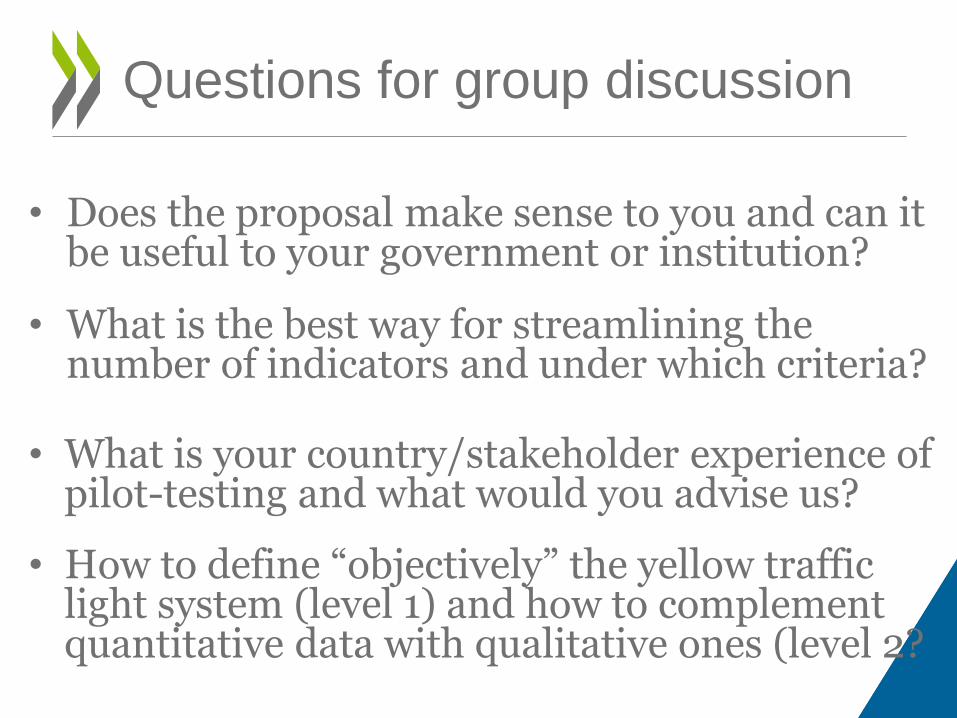
• Does the proposal make sense to you and can it be useful to your government or institution?
• What is the best way for streamlining the number of indicators and under which criteria?
• What is your country/stakeholder experience of pilot-testing and what would you advise us?
• How to define “objectively” the yellow traffic light system (level 1) and how to complement quantitative data with qualitative ones (level 2?
Questions for group discussion

THANK YOU !
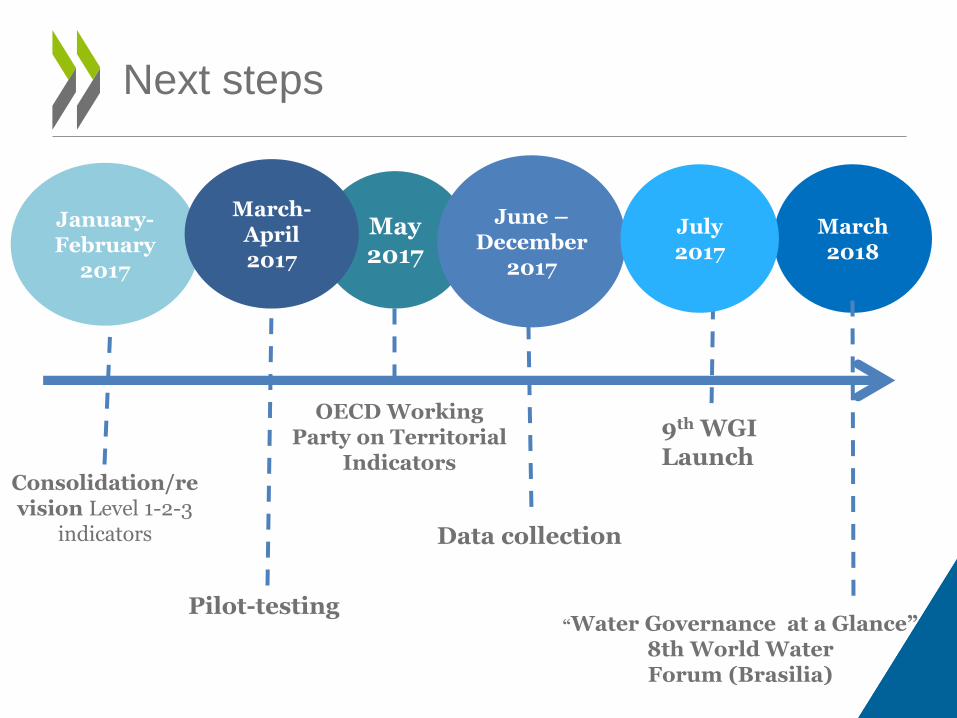
Next steps
May 2017
January- February
2017
March-April 2017
June – December
2017
Consolidation/revision Level 1-2-3
indicators
Pilot-testing
March 2018
OECD Working Party on Territorial
Indicators
Data collection
“Water Governance at a Glance” 8th World Water Forum (Brasilia)
July 2017
9th WGI Launch


