Page 1
GGGG
Stakeholders’ Education | Corporate Governance Research | Corporate Governance Score | Proxy Advisory
STAKEHOLDERS EMPOWERMENT SERVICES
1 | P A G E
SECTOR: STEEL REPORTING DATE: 30TH NOVEMBER ‘2017
ANKIT METAL & POWER LTD www.ankitmetal.com
Ankit Metal & Power Ltd NSE Code - ANKITMETAL TABLE 1 - MARKET DATA (STANDALONE) (AS ON 06TH NOVEMBER 2017)
Sector - Steel NSE Market Price (₹) 1.30 NSE Market Cap. (₹ Cr.) 18.34
Face Value (₹) 10.00 Equity (₹ Cr.) 141.11
Business Group – N.A. 52 week High/Low (₹) 2.35/1.10 Net worth (₹ Cr.)* -426.26
Year of Incorporation - 2002 TTM P/E (TTM) N.A. Traded Volume (Shares) 1,000
TTM P/BV N.A. Traded Volume (lacs) 0.01
Registered Office - Source - Capitaline, TTM - Trailing Twelve Months, N.A. - Not Applicable, * As on 30th Sep, 2017
35 Chittranjan Avenue, COMPANY BACKGROUND
Kolkata -700 012, West Bengal The company was incorporated on 7th August 2002 as Ankit Steel Works Private Limited and
was subsequently renamed as Ankit Metal & Power Private Limited on 8th July 2004.
Suresh Kumar Patni has promoted the company. Pursuant to change in the corporate status
of the Company from Private to Public, the name of the company was further changed to
Ankit Metal & Power Limited with effect from 31st August 2004.
Company Website:
www.ankitmetal.com
Revenue and Profit Performance
The revenue of the Company increased from ₹ 0.75 crores to ₹
50.28 crores from quarter ending Sep’16 to quarter ending
Sep’17. The Company made a loss of ₹ 88.62 crores in quarter
ending Sep’17 vis-a-vis making a loss of ₹ 58.33 crores in quarter
ending Sep’16.
Source: Moneycontrol
Performance vis-à-vis Market
TABLE 2- Returns
1-m 3-m 6-m 12-m
Ankit Metal & Power Ltd 0.00% -38.46% -23.53% -27.78%
Nifty 6.01% 21.82% 10.93% 31.21%
NIFTY METAL 9.97% 27.68% 35.55% 45.75%
Source - Capitaline/NSE
0.50
0.70
0.90
1.10
1.30
1.50
1.70
Nov 16 Jan 17 Mar 17 May 17 Jul 17 Sep 17
Ankit Metal & Power Ltd NIFTY NIFTY METAL
50.28
11.920.75
-88.62-70.33
-58.33
-100
-50
0
50
100
Sep'17 Mar'17 Sep'16
Quarterly revenue and Profit (₹ CRORE)
Revenue Profit
Page 2
GGGG
Stakeholders’ Education | Corporate Governance Research | Corporate Governance Score | Proxy Advisory
STAKEHOLDERS EMPOWERMENT SERVICES
2 | P A G E
SECTOR: STEEL REPORTING DATE: 30TH NOVEMBER ‘2017
ANKIT METAL & POWER LTD www.ankitmetal.com
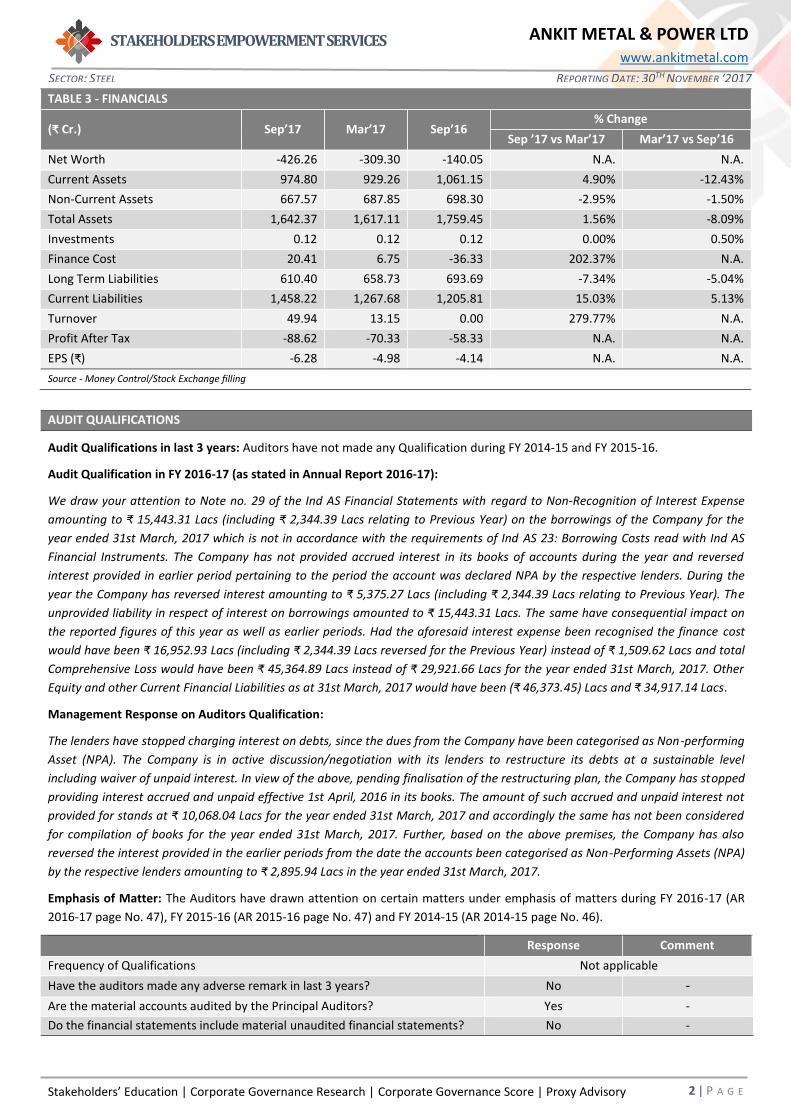
TABLE 3 - FINANCIALS
(₹ Cr.) Sep’17 Mar’17 Sep’16 % Change
Sep ’17 vs Mar’17 Mar’17 vs Sep’16
Net Worth -426.26 -309.30 -140.05 N.A. N.A.
Current Assets 974.80 929.26 1,061.15 4.90% -12.43%
Non-Current Assets 667.57 687.85 698.30 -2.95% -1.50%
Total Assets 1,642.37 1,617.11 1,759.45 1.56% -8.09%
Investments 0.12 0.12 0.12 0.00% 0.50%
Finance Cost 20.41 6.75 -36.33 202.37% N.A.
Long Term Liabilities 610.40 658.73 693.69 -7.34% -5.04%
Current Liabilities 1,458.22 1,267.68 1,205.81 15.03% 5.13%
Turnover 49.94 13.15 0.00 279.77% N.A.
Profit After Tax -88.62 -70.33 -58.33 N.A. N.A.
EPS (₹) -6.28 -4.98 -4.14 N.A. N.A.
Source - Money Control/Stock Exchange filling
AUDIT QUALIFICATIONS
Audit Qualifications in last 3 years: Auditors have not made any Qualification during FY 2014-15 and FY 2015-16.
Audit Qualification in FY 2016-17 (as stated in Annual Report 2016-17):
We draw your attention to Note no. 29 of the Ind AS Financial Statements with regard to Non-Recognition of Interest Expense
amounting to ₹ 15,443.31 Lacs (including ₹ 2,344.39 Lacs relating to Previous Year) on the borrowings of the Company for the
year ended 31st March, 2017 which is not in accordance with the requirements of Ind AS 23: Borrowing Costs read with Ind AS
Financial Instruments. The Company has not provided accrued interest in its books of accounts during the year and reversed
interest provided in earlier period pertaining to the period the account was declared NPA by the respective lenders. During the
year the Company has reversed interest amounting to ₹ 5,375.27 Lacs (including ₹ 2,344.39 Lacs relating to Previous Year). The
unprovided liability in respect of interest on borrowings amounted to ₹ 15,443.31 Lacs. The same have consequential impact on
the reported figures of this year as well as earlier periods. Had the aforesaid interest expense been recognised the finance cost
would have been ₹ 16,952.93 Lacs (including ₹ 2,344.39 Lacs reversed for the Previous Year) instead of ₹ 1,509.62 Lacs and total
Comprehensive Loss would have been ₹ 45,364.89 Lacs instead of ₹ 29,921.66 Lacs for the year ended 31st March, 2017. Other
Equity and other Current Financial Liabilities as at 31st March, 2017 would have been (₹ 46,373.45) Lacs and ₹ 34,917.14 Lacs.
Management Response on Auditors Qualification:
The lenders have stopped charging interest on debts, since the dues from the Company have been categorised as Non-performing
Asset (NPA). The Company is in active discussion/negotiation with its lenders to restructure its debts at a sustainable level
including waiver of unpaid interest. In view of the above, pending finalisation of the restructuring plan, the Company has stopped
providing interest accrued and unpaid effective 1st April, 2016 in its books. The amount of such accrued and unpaid interest not
provided for stands at ₹ 10,068.04 Lacs for the year ended 31st March, 2017 and accordingly the same has not been considered
for compilation of books for the year ended 31st March, 2017. Further, based on the above premises, the Company has also
reversed the interest provided in the earlier periods from the date the accounts been categorised as Non-Performing Assets (NPA)
by the respective lenders amounting to ₹ 2,895.94 Lacs in the year ended 31st March, 2017.
Emphasis of Matter: The Auditors have drawn attention on certain matters under emphasis of matters during FY 2016-17 (AR
2016-17 page No. 47), FY 2015-16 (AR 2015-16 page No. 47) and FY 2014-15 (AR 2014-15 page No. 46).
Response Comment
Frequency of Qualifications Not applicable
Have the auditors made any adverse remark in last 3 years? No -
Are the material accounts audited by the Principal Auditors? Yes -
Do the financial statements include material unaudited financial statements? No -
Page 3
GGGG
Stakeholders’ Education | Corporate Governance Research | Corporate Governance Score | Proxy Advisory
STAKEHOLDERS EMPOWERMENT SERVICES
3 | P A G E
SECTOR: STEEL REPORTING DATE: 30TH NOVEMBER ‘2017
ANKIT METAL & POWER LTD www.ankitmetal.com
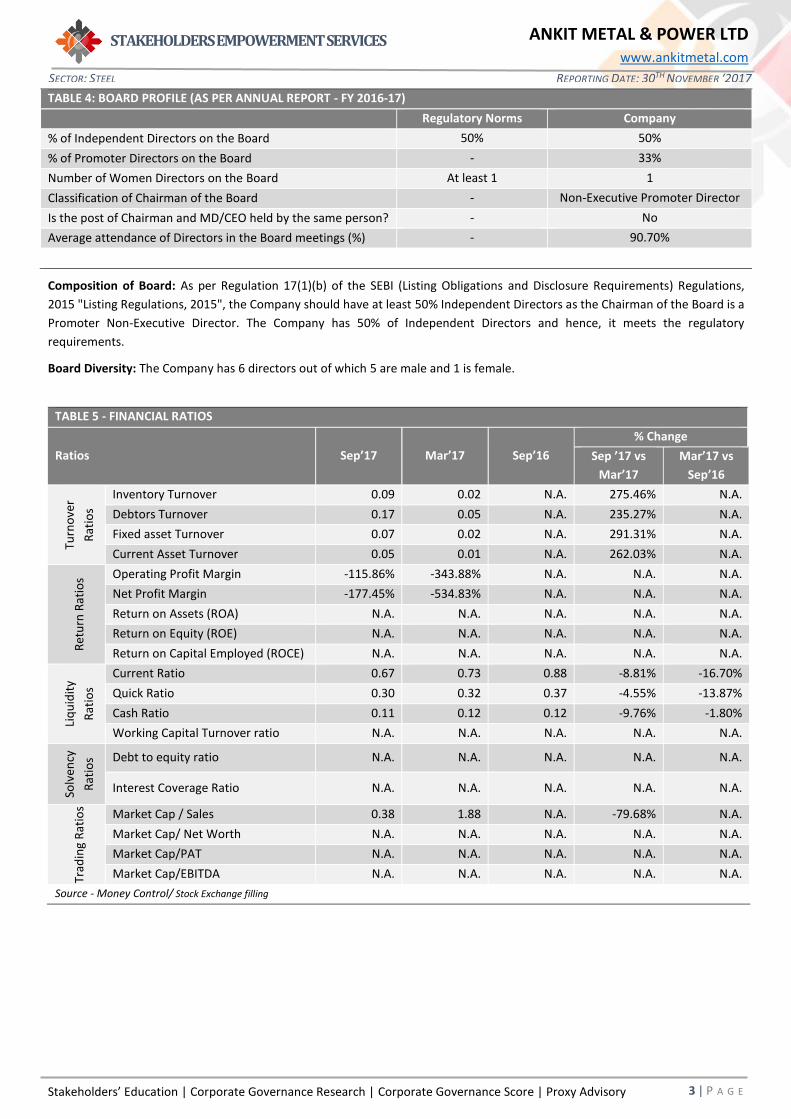
TABLE 4: BOARD PROFILE (AS PER ANNUAL REPORT - FY 2016-17)
Regulatory Norms Company
% of Independent Directors on the Board 50% 50%
% of Promoter Directors on the Board - 33%
Number of Women Directors on the Board At least 1 1
Classification of Chairman of the Board - Non-Executive Promoter Director
Is the post of Chairman and MD/CEO held by the same person? - No
Average attendance of Directors in the Board meetings (%) - 90.70%
Composition of Board: As per Regulation 17(1)(b) of the SEBI (Listing Obligations and Disclosure Requirements) Regulations,
2015 "Listing Regulations, 2015", the Company should have at least 50% Independent Directors as the Chairman of the Board is a
Promoter Non-Executive Director. The Company has 50% of Independent Directors and hence, it meets the regulatory
requirements.
Board Diversity: The Company has 6 directors out of which 5 are male and 1 is female.
TABLE 5 - FINANCIAL RATIOS
Ratios Sep’17 Mar’17 Sep’16
% Change
Sep ’17 vs
Mar’17
Mar’17 vs
Sep’16
Turn
ove
r
Rat
ios
Inventory Turnover 0.09 0.02 N.A. 275.46% N.A.
Debtors Turnover 0.17 0.05 N.A. 235.27% N.A.
Fixed asset Turnover 0.07 0.02 N.A. 291.31% N.A.
Current Asset Turnover 0.05 0.01 N.A. 262.03% N.A.
Ret
urn
Rat
ios Operating Profit Margin -115.86% -343.88% N.A. N.A. N.A.
Net Profit Margin -177.45% -534.83% N.A. N.A. N.A.
Return on Assets (ROA) N.A. N.A. N.A. N.A. N.A.
Return on Equity (ROE) N.A. N.A. N.A. N.A. N.A.
Return on Capital Employed (ROCE) N.A. N.A. N.A. N.A. N.A.
Liq
uid
ity
Rat
ios
Current Ratio 0.67 0.73 0.88 -8.81% -16.70%
Quick Ratio 0.30 0.32 0.37 -4.55% -13.87%
Cash Ratio 0.11 0.12 0.12 -9.76% -1.80%
Working Capital Turnover ratio N.A. N.A. N.A. N.A. N.A.
Solv
ency
Rat
ios Debt to equity ratio N.A. N.A. N.A. N.A. N.A.
Interest Coverage Ratio N.A. N.A. N.A. N.A. N.A.
Trad
ing
Rat
ios
Market Cap / Sales 0.38 1.88 N.A. -79.68% N.A.
Market Cap/ Net Worth N.A. N.A. N.A. N.A. N.A.
Market Cap/PAT N.A. N.A. N.A. N.A. N.A.
Market Cap/EBITDA N.A. N.A. N.A. N.A. N.A.
Source - Money Control/ Stock Exchange filling
Page 4
GGGG
Stakeholders’ Education | Corporate Governance Research | Corporate Governance Score | Proxy Advisory
STAKEHOLDERS EMPOWERMENT SERVICES
4 | P A G E
SECTOR: STEEL REPORTING DATE: 30TH NOVEMBER ‘2017
ANKIT METAL & POWER LTD www.ankitmetal.com
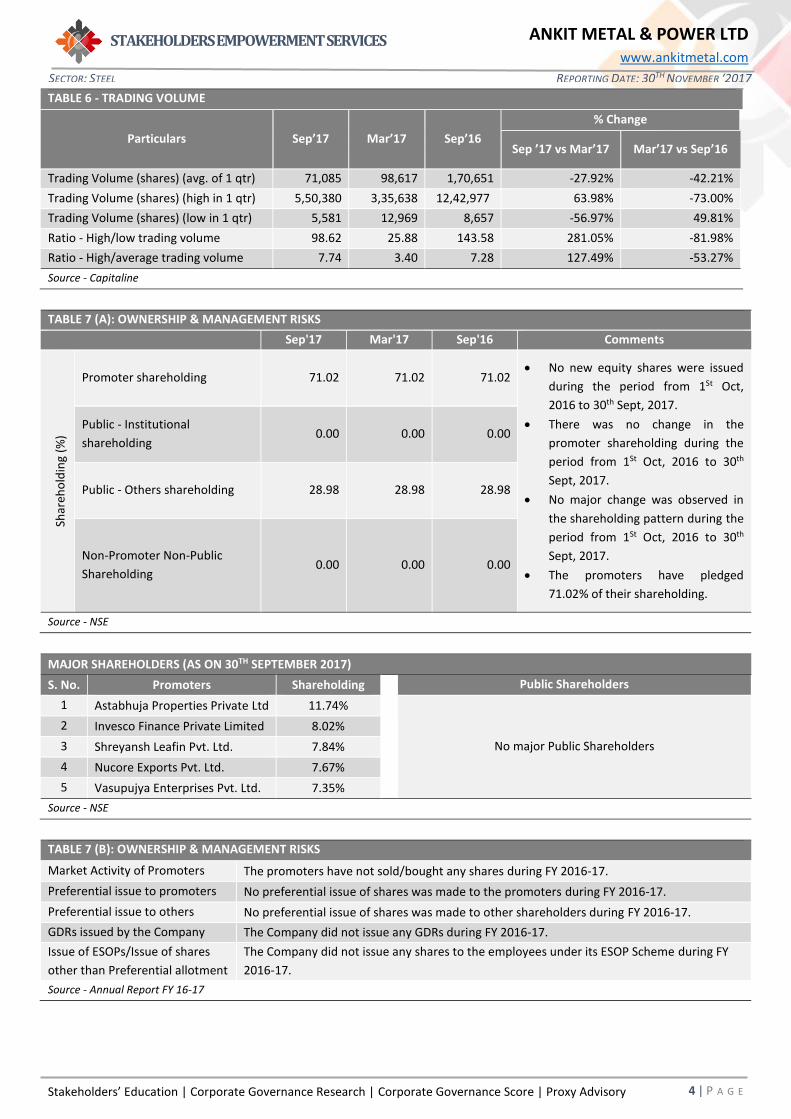
TABLE 6 - TRADING VOLUME
Particulars Sep’17 Mar’17 Sep’16
% Change
Sep ’17 vs Mar’17 Mar’17 vs Sep’16
Trading Volume (shares) (avg. of 1 qtr) 71,085 98,617 1,70,651 -27.92% -42.21%
Trading Volume (shares) (high in 1 qtr) 5,50,380 3,35,638 12,42,977 63.98% -73.00%
Trading Volume (shares) (low in 1 qtr) 5,581 12,969 8,657 -56.97% 49.81%
Ratio - High/low trading volume 98.62 25.88 143.58 281.05% -81.98%
Ratio - High/average trading volume 7.74 3.40 7.28 127.49% -53.27%
Source - Capitaline
TABLE 7 (A): OWNERSHIP & MANAGEMENT RISKS
Sep'17 Mar'17 Sep'16 Comments
Shar
eho
ldin
g (%
)
Promoter shareholding 71.02 71.02 71.02 • No new equity shares were issued
during the period from 1St Oct,
2016 to 30th Sept, 2017.
• There was no change in the
promoter shareholding during the
period from 1St Oct, 2016 to 30th
Sept, 2017.
• No major change was observed in
the shareholding pattern during the
period from 1St Oct, 2016 to 30th
Sept, 2017.
• The promoters have pledged
71.02% of their shareholding.
Public - Institutional
shareholding 0.00 0.00 0.00
Public - Others shareholding 28.98 28.98 28.98
Non-Promoter Non-Public
Shareholding 0.00 0.00 0.00
Source - NSE
MAJOR SHAREHOLDERS (AS ON 30TH SEPTEMBER 2017)
S. No. Promoters Shareholding Public Shareholders
1 Astabhuja Properties Private Ltd 11.74%
No major Public Shareholders
2 Invesco Finance Private Limited 8.02%
3 Shreyansh Leafin Pvt. Ltd. 7.84%
4 Nucore Exports Pvt. Ltd. 7.67%
5 Vasupujya Enterprises Pvt. Ltd. 7.35%
Source - NSE
TABLE 7 (B): OWNERSHIP & MANAGEMENT RISKS
Market Activity of Promoters The promoters have not sold/bought any shares during FY 2016-17.
Preferential issue to promoters No preferential issue of shares was made to the promoters during FY 2016-17.
Preferential issue to others No preferential issue of shares was made to other shareholders during FY 2016-17.
GDRs issued by the Company The Company did not issue any GDRs during FY 2016-17.
Issue of ESOPs/Issue of shares
other than Preferential allotment
The Company did not issue any shares to the employees under its ESOP Scheme during FY
2016-17.
Source - Annual Report FY 16-17
Page 5
GGGG
Stakeholders’ Education | Corporate Governance Research | Corporate Governance Score | Proxy Advisory
STAKEHOLDERS EMPOWERMENT SERVICES
5 | P A G E
SECTOR: STEEL REPORTING DATE: 30TH NOVEMBER ‘2017
ANKIT METAL & POWER LTD www.ankitmetal.com
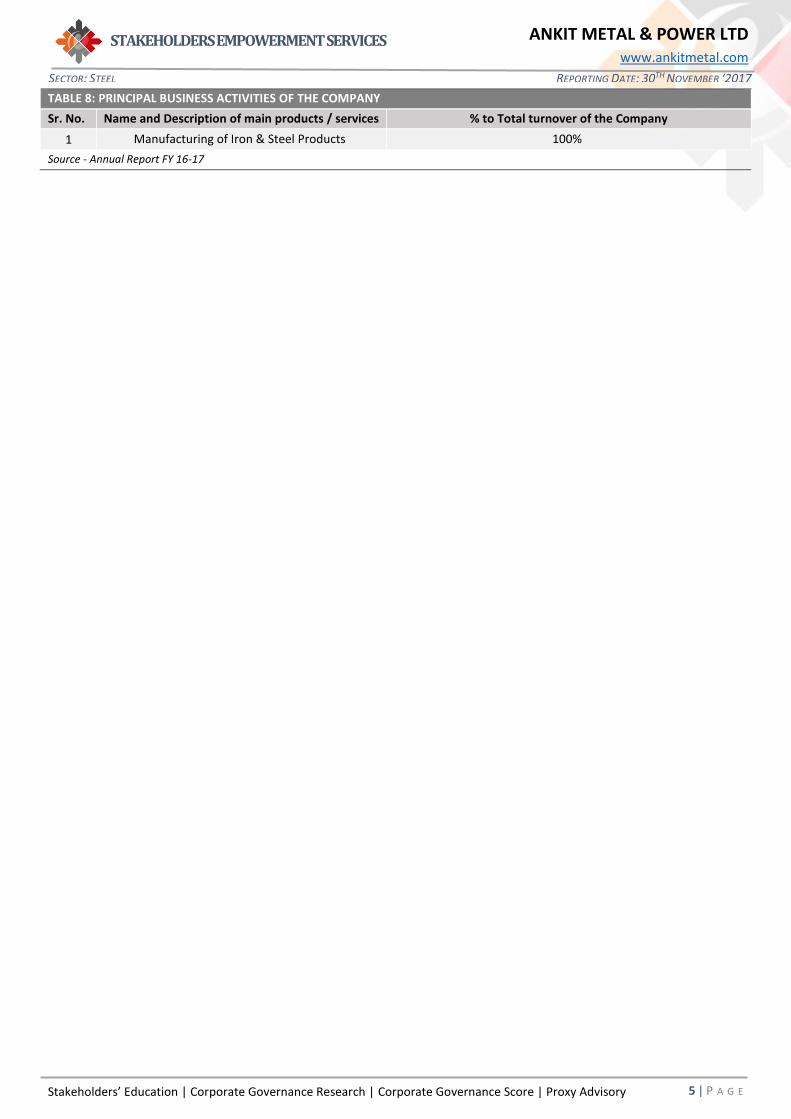
TABLE 8: PRINCIPAL BUSINESS ACTIVITIES OF THE COMPANY
Sr. No. Name and Description of main products / services % to Total turnover of the Company
1 Manufacturing of Iron & Steel Products 100%
Source - Annual Report FY 16-17
Page 6
GGGG
Stakeholders’ Education | Corporate Governance Research | Corporate Governance Score | Proxy Advisory
STAKEHOLDERS EMPOWERMENT SERVICES
6 | P A G E
SECTOR: STEEL REPORTING DATE: 30TH NOVEMBER ‘2017
ANKIT METAL & POWER LTD www.ankitmetal.com
Glossary
Equity: The equity shares capital of the Company
Net Worth: The amount by which the Assets exceeds the liabilities excluding shareholders’ funds of the Company
Turnover: The revenue earned from the operations of the Company
EPS: Earning Per Share is net profit earned by the Company per share
𝐸𝑃𝑆 =Profit After Tax
Number of outstanding shares
P/E ratio: It is the ratio of the Company’s share price to earnings per share of the Company
𝑃/𝐸 𝑟𝑎𝑡𝑖𝑜 =Price of each share
Earnings per share
Current Assets: Cash and other assets that are expected to be converted to cash in one year
Fixed Assets: assets which are purchased for long-term use and are not likely to be converted quickly into cash, such as land,
buildings, and equipment
Total Assets: Current Assets + Fixed Assets
Investments: An investment is an asset or item that is purchased with the hope that it will generate income or appreciate in
the future.
Finance Cost: The Financing Cost (FC), also known as the Cost of Finances (COF), is the cost and interest and other charges
incurred during the year in relation to borrowed money.
Long Term Liabilities: Long-term liabilities are liabilities with a maturity period of over one year.
Current Liabilities: A company's debts or obligations that are due within one year.
Inventory Turnover ratio: Inventory Turnover is a ratio showing how many times a company's inventory is sold and replaced
over a period.
𝐼𝑛𝑣𝑒𝑛𝑡𝑜𝑟𝑦 𝑇𝑢𝑟𝑛𝑜𝑣𝑒𝑟 𝑟𝑎𝑡𝑖𝑜 =Sales Turnover
Inventory
Debtors Turnover: Accounts receivable turnover is an efficiency ratio or activity ratio that measures how many times a business
can turn its accounts receivable into cash during a period
𝐷𝑒𝑏𝑡𝑜𝑟𝑠 𝑇𝑢𝑟𝑛𝑜𝑣𝑒𝑟 𝑟𝑎𝑡𝑖𝑜 =Sales Turnover
Accounts recievables
Fixed Asset Turnover: The fixed-asset turnover ratio is a financial ratio of net sales to fixed assets
𝐹𝑖𝑥𝑒𝑑 𝐴𝑠𝑠𝑒𝑡 𝑇𝑢𝑟𝑛𝑜𝑣𝑒𝑟 𝑟𝑎𝑡𝑖𝑜 =Sales Turnover
Fixed Assets
Current Asset Turnover: The current-asset turnover ratio is a financial ratio of net sales to fixed assets
𝐶𝑢𝑟𝑟𝑒𝑛𝑡 𝐴𝑠𝑠𝑒𝑡 𝑇𝑢𝑟𝑛𝑜𝑣𝑒𝑟 𝑟𝑎𝑡𝑖𝑜 =Sales Turnover
Current Assets
Operating Profit Margin: Operating margin is a measurement of what proportion of a Company’s revenue is left over after
paying for variable costs of production such as wages, raw materials etc. It can be calculated by dividing a Company’s operating
income (also known as “operating profit”) during a given period by its sales during the same period.
𝑂𝑝𝑒𝑟𝑎𝑡𝑖𝑛𝑔 𝑃𝑟𝑜𝑓𝑖𝑡 𝑀𝑎𝑟𝑔𝑖𝑛 =Operating profit
Sales Turnover
Net Profit Margin: Net profit margin is the percentage of revenue left after all expenses have been deducted from sales
𝑁𝑒𝑡 𝑃𝑟𝑜𝑓𝑖𝑡 𝑀𝑎𝑟𝑔𝑖𝑛 =Net profit
Sales Turnover
Page 7
GGGG
Stakeholders’ Education | Corporate Governance Research | Corporate Governance Score | Proxy Advisory
STAKEHOLDERS EMPOWERMENT SERVICES
7 | P A G E
SECTOR: STEEL REPORTING DATE: 30TH NOVEMBER ‘2017
ANKIT METAL & POWER LTD www.ankitmetal.com
Return on Assets: ROA tells you what earnings were generated from invested capital (assets)
𝑅𝑒𝑡𝑢𝑟𝑛 𝑜𝑛 𝐴𝑠𝑠𝑒𝑡𝑠 =Net profit
Total Assets
Return on equity/net worth: return on equity (ROE) is the amount of net income returned as a percentage of shareholders’
equity.
𝑅𝑒𝑡𝑢𝑟𝑛 𝑜𝑛 𝐸𝑞𝑢𝑖𝑡𝑦 =Net profit
Net worth
Return on Capital Employed: Return on capital employed (ROCE) is a financial ratio that measures a company's profitability
and the efficiency with which its capital is employed.
𝑅𝑒𝑡𝑢𝑟𝑛 𝑜𝑛 𝐶𝑎𝑝𝑖𝑡𝑎𝑙 𝐸𝑚𝑝𝑙𝑜𝑦𝑒𝑑 =Net profit
Total Debt + Equity share capital
Current ratio: The current ratio is a financial ratio that measures whether or not a firm has enough resources to pay its debts
over the next 12 months. It compares a firm's current assets to its current liabilities.
𝐶𝑢𝑟𝑟𝑒𝑛𝑡 𝑟𝑎𝑡𝑖𝑜 =Current Assets
Current Liabilities
Quick ratio: The quick ratio is a measure of how well a Company can meet its short term financial liabilities.
𝑄𝑢𝑖𝑐𝑘 𝑟𝑎𝑡𝑖𝑜 =Current Assets − Inventories
Current Liabilities
Cash ratio: The ratio of the liquid assets of a Company to its current liabilities.
𝑄𝑢𝑖𝑐𝑘 𝑟𝑎𝑡𝑖𝑜 =Current Assets − Inventories − Account Recievables
Current Liabilities
Working Capital Turnover ratio: The working capital turnover ratio is also referred to as net sales to working capital. It indicates
a Company's effectiveness in using its working capital.
𝑊𝑜𝑟𝑘𝑖𝑛𝑔 𝐶𝑎𝑝𝑖𝑡𝑎𝑙 𝑇𝑢𝑟𝑛𝑜𝑣𝑒𝑟 𝑟𝑎𝑡𝑖𝑜 =𝑆𝑎𝑙𝑒𝑠 𝑇𝑢𝑟𝑛𝑜𝑣𝑒𝑟
Current Assets − Current Liabilities
Debt to Equity ratio: The debt-to-equity ratio (D/E) is a financial ratio indicating the relative proportion of
shareholders' equity and debt used to finance a company's assets.
𝐷𝑒𝑏𝑡 𝑡𝑜 𝐸𝑞𝑢𝑖𝑡𝑦 𝑟𝑎𝑡𝑖𝑜 =𝑆ℎ𝑜𝑟𝑡 𝑇𝑒𝑟𝑚 𝐷𝑒𝑏𝑡 + 𝐿𝑜𝑛𝑔 𝑇𝑒𝑟𝑚 𝐷𝑒𝑏𝑡
𝑁𝑒𝑡 𝑊𝑜𝑟𝑡ℎ
Interest Coverage ratio: The Interest coverage ratio is a debt ratio and profitability ratio used to determine how easily a
Company can pay interest on outstanding debt.
𝐼𝑛𝑡𝑒𝑟𝑒𝑠𝑡 𝐶𝑜𝑣𝑒𝑟𝑎𝑔𝑒 𝑅𝑎𝑡𝑖𝑜 =𝐸𝑎𝑟𝑛𝑖𝑛𝑔 𝐵𝑒𝑓𝑜𝑟𝑒 𝐼𝑛𝑡𝑒𝑟𝑒𝑠𝑡 𝑎𝑛𝑑 𝑇𝑎𝑥
𝐹𝑖𝑛𝑎𝑛𝑐𝑒 𝐶𝑜𝑠𝑡
Market Cap/Sales ratio: Market Cap/sales ratio, Price–sales ratio, P/S ratio, or PSR, is a valuation metric for stocks. It is
calculated by dividing the company's market cap by the revenue in the most recent year; or, equivalently, divide the per-
share stock price by the per-share revenue.
𝑀𝑎𝑟𝑘𝑒𝑡 𝐶𝑎𝑝/𝑆𝑎𝑙𝑒𝑠 𝑟𝑎𝑡𝑖𝑜 =𝑀𝑎𝑟𝑘𝑒𝑡 𝐶𝑎𝑝
𝑆𝑎𝑙𝑒𝑠 𝑇𝑢𝑟𝑛𝑜𝑣𝑒𝑟
Market Cap/ Net Worth ratio: It is a valuation ratio calculated by dividing Company’s market cap to net worth.
𝑀𝑎𝑟𝑘𝑒𝑡 𝐶𝑎𝑝/𝑁𝑒𝑡𝑤𝑜𝑟𝑡ℎ 𝑟𝑎𝑡𝑖𝑜 =𝑀𝑎𝑟𝑘𝑒𝑡 𝐶𝑎𝑝
𝑁𝑒𝑡𝑤𝑜𝑟𝑡ℎ
Market Cap/ PAT ratio: It is a valuation ratio calculated by dividing Company’s market cap to net profit.
𝑀𝑎𝑟𝑘𝑒𝑡 𝐶𝑎𝑝/𝑃𝐴𝑇 𝑟𝑎𝑡𝑖𝑜 =𝑀𝑎𝑟𝑘𝑒𝑡 𝐶𝑎𝑝
𝑛𝑒𝑡 𝑝𝑟𝑜𝑓𝑖𝑡
Market Cap/ EBITDA ratio: It is a valuation ratio calculated by dividing Company’s market cap to EBITDA.
Page 8
GGGG
Stakeholders’ Education | Corporate Governance Research | Corporate Governance Score | Proxy Advisory
STAKEHOLDERS EMPOWERMENT SERVICES
8 | P A G E
SECTOR: STEEL REPORTING DATE: 30TH NOVEMBER ‘2017
ANKIT METAL & POWER LTD www.ankitmetal.com
𝑀𝑎𝑟𝑘𝑒𝑡 𝐶𝑎𝑝/𝐸𝐵𝐼𝑇𝐷𝐴 𝑟𝑎𝑡𝑖𝑜 =𝑀𝑎𝑟𝑘𝑒𝑡 𝐶𝑎𝑝
𝐸𝐵𝐼𝑇𝐷𝐴
Trading Volume (shares) (avg. of 1 year): Average number of shares/day traded in 1 year
Trading volume (shares) (high in 1 year): Highest number of shares/day traded in 1 year
Trading volume (shares) (minimum in 1 year): Lowest number of shares traded on any one day in 1 year
Page 9
GGGG
Stakeholders’ Education | Corporate Governance Research | Corporate Governance Score | Proxy Advisory
STAKEHOLDERS EMPOWERMENT SERVICES
9 | P A G E
SECTOR: STEEL REPORTING DATE: 30TH NOVEMBER ‘2017
ANKIT METAL & POWER LTD www.ankitmetal.com
DISCLAIMER
Sources Company Information
Only publicly available data has been used while making the factsheet. Our data sources include: BSE, NSE, SEBI, Capitaline, Moneycontrol, Businessweek, Reuters, Annual Reports, IPO Documents and Company Website.
Analyst Certification
The analysts involved in development of this factsheet certify that no part of any of the research analyst’s compensation was, is, or will be directly or indirectly related to the contents of this factsheet.
Disclaimer
While SES has made every effort and has exercised due skill, care and diligence in compiling this factsheet based on publicly available information, it neither guarantees its accuracy, completeness or usefulness, nor assumes any liability whatsoever for any consequence from its use. This factsheet does not have any approval, express or implied, from any authority, nor is it required to have such approval. The users are strongly advised to exercise due diligence while using this factsheet. This factsheet in no manner constitutes an offer, solicitation or advice to buy or sell securities, nor solicits votes or proxies on behalf of any party. SES, which is a not-for-profit Initiative or its staff, has no financial interest in the companies covered in this factsheet except what is disclosed on its website. The factsheet is released in India and SES has ensured that it is in accordance with Indian laws. Person resident outside India shall ensure that laws in their country are not violated while using this factsheet; SES shall not be responsible for any such violation. All disputes subject to jurisdiction of High Court of Bombay, Mumbai.
SEBI Reg. No. INH000000016
This factsheet or any portion hereof may not be reprinted, sold, reproduced or redistributed without the written consent of Stakeholders Empowerment Services
Contact Information
Stakeholders Empowerment Services
A 202, Muktangan, Upper Govind Nagar,
Malad East, Mumbai – 400 097
Tel +91 22 4022 0322
[email protected]
[email protected]
www.sesgovernance.com
Research Analyst: Sumit Tank