___________________________________________________________________________________________ *Corresponding author: Email: [email protected]; British Journal of Economics, Management & Trade 4(4): 487-522, 2014 SCIENCEDOMAIN international www.sciencedomain.org Stakeholders’ Perception on Self Help Group’s Quality Parameters: A Psychometrics Analysis Sanjay Kanti Das 1* and Amalesh Bhowal 2 1 Department of Commerce, Lumding College, Lumding, Nagaon, Assam-782447, India. 2 Department of Commerce, Assam University, Diphu Campus, Karbi Anglong, Assam-782462, India. Authors’ contributions This work was carried out in collaboration between all authors. Author SKD designed the study, managed the literature searches, developed the scale, performed the statistical analysis and wrote the first draft of the manuscript. Author AB reviewed the scale and statistical tools used in the study. All authors read and approved the final manuscript. Received 26 th October 2013 Accepted 13 th December 2013 Published 2 nd January 2014 ABSTRACT Aims: The main objective of this paper is to assess the opinion of the direct stakeholders (i.e. Promoters, Donors, Financial Institutions and Group itself) of SHGs regarding the parameters (like design, governance, operational, impact etc.) to be considered while assessing the quality of SHGs. Study Design: The study was exploratory in nature with Meta Analysis as well as Psychometric Approach based on empiricism. Place and Duration of Study: The present study covers all the direct Stakeholders of SHGs of Nagaon districts of Assam, India only. Information through questionnaires were collected during first half of 2012 i.e. from March, 2012 to July, 2012. Methodology: The information about the number of SHGs in respective development blocks and number of other stakeholders were obtained from the Office of DRDA, Nagaon, Assam, India. With multi-stage random sampling method, initially after collection of 116 filled up questionnaires from the respondents, editing of the data was undertaken in order to ensure the omission, completeness and consistency of the data. Finally, 100 questionnaires consisting 44 SHG group members, 12 Financial, 10 Donors and 34 promoters were selected. The questionnaire was personally administered to all direct Original Research Article
British Journal of Economics, Management & Trade4(4): 487-522, 2014
SCIENCEDOMAIN internationalwww.sciencedomain.org
Stakeholders’ Perception on Self Help Group’sQuality Parameters: A Psychometrics Analysis
Sanjay Kanti Das1* and Amalesh Bhowal2
1Department of Commerce, Lumding College, Lumding, Nagaon, Assam-782447, India.2Department of Commerce, Assam University, Diphu Campus, Karbi Anglong,
Assam-782462, India.
Authors’ contributions
This work was carried out in collaboration between all authors. Author SKD designed thestudy, managed the literature searches, developed the scale, performed the statisticalanalysis and wrote the first draft of the manuscript. Author AB reviewed the scale andstatistical tools used in the study. All authors read and approved the final manuscript.
Received 26th October 2013Accepted 13th December 2013
Published 2nd January 2014
ABSTRACT
Aims: The main objective of this paper is to assess the opinion of the direct stakeholders(i.e. Promoters, Donors, Financial Institutions and Group itself) of SHGs regarding theparameters (like design, governance, operational, impact etc.) to be considered whileassessing the quality of SHGs.Study Design: The study was exploratory in nature with Meta Analysis as well asPsychometric Approach based on empiricism.Place and Duration of Study: The present study covers all the direct Stakeholders ofSHGs of Nagaon districts of Assam, India only. Information through questionnaires werecollected during first half of 2012 i.e. from March, 2012 to July, 2012.Methodology: The information about the number of SHGs in respective developmentblocks and number of other stakeholders were obtained from the Office of DRDA,Nagaon, Assam, India. With multi-stage random sampling method, initially after collectionof 116 filled up questionnaires from the respondents, editing of the data was undertakenin order to ensure the omission, completeness and consistency of the data. Finally, 100questionnaires consisting 44 SHG group members, 12 Financial, 10 Donors and 34promoters were selected. The questionnaire was personally administered to all direct
Original Research Article
British Journal of Economics, Management & Trade, 4(4): 487-522, 2014
488
stakeholders except Group members. Some questionnaires were collected directly by theresearcher on face-to-face method and some of them were collected by arrangingmeetings at village level. In order to gain an in-depth understanding on the research topicspecially structured questionnaires were prepared and were later judged by groups ofcontent judges and finally it was pilot tested. Further, the data collected through thequestionnaires were analysed through measures of descriptive statistics like mean,median and standard deviation. Chronbach’s alpha, one sample Kolmogorov- SmirnovTest, Shapiro-Wilk Test, Kruskal Wallis Test and Eta Squared Test were also applied inanalysing and interpreting the data.Results: It was observed from KW Test that there exists enough evidence to concludethat there is a no difference among the opinion of the direct stakeholders of SHGsregarding the parameters to be considered while assessing the quality of SHGs. Further,to investigate the degree of association, Eta Squared test was conducted and it indicateslow a level of association.Conclusion: It can be discerned that Groups of QAP-I covering feeling of homogeneity/solidarity, member awareness about financial, transactions involvement in village issuesetc. are the statements where there are no differences of opinion amongst thestakeholders while Groups of QAP-II where differences of opinion exists amongst thestakeholders exists and are considered more decisive statements or factors influencingthe quality assessment parameters of SHG under given methodology which was alsovirtually supported by other researchers. Further, the present study also satisfies the twomodels of generalisability i.e. Statistical generalisation and transferability or readergeneralisability.
Keywords: India; micro finance; perceptions; quality parameters; self help groups;stakeholders.
1. INTRODUCTION
It has been estimated that there are more than five hundred million economically active poorpeople in the world operating micro-enterprises and small businesses. Most of them do nothave access to adequate financial services. Micro finance has garnered significantworldwide attention as being a successful tool to meet this substantial demand for financialservices by low-income micro entrepreneurs. It has evolved over the past quarter centuryacross India into various operating forms and to a varying degree of success.
India now occupies a significant place and a niche in global micro-finance through promotionof the Self Help Groups (henceforth SHGs) and the homegrown SHG-Bank LinkageProgramme (henceforth SBLP) model. The Indian model offers greater promise andpotential to address poverty as it is focused on building social capital through providingaccess to financial services through linking with the mainstream.
India’s SHG movement has emerged as the world’s largest and most successful network ofCommunity Based Organisations. It is predominantly a women’s movement. The SBLP,which is the India’s own innovation has proved to be one of the most effective povertyalleviation and women empowerment programmes. As per National Bank for Agriculture andRural Development (hence forth NABARD’s) micro finance report by March 2012, 7.959millions SHGs, with an estimated membership of 97 millions, have savings accounts in thebanks, with aggregate bank balance of Rs. 65510 millions. Over 4.354 million SHGs haveloan accounts with total loan outstanding of Rs. 363400 millions (Table 1). However, there
British Journal of Economics, Management & Trade, 4(4): 487-522, 2014
489
remain regional disparities in the growth of the SHG movement with limited progress ineastern and western regions of India (NABARD, 2012).
Table 1. Overall progress of SHG bank linkage programme in India
Particulars 2009-10 2010-11 2011-12No. of SHGs Savings linked 6953250 7461946 7960349Savings amount in SB Account (Rs. in millions) 61987.1 70163 65514.1Bank loans disbursed to SHGs during the year 1586822 1196134 1147878Amount disbursed during the year (Rs. in millions) 144533 145477.3 165347.7No. of SHGs having loans outstanding 4851356 4786763 4354442Amount of loan outstanding (Rs. in millions) 280382.8 312211.7 363400Amount of Gross NPAs against SHGs 82304 147411 221273
Source: Status of Microfinance in India, 2009-10, 2010-11; 2011-12 & NABARD’s Publication Status ofMicrofinance in India 2011-12
The reasons for such spectacular growth of SHG movement in general and SHG banking inparticular are many. Some of them include a) NABARD’s policy guidance and capacitybuilding role; b) support from many departments and agencies of Central and StateGovernments; banking and financial institutions and bilateral and multilateral supportinstitutions; and c) innovations and pioneering work of local, national and international NGOsand United Nation agencies.
A rapid growth has been observed in the SBLP during the last decade and particularly in thelast few years. While the numbers in the SHG movement is quite impressive, there is a lackof quality in the movement [1]. Centre for Micro Finance-NABARD, [2] also expressed similarviews and observed that there are quality and sustainability issues of the SBLP that stillneed to be addressed. One concern is that the target base approach and profit motivesignore the quality of the SHG entities themselves. Also, the approach lacks an enablingenvironment that can drive and expand the scope of livelihood options for SHGs.
1.1 Why Quality Assessment of Self Help Groups in India?
The main purpose of this section is to evaluate performances, quality and sustainability ofSHG in India is to give a proper orientation and perspective to the present work. It isreported in many studies that due to the fast growth of the SBLP in India, the quality ofSHGs has come under stress Sa-Dhan[i], [3]. Quality of SHGs is considered as one of thechallenges and how to ensure the quality of SHGs in an environment of exponential growthis one of the top most discussion among the policy makers and users of micro finance. Atthe same time the SHG movement and SHG banking programme are facing number ofchallenges [4]. These includes a) uneven growth across the country and social andeconomic categories; b) low quality SHGs; c) inadequate funding for the promotion and on-lending; d) conflicting policy environment; e) inadequate capacity building infrastructure; f)severe shortage of quality human resources etc. Significant financial investment andtechnical support is required for meeting these challenges [5]. Thirugnasambantham [6]observed that the main problems associated with the SHG movement in India includes
iSa-Dhan, the Association of Community Development Financial Institutions. Sa-Dhan’s mission is to build the fieldof community development finance in India to help its member and associate institutions to better serve low-incomehouseholds, particularly women, in both rural and urban India, in their quest for establishing stable livelihoods andimproving quality of life. (For details, see http://www.sa-dhan.net/Adls/Microfinance/DiscussionPaperSeries-2.pdf.)
British Journal of Economics, Management & Trade, 4(4): 487-522, 2014
490
disintegration of groups, misuse of loans by animators, political interference, and mentalityfostered by debt-waiver scheme, wherein people think that loans will be written off.Study on “Quality and Sustainability of SHGs in Assam” sponsored by NABARD and AndhraPradesh Mahila Abhivruddhi Society (APMAS) which is mostly considered as the first stepin the NABARD-APMAS collaboration for SHG quality improvement in three lagged states ofIndia and reported the poor quality of SHGs in Assam in particular[7]. Bhartiya SamruddhiInvestments and Consulting Services (BASICS), [8] examined the deterioration in the qualityof SHGs by a variety of factors including a) the intrusive involvement of governmentdepartments in promoting groups, b) inadequate long-term incentives to NGOs for nurturingthem on a sustainable basis and c) diminishing skill sets on part of the SHG members inmanaging their groups. While studying the quality of SHGs, BASICS, 2007 pointed out poorquality of SHGs and argue how to ensure the quality of SHGs in an environment ofexponential growth. The study observed that due to the focused growth of the SBLP, thequality of SHGs has come under stress (similar experience is also shared in the studies like[9-12]. These features are reflected particularly in indicators such as the poor maintenanceof books and accounts, irregular meeting, high cost, low recovery rate etc. At the same time,other recent evaluation studies and research findings observed the poor qualities of SHGs inthe country like India [13-20]. The findings of other micro-studies [21-28] on SHGsperformance also reflects the miserable state of quality of SHGs in different parts of India.Such revelations are quite alarming as quality of SHGs has a direct bearing on the futureprospects of the SHG movement in India.
It is reported in many studies that the target-based approach both for formation of SHGs andcredit linkage has been worrying factor which had its own negative implications on thequality of SHGs [29-32]. In the game of ensuring larger outreach, the challenge remains forlarge Government programmes promoted by key anchoring agencies like Department ofWomen and Child Development (DWCD), Department of Panchayat and Rural Development(which happens to take a lion’s share in terms of number of SHGs promoted) etc. of theGovernment to balance the quality of SHGs while broadcasting of SHGs over wider area[33]. It is observed that the situation seems to be running out of control now, as in the madrush to promote SHGs (to reach numbers) quality aspects has been largely ignored[34]. Theperception of leading SHG promoters is that very few promoters have any clarity about theobjectives and the long-term trajectory of the SHGs [35]. Most SHGs are promoter drivencollectives that are at best joint liability groups and at worst formations to access subsidies[36]. Therefore, very few SHGs have been groomed as autonomous institution that canintermediate on behalf of members with banks and public agencies.
It is viewed that many studies were made during the years but only a few quality assessmentstudies on SHGs were made in India in general and Assam in particular. However, until datethe assessment tools that are devised by different agencies for different purposes anddifferent set of users. The present study is very different from earlier studies wherein theperceptions of different direct stakeholders about the quality assessment parameters areassessed to find out a common understanding about the variables to be used whileassessing quality of SHGs.
1.1 Indicators Used for Quality Assessment for Self Help Groups in India
From the above discourses, it is clearly discernible that quality is the major challenge thatthe SHG movement is confronted with at this point of time in India. A large number ofbankers, District Rural Development Agency (DRDA) officials and NGOs are using theCritical Rating Index (CRI) developed by NABARD’s leadership to promote bank linkage and
British Journal of Economics, Management & Trade, 4(4): 487-522, 2014
491
for offering other government avenues. The CRI [ii] basically consists of two sets ofvariables, viz. Governance and systems related variables and financial variables.Governance related parameters are periodicity of meetings, attendance in the meetings,decision making process in the meeting, observation of norms, saving and loan installmentcollection methods, lending procedure, rotation of leadership, book keeping, etc. Financialparameters include periodicity and regularity of saving, use of savings for internal lending,lending rates, lending norms, regularity in loan repayment, etc.
SHG Performance Measurement Tool [37] helps the Self Help Promoting Institutions(SHPIs) to measure the quality of SHGs and to identify the areas of strengths andweaknesses of SHGs that would in turn help them to design their capacity building initiativesfor SHGs in a more focused and cost effective manner. This tool also helps banks tounderstand and assess SHGs performance in the required detail for credit linkage. Tomeasure the performance of SHGs, seven broad indicators such as group constitution,organisational discipline, organisational systems, financial management and performance,external linkages, activities undertaken by group/members and self-reliance in managingaffairs had been taking into account. Sa-Dhan [38] made a comparative study of assessmenttools developed by various organisation viz. NABARD, BASICS, Mysore Resettlement andDevelopment Agency (MYRADA), Cooperative for Assistance and Relief Everywhere(CARE), APAMAS etc. and have identified eight broad thematic areas with various indicatorsand their benchmarks. The study identifies eight broad major indicators viz. Groupconstitution, orgnisational discipline, organisational systems, financial management, creditpolicy, external linkage etc., to access the quality of SHGs. Reddy [39] observed that thestate of SHGs identifies the key areas of weakness which undermine the sustainability ofSHG movement. He identified the major areas such as financial management, governanceand human resource ranges from weak to average quality for a majority of SHGs. APMAS[40] addressed a wide range of issues including cases of dropouts from SHGs and internalpolitics, and issues of social harmony and social justice, community actions, book-keepings,equity, defaults and recoveries and sustainability of SHGs. Sen & Sircar [41] conducted astudy on SHGs in West Bengal keeping in view the regularity of meetings, participation ofmembers, group management, regularity of savings, loan disbursement, loan recovery,accounts and records, links with Panchyat Raj Institutions, livelihood engagement and socialaction as the indicators of quality assessment of SHG. In another study of Centre of MicroFinance [42] entitled ‘Feasibility Study of a Special Purpose Vehicle (SPV) for SHG financingthrough SHG Institutions’ which indentified sixteen variables to access the SHGs quality viz.Feeling of homogeneity/ solidarity, velocity of internal lending, governance issues,attendance in meeting, member awareness about financial, transactions involvement invillage issues etc. Roy [43] assessed the quality assessment of SHGs in West Bengal usingtwenty indicators like group meeting, members’ participation, group discipline, savings,micro-credit, financial management, economic and social initiatives and linkages withinstitutions. Haryana Community Forestry Project [44] assessed the quality of SHGs in aself-style way considering nine broad indicators which includes organisational capacity,saving and credit, financial management, micro-enterprises, skill development, awareness &attitudes, empowerment & influence, networks & linkages and plans & visions. Bhanawat[45] pointed out that quality of SHGs and the SHG programme should always be prioritizedoverquantity. Nirantar Charter for SHG (2008[iii]) recommended that all promoting agencies
iiNABARD CRI (www.apmas.org/RatingTools.aspx)iiiThis Charter was developed and finalised by over 200 civil society groups/development practitioners/researchers/policy makers in various meetings and workshops held in Hyderabad (2007), Lucknow (2007), New Delhi (2007),
British Journal of Economics, Management & Trade, 4(4): 487-522, 2014
492
are responsible for the outcome and performance of SHGs. Further, this Charterrecommended that indicators for rating SHGs quality and performance should include socialaspects, besides institutional and financial one. Sharma [46] argued that quality aspects ofSHGs, literacy goals, and social focus of community mobilisation efforts need to be stressedwhile assessing the quality of SHGs. Further, social indicators need to be mandatorilyincluded in SHG quality assessment parameters. Parashar [47] believed that quality ofSHGs should be stressed upon more than their numbers (i.e., quantity). Quality parameterswould include not just financial and physical performance of the group, but also parametersto assess economic and livelihood goal achievement, social status improvement andentitlement access facilitation. Shetty [48] in his study constructed a sustainability indexcomprising of eight indicators viz. leadership, regularity of meetings, decision making, recordkeeping, accounting and monitoring, network and membership, conflict resolving capacityand dropout rate etc. Sahu [49]assessed the quality of SHG in North-west India based onthirteen indicators covering group formation, homogeneity in economic status, social status,group processes etc. on which the researcher given weightage.
ENABLE, 2012[iv] identified the key variables in the SHG grading tool and pointed to thefact that book-keeping is a serious weakness in more than half of the sample SHGs. It isreported that more than two-thirds of the SHGs do not pay honorarium to the SHG book-keepers and many of the book-keepers have not received adequate training andhandholding support in writing the books properly and accurately. Another area of concern inthe SHG movement is democracy within the groups. Though many SHGs do talk aboutleadership rotation and regular elections in SHGs, less than half of the sample SHGspracticed that and the situation is not very different in other SHGs. Inadequate book-keepingcoupled with leadership rotation not being practiced can seriously affect the transparencyand accountability in SHGs.
Therefore, it is observed that several rating systems for micro-finance interventions andSHGs have been developed in the past. However, most of these were restricted tounderstanding the creditworthiness of SHGs and employed indicators on performance onbasic group functions and credit absorption capabilities. Social empowerment and behavioralaspects of SHG functioning rarely found a place in the rating system. Therefore, in this studyan effort is taken to identify the variables to be considered while assessing the quality ofSHGs.
1.3 Operationalising the Concepts
Since all these rating tools anlysed in the earlier sections speak different languages inassessing the quality of SHGs. Feeling of homogeneity/ solidarity, velocity of internallending, governance issues, attendance in meeting, member awareness about financial,transactions involvement in village issues, organisational capacity, savings and credit,financial management, micro enterprise development, awareness and attitudes, networksand linkages, and empowerment and influence etc. are the common areas which needs to
Bhopal (2008) and Nagercoil (2008). This process was facilitated by Nirantar – A Centre for Gender and Education,Delhi (www.nirantar.net).ivTo address the above challenges and to contribute to a healthy, balanced and sustainable growth of the SHGsector in the country, a National Network Enabling Self Help Movement in India (ENABLE) was formed in 2007 witha vision of vibrant self-help movement in India. To strengthen its evidence based advocacy through research,ENABLE conducted a comprehensive research study on the ‘quality and sustainability of SHGs’ in eight states, viz.Andhra Pradesh, Assam, Bihar, Gujarat, Karnataka, Maharashtra, Rajasthan and West Bengal.
British Journal of Economics, Management & Trade, 4(4): 487-522, 2014
493
be considered while assessing quality of SHGs. From the survey of literature, sixty-onevariables (Chart I) relating to quality parameters of SHGs are identified and perception ofdirect stakeholders (i.e. Promoters, Donors, Financial Institutions and Group itself) on thesevariables are assessed so as to resolve a common understanding about the qualityassessment parameters (like design, governance, operational, impact etc.). The instrument,which intended to determine the quality parameters of SHGs, i. e. ‘Scale for DeterminingQuality Parameters of Self Help Group’s’ consists of 61 items referring to 8 different qualitysubscales, which include (a) Group constitutions i.e. Group formation strategy [Vision basedfunctioning of SHG (QAP-1); Gender based formation of SHG (QAP-2); Caste basedformation of SHG (QAP-3); and Duration of existence of the SHG (QAP-42)]; (b)Organisational discipline [Attendance of members of SHG’s in group meeting (QAP-18);Degree of unanimity among the members while arriving at decision in SHG (QAP-19);Division amongst members because of disagreements in meeting of SHG (QAP-20);Regularity in savings of SHG (QAP-22); Revision of mandatory savings of SHG (QAP-23);Frequency and regularity of group meetings (QAP-43); and Degree of dropout rate ofmembers of the SHG (QAP-55)]; (c) Organisational systems i.e. covering governance andmanagement control system [Pre-fixed rules and regulation for running the group (QAP-5);Codification of rules & regulations of the SHGs (QAP-6); Practice of updating rules (QAP-7);Level of awareness of members of SHG (QAP-8); Strict following of the group norms by allthe members (QAP-9); Elected group leaders and office bearers (QAP-10); Practice ofrotating leadership (QAP-11); Following of the basic accounting norms (QAP-12); Followingof scientific book keeping (QAP-13); Prescribed level of maintenance of records (QAP-14);Recording of the loans sanctioned to the SHG (QAP-15); Recording of other fundrequirements (QAP-16); Accessibility of books and accounts by the members (QAP-17);Transparency in operation of SHG (QAP-21); Practice of proper monitoring system by theSHG (QAP-39); Practice of quality enhancement mechanism in the SHG (QAP-40); Practiceof responsibility sharing by members (QAP-44); Observing of proper auditing system (QAP-45); Practice of up to date recording of ‘minutes’ of meetings by the SHG (QAP-56)]; (d)Financial management and performance [Ability of SHG to manage different rate of intereston loans (QAP-25); Decision of SHG on loan sanctioning (QAP-26); Policy of keepingemergency funds by SHG (QAP-27); Loan recovery policy of SHG (QAP-28); Proper andadequate management of group funds (QAP-46); Degree of leverage of external funds of theSHG (QAP-47); Level of financial sustainability of the SHG (QAP-48); and Degree ofexposure of investment portfolio risk assumed by SHG (QAP-49)]; (e) Credit policy [Fixationof rate of interest (QAP-24); Productive purposes group loans (QAP-29); Presence of rigidinternal lending criteria (QAP-50); Strict adherence to purpose and coverage of loan by theSHG (QAP-51); Practice of the doctrine ‘all members needing loans have got them at leastonce’ (QAP-58); and Practice of the principle of ‘office bearers have taken loan only after theneed of all others has been met’(QAP-59)]; (f) External linkages [Degree of linkage withBanks & other agencies by the SHG (QAP-35); Existence of multiple agencies in grouppromotion (QAP-41); and Practice about the study of track records with lenders at the time ofloan sanctioning by the SHG (QAP-52)]; (g) Activities/ Services undertaken by groupmembers [Involvement in social and community supportive activities by SHG (QAP-32);Level of awareness of SHG members about issues of social harmony and social justice(QAP-33); and Organisation of community events by the SHG (QAP-34)]; and (h)Capabilities and achievements [Degree of participation measured in Percentage ofmembers in decision making (QAP-4); Acquiring of vocational skills by members of SHG(QAP-30); Establishment of new micro-enterprises by the SHG/members (QAP-31); Degreeof self reliance in managing social affairs by the SHG members (QAP-36); Degree of selfreliance in managing economic affairs by the SHG members (QAP-37); Degree of selfreliance in managing group affairs by the SHG members (QAP-38); Level of literacy of SHGs
British Journal of Economics, Management & Trade, 4(4): 487-522, 2014
494
members (QAP-53); Awareness level of SHG members on banking / governmentprogrammes (QAP-54); Mechanism for maintaining groups distinct identity in the community(QAP-57); Accessibility & up to date information about total group saving, interest earnedand default amount, if any by the SHG members (QAP-60); and Level of awareness aboutthe functions of cluster associations (Federations/JLG) of SHGs members (QAP-61)].
Fig. 1. Quality parameters of SHGs (QAP= Quality Assessment Parameters)Source: Designed based on survey of literature
2. MATERIALS AND METHODS
2.1 Statement of the Problem
In defining the domain of standards for the quality assessment, several issues and questionspresent themselves. These derive from the fact of the non-formal nature of SHGs, the limitedliteracy and management experience of SHG members, the large number and types of SHGpromoters with their particular agendas and methodology often operating in conflict witheach other. One modest effort has been initiated by Sa-Dhan [50] by publishing a discussionpaper on “Quality Parameters of SHGs”, wherein a lot of issues sets out in the qualityassessment of SHGs and also sets out some unresolved key issues for further discussionand research to develop quality indicators for SHGs[v]. Thus, the present study is limited toone of the unresolved issue of Quality Assessment of SHGs as raised by Sa-Dhan i.e. “Whataspects (like design, governance, operational, impact etc.) of SHG should be consideredwhile assessing the quality of an SHG?”.
vSa-dhan. Quality Parameters of SHGs: A Discussion Paper. Discussion Series 2. 2003, wherein a lot of issues areidentified and articulated a set of indicative questions to be discussed/deliberated for further understanding andconsensus building with wider stakeholders of SHG movement in India, viz. What are the distinct features of SHGvis-a-vis other form of groups that exist? Whether SHG is primarily an empowerment model or a financial model?What are the common indicators that best reflect the characteristics or quality of an SHG? What aspects (likedesign, governance, operational, impact etc.) of SHG should be considered while assessing the quality of an SHG?Whose perspective (whether promoters or donors or financial institutions or group itself) should determine thequality indicators? And so on. (www.sa-dhan.org)
British Journal of Economics, Management & Trade, 4(4): 487-522, 2014
495
2.2 Objective of the Study
The study is pursued keeping in view the following main objective
a) To assess the opinion of the direct stakeholders (i.e. Promoters, Donors, FinancialInstitutions and Group itself) of SHGs regarding the parameters (like design,governance, operational, impact etc.) to be considered while assessing the quality ofSHGs.
2.2 Research Hypotheses
Given the survey of literature and objective, the study is pursued to test the followingstatistical hypothesis:
H1: There is significant association in the opinion of the direct stakeholders (Promoters,Donors, Financial Institutions and the Group members) of SHGs regarding theparameters to be considered while assessing the quality of SHGs.
2.3 Methodology
The study adopted both exploratory vis-a-vis descriptive study design that was crucial incapturing the socio-economic characteristic of the study groups such as demographic data,economic status, social benefits and entrepreneurial activities. As explained by Mugenda,research design helped in collecting data concerning behaviour, attitude, values andcharacteristic [51]. Further, the study adopted the approaches of Meta Analysis [vi] as well asPsychometric Approach [52] based on empiricism. Psychometrics refers to the measurementof abilities, traits and attitudes with questionnaires and tests. It is the field of study concernedwith the theory and technique of psychological measurement, which includes themeasurement of knowledge, abilities, attitudes, personality traits, and educationalmeasurement. Again, Meta-analysis is the use of statistical methods to combine results ofindividual studies. Meta-analysis is a systematic review of a focused topic in the literaturethat provides a quantitative estimate for the effect of a treatment intervention or exposure.Meta-analysis findings may not only be quantitative but also may be qualitative and revealthe biases, strengths and weaknesses of existing studies. Therefore, the present study alsofeatured both the approaches. The present study covers all the direct Stakeholders (i.e.Promoter, Donors, Financer and the Groups members) of SHGs of Nagaon districts ofAssam, India only. Some State level Micro Finance Institutions (MFIs) and SHPIs are alsocovered within the purview of the study since they have place(s) of business or directlylinked with SHGs operating in the study district. The study uses both primary data andsecondary data. The information about the number of SHGs in respective developmentblocks and number of other stakeholders is obtained from the Office of DRDA, Nagaon. Theyear of existence of SHGs and the age of the group are coded so that SHGs with one yearand above and have income generating activities were purposely selected. Similarly, thoseother direct stakeholders who are directly engaged in SHG promotion and financing areincluded in the study. In brief, multi-stage random sampling method was used for the presentstudy to collect primary data. As no such study was conducted in the context of Nagaondistrict of Assam and again the area being the native district of the scholar was purposively
viBMJ 1997, Meta-analysis: Principles and procedures; 315 doi: http://dx.doi.org/10.1136/bmj.315.7121.1533(Published 6 December 1997).
British Journal of Economics, Management & Trade, 4(4): 487-522, 2014
496
chosen for the present study. At the next level, five Development Blocks were selectedrandomly. In the later stage, three revenue villages from each of the selected Developmentblocks were purposively selected. From each revenue village, three SHG members, whowere associated actively, were selected randomly. Further, 12 Financial institutions i.e.nationalised commercial bank and RRBs (operating in the study areas); 10 Donors and 34promoters including banks, NGOs, NGO-MFI, Farmers Club and Government Departmentswere also selected randomly who were directly associated with the sampled SHGs (Table 2).After collection of 116 filled up questionnaires from the respondents, editing of the data wasundertaken in order to ensure the omission, completeness and consistency of the data[53,54]. Out of 116 questionnaires distributed during the survey, 100 were either returned bythe respondents or collected by researchers, which shows 86.21% response rate. However,considering the time and resources constraints, the sample size was fixed at 100(Considered adequate by researchers like Gorsuch [55]; Cattell [56]; Comrey & Lee s [57];Roger and Tiffany [58]; Comrey [59]; Nunnally [60]; Gorsuch [61]; Oppenhein [62]; andCoakes and Steed [63]. The questionnaire was personally administered to all directstakeholders except Group member’s category. Some questionnaires were collected directlyby the researchers on face-to-face method and some of them were also collected byarranging meetings at village level. Information through questionnaires was collected duringfirst half of 2012 i.e. from March, 2012 to July, 2012. In order to gain an in-depthunderstanding on the research topic a specially structured questionnaires were prepared.The questionnaires so drafted were circulated among seven judges (details are in section3.2). The variables used in the study have been identified from survey of literature andduring the discussions with the officials of the NABARD, the NGOs and a preliminaryinterview with the selected SHGs. Pilot test was conducted with the questionnaires so as toget the content validity. The finalised questionnaire for studying the quality assessmentparameters of SHGs was composed of two different parts: Part A wherein general profile ofthe different stakeholders (Promoters, donors, Financer and group member’s) were included& Part B contains a section keeping specific statements relating to investigate the proposedhypothesis. Part A of the questionnaire that contains four different sections (viz. Promoters,Donors, Financer and SHG members) each containing 10 to 15 different questions relatingto general and socio- economic profile of the respondents. Part B includes the statementsrelating to ‘opinion about the quality parameters’ which contains 61 variables. Sensitive andpersonal information were extracted from respondent through honest and personalinteraction between the respondent and interviewer [64]. Secondary data were collectedfrom report on Micro finance Status by NABARD, Journals and websites. The importantvariables were formulated and the relevant data collected from the field were coded andanalysed using SPSS (Statistical Package for Social Sciences) software- 20. Perceptions ofdifferent stakeholders relating to quality parameters were expressed based on 5 Point Scalewhere SA= Strongly Agree (2), A = Agree (1), NAND = Neither agree nor disagree (0), DA =Disagree (-1), & SDA = Strongly disagree (-2). Further, the data collected through thequestionnaire was analysed through the measures of descriptive statistics like mean, medianand standard deviation. Chronbach’s alpha, one sample Kolmogorov- Smirnov Test,Shapiro-Wilk Test, Eta Square Test and Kruskal Wallis Test were applied in analysing andinterpreting the data.
British Journal of Economics, Management & Trade, 4(4): 487-522, 2014
497
Table 2. Sample SHGs, NGOs, MFIs and Financial Institutions (Promoter, Donor, Financer and SHG members)
100 (Promoter= 34, Donor = 10, Financial institutions = 12 and Group members = 44)
Total Sample consists of 100 since Bank and NGO have different status and one group member declined to give information
British Journal of Economics, Management & Trade, 4(4): 487-522, 2014
498
2.4 Profile of the Study Area
The Central Assam District of Nagaon (spelled by the British as Nowgong) is one of thelargest districts of Assam. It sprawls across almost four thousand square kilometers of fertilealluvial plains and thickly forested hills. Nagaon extends from 250-45' to 260-45' NorthLatitude and 920 -33' -6" East Longitude. The district is bounded by Sonitpur district and theriver Brahmaputra in the north, West Karbi Anglong and North Cachar Hills in the south andEast Karbi Anglong and Golaghat district in the east. Lying at a distance of 123 Kilometersby road from Guwahati, Nagaon town constitutes a vital corridor linking the Upper Assamdistricts of Golaghat, Jorhat, Sivasagar, Dibrugarh, Tinsukia and the North Assam districts ofSonitpur and North Lakhimpur. Nagaon has covered total area of 3,993 sq. km. Thedemographic and micro finance profile and progress of SBLP in the study district is briefed inTable 3 and Table 4 respectively.
Table 3. Demographic and Micro finance profile of Nagaon District of Assam, India
Variables NumberTotal Population 2,826,006
1,440,307 (Males); 1,385,699 (Female)Total ST Population 89394Total SC Population 215209Male literacy 78.19%Female literacy 69.21%Population Density 711 per sq. kmTotal House Holds 378778BPL House Holds 177697BPL P/C 46.91No. of SHG Formed 24156 (Up to March 2011)Number of Gaon Panchayat as on 2011 239.Number of Anchalik Panchayat as on 2011 20Number of Zila Parishad as on 2011 11Number of Community Development Block ason 2011
18
Number of NGOs in the district[7] 1262 in Assam and 58 at NagaonNumber of NGOs participating in the linkageprogramme in the district
33
Total No. of bank branches in the district[8] 92Number of branches participating in linkageprogramme
75
Number of banks acting as SHPIs[9] 16Number of Govt./other agencies participating 42
Source: Census Report 2011 and Microfinance Status Report, NABARD 2010-11
British Journal of Economics, Management & Trade, 4(4): 487-522, 2014
499
Table 4. Progress of SHGs in Nagaon, Assam, India (As on 31st March 2011)
Promoter No. of SHGFormed
No. of SHG taken upEconomic activity
No. of Women SHGsFormed
Total* Total TotalSGSY 20590 5592 12630Asomi-MFI 24 15 22Prochesta- MFI 64 35 37RGVN- MFI 87 56 64NGO-MFISK Human WelfareAssoc.
50 27 44
Gharoa** 50 28 38Jana Chetana SamityAsom
62 24 48
Zeal Thrill Friend-shipGroup**
50 10 40
Gramya US 31 11 26Bank *** 165 56 132Farmer Club /SHG asCooperative society
258 123 168
Others including Govt.Depts.
2725 121 87
Total 24156 6098 13336*Total since 1st April, 1999;**Promoted with Banks, ***Reported from SLBC Report, March 2010.
Source: Microfinance Status Report, NABARD 2010-11, and SLBC Report, March 2010
2.5 Profile of the Respondents
This section examines the profile of sample respondent’s who are direct stakeholders ofSHGs viz. Promoters, Donors, Financial Institutions and the Group members in the studydistricts of Assam, India.
2.5.1 Socio-economic profile of Self Help Group members
2.5.1.1 Gender composition of the group members
The study consists of respondents from all groups i.e. both male and female as shown inTable 5. Out of 44 respondents belonging to Group members, 24 (54.5%) are male and 20(45.5%) are female. Sincere effort was given to cover reasonable number of members fromeach class so that study is free from gender bias. Further, it is observed from the field reportand other secondary resources that in the study area there are ample number of womenSHGs.
British Journal of Economics, Management & Trade, 4(4): 487-522, 2014
500
Table 5. Distribution of the sample respondents by gender
Group MembersGender of SHG Member Male Count 24
% of Total 54.5%Female Count 20
% of Total 45.5%Total Count 44
% of Total 100.0%
2.5.1.2 Age composition of the of the group members
The study consists of respondents from all age groups. Distribution of the samplerespondents by age composition is furnished in Table 6. It is pertinent from the table thatmajority of the sample respondents belong to 40 & above age group (47.7%). At the nextlevel, majority of the respondents are 30-40 years of age (27.3%), while study also covers25% of the respondents, who are below 30 years of age. Thus, it is revealed from the studythat matured aged respondents are actively participating in SHGs. The mean age of groupmember’s (respondents) is 38.66 Years while the standard deviation of age is 7.45 years.
Table 6. Distribution of the sample respondents by age
Group MembersAge of SHGMember in Years
Below 30 yr Count 11% of Total 25.0%
30-40 yr Count 12% of Total 27.3%
40 & above Count 21% of Total 47.7%
Total Count 44% of Total 100.0%
2.5.1.3 Caste of the of the group members
Caste is the social variable in India. The Scheduled Castes and Scheduled Tribes are twogroups of historically disadvantaged people recognised in the Constitution of India. TheScheduled Castes and Scheduled Tribes comprise about 16.6 percent and 8.6 percent,respectively, of India's population (or about 25.2 percent altogether, according to the 2011census. Caste persists as an important socio-psychological phenomenon in many spheres ofIndian social life and particularly within village contexts. It is argued that socio-psychologicalinsights into caste identity and caste-based stigma may complement ongoing sociologicaland anthropological research into caste10. Table 7 present distributions of the samplerespondents by caste. It is observed from the table that the study covers all caste groupsnamely General Castes, Scheduled Castes (SCs) and Scheduled Tribes (STs). It is depictedfrom the table that 50% of the sample respondents are from general category, followed by29.5% of the respondents from SC category, 15.9% of the respondents from ST categoryand the rest 4.5% of the respondents are from other category.
10Jaspal, Rusi. Caste, Social Stigma and Identity Processes. Psychology and Developing Societies. 2005; 23(2):27–62,
British Journal of Economics, Management & Trade, 4(4): 487-522, 2014
501
2.5.1.4 Social status of the group members
The study constitutes respondents from different members from all community havingdifferent social status, namely, Most Backward Community, Backward Community andForward Community. In fact, many social researchers has claimed that the SHG movementin India has beneficial impact on the members of impoverished sections of society of IndiaDistribution of the sample respondents by social status is provided in Table 8. It isdelineated from the table that largest percentage of the sample respondents belong toBackward Community (61.4%), while 31.8% of the respondents belong to ForwardCommunity and 6.8% of the respondents belong to Most Backward Community.
Table 7. Distribution of the sample respondents by caste
Group MembersCaste & Sub Caste of SHGMember
General Count 22% of Total 50.0%
Schedule Caste Count 13% of Total 29.5%
Schedule Tribes Count 7% of Total 15.9%
Others Count 2% of Total 4.5%
Total Count 44% of Total 100.0%
Table 8. Distribution of the sample respondents by social status
Group MembersSocial Status ofSHG Member
Most Backward Community Count 3% of Total 6.8%
Backward Community Count 27% of Total 61.4%
Forward Community Count 14% of Total 31.8%
Total Count 44% of Total 100.0%
2.5.1.5 Economic status of the group members
Table 9 presents distribution of the sample respondents by Economic Status of family. It isportrayed from the table that huge proportion of the sample respondents are Others i.e.wage earner, disguised labour, non-agricultural labourers, private employees, job seeker(44%), 34.1% belongs to Below Poverty Level, 15.9% belongs to Green Card Holder andonly 9.1% of the sample respondents are the Job Card Holder. Green Card Holder and JobCard Holder in India are the special categories of cardholders who get subsidised essentialcommodities.
British Journal of Economics, Management & Trade, 4(4): 487-522, 2014
502
Table 9. Distribution of the sample respondents by economic status
Group MembersEconomic Status ofSHG Member
Below Poverty Level Count 15% of Total 34.1%
Green Card Holder Count 7% of Total 15.9%
Job Card Holder Count 4% of Total 9.1%
Others Count 18% of Total 40.9%
Total Count 44% of Total 100.0%
2.5.1.6 Duration of membership in SHG of the group members
Table10 below depicts the number of years a sample respondent being a member of theSHG. It is observed that 38.6% of the sample respondents remains member of a SHGduring 1-4 years, 34.1% of the respondents are members of SHG during 4-5 years, 18.2%of the respondents are members of SHG more than 6 years while only 9.1% of therespondents are members of SHG during 5-6 years.
Table 10. Distribution of the sample respondents by duration of membership
Group MembersDuration of Membership inSHG
1-4 yr Count 17% of Total 38.6%
4-5 yr Count 15% of Total 34.1%
5-6 yr Count 4% of Total 9.1%
Above 6 yr Count 8% of Total 18.2%
Total Count 44% of Total 100.0%
2.5.1.7 Education level of the group members
Table 11 shows distribution of the sample respondents by educational level. It is interestingto note from the table that only 45.5% of the sample respondents are above 10th Standardand the rest of the respondents are either neo literates or literates. The study comprises25% of the respondents, who are neo-literates i.e. 10th Standard. It is found from the tablethat 9.1% of the respondents among literates have completed above primary education butless than 10th standard. Of the sample surveyed, 20.5% of them have studied up to primaryeducation level.
British Journal of Economics, Management & Trade, 4(4): 487-522, 2014
503
Table 11. Distribution of the sample respondents by education level
Group MembersEducational Level of SHGMember
Primary Count 9% of Total 20.5%
Below 10th Std. Count 4% of Total 9.1%
10th Std. Count 11% of Total 25.0%
Above 10th Std. Count 20% of Total 45.5%
Total Count 44% of Total 100.0%
2.5.1.8 Annual income of the group members
Distribution of the sample respondents by annual income is presented in Table 12. It isinferred from the table that annual income of the majority of the sample respondents rangesup to Rs. 50, 000 (INR) (56.8%). At the next level, 43.2% of the sample respondents’ annualincome of the sample respondents ranges from Rs. 50,000 - Rs. 0.1 million (INR).
Table 12. Distribution of the sample respondents by annual income
Group MembersAnnual Income of SHGMember
Upto Rs. 50 Thousand Count 25% of Total 56.8%
Rs. 50 Thousand - Rs. 0.1million
Count 19% of Total 43.2%
Total Count 44% of Total 100.0%
2.5.2 Profile of other direct stakeholder of SHGs
“Stakeholders” means the persons or institutions with whom any stake or interest is vestedor created to facilitate the promotion of SHG movement, which shall include the regulators,promoters, donor, financier, educators and facilitators of the SHG movement. Majorstakeholders in SHGs are, therefore includes all SHPIs i.e. Promoter, Donor, Financier andthe SHGs itself.
Since from survey of literature and field study, it is observed that there is no specificboundary regarding the nature and functioning of Self Help Promoting Institutions (SHPIs). Itis observed that an SHPI can act as both Promoter & Donor. Similarly, Governmentdepartments are also acting both promoter and Donor vis-a-vis financier. Therefore, theinvestigator collected information from such stakeholders who performed two or three taskssuch as promoter, donor and financier, through separate sets of questionnaire to obtain theirperceptions on different status.
SHPIs, whether Farmers club, NGOs, banks or State governments, have been playing a vitalrole in promoting, nurturing and sustaining the SHG programmes under SBLP in Assam. Themajor promoter of SHGs in the study districts are District Rural Development Agency (forSGSY scheme), Banks and NGOs. A few NGO-MFI are also promoting SHGs in the studydistrict. In this study respondent as promoter includes some officials of NGOs such asASOMI, Prochesta-MFI, RGVN-MFI Commercial banks, Rasthiya Krishi Vighyan Yojana,
British Journal of Economics, Management & Trade, 4(4): 487-522, 2014
504
State Institute of Rural Development (SIRD), DDM-NABARD, ASFABC, AgricultureDepartments, Farmers Club etc. who are engaged in SHG promotion. In this way out of 100respondents, 34 respondents belong to Promoter’s category.
“Donors and investors” encompasses a range of funding agencies, including bilateraldonors, foundations, multilateral development banks, and socially oriented private investors.While NABARD and RMK etc. remains a major donor to NGOs and SHG institutions in Indiaand have been receiving a fraction of required funds for their development. In the studydistricts NABARD, State Government under SGSY and NGO-MFIs are the major donors inSHG funding. In this study respondents belonging form Donor includes some officials ofNGO-MFI such as ASOMI, Prochesta-MFI, RGVN-MFI, Dristi Foundation, RuTAG-NE,Srimanta Sankardeb Sangstha; Officials of District Veterinary & Animal Husbandry,NABARD, NERCRMP, SIRD, Agriculture Departments etc. In this way out of 100respondents, 10 respondents comprises Donor’s category.
SHPIs include banks, NGOs, NGO-MFIs and state governments. Here, in the state and evenin the study district, SHPIs acts both Promoter and Financier. However, for the sake ofstudy, we have collected perceived opinions of different stakeholders on different scale ofcapacity, i.e. bank is considered financier, promoter and donor. In this study respondentsbelonging form Financial Institutions includes Officials of State bank of India and othernationalised commercial banks, Regional Rural Banks (RRBs) i.e. Assam Grameen VikashBank etc. In this way out of 100 respondents, 10 represented from Financial Institutions.Section below depicts the detailed profile of Promoter, Donor, and Financial Institutions thatare included in the present study.
2.5.2.1 Nature of promoting organization
Distribution of the sample respondents by nature of Promoting organisation is presented inTable 13. It is observed that majority of respondents comes from other Governmentagencies (55.9%) and Government departments (20.6%). The share of other promotingorganisation includes NGO-Universal (2.9%), NGO- Nation-hood (8.8%) and NGO-Regionhood (5.9%). Therefore, it may also be concluded that a large variety of institutions that areengaged in the promotion of SHGs in the study districts are promoted by other governmentagencies i.e. District Rural Development Agencies (Saryana Gayanti Sawrojgar Yojana/SGSY) who is the major promoter of SHG in the study district.
Table 13. Distribution of the sample respondents by nature of promoting organisation
Promoter
Nat
ure
of P
rom
otin
gO
rgan
isat
ion
Govt. Depts Count 7% of Total 20.6%
Other Govt. Agencies Count 19% of Total 55.9%
NGO- Universal Count 1% of Total 2.9%
NGO- Nation hood Count 3% of Total 8.8%
NGO-Region hood Count 2% of Total 5.9%
NGO- Statehood Count 2% of Total 5.9%
Total Count 34% of Total 100.0%
British Journal of Economics, Management & Trade, 4(4): 487-522, 2014
505
2.5.2.2 Place of location of stakeholders
Distribution of the sample respondents by place of location of stakeholders is presented inTable 14. It is observed that majority of respondents belonging to Promoter located in Assam(52.9%), 41.2% of the respondents belonging to Promoter originated from outside North EastRegion (NER) while 5.9% of the respondents belonging to Promoter originated from OutsideAssam but within NER. Similarly, majority of respondents belonging to Donor located inAssam (60%) and equal number of respondents belonging to Donor originated from outsideNER and from Outside Assam but within NER (20% each). Further, it is observed thatmajority of respondents belonging to Financial Institutions have functioning at all India level(66.7%) while 33.3% of the respondents belonging to Financial Institutions are originatedwithin Assam. However, majority of stakeholder have originated from Assam (50%), 7.14%respondents from other states of NER of India and 42.86% respondents whose existence isflourished at all India level.
Table 14. Distribution of the sample respondents by place of location where fromstakeholders functioning
Stakeholders Category TotalPromoter Donor FI
Plac
e of
Loca
tion
Assam Count 18 6 4 28% of Total 52.9% 60.0% 33.3% 50%
OutsideAssam butwithin NER
Count 2 2 0 4% of Total 5.9% 20.0% 0 7.14%
Outside NER Count 14 2 8 24% of Total 41.2% 20.0% 66.7% 42.86%
Total Count 34 10 12 56% of Total 100.0% 100.0% 100.0% 100.0%
2.5.2.3 Nature of programme/ project of stakeholders
Distribution of the sample respondents by nature of programme is presented in Table 15. Itis observed that majority of respondents SHGs are promoting or linked with SGSY (53.33%),while 60.71% of respondents linked other programmes. Further, it is observed that majorityof the respondents belonging to Promoter and Donor connected with others programme i.e.not connected with SGSY while cent percent financial institutions are connected withGovernment sponsored SGSY scheme.
Table 15. Distribution of the sample respondents by nature of programme ofstakeholders
Stakeholders Category TotalPromoter Donor FI
Nam
e of
Prog
ram
me
SGSY Count 19 3 12 34% of Total 55.9% 30.0% 100.0% 60.71%
Others Count 15 7 0 22% of Total 44.1% 70.0% 0 39.29%
Total Count 34 10 12 56% of Total 100.0% 100.0% 100.0% 100.0%
British Journal of Economics, Management & Trade, 4(4): 487-522, 2014
506
2.5.2.4 Nature of promotion by stakeholders
Distribution of the sample respondents by nature of promotion is presented in Table 16. It isobserved that majority of respondents promoting or linked with financial assistance(53.57%), while 46.43% of respondents linked both financial & non-financial i.e. financial andtraining. Further, it is observed that majority of the respondents belonging to Donor categoryare connected with financial and non-financial assistance (90%) while 91.7% of respondentsbelonging to Financial Institutions are provided only financial assistance.
Table 16. Distribution of the sample respondents by nature of promotion bystakeholder’s category
Stakeholders Category TotalPromoter Donor FI
Nat
ure
ofP
rom
otio
n Financial Count 18 1 11 30% of Total 52.9% 10.0% 91.7% 53.57%
Both Count 16 9 1 26% of Total 47.1% 90.0% 8.3% 46.43%
Total Count 34 10 12 56% of Total 100.0% 100.0% 100.0% 100.0%
2.5.2.5 Recovery percentage of SHG promoted by stakeholders
Distribution of the sample respondents by recover percentage of SHG promoted ispresented in Table 17. It is observed the table that majority of respondents from allcategories of stakeholders (63.64%) whose recovery percentage is ranged within 50%-75%.Further, it is observed that 16.7% respondents belonging to financial institutions whoreported recovery percentage is above 75%.
Table 17. Distribution of the sample respondents by recovery percentage of SHG
Stakeholders Category TotalFIs Donor
Rec
over
yPe
rcen
tage
Below 25% Count 0 0 0% of Total 0% 0% 0%
25-50% Count 0 6 6% of Total 0% 60.0% 27.27%
50-75% Count 10 4 14% of Total 83.3% 40.0% 63.64%
Above 75% Count 2 0 2% of Total 16.7% 0% 9.09%
Total Count 12 10 22% of Total 100.0% 100.0% 100%
2.5.2.6 Impact Assessment by Stakeholders
Distribution of the sample respondents by compliance of impact assessment is presented inTable 18. It is observed from the table that 21.43% of respondents from all categories ofstakeholders conducted impact assessment. Only 50% of Donor and 20.6% of respondentsbelonging to Promoter reported that they conducted such impact assessment.
British Journal of Economics, Management & Trade, 4(4): 487-522, 2014
507
Table 18. Distribution of the sample respondents by impact assessment
Stakeholders Category TotalPromoter FIs Donor
Impa
ctAs
sess
men
t No Count 27 12 5 39% of Total 79.4% 100.0% 50.0% 69.64%
Yes Count 7 0 5 12% of Total 20.6% 0% 50.0% 21.43%
Total Count 34 12 10 56% of Total 100.0% 100.0% 100.0% 100.0%
2.5.2.7 Quality Assessment Conducted by Stakeholders
Distribution of the sample respondents by compliance of quality assessment is presented inTable 19. It is observed from the table that 32.14% respondents from all categories ofstakeholders conducted quality assessment. Only 32.4% of promoter respondents and 25 ofFinancial Institutions respondents and 40% of Donor respondents reported that they performsuch quality assessment.
Table 19. Distribution of the sample respondents by quality assessment
Stakeholders Category TotalPromoter FIs Donor
Qua
lity
asse
ssm
ent No Count 23 9 6 38
% of Total 67.6%
75.0%
60.0%
67.86%
Yes Count 11 3 4 18% of Total 32.4
%25.0%
40.0%
32.14%
Total Count 34 12 10 56% of Total 100.
0%100.0%
100.0%
100.0%
2.5.2.6 Performance assessment conducted by stakeholders
Distribution of the sample respondents by compliance of performance assessment ispresented in Table 20. It is observed from the table that 57.14% of respondents from allcategories of stakeholders conducted Performance assessment.
Table 20. Distribution of the sample respondents by performance assessment
Stakeholders Category TotalPromoter FIs Donor
Per
form
ance
Ass
essm
ent No Count 15 5 4 24
% of Total 44.1% 41.7% 40.0% 42.85%Yes Count 19 7 6 32
% of Total 55.9% 58.3% 60.0% 57.14%
Total Count 34 12 10 56% of Total 100.0% 100.0% 100.0% 100.0%
British Journal of Economics, Management & Trade, 4(4): 487-522, 2014
508
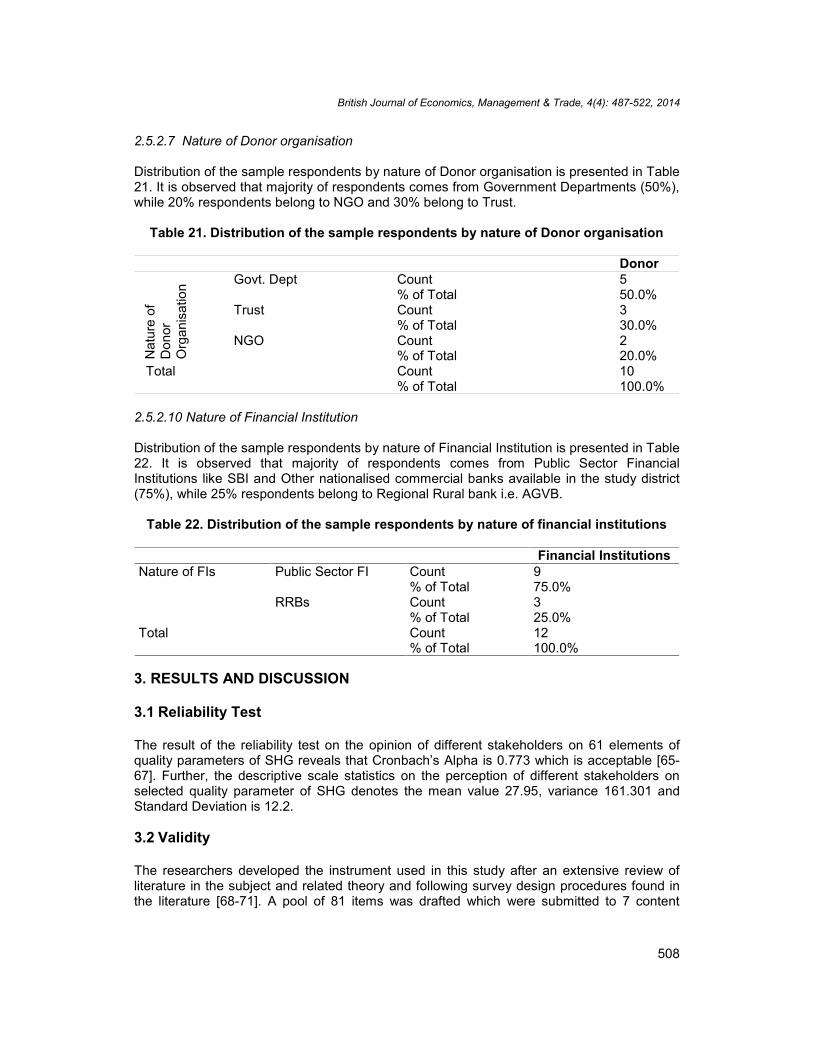
2.5.2.7 Nature of Donor organisation
Distribution of the sample respondents by nature of Donor organisation is presented in Table21. It is observed that majority of respondents comes from Government Departments (50%),while 20% respondents belong to NGO and 30% belong to Trust.
Table 21. Distribution of the sample respondents by nature of Donor organisation
Donor
Nat
ure
ofD
onor
Org
anis
atio
n Govt. Dept Count 5% of Total 50.0%
Trust Count 3% of Total 30.0%
NGO Count 2% of Total 20.0%
Total Count 10% of Total 100.0%
2.5.2.10 Nature of Financial Institution
Distribution of the sample respondents by nature of Financial Institution is presented in Table22. It is observed that majority of respondents comes from Public Sector FinancialInstitutions like SBI and Other nationalised commercial banks available in the study district(75%), while 25% respondents belong to Regional Rural bank i.e. AGVB.
Table 22. Distribution of the sample respondents by nature of financial institutions
Financial InstitutionsNature of FIs Public Sector FI Count 9
% of Total 75.0%RRBs Count 3
% of Total 25.0%Total Count 12
% of Total 100.0%
3. RESULTS AND DISCUSSION
3.1 Reliability Test
The result of the reliability test on the opinion of different stakeholders on 61 elements ofquality parameters of SHG reveals that Cronbach’s Alpha is 0.773 which is acceptable [65-67]. Further, the descriptive scale statistics on the perception of different stakeholders onselected quality parameter of SHG denotes the mean value 27.95, variance 161.301 andStandard Deviation is 12.2.
3.2 Validity
The researchers developed the instrument used in this study after an extensive review ofliterature in the subject and related theory and following survey design procedures found inthe literature [68-71]. A pool of 81 items was drafted which were submitted to 7 content
British Journal of Economics, Management & Trade, 4(4): 487-522, 2014
509
judges for review and to determine the face and content validity of the items. These judgeshad expertise in research design, survey design, micro finance management and groupdevelopment. This panel of content judges included local university faculty members andmicro finance practitioners of repute. We requested this panel to check the instrument itemsfor clarity, length, time to complete, difficulty in understanding and answering questions, flowof questions, appropriateness of questions based on the research topic, anyrecommendations for revising the survey questions (e.g., add, substituted or delete), andoverall utility of the instrument. Based on their feedback, some items were dropped andothers reworded where necessary. Further, for the final selection, the items were subjectedto relevance rating by a panel of 7 judges. The judges were asked to rate the relevance ofthe items on a four point continuum viz., very relevant, relevant, somewhat relevant and notrelevant with scores 4, 3, 2 and 1 respectively. The midpoint of the four-point continuumranging from 7 to 28, the minimum and maximum possible scores was 17.5. The items withscores above this were selected. The final scale comprised of 61 items.
3.3 Tests for Normality
The null hypothesis is that the data is normally distributed and in our case, since we haveonly 61 elements on selected scale of quality parameter of SHG, therefore the Shapiro- Wilktest is used. From the Table 23, the P-value is 0.000. We conclude that the data do notfollow a normal distribution in the population. Further, it is observed that only non-parametricTests i.e. Kruskal Wallis Test is suitable to study the significance of the main hypothesis.
Table 23. Tests of normality on overall score on perception of stakeholders of SHG onquality parameters
Kolmogorov-Smirnova Shapiro-Wilk DecisionStatistic df Sig. Statistic df Sig.
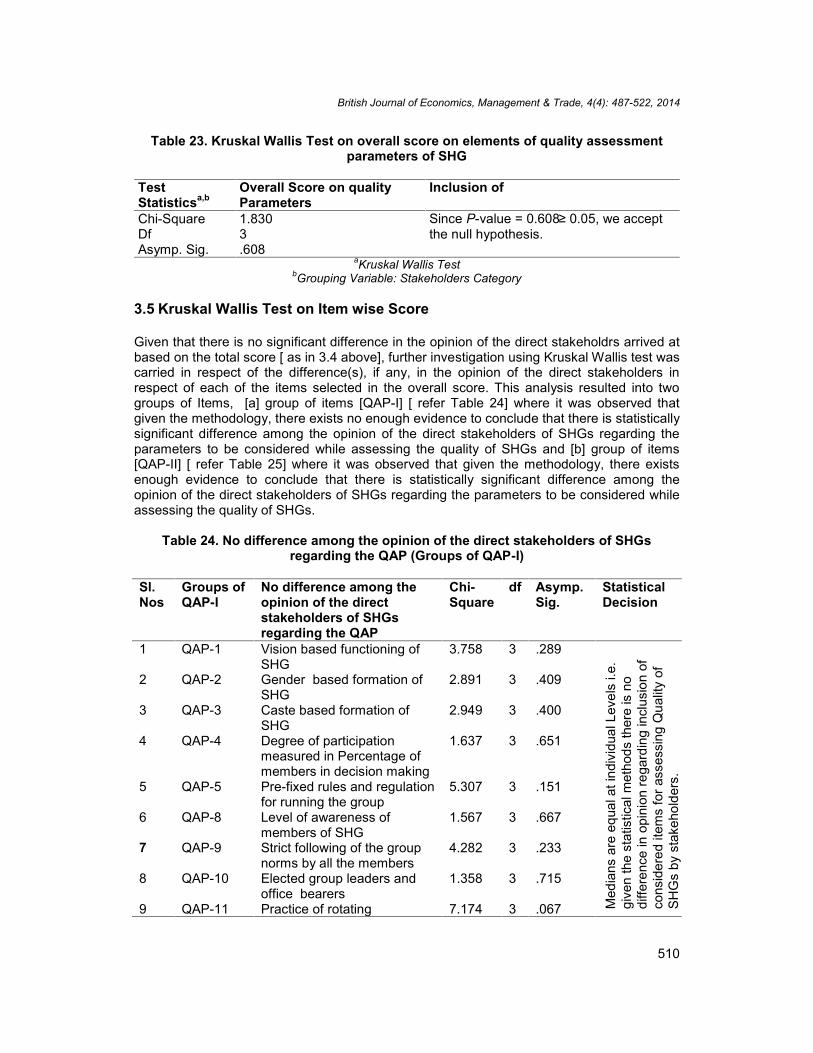
Given the methodology and the nature of the data, Kruskal Wallis Test (Non-parametricStatistical Test) is conducted to test the statistical validity of the hypothesis considered in thepresent study. The Kruskal Wallis test is used when there is one independent variable withtwo or more levels and an ordinal dependent variable. In other words, it is the non-parametric version of ANOVA and a generalised form of the Mann-Whitney test methodsince it permits comparision of parameters of interest of two or more groups based onmedian. Thus, from the Test Statistics (Table 23), at the α= 0.05 level of significance, it maybe discerned that, given the methodology, there exists no enough evidence to conclude thatthere is statistically significant difference among the opinion of the direct stakeholders ofSHGs regarding the parameters to be considered while assessing the quality of SHGs.
British Journal of Economics, Management & Trade, 4(4): 487-522, 2014
510
Table 23. Kruskal Wallis Test on overall score on elements of quality assessmentparameters of SHG
TestStatisticsa,b
Overall Score on qualityParameters
Inclusion of
Chi-Square 1.830 Since P-value = 0.608≥ 0.05, we acceptthe null hypothesis.Df 3
Asymp. Sig. .608aKruskal Wallis Test
bGrouping Variable: Stakeholders Category
3.5 Kruskal Wallis Test on Item wise Score
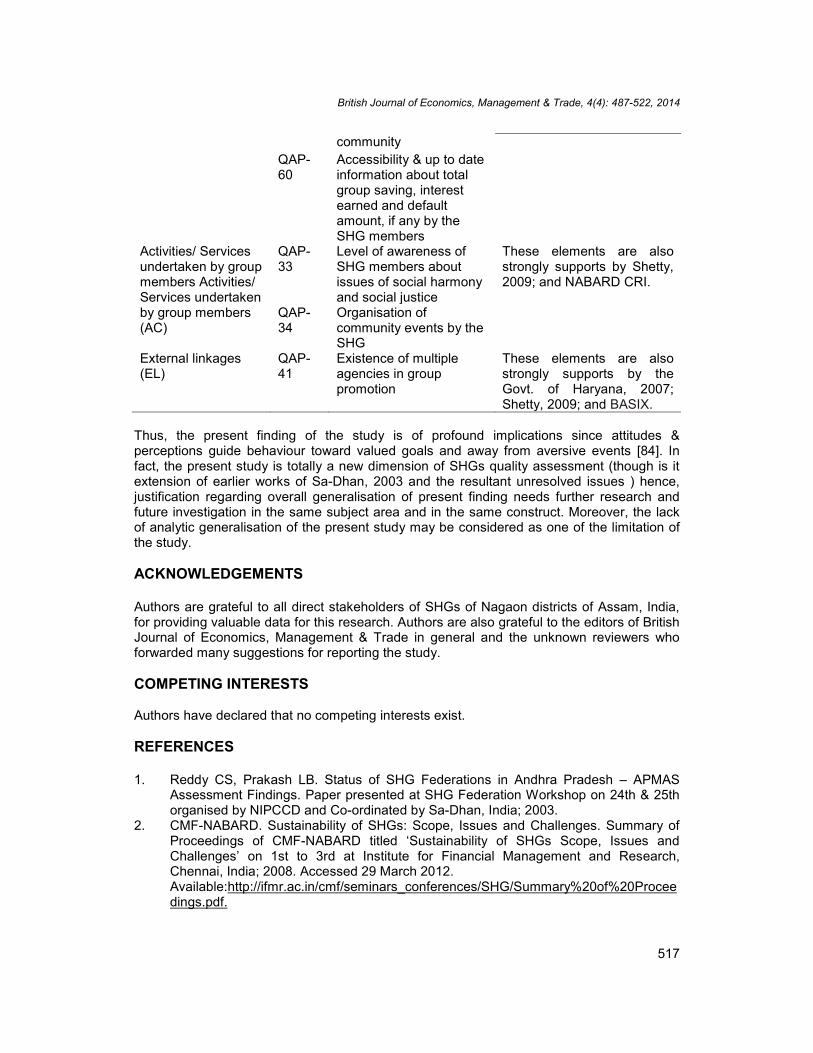
Given that there is no significant difference in the opinion of the direct stakeholdrs arrived atbased on the total score [ as in 3.4 above], further investigation using Kruskal Wallis test wascarried in respect of the difference(s), if any, in the opinion of the direct stakeholders inrespect of each of the items selected in the overall score. This analysis resulted into twogroups of Items, [a] group of items [QAP-I] [ refer Table 24] where it was observed thatgiven the methodology, there exists no enough evidence to conclude that there is statisticallysignificant difference among the opinion of the direct stakeholders of SHGs regarding theparameters to be considered while assessing the quality of SHGs and [b] group of items[QAP-II] [ refer Table 25] where it was observed that given the methodology, there existsenough evidence to conclude that there is statistically significant difference among theopinion of the direct stakeholders of SHGs regarding the parameters to be considered whileassessing the quality of SHGs.
Table 24. No difference among the opinion of the direct stakeholders of SHGsregarding the QAP (Groups of QAP-I)
Sl.Nos
Groups ofQAP-I
No difference among theopinion of the directstakeholders of SHGsregarding the QAP
Chi-Square
df Asymp.Sig.
StatisticalDecision
1 QAP-1 Vision based functioning ofSHG
3.758 3 .289
Med
ians
are
equ
al a
t ind
ivid
ual L
evel
s i.e
.gi
ven
the
stat
istic
alm
etho
ds th
ere
is n
odi
ffere
nce
in o
pini
on re
gard
ing
incl
usio
n of
cons
ider
ed it
ems
for a
sses
sing
Qua
lity
ofSH
Gs
by s
take
hold
ers.
2 QAP-2 Gender based formation ofSHG
2.891 3 .409
3 QAP-3 Caste based formation ofSHG
2.949 3 .400
4 QAP-4 Degree of participationmeasured in Percentage ofmembers in decision making
1.637 3 .651
5 QAP-5 Pre-fixed rules and regulationfor running the group
5.307 3 .151
6 QAP-8 Level of awareness ofmembers of SHG
1.567 3 .667
7 QAP-9 Strict following of the groupnorms by all the members
4.282 3 .233
8 QAP-10 Elected group leaders andoffice bearers
1.358 3 .715
9 QAP-11 Practice of rotating 7.174 3 .067
British Journal of Economics, Management & Trade, 4(4): 487-522, 2014
511
Sl.Nos
Groups ofQAP-I
No difference among theopinion of the directstakeholders of SHGsregarding the QAP
Chi-Square
df Asymp.Sig.
StatisticalDecision
leadership10 QAP-17 Accessibility of books and
accounts by the members6.627 3 .085
11 QAP-24 Fixation of rate of interest .111 3 .99012 QAP-26 Decision of SHG on loan
sanctioning1.628 3 .653
13 QAP-27 Policy of keeping emergencyfunds by SHG
4.444 3 .217
14 QAP-28 Loan recovery policy of SHG 7.746 3 .05215 QAP-33 Level of awareness of SHG
members about issues ofsocial harmony and socialjustice
4.883 3 .181
16 QAP-34 Organisation of communityevents by the SHG
2.336 3 .506
17 QAP-41 Existence of multipleagencies in group promotion
7.528 3 .057
18 QAP-42 Duration of existence of theSHG
.839 3 .840
19 QAP-49 Degree of exposure ofinvestment portfolio riskassumed by SHG
1.602 3 .659
20 QAP-57 Mechanism for maintaininggroups distinct identity in thecommunity
3.350 3 .341
21 QAP-58 Practice of the doctrine ‘allmembers needing loanshave got them at least once’
5.654 3 .130
22 QAP-59 Practice of the principle of‘office bearers have takenloan only after the need of allothers has been met’
5.277 3 .153
23 QAP-60 Accessibility & up to dateinformation about total groupsaving, interest earned anddefault amount, if any by theSHG members
5.291 3 .152
British Journal of Economics, Management & Trade, 4(4): 487-522, 2014
512
Table 25. Differences of opinion among direct stakeholders of SHGs regarding theQAP (Groups of QAP-II)
Sl.Nos
GroupsofQAP-II
Difference among theopinion of the directstakeholders of SHGsregarding the QAP
Chi-Square
df Asymp.Sig.
StatisticalDecision
1 QAP-6 Codification of rules ®ulations of the SHGs
8.308 3 .040
Med
ians
are
not
equ
al a
t ind
ivid
ual L
evel
s i.e
. giv
en th
e st
atis
tical
met
hods
ther
e is
diff
eren
cein
opi
nion
rega
rdin
g in
clus
ion
of c
onsi
dere
d ite
ms
for a
sses
sing
Qua
lity
of S
HG
s by
sta
keho
lder
s.
2 QAP-7 Practice of updating rules 13.769 3 .0033 QAP-12 Following of the basic
accounting norms17.978 3 .000
4 QAP-13 Following of scientific bookkeeping
17.388 3 .001
5 QAP-14 Prescribed level ofmaintenance of records
46.496 3 .000
6 QAP-15 Recording of the loanssanctioned to the SHG
12.745 3 .005
7 QAP-16 Recording of other fundrequirements
52.041 3 .000
8 QAP-18 Attendance of members ofSHG’s in group meeting
41.747 3 .000
9 QAP-19 Degree of unanimity amongthe members while arriving atdecision in SHG
41.747 3 .000
10 QAP-20 Division amongst membersbecause of disagreements inmeeting of SHG
13.399 3 .004
11 QAP-21 Transparency in operation ofSHG
15.373 3 .002
12 QAP-22 Regularity in savings of SHG 24.331 3 .00013 QAP-23 Revision of mandatory
savings of SHG10.386 3 .016
14 QAP-25 Ability of SHG to managedifferent rate of interest onloans
13.855 3 .003
15 QAP-29 Productive purposes grouploans
11.930 3 .008
16 QAP-30 Acquiring of vocational skillsby members of SHG
33.171 3 .000
17 QAP-31 Establishment of new micro-enterprises by theSHG/members
19.469 3 .000
18 QAP-32 Involvement in social andcommunity supportiveactivities by SHG
7.983 3 .046
19 QAP-35 Degree of linkage with Banks& other agencies by the SHG
15.470 3 .001
20 QAP-36 Degree of self reliance inmanaging social affairs by the
10.745 3 .013
British Journal of Economics, Management & Trade, 4(4): 487-522, 2014
513
Sl.Nos
GroupsofQAP-II
Difference among theopinion of the directstakeholders of SHGsregarding the QAP
Chi-Square
df Asymp.Sig.
StatisticalDecision
SHG members21 QAP-37 Degree of self reliance in
managing economic affairs bythe SHG members
7.899 3 .048
22 QAP-38 Degree of self reliance inmanaging group affairs by theSHG members
7.899 3 .048
23 QAP-39 Practice of proper monitoringsystem by the SHG
11.128 3 .011
24 QAP-40 Practice of qualityenhancement mechanism inthe SHG
18.828 3 .000
25 QAP-43 Frequency and regularity ofgroup meetings
8.043 3 .045
26 QAP-44 Practice of responsibilitysharing by members
48.543 3 .000
27 QAP-45 Observing of proper auditingsystem
56.975 3 .000
28 QAP-46 Proper and adequatemanagement of group funds
11.616 3 .009
29 QAP-47 Degree of leverage of externalfunds of the SHG
17.330 3 .001
30 QAP-48 Level of financial sustainabilityof the SHG
16.436 3 .001
32 QAP-51 Strict adherence to purposeand coverage of loan by theSHG
14.381 3 .002
33 QAP-52 Practice about the study oftrack records with lenders atthe time of loan sanctioning bythe SHG
35.709 3 .000
34 QAP-53 Level of literacy of SHGsmembers
23.558 3 .000
35 QAP-54 Awareness level of SHGmembers on banking /government programmes
26.485 3 .000
36 QAP-55 Degree of dropout rate ofmembers of the SHG
19.566 3 .000
37 QAP-56 Practice of up to daterecording of ‘minutes’ ofmeetings by the SHG
30.258 3 .000
38 QAP-61 Level of awareness about thefunctions of clusterassociations(Federations/JLG) of SHGsmembers
14.740 3 .002
British Journal of Economics, Management & Trade, 4(4): 487-522, 2014
514
In addition to the Kruskal Wallis test, Eta Square test was also applied to test the degree ofassociation (Table 26). Eta Square is a measure of association that ranges from 0 to 1, with0 indicating no association between the row and column variables and values close to 1indicating a high degree of association. Eta is appropriate for a dependent variablemeasured on an interval scale and an independent variable with a limited number ofcategories. Computed Eta measure [which is also directional measure] indicates low a levelof association [ i.e. 0.194], given that stakeholders category is independent as well asnominal data and Total Score of QAP is dependent as well as interval data. Further, the EtaSquare, which is the measure of association depicted in Table 26, indicates the low level ofassociation (0.038). Further, it is observed that association exists but when stakeholders’categories are dependent and Total score on QAP is independent, the relationship is morestrongly predictable as compared to the predictability when total score on QAP is dependentand stakeholders categories are independent (Table 26).The reasons for such low degree ofassociation can be traced into the fact that there exists two distinct groups viz. Groups ofQAP-I [consisting twenty three elements of quality parameters of SHGs where medians areequal from Table 24] and Groups of QAP-II [consisting thirty eight elements of qualityparameters of SHGs where medians are not equal from Table 25]. Not only that, it can bediscerned that Groups of QAP-II are more decisive statements or factors influencing thequality assessment parameters of SHG under given methodology.
Table 26. Measures of Association
Eta* Eta SquaredTotal Score of QAP * Stakeholders Category 194 .038Stakeholders Category * Total Score of QAP .633 .400
*Eta directional measure on total score of QAP
4. CONCLUSION
It is evident that India occupies a significant place and a niche in global micro financethrough promotion of the Self Help Groups and the homegrown SHG-Bank LinkageProgramme model mainly the SGSY approach with government intervention. A spectaculargrowth of SHG movement in general and SHG banking in particular is observed in thecountry as a whole. In fine, a rapid growth has been observed in the SBLP during the lastdecade and particularly in the last few years in Southern India along with other parts of thecountry. It is also observed that the numbers in the SHG movement is quite impressive, butthere is a lack of quality in the movement. Only a few quality assessment studies on SHGswere made in India in general and Assam in particular. However, the assessment tools thatare devised to access the quality of SHGs by different agencies for different purposes anddifferent set of users and the movement itself reached in gestation stage.
From the theoretical analysis, it is observed that the quality and impact assessment is still atthe infant stage. There is the absence of appropriate benchmark to measure quality ofSHGs. Different organisations have promoted and/or supported SHGs from a differentperspective and agenda. The outlook of SHGs largely depends on how the promoters seethem in the long run, whether they are intended to be temporary or permanent organisations.Looking across the prevalent perspectives on SHGs, it could be said that they are loadedwith wide range of expectations on the part of different stakeholders. It is observed thatdifferent stakeholders have promoted SHGs with different expectations and understanding,and have sorted different parameters of quality of SHGs. Thus, it is necessary to identify acommon ground and set appropriate benchmarks for SHGs operation. The present study is
British Journal of Economics, Management & Trade, 4(4): 487-522, 2014
515
a persuaded in this context considering the socio-economic aspects of India and theprogressive growth of Indian SHG movement.
It is observed that different quality assessment/rating tools speak different languages inassessing the quality of SHGs. Measuring the perception of different stakeholders of SHGon quality parameters, sixty-one quality assessment parameters are identified from thesurvey of literature covering feeling of homogeneity/ solidarity, velocity of internal lending,governance issues, attendance in meeting, member awareness about financial, transactionsinvolvement in village issues etc. On overall score of quality parameters (based on five pointscale) it is observed that there exists enough evidence to conclude that there is a nodifference among the opinion of the direct stakeholders of SHGs regarding the parameters tobe considered while assessing the quality of SHGs. Further, to investigate the degree ofassociation, Eta Square test was conducted which indicates low level of association. Thereasons for such low degree of association can be traced into the fact that there exist twodistinct groups’ viz. Groups of QAP-I and QAP-II. Not only that, it can be discerned thatGroups of QAP-II are more decisive statements or factors influencing the quality assessmentparameters of SHG under given methodology, as in Group-II, there exists differences ofopinion amongst stakeholder’s.
In quantitative research, generalisability is considered a major criterion for evaluating thequality of a study [72,73]. A familiar criticism of qualitative methodology questions the valueof its dependence on small samples which is believed to render it incapable of generalisingconclusions [74-77]. Indeed, generalisation represents an active process of reflection[78].Firestone, [79] developed a typology depicting three models of generalisability that providesa useful framework for considering generalisations in quantitative and qualitative studies viz.Statistical generalisation, analytic generalisation and case-to-case translation(transferability). The present study featured statistical generalisation, since it is based onrandom sampling which give every member of the population an equal chance to beincluded in the study with a determinable probability of selection [80]. The present study isconsidered to be have general acceptability as a whole to the present socio-economic set upof the study area since the sample was selected randomly from the population and therewas a low proportion of refusals and dropouts i.e. below 30% [81]. Further, the presentstudy also satisfy the third model of generalisability i.e. case-to-case translation or readergeneralisability[82] or transferability [83], since similar are also observed by otherresearchers in different contexts (external validity/ proximal similarity). The present finding ofthe study that support or contradicts with earlier studies are replicated in below Table 27 forbetter understanding.
Table 27. Reader generalisability of the present research findings
Quality Parameters Code Statements of QualityParameters
Similar observation alsoperceived while assessingthe quality of SHGs [Sahu,2010, NABARD CRI;BASIX; MYRADA; andAPMAS]
QAP-2 Gender based formationof SHG
QAP-3 Caste based formation ofSHG
QAP-42
Duration of existence ofthe SHG
Organisational NIL NIL No elements perceived in
British Journal of Economics, Management & Trade, 4(4): 487-522, 2014
516
discipline (OD) the present study under thiscategory but studies likeRoy, 2007 and assessmenttools used by NABARD;BASIX, MYRADA, APMASstrongly consider theseelements for qualityassessment for SHGs.
Organisationalsystems i.e.covering governanceand managementcontrol system (OS)
QAP-5 Pre-fixed rules andregulation for running thegroup
Elements under thiscategory that are perceivedin the present studycontradict with assessmenttools of NABARD’s CRI’sGovernance and systemsrelated variables but supportthe findings of Govt. ofHaryana, 2007, and also theassessment tools ofMYRADA and BASIX.
QAP-8 Level of awareness ofmembers of SHG
QAP-9 Strict following of thegroup norms by all themembers
QAP-10
Elected group leadersand office bearers
QAP-11
Practice of rotatingleadership
QAP-17
Accessibility of booksand accounts by themembers
Financialmanagement andperformance(FM)
QAP-26
Decision of SHG on loansanctioning
These elements are alsostrongly supports by theGovt. of Haryana, 2007, andthe assessment tools ofBASIX and MYRADA.
QAP-27
Policy of keepingemergency funds bySHG
QAP-28
Loan recovery policy ofSHG
QAP-49
Degree of exposure ofinvestment portfolio riskassumed by SHG
Credit policy (CP) QAP-24
Fixation of rate of interest Present findings alsovirtually supported by theassessment tools of BASIXand Govt. of Haryana, 2007.
QAP-58
Practice of the doctrine‘all members needingloans have got them atleast once’
QAP-59
Practice of the principleof ‘office bearers havetaken loan only after theneed of all others hasbeen met’
Capabilities andachievements (CA)
QAP-4 Degree of participationmeasured in Percentageof members in decisionmaking
Present findings alsovirtually supported by Govt.of Haryana, 2007; Shetty,2009 and BASIXassessment tools.QAP-
57Mechanism formaintaining groupsdistinct identity in the
British Journal of Economics, Management & Trade, 4(4): 487-522, 2014
517
communityQAP-60
Accessibility & up to dateinformation about totalgroup saving, interestearned and defaultamount, if any by theSHG members
Activities/ Servicesundertaken by groupmembers Activities/Services undertakenby group members(AC)
QAP-33
Level of awareness ofSHG members aboutissues of social harmonyand social justice
These elements are alsostrongly supports by Shetty,2009; and NABARD CRI.
QAP-34
Organisation ofcommunity events by theSHG
External linkages(EL)
QAP-41
Existence of multipleagencies in grouppromotion
These elements are alsostrongly supports by theGovt. of Haryana, 2007;Shetty, 2009; and BASIX.
Thus, the present finding of the study is of profound implications since attitudes &perceptions guide behaviour toward valued goals and away from aversive events [84]. Infact, the present study is totally a new dimension of SHGs quality assessment (though is itextension of earlier works of Sa-Dhan, 2003 and the resultant unresolved issues ) hence,justification regarding overall generalisation of present finding needs further research andfuture investigation in the same subject area and in the same construct. Moreover, the lackof analytic generalisation of the present study may be considered as one of the limitation ofthe study.
ACKNOWLEDGEMENTS
Authors are grateful to all direct stakeholders of SHGs of Nagaon districts of Assam, India,for providing valuable data for this research. Authors are also grateful to the editors of BritishJournal of Economics, Management & Trade in general and the unknown reviewers whoforwarded many suggestions for reporting the study.
COMPETING INTERESTS
Authors have declared that no competing interests exist.
REFERENCES
1. Reddy CS, Prakash LB. Status of SHG Federations in Andhra Pradesh – APMASAssessment Findings. Paper presented at SHG Federation Workshop on 24th & 25thorganised by NIPCCD and Co-ordinated by Sa-Dhan, India; 2003.
2. CMF-NABARD. Sustainability of SHGs: Scope, Issues and Challenges. Summary ofProceedings of CMF-NABARD titled ‘Sustainability of SHGs Scope, Issues andChallenges’ on 1st to 3rd at Institute for Financial Management and Research,Chennai, India; 2008. Accessed 29 March 2012.Available:http://ifmr.ac.in/cmf/seminars_conferences/SHG/Summary%20of%20Proceedings.pdf.
British Journal of Economics, Management & Trade, 4(4): 487-522, 2014
518
3. Sa-Dhan. Quality Parameters of SHGs: A discussion paper; 2003. Accessed 2 June2012. Available: http://www.sa-dhan.net/Adls/Microfinance/DiscussionPaperSeries-2.pdf.
4. Reddy K Raja, Reddy CS. Self Help Groups in India: A Study on Quality andSustainability. ENABLE Publication; 2012. Accessed 21 March 2013.Available: http://www.enableindia.net
5. Thorat YSP. Micro finance in India: Sectoral Issues & Challenges. Theme Paper at theHigh Level Policy Conference on micro finance in India, on 3rd to 5th at New Delhi;2005; May. Accessed 21 March 2010. Available: http://www.nabard.org/pdf/md.pdf.
6. Thirugnanasambantham. Issues and Challenges in Financing SHGs. Summary ofProceedings of CMF-NABARD titled ‘Sustainability of SHGs Scope, Issues andChallenges’ on 1st to 3rd at Institute for Financial Management and Research,Chennai; 2008. November. Accessed 29 March 2012.Available:http://ifmr.ac.in/cmf/seminars_conferences/SHG/Summary%20of%20Proceedings.pdf.
7. APMAS. Quality and Sustainability of SHGs in Assam. Sponsored by NABARD andAPMAS, Hyderabad; 2009. September. Accessed 21 March 2010. Available:http://www.apmas.org.
8. BASICS. A Study on SHG-Bank Linkage and Status of MFI in Bihar. Bihar RuralLivelihoods Promotion Society, Bihar. Bhartiya Samruddhi Investments and ConsultingServices Ltd; 2007. Accessed 29 March 2012. Available: http://www.basixindia.com
9. Reddy CS, Prakash LB. Status of SHG Federations in Andhra Pradesh – APMASAssessment Findings. Paper presented at SHG Federation Workshop on 24th & 25thorganised by NIPCCD and Coordinated by Sa-Dhan, India; 2003.
10. Devaprakash R. Balancing Quality and Quantity in SHGs in India. IBA Bulletin.2005;25-35. Accessed 2 June 2012.Available: http://www.microfinancegateway.org/.../27852_file_IBA_Aug_issue_1DE.
11. Kumar Sunil. Study on SHG Federations–Challenges and Opportunities. Centre forMicrofinance Research, Bankers Institute of Rural Development, Lucknow; 2010.Accessed 2 June 2010.Available:http://www.birdlucknow.in/doc/REPORT%20ON%20SHG%20FEDERATIONS.pdf
12. Sinha, Anand. Strengthening governance in Micro finance Institutions (MFIs) - somerandom thoughts. Keynote address at Federation of Indian Chambers of Commerceand Industry’s (FICCI) workshop on Strengthening Micro finance Institutions (MFIs) –good governance and strategic people practices at Mumbai; 2012. April. Accessed 29March 2012.Available: http://www.bis.org/review/r120430e.pdf
13. Reddy CS. SHGs: A Keystone of Micro Finance in India: Women empowerment &Social Security; 2005. Accessed 2 June 2010. Available: http://www.self-help-approach.com.
14. Sen, Manab, Sircar, Ashok. Study of SHG & MF sector in West Bengal with specialreference to CASHE. Action research project to Loka Kalyan Parishad; 2006.Accessed 29 March 2012.Available: http://www.lkp.org.in/pub/Study_Rpt/Study_SHG_MF.pdf
15. APMAS Assessment Findings. Status of SHG Federations in Andhra Pradesh; 2006.Accessed 2 June 2010. Available: http://www.microfinancegateway.org.
16. Singh, Jai Pal. PEDO’s SHG Programme Impact Assessment, A Draft Report. Centrefor Microfinance, Jaipur; 2006. Accessed 29 March 2012.Available: http://www.solutionexchange-un.net.in/mf.
British Journal of Economics, Management & Trade, 4(4): 487-522, 2014
519
17. Sharma A. Expanding outreach to underserved regions: Kick-starting micro finance inNorth-Eastern Region. Guwahati: Indian Institute of Bank Management; 2007.
18. Government of Haryana. Haryana Community Forestry Project. Self-Help GroupCapability Assessment. Forest Department, Govt. of Haryana; 2007. Accessed 2 June2010.Available:http://www.hcfp.gov.in/downloads/studies/SHG_Capability_Assessment_Study.pdf
19. Roy Durgadas. Mid-term Evaluation of the composition and working of SwarnajayantiGram Swarozgar Yojana in 24 Parganas South District, West Bengal; 2007. Accessed29 March 2012.Available: http://www. planningcommission.nic.in.
20. Sahu Gagan Bihari. SHG Bank Linkages in North West India. Lucknow: Center forMicrofinance Research, BIRD; 2010.
21. Josily, Samuel. Women Empowerment through Microfinance in Dindigul District ofTamil Nadu: An Economic Analysis. Thesis of M.Sc. (Agri.), Department of AgriculturalEconomics, University of Agricultural Sciences, Dharwad, India; 2006. Accessed 29March 2012.Available: http://etd.uasd.edu.
22. ASEED. Comparative study of SGSY and NABARD supported SHGs initiatives inNorthern India. Asian Society for Entrepreneurship Education and Development. NewDelhi, ASEED. 2007;134-43.
23. Feroz SM, Chauhan. Determinants of Repayment Performance of Self Help Groups:Empirical Evidence from India. In: Lazar.D and Malabika Deo, editors. Micro Finance–Performance Evaluation and Enterprise Development Chennai: Allied Publishers.2009;199-206.
24. Srinivasan N. Micro finance India: State of the Sector Report 2009. New Delhi,ACCESS; 2009. Accessed 2 June 2010.Available: http://www.microfinancegateway.org.
25. Henriques, Elizabeth Joey , Gaonkar, Rekha Ramesh. Micro-Credit: A study of Micro-credit Usage by SHG Members in Goa. International Journal of Research inCommerce, Economics & Management. 2011;1(3):56-60.
26. Das Sanjay Kanti. Ground Realities of Self Help Group –Bank Linkage Programme:An empirical analysis. International Journal of Research in Social Sciences.2012;2(2):464-79.
27. Das Sanjay Kanti. Best Practices of Self Help Groups and Women Empowerment: ACase of Barak Valley of Assam. Far East Journal of Psychology and Business, FarEast Research Centre. 2012;7(2):29-51.
28. Das Sanjay Kanti. Quality and Performance of Some Selected Self Help Groups inAssam. Asian Journal of Research in Business Economics and Management.2012;2(4):21-27.
29. Devaprakash R. Balancing Quality and Quantity in SHGs in India. IBA Bulletin. 2005;August. 5-35. Accessed 2 June 2012.Available: http://www.microfinancegateway.org/.../27852_file_IBA_Aug_issue_1DE.
30. Parashar DN. SHG Strengthening. Paper presented in a Round Table titled ‘A Visionfor SHGs in Rajasthan: From Social Mobilization to Social Capital”, on 30th to 31st atGold Palace & Resorts, Kukas, Amer; 2008. Accessed 2 June 2012. Available:http://www.aravali.org.in/VisionSHG.pdf
31. Bhanawat Rajendra. Financing SHG, Strengthening and Promotion. Paper presentedin a Round Table titled A Vision for SHGs in Rajasthan: From Social Mobilization toSocial Capital, on 30th to 31st at Gold Palace & Resorts, Kukas, Amer; 2008.Accessed 2 June 2012. Available: http://www.aravali.org.in/VisionSHG.pdf
British Journal of Economics, Management & Trade, 4(4): 487-522, 2014
520
32. CMF-NABARD. Sustainability of SHGs: Scope, Issues and Challenges. Seminarproceedings of the Centre for Micro Finance at the Institute for Financial Managementand Research, on 1st to 3rd at Institute for Financial Management and Research,Chennai; 2008. November. Accessed 29 March 2012.Available:http://ifmr.ac.in/cmf/seminars_conferences/SHG/Summary%20of%20Proceedings.pdf
33. Devaprakash R. Balancing Quality and Quantity in SHGs in India. IBA Bulletin.2005;25-35. Accessed 2 June 2012.Available: http://www.microfinancegateway.org/.../27852_file_IBA_Aug_issue_1DE.
34. Sa-Dhan. Discussion Paper on quality parameters of self-help groups; 2003.Accessed 2 June 2012.Available: http://www.sa-dhan.net/Adls/Microfinance/ DiscussionPaperSeries-2.pdf
35. Sinha Anand. Strengthening governance in Microfinance Institutions (MFIs) - somerandom thoughts. Keynote address at Federation of Indian Chambers of Commerceand Industry’s (FICCI) workshop on Strengthening Microfinance Institutions (MFIs) –good governance and strategic people practices on 23th at Mumbai; 2012. Accessed2 June 2012. Available: http://www.bis.org/review/r120430e.pdf
36. Reddy D Narasimha. Political Economy of Micro finance and Marginalised Groups:Implications of Alternative Institutional Strategies; 2012. Accessed 2 June 2012.Available: http://works.bepress.com/narasimha_reddy/5
37. Sa-Dhan. SHG Performance Measurement Tool. Technical Tool Series 2; 2005.Accessed 2 June 2012. Available: http://www.sa-dhan.net/Adls/Microfinance/Article
38. Sa-Dhan. Quality Parameters of SHGs: A discussion paper; 2003. Accessed 2 June2012. Available: http://www.sa-dhan.net/Adls/Microfinance/ DiscussionPaperSeries-2.pdf.
39. Reddy CS. SHGs: A Keystone of Micro Finance in India: Women empowerment &Social Security; 2005. Accessed 2 June 2010. Available: http:/ www.self-help-approach.com.
40. APMAS Assessment Findings. Status of SHG Federations in Andhra Pradesh; 2006.Accessed 2 June 2010. Available: http://www.microfinancegateway.org.
41. Sen, Manab, Sircar, Ashok. Study of SHG & MF sector in West Bengal with specialreference to CASHE. Action research project to Loka Kalyan Parishad; 2006.Accessed 29 March 2012.Available: http://www.lkp.org.in/pub/Study_Rpt/Study_SHG_MF.pdf
42. Centre of Micro Finance Research. Centre of Micro Finance Research report, Jaipur;2007. Accessed 29 March 2012.Available:Http://www.cmfraj.org/Feasibility%20study%20on%20Special%20Purpose%20Vehicle.pdf
43. Roy Durgadas. Mid-term Evaluation of the composition and working of SwarnajayantiGram Swarozgar Yojana in 24 Parganas South District (West Bengal); 2007.Accessed 29 March 2012. Available: http://wwww. planningcommission.nic.in.
44. Government of Harayana. Haryana Community Forestry Project. Self-Help GroupCapability Assessment. Forest Department, Govt. of Haryana; 2007. Accessed 2 June2010.Available:http://hcfp.gov.in/downloads/studies/SHG_Capability_Assessment_Study.pdf
45. Bhanawat Rajendra. Financing SHG, Strengthening and Promotion. Paper presentedin a Round Table titled A Vision for SHGs in Rajasthan: From Social Mobilization toSocial Capital, on 30th to 31st at Gold Palace & Resorts, Kukas, Amer; 2008. July.Accessed 2 June 2012. Available: http://www.aravali.org.in/VisionSHG.pdf
British Journal of Economics, Management & Trade, 4(4): 487-522, 2014
521
46. Sharma Jaya. Empowerment, Poverty Alleviation & Education within SHGs. Paperpresented in a Round Table titled A Vision for SHGs in Rajasthan: From SocialMobilization to Social Capital organised during 30th to 31st at Gold Palace & Resorts,Kukas, Amer; 2008. July. Accessed 2 June 2012.Available: http://www.aravali.org.in/VisionSHG.pdf
47. Parashar DN. SHG Strengthening. Paper presented in a Round Table titled A Visionfor SHGs in Rajasthan: From Social Mobilization to Social Capital, organised during30th to 31st at Gold Palace & Resorts, Kukas, Amer; 2008. Accessed 2 June 2012.Available: http://www.aravali.org.in/VisionSHG.pdf
48. Shetty Naveen K. Index of Micro finance Group Sustainability: Concepts, Issues andEmpirical Evidence from Rural India. The micro FINANCE REVIEW, Journal of theCentre for Microfinance Research. 2009;1(1):131-52.
49. Sahu Gagan Bihari. SHG Bank Linkages in North West India. Lucknow: Center forMicro finance Research, BIRD; 2010.
50. Sa-dhan. Quality Parameters of SHGs: A Discussion Paper. Discussion Series 2;2003. Accessed 2 June 2012. Available: http://www.sa-dhan.net/Adls/Microfinance/DiscussionPaper Series-2.pdf.
51. Mugenda OM, Mugenda AG. Research methods quantitative and qualitativeapproaches. Nairobi: Acts Press; 1999.
52. Michell JB. Quantitative science and the definition of measurement in psychology.British Journal of Psychology. 1997;88(3):355–83. doi:10.1111/j.2044-8295.1997.tb02641.x.
53. Zikmund WG. Business Research Methods. 7th ed. London: Imprint of ThomsonCorporation, Thomson Learning; 2003.
54. Sekaran U. Research Methods for Business: A Skill-building Approach. 3rd ed. USA:John Willey & Sons, Inc.; 2000.
55. Gorsuch RL. Factor analysis. 2nd ed. Hillsdale NJ. Lawrence Erlbaum; 1983.56. Cattell RB. The scientific use of factor analysis in behavioral and life sciences. New
York: Plenum; 1978.57. Comrey AL, Lee HBA first course in factor analysis. New York: Academic Press; 1973.58. Roger L Worthington, Tiffany A. Whittaker Scale Development Research: A Content
Analysis and Recommendations for Best Practices. The Counseling Psychologist.2006;34:806-14.
59. Comrey ALA first course in factor analysis. New York: Academic Press; 1973.60. Nunnally JC. Psychometric Theory. 2nd ed. New York: McGraw-Hill; 1978.61. Gorsuch RL. Factor analysis. 2nd ed. Hillsdale, NJ: Lawrence Erlbaum; 1983.62. Oppenheim AN. Questionnaire Design, Interviewing and Attitude Measurement.
London: Pinter Publishers; 1992.63. Coakes SJ, Steed LG. SPSS Analysis without Anguish. Brisbane: John Wiley & Sons;
1997.64. Mugenda OM, Mugenda AG. Research methods quantitative and qualitative
approaches. Nairobi, Acts Press; 1999.65. Cronbach LJ. Coefficient alpha and the internal structure of tests. Psychometrika.
74. Hamel J, Dufour S, Fortin D. Case study methods. Sage Publications, Newbury Park,CA; 1993.
75. Yin R. Case study research: Design and method. Sage Publications, Beverly Hills CA;1984.
76. Yin R. Applications of case study research. Sage Publications, Beverly Hills CA;1993.
77. Yin R. Case study research: Design and method. 2nd ed. Sage Publications, BeverlyHills, CA; 1994.
78. Greenwood DJ, Levin M. Reconstructing the relationships between universities andsociety through action research. In: N. K. Denzin & YS. Lincoln, editors. Handbook ofqualitative research. 2nd ed., Sage Publications, Thousand Oaks, CA. 2000;85-106.
79. Firestone WA. Alternative arguments for generalizing from data as applied toqualitative research. Educational Researcher. 1993;22:16–23.
80. Polit DF. Statistics and Data Analysis for Nursing Research. 2nd ed. PearsonEducation, Upper Saddle River, NJ; 2010.
81. Will G Hopkins. How to write a literature review. Sport science. 1999;3(1). Accessed30 Oct 2013. Available: http://sportsci.org/jour/9901/wghreview.html.
82. Misco T. The frustrations of reader generalisability and grounded theory: alternativeconsiderations for transferability. Journal of Research Practice. 2007;3:1–11.
83. Lincoln Y, Guba E. Naturalistic Inquiry. Sage Publications, Beverly Hills, CA; 1985.84. Baron RA. Byrne D. Social Psychology-Understanding human interaction. 16th ed.