+ All Categories
Home > Documents > Standalone - Nesco · Manubhai & Shah LLP Chartered Accountants INDEPENDENT AUDITORS' REVIEW REPORT...

Standalone - Nesco · Manubhai & Shah LLP Chartered Accountants INDEPENDENT AUDITORS' REVIEW REPORT...

Date post: 21-Jan-2020
Category:
Upload: others
View: 9 times
Download: 0 times
Share this document with a friend
3
NESCO LIMITED Registered Office : Nesco Center, Western Express Highway, Goregaon (East), Mumbai 400063 CIN N0. : L17100MH1946PLC004886 Statement of Standalone Unaudited Financial Results for the Quarter and Half Year Ended 30 September 2018 ( 2 in Lakhs) Standalone Sr. _ Quarter Ended Half Year Ended Year Ended Particulars N°- 30.09.2018 30.06.2018 30.09.2017 30.09.2018 30.09.2017 31.03.2018 (Unaudited) (Unaudited) (Unaudited) (Unaudited) (Unaudited) (Audited) Income Revenue from Operations 10,003.73 7,546.46 8,255.74 17,550.19 14,824.14 30,440.29 Other income 509.52 318.16 1,000.93 827.68 2,235.67 3,606.29 1 Total Revenue 10,513.25 7,864.62 9,256.67 18,377.87 17,059.81 34,046.58 Expenses (a) Cost of materials consumed 589.97 482.28 99.04 1,072.25 449.75 1,096.67 (b) Change in inventories of finished goods, work—in-progress and stock- in-trade 198.24 203.51 214.82 401.75 160.94 (91.43) (c) Excise duty - - 75.51 75.51 (d) Employee benefits expenses 527.58 535.02 331.99 1,062.60 625.16 1,454.09 (e) Finance cost 141.63 93.37 124.74 235.00 250.15 554.69 (f) Depreciation and amortisation expenses 303.73 297.75 270.92 601.48 507.95 1,102.73 (9) Other Expenses r 2,085.03 , 1,638.04 1,717.94 3,123.07 3,098.42 6,344.72 2 Total Expenses 3,846.18 3,249.97 2,759.45 7,996.15 5,167.88 10,536.98 3 Profit before exceptional items and tax ( 1 - 2 ) 6,667.07 4,614.65 6,497.22 11,281.72 11,891.96 23,509.60] 4 Exceptional items - - - - 5 Profit before tax 6,667.07 4,614.65 6,497.22 11,281.72 11,891.96 23,509.60 Tax Expense :- Current Tax 1,954.85 1,391.00 1,622.30 3,345.85 2,960.00 6,166.00 Deferred Tax (218.82) (408.00) 35.52 (626.82) (76.79) (407.67) Income tax for earlier year ~ - - - 82.00 t. 6 Total Tax Expense 1,736.03 983.00 1,657.82 2,719.03 2,883.21 5,840.33 L2... 7 Profit after tax for the period (5 - 6__) 4,931.04 l 3,631.65 4,839.40 8,562.69 9,008.73 17,669.27 Other Comprehensive Income (OCI) :- A. Items that will not be reclassified to Statement of Profit and Loss - - - - a. Remeasurement of defined benefit plans benefits » Net of tax - - - - 5.64 b. Net fair value gain/(loss) on investment in equity instruments through (0-09) 033 ' 0.24 - 0.14 other comprehensive income 8 Total Other Comprehensive Income (0.09) 0.33 - 0.24 - 5.78 9 Total Comprehensive Income for the period ( 7 + 8 ) 4,930.95 3,631.98 4,839.40 8,562.93 1 “9,008.73 17,§75.05 10 Paid up Equity Share Capital (Face Value 3 2/- each) 1,409.20 1,409.20 1,409.20 1,409.20 1,409.20 1,409.20 Reserves excluding Revaluation Reserves as per balance sheet of 11 previous accounting year - - 2 99,461.11 12 Basic and Diluted Earnings Per Share (in 3) (not annualised) 7.00 5.15 6.87 12.15 12.79 25.08 Segment Reporting ( f in Lakhs) Standalone __j Sr. Particulars Quarter Ended Half Year Ended Year Ended No. 30.09.2018 30.06.2018 30.09.2017 30.09.2018 30.09.2017 31.03.2018 (Unaudited) (Unaudited) _(UnauditecD (Unaudited) (Unaudited) (Audited) 1 ngent Revenue (3) Nesco IT Park 3,523.75 3,178.89 3,747.81 6,702.64 7,447.44 14,544.33 (b) Bombay Exhibition Centre 4,588.71 3,002.30 3,803.17 7,591.01 5,971.59 12,970.34 (c) Indabrator 1,026.18 653.85 704.76 1,680.03 1,405.11 2,638.13 ((1) Nesco Foods 865.08 711.42 - 1,576.50_l - 287.49H Revenue from Operations 10,003.73 7,546.46 8L255.74 17,550.19 14,824.14__' 30,440.29 e Income from investments/other income 509.52 318.16 1,000.93 827.68 2335.67 _ 3,606.29 ,_ l—l—‘lét Revenue from operations 10,513.25)1 7,_864.62_T 9,256.67 18,_377.87 l 17,059.81 34,046.58 2 Se ment Profit before tax & finance costs (a) Nesco IT Park 3,036.03 2,792.16 3,457.10 5,828.19 6,867.47 13,195.16 (b) Bombay Exhibition Centre 3,623.39 2,327.73 3,244.94 5,951.12 4,909.74 10,389.71 (c) Indabrator 12.61 (194.02) 21.21 (181.41) (61.64) 25.40 Q) Nesco Foods 156.75 151.15 - 307.90 - 4 30.36 Total 6,828.80 5,077.01 6,723.25 11,905.81 11,715.57 23,640.63 Less: Finance Costs 141.63 93.37 T. 124.74 235.00 ”—- 250.15 554.59 Add: Other Unailocable Income 463.14 206.76 956.25 669.90 2,127.49 3,373.67 Less: Other Unailocable Expenses 483.24 575.75 1,057.53 1,058.99 1,700.96 2,950.01 Operatimrofit before tax 6,667.07 4,614.65 6,497.22 11,281.72 11,891.96 23,509.60 l Segment Asses (a) Nesco IT Park 60,818.59 58,127.18 45,712.02 60,818.59 45,712.02 52,560.42 (b) Bombay Exhibition Centre 6,624.88 6,052.00 6,960.33 6,624.88 6,960.33 5,889.77 (c) Indabrator 3,231.71 3,193.33 3,776.39 3,231.71 3,776.39 3,415.45 ((1) Nesco Foods 3,082.09 3,019.06 3,082.09 3,168.02 Total Segment Assets 73,757.27 70 391.57 56,448.75 73,757.27 56,448.75 65,033.66 Unailocable Asset 52,187.55 52,211.12 54,477.16 52,187.55 54,477.16 52,839.06 Total 135,944.83 1,22,602.69 1,10,92590 125,944.83 1,10,925.90 1,17,872.72 Segment Liabilities (a) Nesco IT Park 9,543.24 8,589.57 8,401.04 9,543.24 8,401.04 7,855.54 (b) Bombay Exhibition Centre 4,489.17 4,998.61 4,827.42 4,489.17 4,827.42 3,861.40 (C) Indabrator 593.96 589.15 597.13 593.96 597.13 612.45 (0) Nesco Foods 433.73 324.39 ~ 433.73 232.19 Total Segment Liabilities 15,060.10 14,501.73 13,825.60 15,060.10 13 825.60 12,561.58 Unailocable Liabilities 3,406.06 _3,598.67 4,896.40 3&606 _ 4,896.4(fl 4,440.83 Total 18,466.17 18,100.40T 18,722.00 18,466.17 18,722.00 17,002.41 51,275.36 49,537.61 37,310.98 51,275.36 37,310.98 44,704.88 2,135.71 1,053.39 2,132.91 2,135.71 2,132.91 2,028.37 2,637.75 2,604.18 3,179.26 2,637.75 3,179.26 2,803.00 2,648.36 2,694.67 » 2 648.36 - 2,935.83 58,697.17 55,889.85 42,623.14 58,697.17 42,623.14 52,472.08 L 48,781.49 ,_ 48,612.44 49,580.76 48,781.49 49,580.76__J 48,398.23 Total 1,07,478.66 1,241,502.29 92,203.90 1,07,478.66 92,203.90 1,00,870.31
Transcript

NESCO LIMITED

Registered Office : Nesco Center, Western Express Highway, Goregaon (East), Mumbai 400063

CIN N0. : L17100MH1946PLC004886

Statement of Standalone Unaudited Financial Results for the Quarter and Half Year Ended 30 September 2018

( 2 in Lakhs)

Standalone

Sr. _Quarter Ended Half Year Ended Year Ended

ParticularsN°- 30.09.2018 30.06.2018 30.09.2017 30.09.2018 30.09.2017 31.03.2018

(Unaudited) (Unaudited) (Unaudited) (Unaudited) (Unaudited) (Audited)

Income

Revenue from Operations 10,003.73 7,546.46 8,255.74 17,550.19 14,824.14 30,440.29

Other income 509.52 318.16 1,000.93 827.68 2,235.67 3,606.29

1 Total Revenue 10,513.25 7,864.62 9,256.67 18,377.87 17,059.81 34,046.58

Expenses

(a) Cost of materials consumed 589.97 482.28 99.04 1,072.25 449.75 1,096.67

(b) Change in inventories of finished goods, work—in-progress and stock-

in-trade 198.24 203.51 214.82 401.75 160.94 (91.43)

(c) Excise duty— —

-- 75.51 75.51

(d) Employee benefits expenses 527.58 535.02 331.99 1,062.60 625.16 1,454.09

(e) Finance cost 141.63 93.37 124.74 235.00 250.15 554.69

(f) Depreciation and amortisation expenses 303.73 297.75 270.92 601.48 507.95 1,102.73

(9) Other Expenses r2,085.03 , 1,638.04 1,717.94 3,123.07 3,098.42 6,344.72

2 Total Expenses 3,846.18 3,249.97 2,759.45 7,996.15 5,167.88 10,536.98

3 Profit before exceptional items and tax ( 1 - 2 ) 6,667.07 4,614.65 6,497.22 11,281.72 11,891.96 23,509.60]4 Exceptional items

--

—-

-—

5 Profit before tax 6,667.07 4,614.65 6,497.22 11,281.72 11,891.96 23,509.60

Tax Expense :-

Current Tax 1,954.85 1,391.00 1,622.30 3,345.85 2,960.00 6,166.00

Deferred Tax (218.82) (408.00) 35.52 (626.82) (76.79) (407.67)

Income tax for earlier year~

--

—- 82.00

t.6 Total Tax Expense 1,736.03 983.00 1,657.82 2,719.03 2,883.21 5,840.33

L2...

7 Profit after tax for the period (5-

6__) 4,931.04l

3,631.65 4,839.40 8,562.69 9,008.73 17,669.27

Other Comprehensive Income (OCI) :-

A. Items that will not be reclassified to Statement of Profit and Loss—

-—

--

-

a. Remeasurement of defined benefit plans benefits » Net of tax-

-—

-- 5.64

b. Net fair value gain/(loss) on investment in equity instruments through (0-09) 033 ' 0.24 - 0.14

other comprehensive income

8 Total Other Comprehensive Income (0.09) 0.33 - 0.24 - 5.78

9 Total Comprehensive Income for the period ( 7 + 8 ) 4,930.95 3,631.98 4,839.40 8,562.931

“9,008.73 17,§75.05

10 Paid up Equity Share Capital (Face Value 3 2/- each) 1,409.20 1,409.20 1,409.20 1,409.20 1,409.20 1,409.20

Reserves excluding Revaluation Reserves as per balance sheet of

11 previous accounting year—

--

2— 99,461.11

12 Basic and Diluted Earnings Per Share (in 3) (not annualised) 7.00 5.15 6.87 12.15 12.79 25.08

Segment Reporting( f in Lakhs)

Standalone __j

Sr. Particulars Quarter Ended Half Year Ended Year Ended

No. 30.09.2018 30.06.2018 30.09.2017 30.09.2018 30.09.2017 31.03.2018

(Unaudited) (Unaudited) _(UnauditecD (Unaudited) (Unaudited) (Audited)

1 ngent Revenue

(3) Nesco IT Park 3,523.75 3,178.89 3,747.81 6,702.64 7,447.44 14,544.33

(b) Bombay Exhibition Centre 4,588.71 3,002.30 3,803.17 7,591.01 5,971.59 12,970.34

(c) Indabrator 1,026.18 653.85 704.76 1,680.03 1,405.11 2,638.13

((1) Nesco Foods 865.08 711.42 - 1,576.50_l-

287.49H

Revenue from Operations 10,003.73 7,546.46 8L255.74 17,550.19 14,824.14__' 30,440.29

e Income from investments/other income 509.52 318.16 1,000.93 827.68 2335.67 _ 3,606.29

,_ l—l—‘lét Revenue from operations 10,513.25)1 7,_864.62_T 9,256.67 18,_377.87 l 17,059.81 34,046.58

2 Se ment Profit before tax & finance costs

(a) Nesco IT Park 3,036.03 2,792.16 3,457.10 5,828.19 6,867.47 13,195.16

(b) Bombay Exhibition Centre 3,623.39 2,327.73 3,244.94 5,951.12 4,909.74 10,389.71

(c) Indabrator 12.61 (194.02) 21.21 (181.41) (61.64) 25.40

Q) Nesco Foods 156.75 151.15- 307.90 -

430.36

Total 6,828.80 5,077.01 6,723.25 11,905.81 11,715.57 23,640.63

Less: Finance Costs 141.63 93.37T.

124.74 235.00”—-

250.15 554.59

Add: Other Unailocable Income 463.14 206.76 956.25 669.90 2,127.49 3,373.67

Less: Other Unailocable Expenses 483.24 575.75 1,057.53 1,058.99 1,700.96 2,950.01

Operatimrofit before tax 6,667.07 4,614.65 6,497.22 11,281.72 11,891.96 23,509.60 l

Segment Asses

(a) Nesco IT Park 60,818.59 58,127.18 45,712.02 60,818.59 45,712.02 52,560.42

(b) Bombay Exhibition Centre 6,624.88 6,052.00 6,960.33 6,624.88 6,960.33 5,889.77

(c) Indabrator 3,231.71 3,193.33 3,776.39 3,231.71 3,776.39 3,415.45

((1) Nesco Foods 3,082.09 3,019.06— 3,082.09

— 3,168.02

Total Segment Assets 73,757.27 70 391.57 56,448.75 73,757.27 56,448.75 65,033.66

Unailocable Asset 52,187.55 52,211.12 54,477.16 52,187.55 54,477.16 52,839.06

Total 135,944.83 1,22,602.69 1,10,92590 125,944.83 1,10,925.90 1,17,872.72

Segment Liabilities

(a) Nesco IT Park 9,543.24 8,589.57 8,401.04 9,543.24 8,401.04 7,855.54

(b) Bombay Exhibition Centre 4,489.17 4,998.61 4,827.42 4,489.17 4,827.42 3,861.40

(C) Indabrator593.96 589.15 597.13 593.96 597.13 612.45

(0) Nesco Foods 433.73 324.39~ 433.73

— 232.19

Total Segment Liabilities 15,060.10 14,501.73 13,825.60 15,060.10 13 825.60 12,561.58

Unailocable Liabilities 3,406.06 _3,598.67 4,896.40 3&606 _ 4,896.4(fl 4,440.83

Total 18,466.17 18,100.40T 18,722.00 18,466.17 18,722.00 17,002.41

51,275.36 49,537.61 37,310.98 51,275.36 37,310.98 44,704.88

2,135.71 1,053.39 2,132.91 2,135.71 2,132.91 2,028.37

2,637.75 2,604.18 3,179.26 2,637.75 3,179.26 2,803.00

2,648.36 2,694.67» 2 648.36

- 2,935.83

58,697.17 55,889.85 42,623.14 58,697.17 42,623.14 52,472.08

L 48,781.49 ,_ 48,612.44 49,580.76 48,781.49 49,580.76__J 48,398.23

Total 1,07,478.66 1,241,502.29 92,203.90 1,07,478.66 92,203.90 1,00,870.31

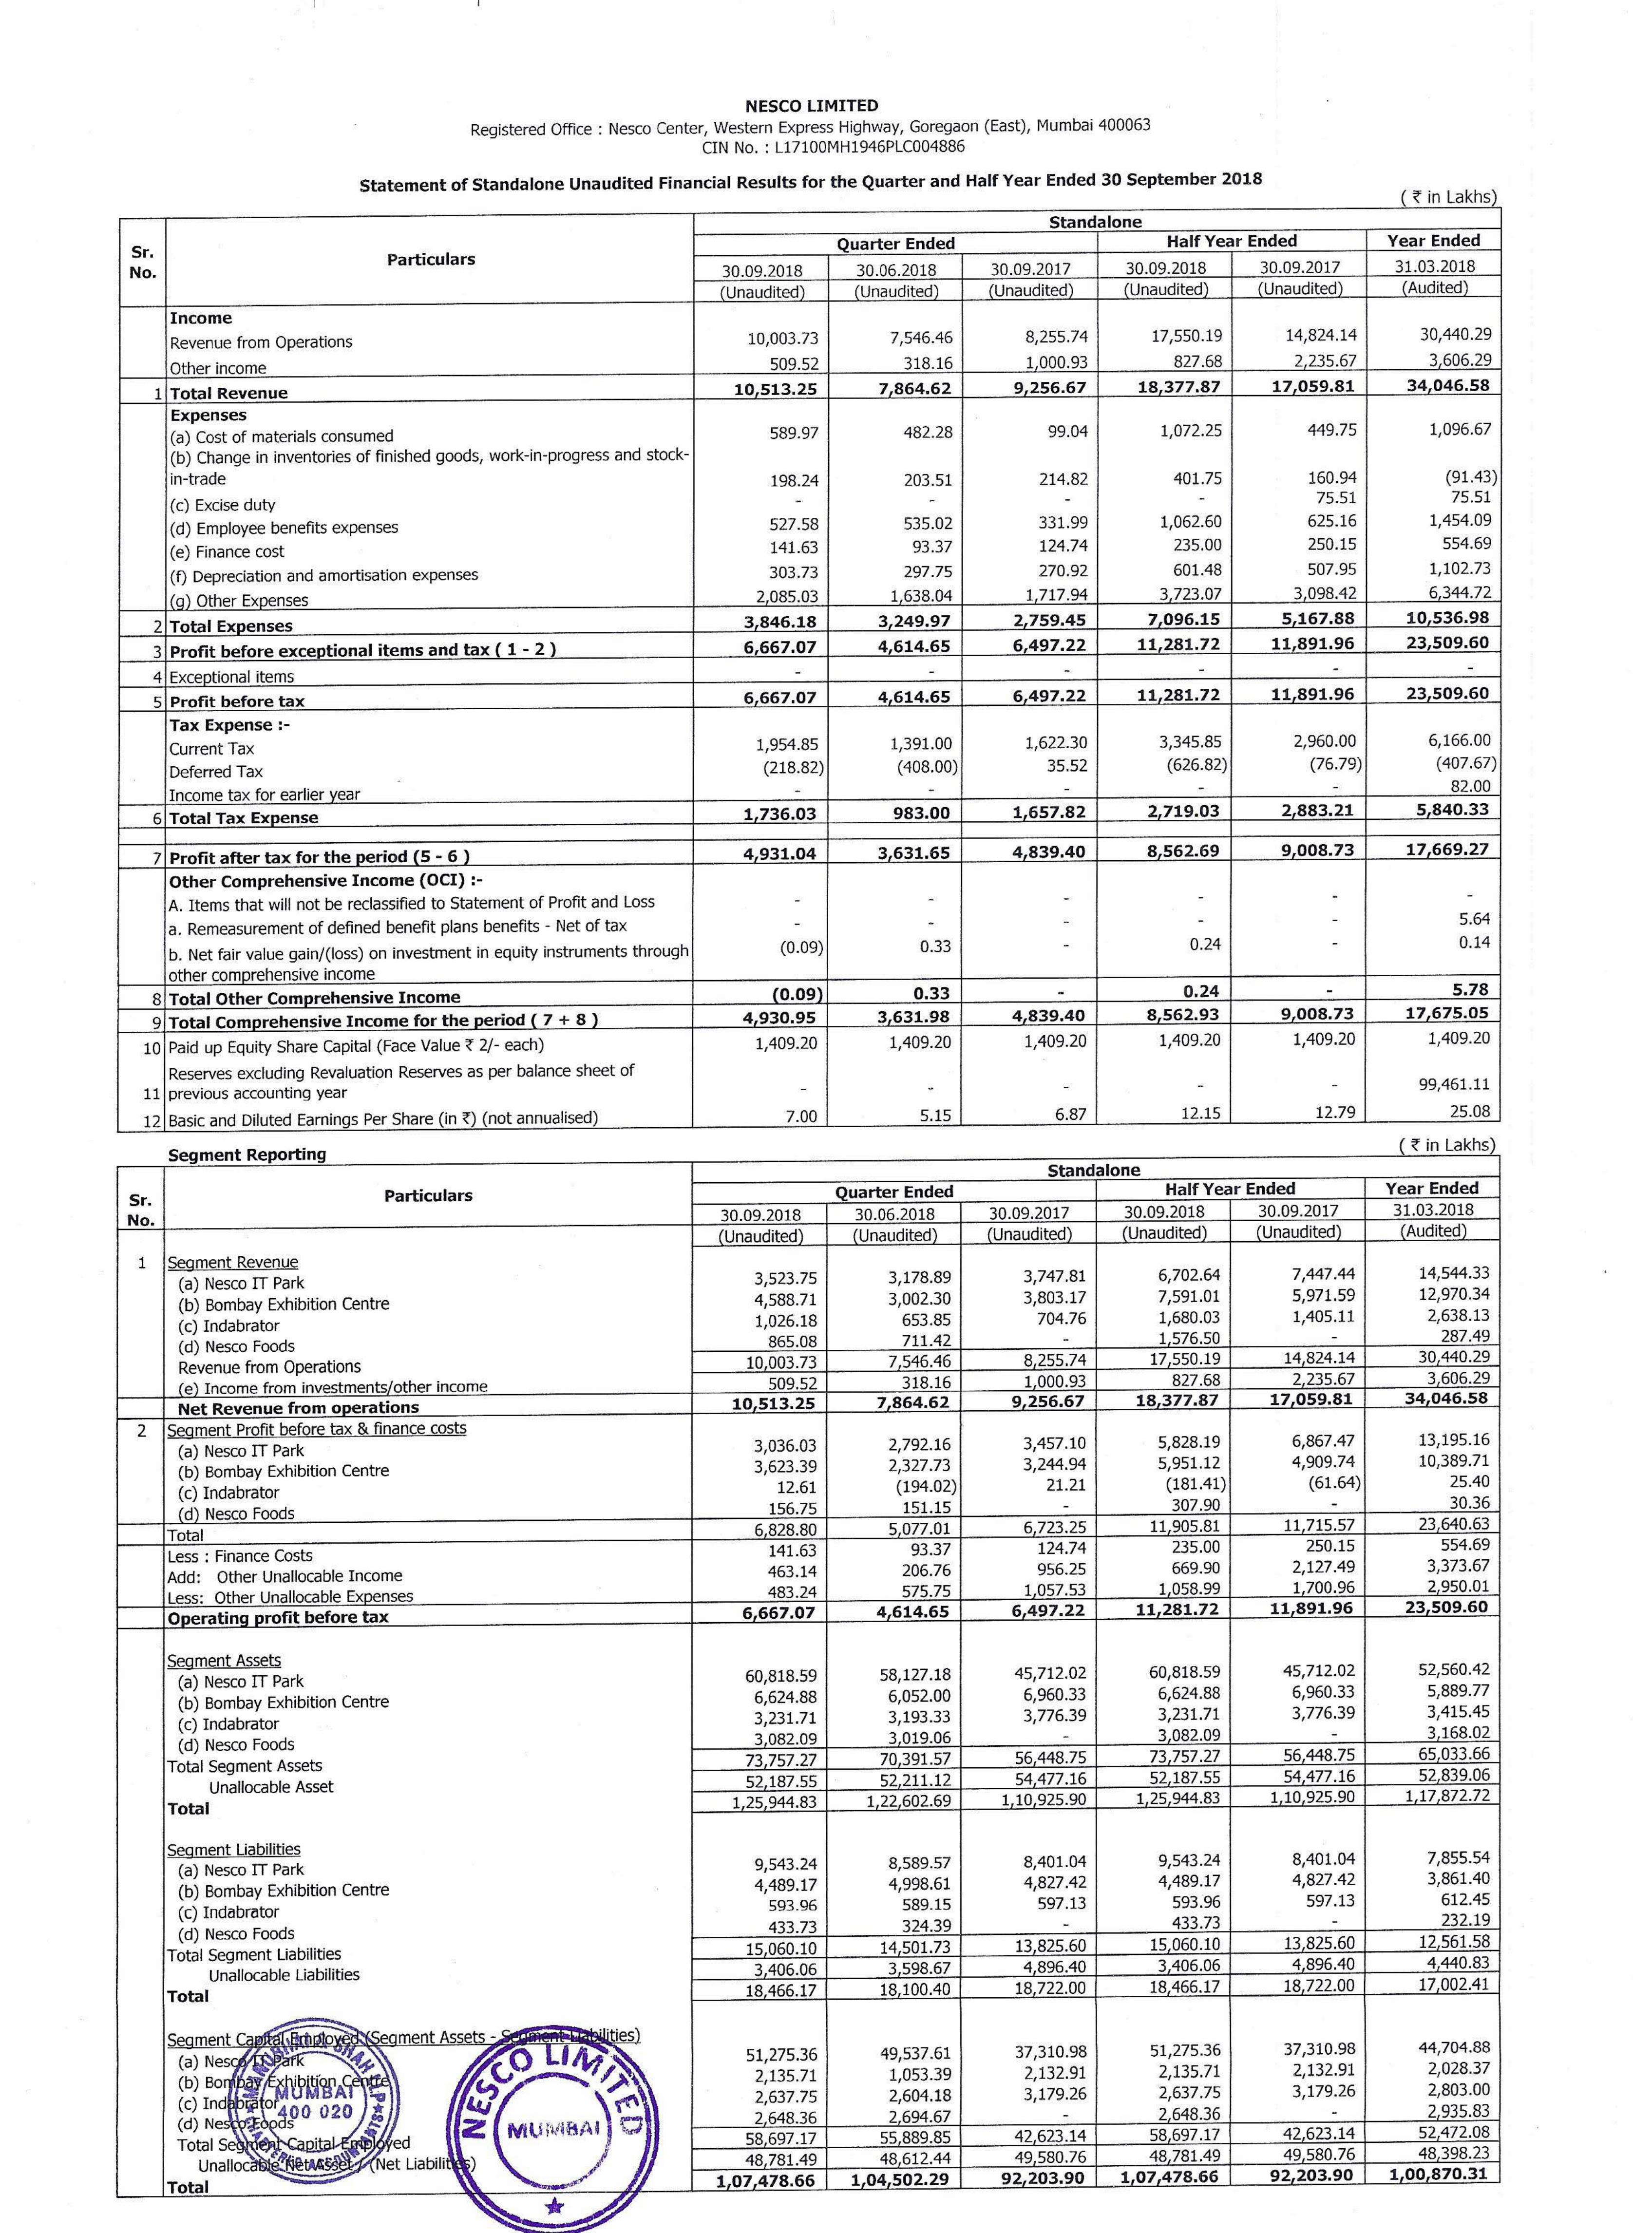
(? in Lakhs)Statement of Assets and Liabilities

Standalone As at

30.09.2018 31.03.2018

Particulars (Unaudited) (Audited)

Assets

Non-Current assets

Property, Plant and Equipment9,394.36 9,773.64

Capital work-in-proqress43,705.84 35,641.12

Investment property12,839.48 13,081.30

Intangible Assets under Development58.50 58.50

Financial Assets

Investments48,805.93 42,648.91

Loans / Sundry Deposits388.23 381.29

Non Current Tax Assets ( Net)883.49 859.67

Other Non Current Assets 3,748.71 4,067.97

Total Non-Current AssetsSub total: 1,19,824.54 1,06,512.40

Current assets

Inventories1,047.55 1,241.23

Financial assets

Investments1,383.14 7,226.61

Trade receivables 1,479.16 1,344.85

Cash and cash equivalents510.62 530.72

Other balances with Banks167.31 150.96

Other financial assets128.38 122.12

Other current assets1,404.13 743.82

Total Current AssetsSub total: 6,120.29 11,360.31

Total Assets 1 25 944.83 1,17,872.72

Equity and Liabilities

Equity

Equity share capital 1,409.20 1,409.20

Other Equity1,063,069.46 99,461.11

Total EquitySub total: 1,00,870.31

Non-current liabilities

Financial Liabilities

Other financial liabilities 5,860.46 1,199.10

Provisions343.50 352.59

Deferred tax liabilities 1,693.88 2,320.70

1,109.97 339.47Other non-current liabilities

Total Non-current Liabilities

Current liabilities

Financial Liabilities

Trade Payables:-

Due to Micro and Small Enterprise

Due to Others

4,211.86Sub total: 9,007.81

2,745.32 1,821.84

Other financial liabilities 1,778.05 6,623.65

Other current liabilities 4,547.64 3,879.15

26.98 26.98Provisions

Current Tax Liabilities ( Net)

Total Current Liabilities

360.37 438.93

9,458.36 12,790.55

—1 25 944.83

Sub total:

1,17 872.72Total Equity and Liabilities

Notes :-

1 The above results have been prepared in accordance with Indian Accounting Standards (“Ind AS“) notified under Section 133 of the Companies Act 2013, read together with the Companies

(Indian Accounting Standards) Rules, 2015.

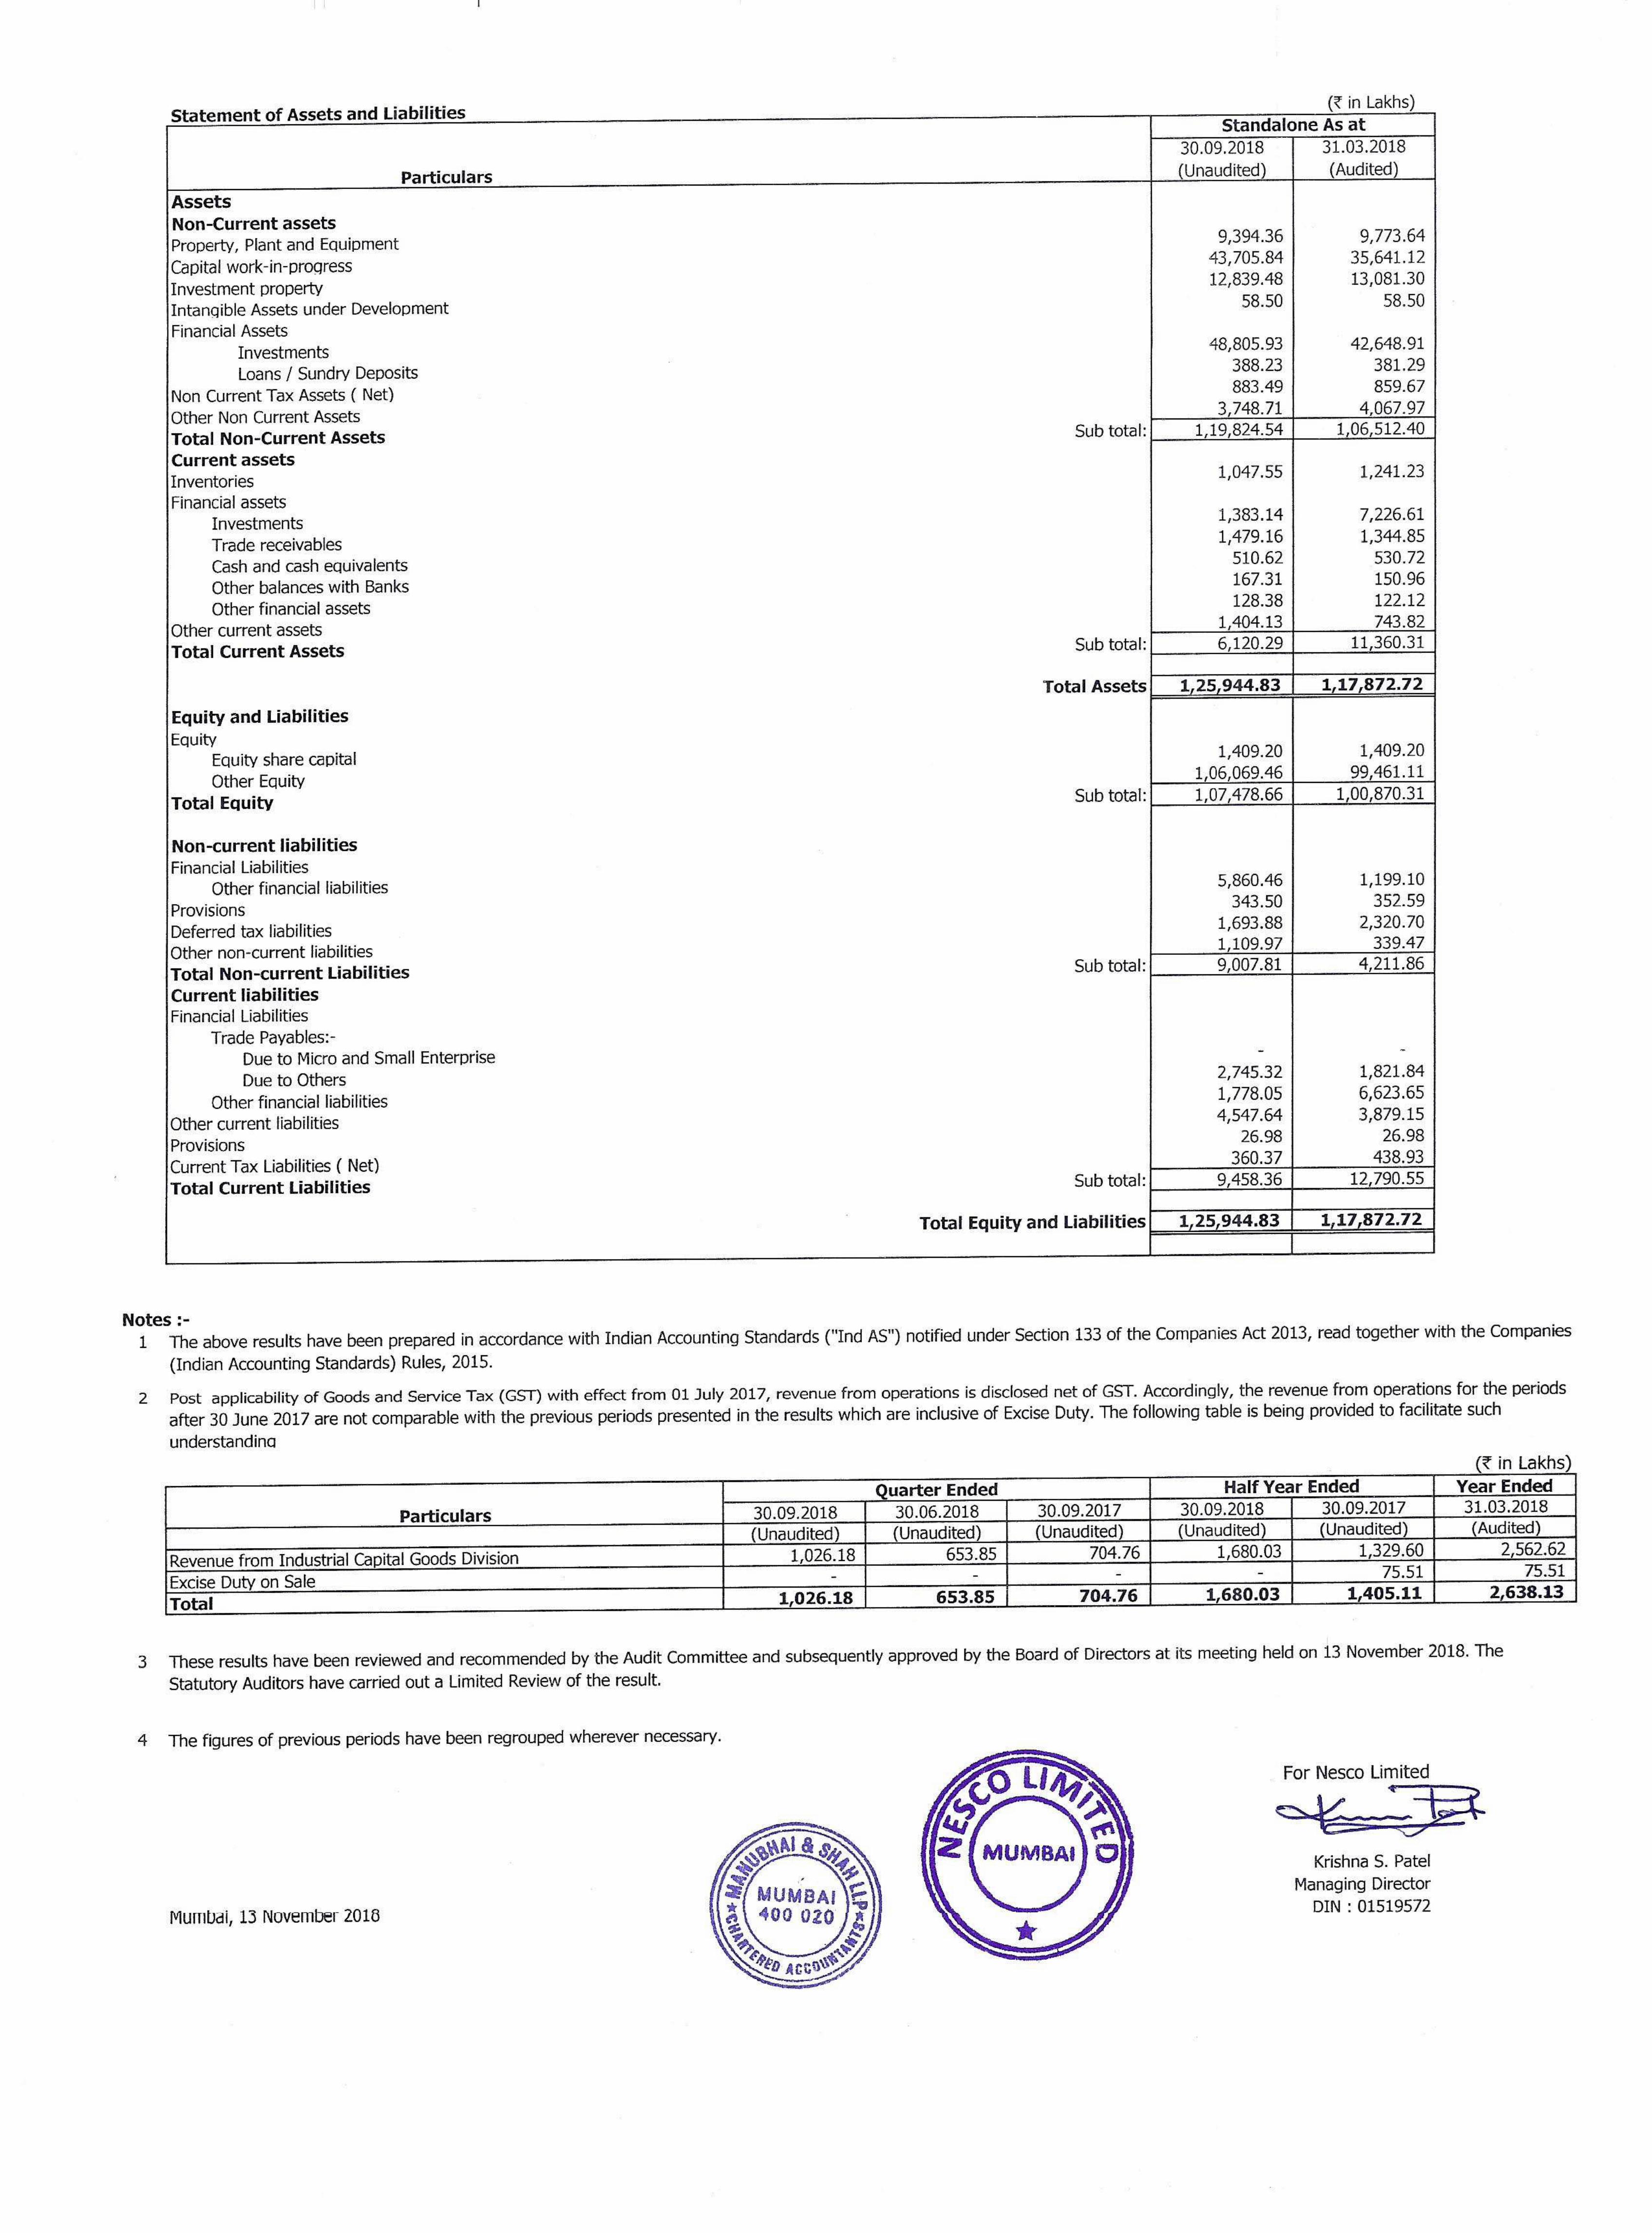
2 Post applicability of Goods and Service Tax (GST) with effect from 01 July 2017, revenue from operations is disclosed net of GST. Accordingly, the revenue from operations for the periods

after 30 June 2017 are not comparable with the previous periods presented in the results which are inclusive of Excise Duty. The following table is being provided to facilitate such

understanding

(? in Lakhs)

lQuarter Ended | Half Year Ended I Year Ended l

Particulars 30.09.2018 30.06.2018 l 30.09.2017 30.09.2018 30.09.2017 31.03.2018

(Unaudited) (Unaudited) (Unaudited) (Unaudited) (Unaudited) (Audited)

Revenue from Industrial Capital Goods Division 1,026.18 653.85 704.76 1,680.03 1,329.60 2,562.62

Excise Duty on Sale-

--

- 75.51 75.51

Total 1,026.18 I 653.85 704.76 1,680.03 1,405.11 £38.13

3 These results have been reviewed and recommended by the Audit Committee and subsequently approved by the Board of Directors at its meeting held on 13 November 2018. The

Statutory Auditors have carried out a Limited Review of the result.

4 The figures of previous periods have been regrouped wherever necessary.

For Nesco Limited

@Krishna S. Patel

Managing Director

Mumbai, 13 November 2018DIN : 01519572

Manubhai & Shah LLP

Chartered Accountants

INDEPENDENT AUDITORS' REVIEW REPORT

To

The Board of Directors of NESCO LIMITED

We have reviewed the accompanying statement of unaudited standalone financial results of

Nesco Limited (“the Company") for the quarter and half year ended 30th September, 2018

("the statement"), being submitted by the Company pursuant to the requirement of

Regulation 33 of the SEBI (Listing Obligations and Disclosure Requirements) Regulations,

2015 read with SEBI circular CIR/CFD/FAC/62/2016 dated 5th July, 2016. This statement, which

is the responsibility of the Company's Management and approved by the Board of Directors,

has been prepared on the basis of the related interim financial information in accordance with

the recognition and measurement principles laid down in Indian Accounting Standards 34

“Interim Financial Reporting" (“Ind AS 34") prescribed under Section 133 of the Companies

Act, 2013 read with relevant rules issued thereunder (Ind AS) and other accounting principles

generally accepted in India. Our responsibility is to issue a report on the statement based on

our review.

We have conducted our review of the statement in accordance with the Standard on Review

Engagements (SRE) 2410 ”Review of interim Financial information Performed by the

Independent Auditor of the Entity”, issued by the Institute of Chartered Accountants of India.

This Standard requires that we plan and perform the review to obtain moderate assurance as

to whether the statement is free of material misstatements. A review is limited primarily to

inquiries of Company personnel and analytical procedures applied to financial data and thus

provides less assurance than an audit. We have not performed an audit and accordingly, we

do not express an audit opinion.

Based on our review conducted as above, nothing has come to our attention that causes us to

believe that the accompanying Statement of unaudited financial results prepared in

accordance with the applicable Indian Accounting Standards (Ind AS) as prescribed under

section 133 of Companies Act, 2013 read with rules issued thereunder and other recognized

accounting practices and policies generally accepted in India, has not disclosed the

information required to be disclosed in terms of regulation 33 of the SEBI (Listing Obligations

and Disclosure Requirements) Regulations, 2015 read with SEBI circular CIR/CFD/FAC/62/2016

dated 5th July, 2016, including the manner in which it is to be disclosed, or that it contains any

material misstatement.

FOR MANUBHAI & SHAH LLP

CHARTERED ACCOUNTANTS

FRN:

1?6041W/ W100136

ASHISH SHAH

PARTNER

Membership No: 103750

Mumbai, 13th November, 2018

Maker Bhavan No. 2, 18, New Marine Lines, Mumbai - 400 020.

Phone : +91-22-6633 3558 / 59 / 60 Fax: +91-22-6633 3561, 2203 7935

Email : [email protected] Website : www.msglobalpotin

Ahmedahad . Mumbai . Raikot . Jamnagar- Baroda

Manubhai & Shah (Registration No. GUJ/AHD/33849) a Partnership Firm was converted into Manubhai & Shah LLP

(LLP identification No.AAG-0878) a Limited Liability Partnership with effect from ist April, 2016


Recommended