Page 1
Standard Chartered Bank Malaysia Berhad
and its subsidiaries
31 December 2014
Pillar 3 Disclosures
Level 16, Menara Standard Chartered
No. 30, Jalan Sultan Ismail 50250 Kuala Lumpur
Incorporated in Malaysia with registered Company No. 115793P
Page 2
Contents Pages
1. Overview 1
2. Capital Management 2
3. Risk Management 2
4. Regulatory Capital Requirement 5
5. Credit Risk 9
5.1 Exposure Values 23
5.2 Credit Risk Mitigation 35
5.3 Exposures under IRB Approach 39
5.4 Exposures under Standardised Approach 50
5.5 Problem Credit Management and Provisioning 52
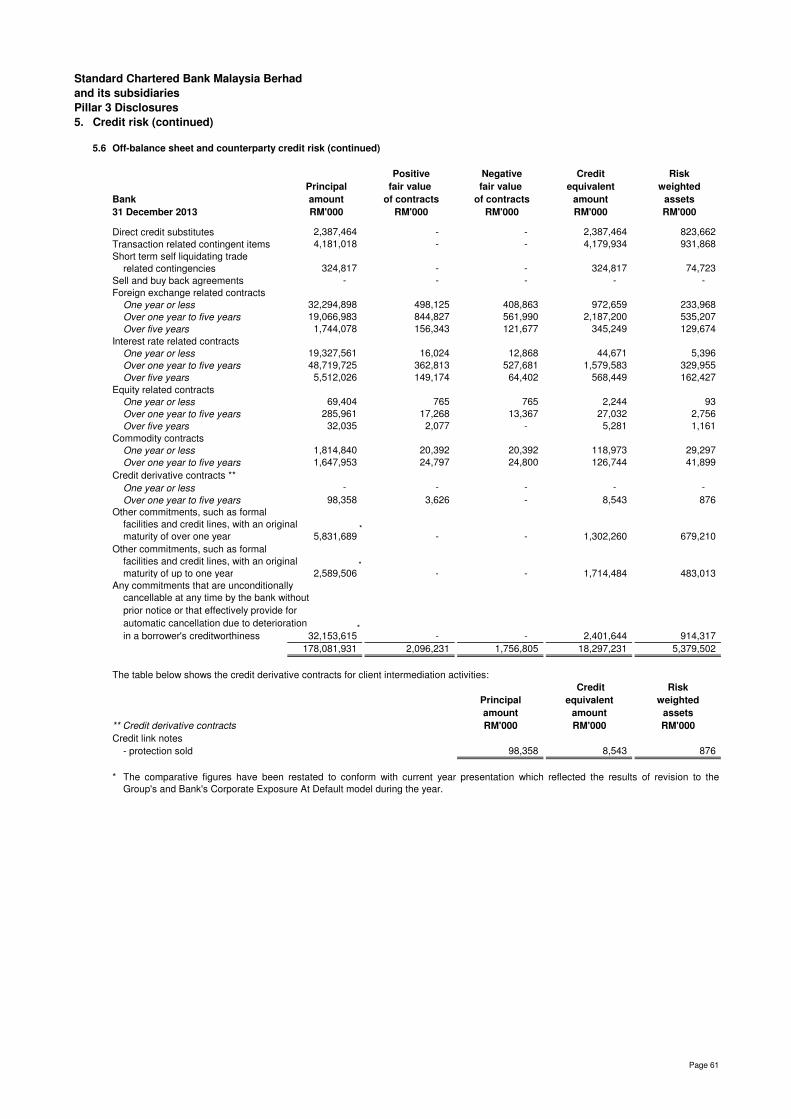
5.6 Off-balance Sheet and Counterparty Credit Risk 58
6. Market Risk 62
7. Equity Exposures in Banking Book 66
8. Operational Risk 66
9. Comparative Figures 67
10. Chief Executive Officer Attestation 68
Standard Chartered Bank Malaysia Berhad
and its subsidiaries
Pillar 3 Disclosures
Page 3
1.
Basel II
•
•
•
Scope of application
Pillar 1 sets out minimum regulatory capital requirements – the minimum amount of regulatory capital
banks must hold against the risks they assume;
Pillar 2 sets out the key principles for supervisory review of a bank’s risk management framework and
its capital adequacy. It sets out specific oversight responsibilities for the Board of Directors ("the
Board") and senior management, thus reinforcing principles of internal control and other corporate
governance practices; andPillar 3, covered in the supplementary financial information (unaudited), aims to bolster market
discipline through enhanced disclosure by banks.
Basel II provides three credit risk approaches of increasing sophistication, namely, The Standardised
Approach (“TSA”), the Foundation Internal Ratings Based Approach (“FIRB”) and the Advanced Internal
Ratings Based Approach (“AIRB”).
In Malaysia, the Capital Adequacy Framework (Basel II - Risk Weighted Assets) came into effect on 1
January 2013, last updated on 27 June 2013. The framework (previously known as Risk Weighted Capital
Adequacy Framework (Basel II - Risk Weighted Assets Computation) sets out the requirements on the
computation of the risk-weighted assets developed based on the Basel Committee on Banking Supervision
(BCBS) and the Islamic Financial Services Board (IFSB) papers "International Convergence of Capital
Measurement and Capital Standards: A Revised Frameworks" issued in June 2006 and the "Capital
Adequacy Standard (CAS)" issued in December 2005, respectively. The framework forms part of the overall
capital adequacy framework, hence should be read alongside the Capital Adequacy Framework (Capital
Components).
Standard Chartered Bank Malaysia Berhad
and its subsidiaries
Pillar 3 Disclosures
Overview
The Basel Committee on Banking Supervision (“BCBS”) published a framework for International
Convergence of Capital Measurement and Capital Standards (commonly referred to as ‘Basel II’), which
replaced the original 1988 Basel I Accord. Basel II is structured around three ‘pillars’ which are outlined
below:-
Bank Negara Malaysia ("BNM") has formally approved Standard Chartered Bank Malaysia Berhad
("SCBMB") and Standard Chartered Saadiq Berhad ("SCSB") to use the AIRB approach for calculating and
reporting credit risk regulatory capital in June 2010. As a result, since July 2010 regulatory capital
submission, SCBMB and SCSB have been using AIRB approach for calculating and reporting the credit risk
capital requirement. Formal approvals (SCBMB in Nov 2009 and SCSB in May 2013) were also obtained
from BNM for the use of TSA approach for calculating and reporting operational risk. SCBMB and SCSB
started using TSA approach for calculating and reporting the operational risk capital requirement effective
July 2010 and September 2013, respectively.
The Pillar 3 disclosures are prepared for the Standard Chartered Bank Malaysia Berhad and its subsidiaries
("the Group"). The Group offers Islamic banking financial services via the Bank's wholly owned subsidiary
company, Standard Chartered Saadiq Berhad. The accounting policy for consolidation is provided in note
2(a) of the Group's financial statements for the financial year ended 31 December 2014 ("the financial
statements"). All subsidiaries are fully consolidated and the treatment is the same for both regulatory and
accounting purposes.
The Group is not aware of any material, practical impediments to the prompt transfer of capital resources in
excess of those required for regulatory purposes or repayment of intercompany loans and advances.
Page 1
Page 4
Standard Chartered Bank Malaysia Berhad
and its subsidiaries
Pillar 3 Disclosures
2. Capital management
The capital plan takes the following into account:-• current regulatory capital requirements and assessment of future standards;•
• available supply of capital and capital raising options.
3.
demand for capital due to business growth, forecasts, loan impairment outlook and market shocks or
stresses; and
Through the Risk Management Framework, the Group manages enterprise-wide risks. One of the main risks
incurred arises from extending credit to customers through lending and trading operations. Beyond credit
risk, the Group is also exposed to a range of other risk types such as market, operational, liquidity,
reputational and other risks which are inherent to the Group’s strategy and the business the Group has
chosen to participate in.
ALCO is also responsible for the ongoing assessment of the demand for capital and the updating of the
Group’s capital plan.
The Group’s Internal Capital Adequacy Assessment ("ICAAP") closely integrates the risk and capital
assessment processes, and ensures that adequate levels of capital are maintained to support the Group’s
current and projected demand for capital under expected and stressed conditions. The Group’s ICAAP,
including methodologies in use for stress testing and economic capital calculations are aligned with those
established at the Standard Chartered PLC Group level and has been designed to be applied consistently
across the Group to meet the Pillar 2 requirements of BNM.
The Group’s capital management approach is driven by its desire to maintain a strong capital base in
support of its business development, to meet regulatory capital requirements at all times and to maintain
good credit ratings.
Risk management is the set of end-to-end activities through which we make risk-taking decisions and we
control and optimize the risk-return profile of the Group. It is a Group-wide activity and starts right at the front-
line. The management of risk lies at the heart of the Group’s business. Effective risk management is a
central part of the financial and operational management of the Group and fundamental to our ability to
generate profits consistently and maximize the interests of shareholders and other stakeholders.
The Group formulates a capital plan with the help of internal models and other quantitative techniques. The
Group uses model to assess the capital demand for material risks and supports this with internal capital
adequacy assessment. Other internal models help to estimate potential future losses arising from credit,
market and other risks and using regulatory formulae, the amount of capital required to support them. In
addition, the models enable the Group to gain an enhanced understanding of its risk profile, for example by
identifying potential concentrations and assessing the impact of portfolio management actions. Stress testing
and scenario analysis are an integral part of capital planning and are used to ensure that the Group's
internal capital adequacy assessment considers the impact of extreme but plausible scenarios on its risk
profile and capital position. They provide an insight into the potential impact of significant adverse events
and how these could be mitigated through appropriate management actions.
The Group operates processes and controls to monitor and manage capital adequacy across the
organisation. It is overseen by the Asset and Liability Committee ("ALCO"), which is responsible for
managing the balance sheet, capital and liquidity. A strong governance and process framework is embedded
in the capital planning and assessment methodology. Overall responsibility for the effective management of
risk rests with the Board.
Suitable processes and controls are in place to monitor and manage capital adequacy and ensure
compliance with local regulatory ratios in all legal entities. These processes are designed to ensure that the
Group has sufficient capital available to meet local regulatory requirements at all times.
Risk management
Details of regulatory capital structure and main features of capital instruments of the Group are disclosed in
Note 46 and Note 19 of the financial statements. All ordinary shares in issue confer identical rights in respect
of capital, dividends and voting.
Strategic, business and capital plans are drawn up annually covering a three year horizon and approved by
the Board. The capital plan ensures that adequate levels of capital and an optimum mix of the different
components of capital are maintained by the Group to support its strategy.
Page 2
Page 5
Standard Chartered Bank Malaysia Berhad
and its subsidiaries
Pillar 3 Disclosures
3.
•
•
•
•
•
Risk Governance
Flow of Authority
Authority flows from the ERC and ALCO to their sub-committees and may be cascaded further from there.
Reporting of material risk exposures, risk issues and assurance with policies and standards is
communicated from the relevant risk type committees up to the ERC, in accordance with their degree of
materiality to the Group. Line managers are also required to ensure that all risk exposures, risk issues and
evidence of assurance with policy are classified in terms of the applicable risk control area, risk type and
organizational levels.
As part of this framework, the Group uses a set of principles that describe the risk management culture it
wishes to sustain:
Accountability: risk is taken only within agreed authorities and where there is appropriate
infrastructure and resource. All risk-taking must be transparent, controlled and reported;Anticipation: to anticipate future risks and ensure awareness of all known risks;
Competitive advantage: seek competitive advantage through efficient and effective risk management
and control.
Balancing risk and return: risk is taken in support of the requirements of stakeholders, in line with
the Group’s strategy and within the Group’s risk appetite;
Risk governance refers to those parts of the Group’s overall governance mechanisms that relate to risk
management and control. Risk governance is exercised through the decision making authority vested in
individual managers and committees.
The Executive Risk Committee ("ERC") with its authority delegated by EXCO, shall hold executive
responsibility for risk management and control of all risks, except those for which EXCO and ALCO have
direct responsibilities. The ERC is also responsible for defining the Group’s overall risk management
framework.
ERC ensures the effective management of risk throughout the subsidiary and other Group's non banking
entities incorporated and domiciled in Malaysia in support of business strategy. The ERC must ensure that
risks within the country entities are managed effectively within the constraints set by Group risk committee.
In addition, ERC has risk management oversight over entities and branch of Standard Chartered Bank, UK
incorporated and domiciled in Malaysia.
ALCO, through its authority delegated by EXCO, is responsible for the management of capital ratios and the
establishment of, and compliance with, policies relating to balance sheet management, including
management of the Group’s liquidity and capital adequacy.
Acting with an authority delegated by the Board, the Board Risk Committee ("BRC") has oversight over risk
management framework and senior management activities in managing and controlling all risks. BRC is
chaired by and consists only of non-executive directors.
Executive Committee ("EXCO"), through its authority delegated by the Board, is responsible for executing
strategy as approved by the Board and to ensure robust control environment. EXCO is also responsible for
the management of pension and strategic risks.
Risk management (continued)
Ultimate responsibility for the effective management of risk rests with the Board. The Board delegates
authority for the management of risk to several committees.
Responsibility: it is the responsibility of all employees to ensure that risk-taking is disciplined and
focused. The Group takes account of its social responsibilities and its commitments to customers in
taking risk to produce a return;
Page 3
Page 6
Standard Chartered Bank Malaysia Berhad
and its subsidiaries
Pillar 3 Disclosures
3.
Three Lines of Defence
•
•
•
Risk Function
•
•
•
Risk Appetite
Stress Testing
The first line of defence is that all employees are required to ensure the effective management of risks
within the scope of their direct organizational responsibilities.
The third line of defence comprises the independent assurance provided by the Internal Audit function
of the Group Internal Audit ("GIA") which has no responsibilities for any of the activities it examines.
GIA provides independent assurance of the effectiveness of the management’s control of its own
business activities (first line) and of the processes maintained by the Risk Control Functions (the
second line). As a result, GIA provides assurance that the overall system of control effectiveness is
working as required within the Risk Management Framework.
The Standard Chartered PLC Group's Risk Appetite Statement (RAS) is the Standard Chartered PLC’s
Board of Directors’ articulation of the amount of risk that the Standard Chartered PLC Group is willing to take
in the pursuit of its strategic goals, reflecting its capacity to sustain losses and continue to meet its
obligations arising from a range of different stress trading conditions.
At country level, a local RAS was developed and approved by the Board in April 2014. Risk appetite
assessment and monitoring is performed to evidence compliance with the local RAS.
The second line of defence comprises the Risk Control Owners, supported by their respective control
functions. Risk Control Owners are responsible for ensuring that the risks within the scope of their
responsibilities remain within appetite. The second line is independent of the origination, trading and
sales functions to ensure that the necessary balance and perspective is brought to risk/return
decisions.
Stress testing and scenario analysis are used to assess the capability of the Group to continue operating
effectively under extreme but plausible trading conditions. Stress testing activities are performed as
necessary, to evaluate the impact on the portfolio or on certain customer segments, as a result of
developments in the market. Stress testing results are tabled with ERC for approval.
To exercise direct risk control ownership for credit, market, country cross-border, short-term liquidity
and operational risk types.
Risk management (continued)
The role of the risk function led by the Country Chief Risk Officer is:
To maintain the Risk Management Framework, ensuring it remains appropriate to the Group's
activities, is effectively communicated and implemented across the Group and for administering
related governance and reporting processes.
To uphold the overall integrity of the Group’s risk/return decisions, and in particular for ensuring that
risks are properly assessed, that risk/return decisions are made transparently on the basis of this
proper assessment, and are controlled in accordance with the Group's standards and risk appetite.
Page 4
Page 7
4 Regulatory capital requirement
Disclosure on capital adequacy under the Standardised and IRB approach
Gross
exposures
RM'000
Net
exposures
RM'000
Risk
weighted
assets
RM'000
Minimum
capital
requirement
at 8%
RM'000
(a) Credit risk
Exposures under the Standardised approach
On-balance sheet exposures:-
Corporates 153,599 139,827 140,138 11,211
Regulatory retail 144,547 69,080 53,834 4,307
Residential mortgages 14,762 14,762 5,175 414
Higher risk assets 24,706 24,706 37,059 2,965
Other assets 857,345 854,680 741,596 59,328
Defaulted exposures 63,826 53,293 90,006 7,200
Total on-balance sheet exposures 1,258,785 1,156,348 1,067,808 85,425
Off-balance sheet exposures:-
OTC derivatives 3,836 3,122 3,114 249
Off-balance sheet exposures other than OTC
derivative transactions and credit derivatives 140,181 97,841 97,788 7,823
Defaulted exposures 639 637 956 76
Total off-balance sheet exposures 144,656 101,600 101,858 8,148
Total on and off-balance sheet exposures 1,403,441 1,257,948 1,169,666 93,573
Exposures under the IRB approach
On-balance sheet exposures:-
Sovereigns/Central banks 7,642,135 7,642,135 476,928 38,154
Banks, development financial institutions
& multilateral development banks ("MDBs") 5,655,384 5,656,895 716,030 57,282
Insurance companies, securities firms &
fund managers 1,930,976 1,980,382 219,821 17,586
Corporates 9,907,324 9,848,382 8,584,061 686,725
Residential mortgages 13,141,971 13,141,970 2,418,167 193,453
Qualifying revolving retail exposures 1,791,740 1,791,740 1,205,295 96,424
Other retail 5,030,054 5,038,079 2,553,365 204,269
Defaulted exposures 1,479,387 1,479,388 4,115,718 329,257 Total on-balance sheet exposures 46,578,971 46,578,971 20,289,385 1,623,150
Off-balance sheet exposures:-
OTC derivatives 6,650,828 6,650,830 1,688,191 135,055
Off-balance sheet exposures other than OTC
derivative transactions and credit derivatives 12,034,259 12,034,259 4,117,703 329,416
Defaulted exposures 24,241 24,241 27,326 2,186
Total off-balance sheet exposures 18,709,328 18,709,330 5,833,220 466,657
Total on and off-balance sheet exposures 65,288,299 65,288,301 26,122,605 2,089,807
(b) Large exposures risk requirement 626 50
Long Short
(c) Market risk (Standardised approach) position position
Interest rate risk 31,823,395 35,590,192 812,014 64,961
Foreign currency risk 54,591,052 54,740,518 152,173 12,174
Options risk 7,110,743 5,527,783 422,572 33,806
(d) Operational risk (Standardised approach) 3,625,249 290,020
Total RWA and capital requirements 32,304,905 2,584,391
CET1, Tier 1 and Risk-Weighted Capital ratios
Before
proposed
dividend
After
proposed
dividend
CET 1 capital ratio 10.85% 10.74%
Tier 1 capital ratio 12.03% 11.92%
Risk-weighted capital ratio 15.22% 15.10%
Group
31 December 2014
Exposure class
Standard Chartered Bank Malaysia Berhad
and its subsidiaries
Pillar 3 Disclosures
Page 5
Page 8
Standard Chartered Bank Malaysia Berhad
and its subsidiaries
Pillar 3 Disclosures
4. Regulatory capital requirement (continued)
Disclosure on capital adequacy under the Standardised and IRB approach (continued)
Gross
exposures
RM'000
Net
exposures
RM'000
Risk
weighted
assets
RM'000
Minimum
capital
requirement
at 8%
RM'000
(a) Credit risk
Exposures under the Standardised approach
On-balance sheet exposures:-
Corporates 158,645 147,874 148,185 11,855
Regulatory retail 152,295 85,925 66,535 5,323
Residential mortgages 14,869 14,869 5,440 435
Higher risk assets 33,468 33,468 50,203 4,016
Other assets 754,967 753,746 635,005 50,800
Defaulted exposures 71,973 71,540 122,494 9,800
Total on-balance sheet exposures 1,186,217 1,107,422 1,027,862 82,229
Off-balance sheet exposures:-
OTC derivatives 3,551 3,163 3,133 251
Off-balance sheet exposures other than OTC
derivative transactions and credit derivatives 128,873 86,547 86,481 6,918
Defaulted exposures 246 246 370 30
Total off-balance sheet exposures 132,670 89,956 89,984 7,199
Total on and off-balance sheet exposures 1,318,887 1,197,378 1,117,846 89,428
Exposures under the IRB approach
On-balance sheet exposures:-
Sovereigns/Central banks 9,969,697 9,994,482 570,392 45,631
Banks, development financial institutions
& MDBs 4,755,962 4,754,144 568,404 45,472
Insurance companies, securities firms &
fund managers 430,026 499,511 105,222 8,418
Corporates 10,977,271 10,894,622 9,168,081 733,446
Residential mortgages 12,798,587 12,798,587 2,279,571 182,366
Qualifying revolving retail exposures 1,887,696 1,887,695 1,323,198 105,856
Other retail 6,323,330 6,313,530 4,022,232 321,779
Defaulted exposures 1,385,382 1,385,382 4,302,345 344,188 Total on-balance sheet exposures 48,527,951 48,527,953 22,339,445 1,787,156
Off-balance sheet exposures:-
OTC derivatives 5,981,957 5,981,957 1,476,002 118,080
Off-balance sheet exposures other than OTC
derivative transactions and credit derivatives 13,884,919 13,884,919 4,372,366 349,789
Defaulted exposures 27,165 27,165 31,012 2,481
Total off-balance sheet exposures 19,894,041 19,894,041 5,879,380 470,350
Total on and off-balance sheet exposures 68,421,992 68,421,994 28,218,825 2,257,506
(b) Large exposures risk requirement 623 50
Long Short
(c) Market risk (Standardised approach) position position
Interest rate risk 31,746,873 31,361,067 979,382 78,351
Foreign currency risk 52,763,098 52,655,779 28,053 2,244
Options risk 5,209,210 3,247,859 359,810 28,785
(d) Operational risk (Standardised approach) 3,596,736 287,739
Total RWA and capital requirements 34,301,275 2,744,103
CET 1, Tier 1 and Risk-Weighted Capital ratios
Before
proposed
dividend
After
proposed
dividend
CET 1 capital ratio 9.38% 9.38%
Tier 1 capital ratio 10.38% 10.38%
Risk-weighted capital ratio 13.32% 13.32%
Group
31 December 2013
Exposure class
Page 6
Page 9
Standard Chartered Bank Malaysia Berhad
and its subsidiaries
Pillar 3 Disclosures
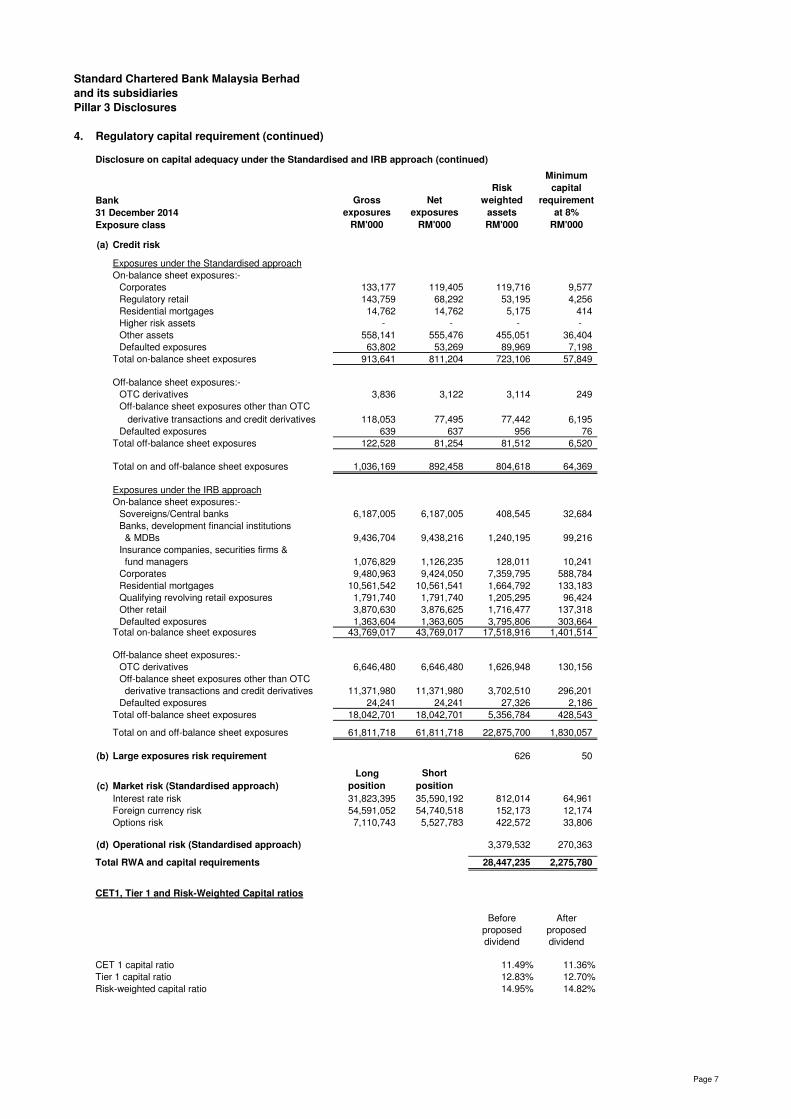
4. Regulatory capital requirement (continued)
Disclosure on capital adequacy under the Standardised and IRB approach (continued)
Gross
exposures
RM'000
Net
exposures
RM'000
Risk
weighted
assets
RM'000
Minimum
capital
requirement
at 8%
RM'000
(a) Credit risk
Exposures under the Standardised approach
On-balance sheet exposures:-
Corporates 133,177 119,405 119,716 9,577
Regulatory retail 143,759 68,292 53,195 4,256
Residential mortgages 14,762 14,762 5,175 414
Higher risk assets - - - -
Other assets 558,141 555,476 455,051 36,404
Defaulted exposures 63,802 53,269 89,969 7,198
Total on-balance sheet exposures 913,641 811,204 723,106 57,849
Off-balance sheet exposures:-
OTC derivatives 3,836 3,122 3,114 249
Off-balance sheet exposures other than OTC
derivative transactions and credit derivatives 118,053 77,495 77,442 6,195
Defaulted exposures 639 637 956 76
Total off-balance sheet exposures 122,528 81,254 81,512 6,520
Total on and off-balance sheet exposures 1,036,169 892,458 804,618 64,369
Exposures under the IRB approach
On-balance sheet exposures:-
Sovereigns/Central banks 6,187,005 6,187,005 408,545 32,684
Banks, development financial institutions
& MDBs 9,436,704 9,438,216 1,240,195 99,216
Insurance companies, securities firms &
fund managers 1,076,829 1,126,235 128,011 10,241
Corporates 9,480,963 9,424,050 7,359,795 588,784
Residential mortgages 10,561,542 10,561,541 1,664,792 133,183
Qualifying revolving retail exposures 1,791,740 1,791,740 1,205,295 96,424
Other retail 3,870,630 3,876,625 1,716,477 137,318
Defaulted exposures 1,363,604 1,363,605 3,795,806 303,664 Total on-balance sheet exposures 43,769,017 43,769,017 17,518,916 1,401,514
Off-balance sheet exposures:-
OTC derivatives 6,646,480 6,646,480 1,626,948 130,156
Off-balance sheet exposures other than OTC
derivative transactions and credit derivatives 11,371,980 11,371,980 3,702,510 296,201
Defaulted exposures 24,241 24,241 27,326 2,186
Total off-balance sheet exposures 18,042,701 18,042,701 5,356,784 428,543
Total on and off-balance sheet exposures 61,811,718 61,811,718 22,875,700 1,830,057
(b) Large exposures risk requirement 626 50
Long Short
(c) Market risk (Standardised approach) position position
Interest rate risk 31,823,395 35,590,192 812,014 64,961
Foreign currency risk 54,591,052 54,740,518 152,173 12,174
Options risk 7,110,743 5,527,783 422,572 33,806
(d) Operational risk (Standardised approach) 3,379,532 270,363
Total RWA and capital requirements 28,447,235 2,275,780
CET1, Tier 1 and Risk-Weighted Capital ratios
Before
proposed
dividend
After
proposed
dividend
CET 1 capital ratio 11.49% 11.36%
Tier 1 capital ratio 12.83% 12.70%
Risk-weighted capital ratio 14.95% 14.82%
Bank
31 December 2014
Exposure class
Page 7
Page 10
Standard Chartered Bank Malaysia Berhad
and its subsidiaries
Pillar 3 Disclosures
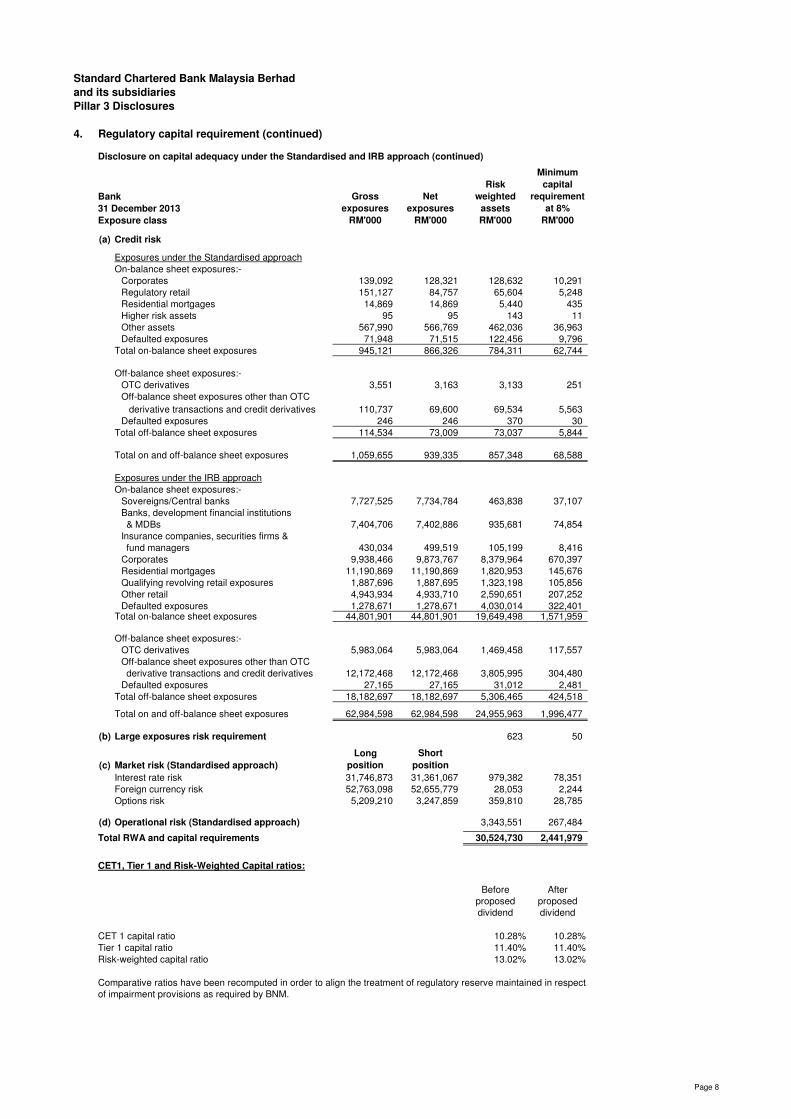
4. Regulatory capital requirement (continued)
Disclosure on capital adequacy under the Standardised and IRB approach (continued)
Gross
exposures
RM'000
Net
exposures
RM'000
Risk
weighted
assets
RM'000
Minimum
capital
requirement
at 8%
RM'000
(a) Credit risk
Exposures under the Standardised approach
On-balance sheet exposures:-
Corporates 139,092 128,321 128,632 10,291
Regulatory retail 151,127 84,757 65,604 5,248
Residential mortgages 14,869 14,869 5,440 435
Higher risk assets 95 95 143 11
Other assets 567,990 566,769 462,036 36,963
Defaulted exposures 71,948 71,515 122,456 9,796
Total on-balance sheet exposures 945,121 866,326 784,311 62,744
Off-balance sheet exposures:-
OTC derivatives 3,551 3,163 3,133 251
Off-balance sheet exposures other than OTC
derivative transactions and credit derivatives 110,737 69,600 69,534 5,563
Defaulted exposures 246 246 370 30
Total off-balance sheet exposures 114,534 73,009 73,037 5,844
Total on and off-balance sheet exposures 1,059,655 939,335 857,348 68,588
Exposures under the IRB approach
On-balance sheet exposures:-
Sovereigns/Central banks 7,727,525 7,734,784 463,838 37,107
Banks, development financial institutions
& MDBs 7,404,706 7,402,886 935,681 74,854
Insurance companies, securities firms &
fund managers 430,034 499,519 105,199 8,416
Corporates 9,938,466 9,873,767 8,379,964 670,397
Residential mortgages 11,190,869 11,190,869 1,820,953 145,676
Qualifying revolving retail exposures 1,887,696 1,887,695 1,323,198 105,856
Other retail 4,943,934 4,933,710 2,590,651 207,252
Defaulted exposures 1,278,671 1,278,671 4,030,014 322,401 Total on-balance sheet exposures 44,801,901 44,801,901 19,649,498 1,571,959
Off-balance sheet exposures:-
OTC derivatives 5,983,064 5,983,064 1,469,458 117,557
Off-balance sheet exposures other than OTC
derivative transactions and credit derivatives 12,172,468 12,172,468 3,805,995 304,480
Defaulted exposures 27,165 27,165 31,012 2,481
Total off-balance sheet exposures 18,182,697 18,182,697 5,306,465 424,518
Total on and off-balance sheet exposures 62,984,598 62,984,598 24,955,963 1,996,477
(b) Large exposures risk requirement 623 50
Long Short
(c) Market risk (Standardised approach) position position
Interest rate risk 31,746,873 31,361,067 979,382 78,351
Foreign currency risk 52,763,098 52,655,779 28,053 2,244
Options risk 5,209,210 3,247,859 359,810 28,785
(d) Operational risk (Standardised approach) 3,343,551 267,484
Total RWA and capital requirements 30,524,730 2,441,979
CET1, Tier 1 and Risk-Weighted Capital ratios:
Before
proposed
dividend
After
proposed
dividend
CET 1 capital ratio 10.28% 10.28%
Tier 1 capital ratio 11.40% 11.40%
Risk-weighted capital ratio 13.02% 13.02%
Bank
31 December 2013
Exposure class
Comparative ratios have been recomputed in order to align the treatment of regulatory reserve maintained in respect
of impairment provisions as required by BNM.
Page 8
Page 11
Standard Chartered Bank Malaysia Berhad
and its subsidiaries
Pillar 3 Disclosures
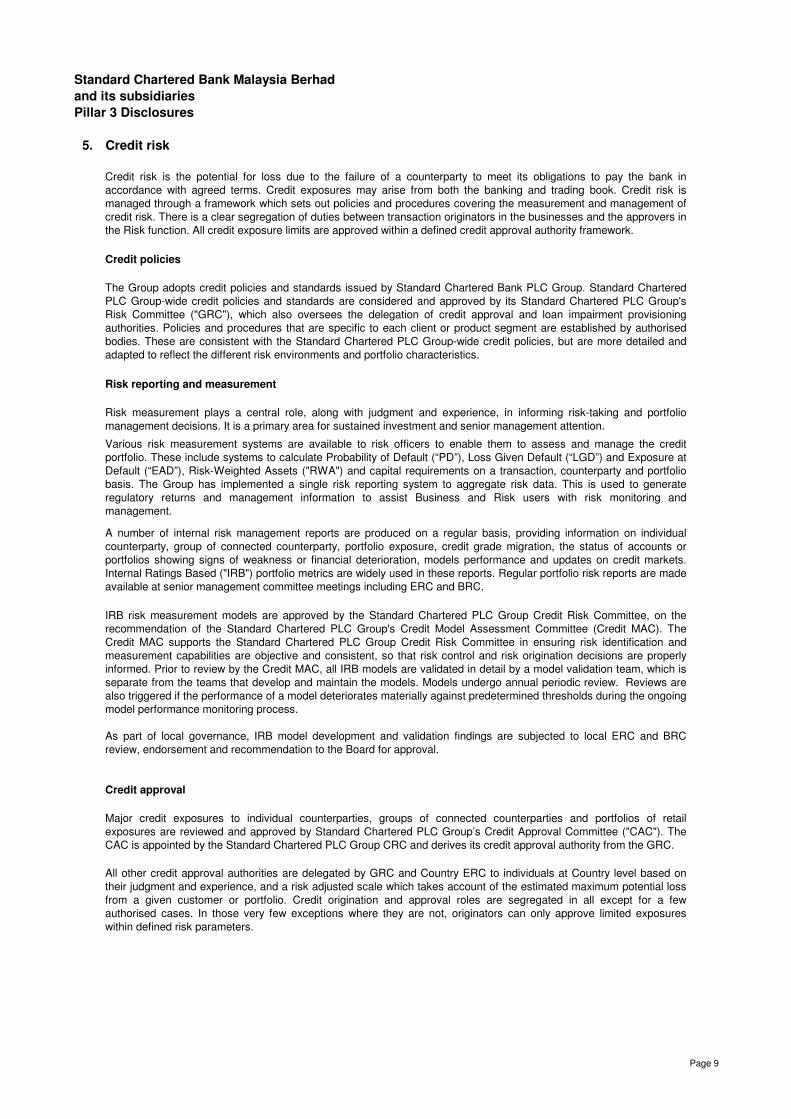
5. Credit risk
Credit risk is the potential for loss due to the failure of a counterparty to meet its obligations to pay the bank in
accordance with agreed terms. Credit exposures may arise from both the banking and trading book. Credit risk is
managed through a framework which sets out policies and procedures covering the measurement and management of
credit risk. There is a clear segregation of duties between transaction originators in the businesses and the approvers in
the Risk function. All credit exposure limits are approved within a defined credit approval authority framework.
Credit policies
Risk reporting and measurement
A number of internal risk management reports are produced on a regular basis, providing information on individual
counterparty, group of connected counterparty, portfolio exposure, credit grade migration, the status of accounts or
portfolios showing signs of weakness or financial deterioration, models performance and updates on credit markets.
Internal Ratings Based ("IRB") portfolio metrics are widely used in these reports. Regular portfolio risk reports are made
available at senior management committee meetings including ERC and BRC.
Credit approval
All other credit approval authorities are delegated by GRC and Country ERC to individuals at Country level based on
their judgment and experience, and a risk adjusted scale which takes account of the estimated maximum potential loss
from a given customer or portfolio. Credit origination and approval roles are segregated in all except for a few
authorised cases. In those very few exceptions where they are not, originators can only approve limited exposures
within defined risk parameters.
The Group adopts credit policies and standards issued by Standard Chartered Bank PLC Group. Standard Chartered
PLC Group-wide credit policies and standards are considered and approved by its Standard Chartered PLC Group's
Risk Committee ("GRC"), which also oversees the delegation of credit approval and loan impairment provisioning
authorities. Policies and procedures that are specific to each client or product segment are established by authorised
bodies. These are consistent with the Standard Chartered PLC Group-wide credit policies, but are more detailed and
adapted to reflect the different risk environments and portfolio characteristics.
IRB risk measurement models are approved by the Standard Chartered PLC Group Credit Risk Committee, on the
recommendation of the Standard Chartered PLC Group's Credit Model Assessment Committee (Credit MAC). The
Credit MAC supports the Standard Chartered PLC Group Credit Risk Committee in ensuring risk identification and
measurement capabilities are objective and consistent, so that risk control and risk origination decisions are properly
informed. Prior to review by the Credit MAC, all IRB models are validated in detail by a model validation team, which is
separate from the teams that develop and maintain the models. Models undergo annual periodic review. Reviews are
also triggered if the performance of a model deteriorates materially against predetermined thresholds during the ongoing
model performance monitoring process.
As part of local governance, IRB model development and validation findings are subjected to local ERC and BRC
review, endorsement and recommendation to the Board for approval.
Major credit exposures to individual counterparties, groups of connected counterparties and portfolios of retail
exposures are reviewed and approved by Standard Chartered PLC Group’s Credit Approval Committee ("CAC"). The
CAC is appointed by the Standard Chartered PLC Group CRC and derives its credit approval authority from the GRC.
Risk measurement plays a central role, along with judgment and experience, in informing risk-taking and portfolio
management decisions. It is a primary area for sustained investment and senior management attention.
Various risk measurement systems are available to risk officers to enable them to assess and manage the credit
portfolio. These include systems to calculate Probability of Default (“PD”), Loss Given Default (“LGD”) and Exposure at
Default (“EAD”), Risk-Weighted Assets ("RWA") and capital requirements on a transaction, counterparty and portfolio
basis. The Group has implemented a single risk reporting system to aggregate risk data. This is used to generate
regulatory returns and management information to assist Business and Risk users with risk monitoring and
management.
Page 9
Page 12
Standard Chartered Bank Malaysia Berhad
and its subsidiaries
Pillar 3 Disclosures
5.
(i) Internal Ratings Based approach to credit risk
For retail and small business client exposures, portfolio delinquency trends are monitored continuously at a detailed
level. Individual customer behaviour is also tracked and is considered in lending decisions. Accounts which are past due
are subject to a collections process, managed independently by the Risk function. Charged-off accounts are managed
by a specialised recovery team.
BNM Capital Adequacy Framework (Basel II - Risk Weighted Assets) allows banks to elect to permanently
exclude certain exposures from the IRB approach and use the standardised approach. These are known as
permanent exemptions, and are required to be no greater than 15 per cent of the Group’s credit risk-weighted
assets.
All assets under the IRB approach have sophisticated PD, LGD and EAD/CCF models developed to support the
credit decision making process. RWA under the IRB approach is determined by BNM's specified formulae
dependent on the Group's estimates of residual maturity, PD, LGD and EAD. The development, use and
governance of models under the IRB approach is covered in more detail in Section 5 (iv).
PD is the likelihood that an obligor will default on an obligation within 12 months. EAD is the expected amount of
exposure to a particular obligor at the point of default. CCF is an internally modeled parameter based on historical
experience to determine the amount that is expected to be further drawn down from the undrawn portion in a
facility. LGD is the percentage of EAD that the Group expects to lose in the event of obligor default. EAD/CCF and
LGD are measured based on expectation in economic downturn periods.
The Group uses the IRB approach to manage credit risk for its portfolios. This allows the Group to use its own
internal estimates of PD, LGD, EAD and Credit Conversion Factor (“CCF”) to determine an asset risk weighting.
Section 5.1 provides further analysis on the Group's and the Bank's credit risk exposures.
Credit monitoring
Credit Concentration risk
Credit risk (continued)
Credit concentration risk is managed within concentration caps set by counterparty or groups of connected
counterparties. At the portfolio level, credit concentration thresholds are set and monitored to control for concentrations,
where appropriate, by country, industry, product, tenor, collateral type, collateralisation level and credit risk profile.
Additional targets are set and monitored for concentrations by credit rating. Credit concentrations are monitored by the
ERC.
The Group regularly monitors credit exposures, portfolio performance, and external trends which may impact risk
management outcomes. Internal risk management reports are presented to ERC, containing information on key
economic trends, portfolio delinquency and loan impairment performance, as well as IRB portfolio metrics including
credit grade migration. Credit risk committees meet regularly to assess the impact of external events and trends on the
credit risk portfolios and to define and implement response in terms of appropriate changes to portfolio shape, portfolio
and underwriting standards, risk policy and procedures.
Clients or portfolios are placed on Early Alert when they display signs of weakness or financial deterioration, for
example, where there is a decline in the customer’s position within the industry, a breach of covenants, non-
performance of an obligation, or there are issues relating to ownership or management. Such accounts and portfolios
are subjected to a dedicated process overseen by Credit Issues Committe ("CIC"). Account plans are re-evaluated and
remedial actions are agreed and monitored. Remedial actions include, but are not limited to, exposure reduction,
security enhancement, exiting the account or immediate movement of the account into the control of GSAM, the
specialist recovery unit. Typically, all Corporate, Institutional and Commercial past due accounts are managed by
GSAM.
Page 10
Page 13
Standard Chartered Bank Malaysia Berhad
and its subsidiaries
Pillar 3 Disclosures
5.
(ii) Standardised approach to credit risk
(iii) Credit risk mitigation
•
•
•
•
•
Credit monitoring (continued)
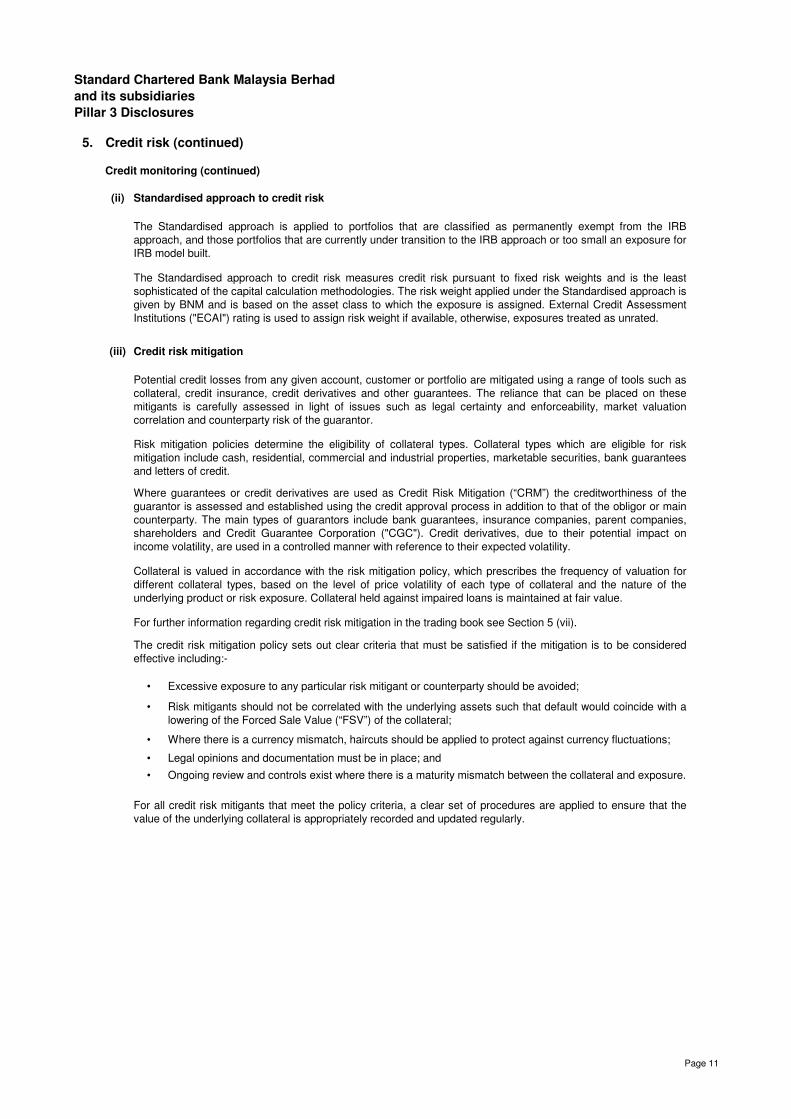
Risk mitigation policies determine the eligibility of collateral types. Collateral types which are eligible for risk
mitigation include cash, residential, commercial and industrial properties, marketable securities, bank guarantees
and letters of credit.
Where guarantees or credit derivatives are used as Credit Risk Mitigation (“CRM”) the creditworthiness of the
guarantor is assessed and established using the credit approval process in addition to that of the obligor or main
counterparty. The main types of guarantors include bank guarantees, insurance companies, parent companies,
shareholders and Credit Guarantee Corporation ("CGC"). Credit derivatives, due to their potential impact on
income volatility, are used in a controlled manner with reference to their expected volatility.
Collateral is valued in accordance with the risk mitigation policy, which prescribes the frequency of valuation for
different collateral types, based on the level of price volatility of each type of collateral and the nature of the
underlying product or risk exposure. Collateral held against impaired loans is maintained at fair value.
Potential credit losses from any given account, customer or portfolio are mitigated using a range of tools such as
collateral, credit insurance, credit derivatives and other guarantees. The reliance that can be placed on these
mitigants is carefully assessed in light of issues such as legal certainty and enforceability, market valuation
correlation and counterparty risk of the guarantor.
Excessive exposure to any particular risk mitigant or counterparty should be avoided;
For further information regarding credit risk mitigation in the trading book see Section 5 (vii).
The credit risk mitigation policy sets out clear criteria that must be satisfied if the mitigation is to be considered
effective including:-
Credit risk (continued)
The Standardised approach is applied to portfolios that are classified as permanently exempt from the IRB
approach, and those portfolios that are currently under transition to the IRB approach or too small an exposure for
IRB model built.
The Standardised approach to credit risk measures credit risk pursuant to fixed risk weights and is the least
sophisticated of the capital calculation methodologies. The risk weight applied under the Standardised approach is
given by BNM and is based on the asset class to which the exposure is assigned. External Credit Assessment
Institutions ("ECAI") rating is used to assign risk weight if available, otherwise, exposures treated as unrated.
Risk mitigants should not be correlated with the underlying assets such that default would coincide with a
lowering of the Forced Sale Value (“FSV”) of the collateral;
Where there is a currency mismatch, haircuts should be applied to protect against currency fluctuations;
Legal opinions and documentation must be in place; and
Ongoing review and controls exist where there is a maturity mismatch between the collateral and exposure.
For all credit risk mitigants that meet the policy criteria, a clear set of procedures are applied to ensure that the
value of the underlying collateral is appropriately recorded and updated regularly.
Page 11
Page 14
Standard Chartered Bank Malaysia Berhad
and its subsidiaries
Pillar 3 Disclosures
5.
(iii) Credit risk mitigation (continued)
(iv) Internal Ratings Based models
The table below provides the Group's and the Bank's portfolio under IRB models:
Retail Clients Credit card
Central Government, Central Government department, Central
banks, Entities owned or guaranteed by Central Government
Qualifying revolving retail
exposures
Other retail exposures
Residential Mortgages
Credit monitoring (continued)
Credit risk (continued)
Regular valuation of collateral is required in accordance with Standard Chartered PLC Group's risk mitigation
policy, which prescribes the frequency of valuation for different collateral types.
Section 5.2 provides further analysis on the Group's and the Bank's credit risk exposures after the effect of CRM.
Bank, Finance & Leasing, Life insurance, Non-life insurance,
Broker dealer, Funds managers
Sovereign and Central Bank
Bank, DFIs and MDBs
Large Corporate, Middle market, Emerging Middle Market,
Commodity Traders & Buyers, Medium Enterprise, Small
Business
Retails Clients Residential Mortgage
SME (including Business & Commercial Clients) property lending,
SME (including Business & Commercial Clients) lending, Personal
lending / financing, and residential properties under construction
Corporates
Portfolio Exposure
The overall governance and development process for the Group's IRB models are consistent across all portfolios.
Page 12
Page 15
Standard Chartered Bank Malaysia Berhad
and its subsidiaries
Pillar 3 Disclosures
5.
(iv) Internal Ratings Based models (continued)
• Model assumptions;
• Validity of the technical approach used;
• Statistical and empirical measures of performance;
• Appropriateness of intended model use;
• Model application and infrastructure;
• Data integrity and history;
•
• Model monitoring standards and triggers; and
• Levels of conservatism applied.
Credit monitoring (continued)
Credit risk (continued)
Models are developed by Standard Chartered PLC Group's analytics team within the Risk Measurement function.
The model development process is conducted and documented in line with specific criteria setting out the
minimum standards for model development. All IRB models are validated in detail by a model validation team,
which is separate from the teams that develop and maintain the models. Model validation findings are presented
to the Standard Chartered PLC Group Credit Model Assessment Committee ("MAC"). The Credit MAC supports
the Standard Chartered PLC Group Credit Risk Committee in ensuring risk identification and measurement
capabilities are objective and consistent, so that risk control and risk origination decisions are properly informed.
These decision making bodies are comprised of divisional senior management whose role is to challenge model
assumptions and performance and agree on appropriate model use for business decision making and regulatory
capital requirement calculations. The Standard Chartered PLC Group Risk Committee and Board Risk Committee
periodically review overall model performance.
As part of local governance, IRB model development and validation findings are subjected to local ERC and local
BRC review, endorsement and recommendation to the Board for adoption or approval. These decision making
bodies are comprised of senior management whose role is to review model assumptions, performance, local
regulatory requirements, agree on appropriate model use for local business decision making and capital reporting.
Model response to changes in internal and external environment - the extent to which the model provides
point in time or through the cycle measures of risk;
Statistical testing is used to determine a model’s discriminatory power, predicted versus realised performance and
stability over time with pre-defined thresholds for passing such tests.
The IRB models used by the Group calculate a PD, LGD and EAD.
The model validation process involves a qualitative and quantitative assessment of the model, data, systems and
governance. This would typically include an assessment of the:-
Model validation
Model governance
Page 13
Page 16
Standard Chartered Bank Malaysia Berhad
and its subsidiaries
Pillar 3 Disclosures
5.
(iv) Internal Ratings Based models (continued)
Standard Chartered PLC Group has used conservative assumptions in assessing EAD, in keeping with the
expected experience in an economic downturn.
An EAD model is developed for uncertain exposures such as lines of credit, credit cards, overdrafts and other
commitments. Based on Standard Chartered PLC Group’s experience (and supplemented by external data), EAD
models assess changes to limits and the likely draw-down of undrawn committed and uncommitted limits as an
exposure approaches default. The factor generated by the model and applied to the undrawn limit is referred to as
the Credit Conversion Factor (CCF).
Recoveries are estimated based upon empirical evidence which has shown that factors such as customer
segment and product have predictive content.
All LGD models are conservatively calibrated to a ‘downturn’ – with lower collateral values and lower recoveries
on exposures, compared to those estimated over the long run.
Standard Chartered PLC Group employs a variety of techniques to develop its PD models. In each case the
appropriate approach is dictated by the availability and appropriateness of both internal and external data.
If there is a perceived weakness in the data, for example shorter histories or fewer instances of default, an
appropriate amount of conservatism is applied to predicted default rates.
Shadow Rating Approach – if it is determined that Standard Chartered PLC Group’s internal data does not
provide a sufficient default history (for example, so called ‘low default portfolios’), then Standard Chartered PLC
Group develops models which are designed to be comparable to the ranking of issuer ratings assigned by
established ECAIs, where those agencies have access to large databases of defaults over a long time period on a
variety of credit obligations.
Default History Based (‘Good-Bad’) – where a sufficient number of defaults are available, Standard Chartered
PLC Group deploys a variety of statistical methods to determine the likelihood that counterparties would default on
existing exposures. These methods afford very high discriminatory power by identifying counterparty
characteristics that have a significant predictive ability. The majority of the Group's retail and corporate exposures
are rated under such an approach.
LGD model development
Constrained Expert Judgement – for certain types of exposure there is little or no internal or external default
history, and no reliable external ratings. In such rare cases, Standard Chartered PLC Group has quantitative
frameworks to incorporate expert opinions of Standard Chartered PLC Group’s credit risk management personnel
into the model development process.
The general approaches fall into three categories:-
PD model development
Credit risk (continued)
Credit monitoring (continued)
EAD model development
Standard Chartered PLC Group develops LGD models by assessing recoveries and the forced sale value of
collateral together with the economic costs in securing these recoveries, and the timing with which such cash
flows occur. All such cash flows are then measured at net present value using a suitable discount rate to derive a
recovery rate. LGD is therefore the EAD less these estimated recoveries.
Page 14
Page 17
Standard Chartered Bank Malaysia Berhad
and its subsidiaries
Pillar 3 Disclosures
5.
(iv) Internal Ratings Based models (continued)
•
•
Model use
The use of models is governed by a suite of policies:
Section 5.3 provides further analysis on the Group's and the Bank's credit risk exposures under the IRB approach.
In addition to supporting credit decisions, IRB models also support risk-based pricing methodologies and
measures used to assess business performance.
The credit grading policy and procedure which defines the applicability of each model, details the
procedure for use and sets the conditions and approval authority required to override model output; and
The Standard Chartered PLC Group's Model Risk Policy specifies that models are subject to regular
monitoring and review with underlying Standard Chartered PLC Group's Model Standards for IRB Credit
Risk Models specifying statistical thresholds and other triggers which determine when models need to be
redeveloped.
Credit risk (continued)
Credit monitoring (continued)
Page 15
Page 18
Standard Chartered Bank Malaysia Berhad
and its subsidiaries
Pillar 3 Disclosures
5.
(iv) Internal Ratings Based models (continued)
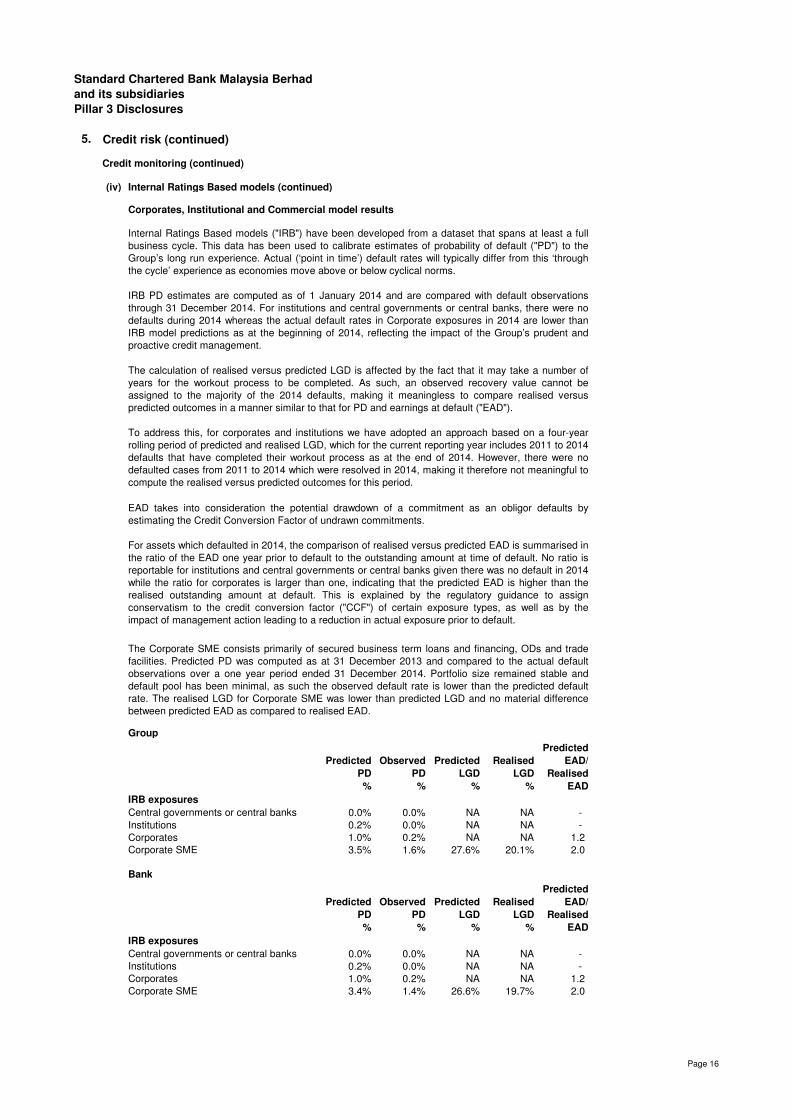
Corporates, Institutional and Commercial model results
Group
Predicted
PD
%
Observed
PD
%
Predicted
LGD
%
Realised
LGD
%
Predicted
EAD/
Realised
EAD
IRB exposures
0.0% 0.0% NA NA -
Institutions 0.2% 0.0% NA NA -
Corporates 1.0% 0.2% NA NA 1.2
3.5% 1.6% 27.6% 20.1% 2.0
Bank
Predicted
PD
%
Observed
PD
%
Predicted
LGD
%
Realised
LGD
%
Predicted
EAD/
Realised
EAD
IRB exposures
0.0% 0.0% NA NA -
0.2% 0.0% NA NA -
1.0% 0.2% NA NA 1.2
3.4% 1.4% 26.6% 19.7% 2.0
Central governments or central banks
Central governments or central banks
Credit risk (continued)
Internal Ratings Based models ("IRB") have been developed from a dataset that spans at least a full
business cycle. This data has been used to calibrate estimates of probability of default ("PD") to the
Group’s long run experience. Actual (‘point in time’) default rates will typically differ from this ‘through
the cycle’ experience as economies move above or below cyclical norms.
IRB PD estimates are computed as of 1 January 2014 and are compared with default observations
through 31 December 2014. For institutions and central governments or central banks, there were no
defaults during 2014 whereas the actual default rates in Corporate exposures in 2014 are lower than
IRB model predictions as at the beginning of 2014, reflecting the impact of the Group’s prudent and
proactive credit management.
The calculation of realised versus predicted LGD is affected by the fact that it may take a number of
years for the workout process to be completed. As such, an observed recovery value cannot be
assigned to the majority of the 2014 defaults, making it meaningless to compare realised versus
predicted outcomes in a manner similar to that for PD and earnings at default ("EAD").
To address this, for corporates and institutions we have adopted an approach based on a four-year
rolling period of predicted and realised LGD, which for the current reporting year includes 2011 to 2014
defaults that have completed their workout process as at the end of 2014. However, there were no
defaulted cases from 2011 to 2014 which were resolved in 2014, making it therefore not meaningful to
compute the realised versus predicted outcomes for this period.
EAD takes into consideration the potential drawdown of a commitment as an obligor defaults by
estimating the Credit Conversion Factor of undrawn commitments.
For assets which defaulted in 2014, the comparison of realised versus predicted EAD is summarised in
the ratio of the EAD one year prior to default to the outstanding amount at time of default. No ratio is
reportable for institutions and central governments or central banks given there was no default in 2014
while the ratio for corporates is larger than one, indicating that the predicted EAD is higher than the
realised outstanding amount at default. This is explained by the regulatory guidance to assign
conservatism to the credit conversion factor ("CCF") of certain exposure types, as well as by the
impact of management action leading to a reduction in actual exposure prior to default.
Credit monitoring (continued)
Corporates
Institutions
Corporate SME
Corporate SME
The Corporate SME consists primarily of secured business term loans and financing, ODs and trade
facilities. Predicted PD was computed as at 31 December 2013 and compared to the actual default
observations over a one year period ended 31 December 2014. Portfolio size remained stable and
default pool has been minimal, as such the observed default rate is lower than the predicted default
rate. The realised LGD for Corporate SME was lower than predicted LGD and no material difference
between predicted EAD as compared to realised EAD.
Page 16
Page 19
Standard Chartered Bank Malaysia Berhad
and its subsidiaries
Pillar 3 Disclosures
5.
(iv)
Retail model results
Group
Predicted
PD
%
Observed
PD
%
Predicted
LGD
%
Realised
LGD
%
Predicted
EAD/
Realised
EAD
IRB exposures
Residential mortgages 3.1% 2.0% 12.7% 11.3% 1.2
Qualifying revolving retail exposures 4.0% 3.3% 67.3% 60.4% 1.3
Other retail exposures * 10.5% 13.5% 83.7% 64.0% 1.2
Bank
Predicted
PD
%
Observed
PD
%
Predicted
LGD
%
Realised
LGD
%
Predicted
EAD/
Realised
EAD
IRB exposures
Residential mortgages 3.1% 1.9% 12.7% 11.2% 1.2
Qualifying revolving retail exposures 4.0% 3.3% 67.3% 60.4% 1.3
Other retail exposures * 10.1% 12.5% 81.4% 61.0% 1.2
* Observed default rate excluding small balance defaults in personal loan exposures
Credit risk (continued)
Internal Ratings Based models (continued)
Retail models have been developed for majority of its portfolios. Predicted PD was computed as at 31
December 2013 and compared to the actual default observations over a one year period ending 31
December 2014.
The observed default rate for all asset classes is lower than the predicted PD with the exception of
Other Retail asset class, the latter comprising residential properties under construction and unsecured
personal term loan/financing. The higher observed default rate for Other Retail asset class as
compared to predicted PD was attributed primarily to personal loans exposures, for which a series of
ongoing portfolio initiatives had been implemented to manage this exposure. New Basel model and
scorecards are being redeveloped to avoid the under-prediction issue for personal loans exposures.
The realised LGD is calculated based on 12 months default window based on recoveries over a 24
months workout period and compared to the predicted LGD. Realised LGDs are lower than the
predicted values for all asset classes, primarily due to the models using ”downturn” parameter settings
to predict LGD.
No material difference between predicted EAD as compared to realised EAD.
Credit monitoring (continued)
Page 17
Page 20
Standard Chartered Bank Malaysia Berhad
and its subsidiaries
Pillar 3 Disclosures
5.
(iv) Actual losses
Group
31 Dec 2014 31 Dec 2013
Actual losses Actual losses
RM'000 RM'000
93,538 20,981
31,987 42,457
119,287 123,605
263,686 275,525
508,498 462,568
Bank
31 Dec 2014 31 Dec 2013
Actual losses Actual losses
RM'000 RM'000
93,538 20,981
30,847 41,722
119,287 123,605
185,740 173,877
429,412 360,185
The higher actual loss as compared to the corresponding year was mainly due to higher corporate
provisions made during the year and the shift of SME exposures from standardised approach to IRB
approach since July 2013.
Credit risk (continued)
Credit monitoring
The tables below show net individual impairment charges raised and write off during the financial
year of 2014 versus 2013 for IRB exposure classes. The net individual impairment charge is a point
in time actual charge raised in accordance with accounting standards that require the Bank to either
provide for or write-off debts when certain conditions are met.
Residential Mortgages
Qualifying Revolving Retail Exposures
Corporates
Corporates
Other Retail
Residential Mortgages
Qualifying Revolving Retail Exposures
Other Retail
Page 18
Page 21
Standard Chartered Bank Malaysia Berhad
and its subsidiaries
Pillar 3 Disclosures
5. Credit risk (continued)
(v) Risk grade profile
Exposures by internal credit grading
B–/CCC CCC/C12A B–/CCC CCC/C
Credit monitoring (continued)
B–
B–/CCC
B–/CCC
CCC/C
CCC/C
12B/C CCC/C
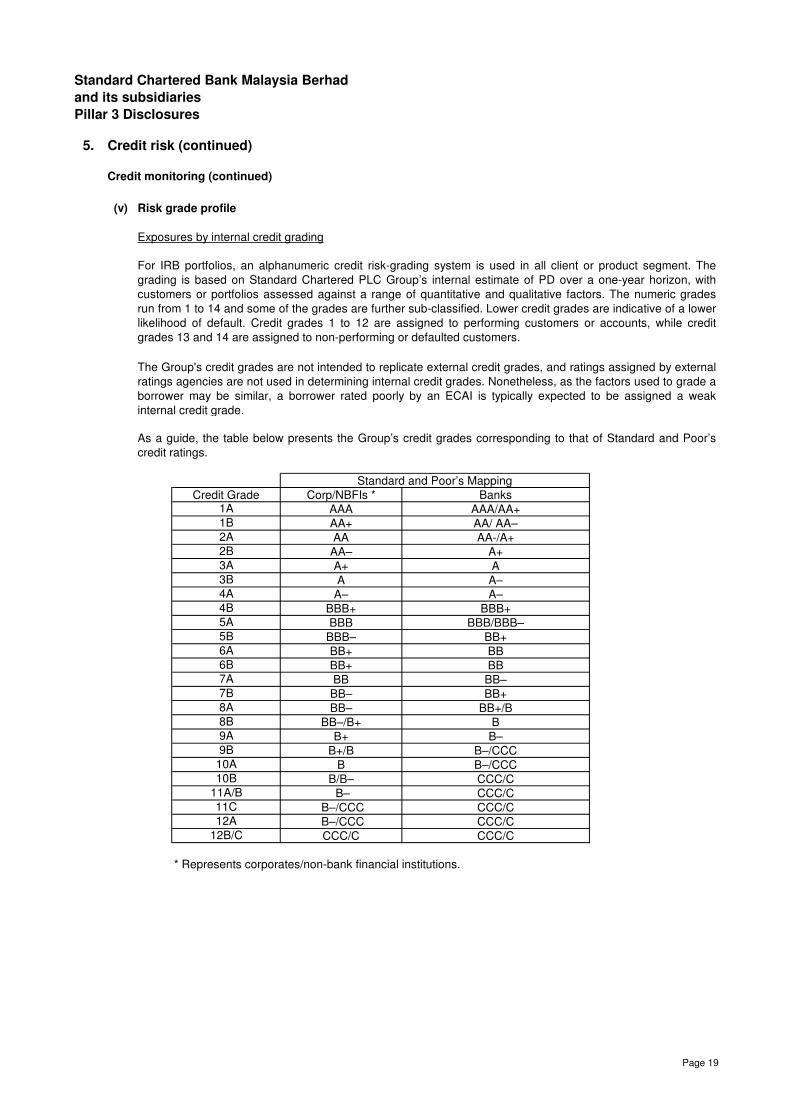
* Represents corporates/non-bank financial institutions.
11A/B B–
9A
9B
10A
10B
B+
B+/B
B
B/B–
CCC/C
11C
7B
8A
8B
BB
BB–
BB–
BB–/B+
BB+
BB+/B
B
5A BBB
For IRB portfolios, an alphanumeric credit risk-grading system is used in all client or product segment. The
grading is based on Standard Chartered PLC Group’s internal estimate of PD over a one-year horizon, with
customers or portfolios assessed against a range of quantitative and qualitative factors. The numeric grades
run from 1 to 14 and some of the grades are further sub-classified. Lower credit grades are indicative of a lower
likelihood of default. Credit grades 1 to 12 are assigned to performing customers or accounts, while credit
grades 13 and 14 are assigned to non-performing or defaulted customers.
The Group's credit grades are not intended to replicate external credit grades, and ratings assigned by external
ratings agencies are not used in determining internal credit grades. Nonetheless, as the factors used to grade a
borrower may be similar, a borrower rated poorly by an ECAI is typically expected to be assigned a weak
internal credit grade.
As a guide, the table below presents the Group’s credit grades corresponding to that of Standard and Poor’s
credit ratings.
1A AAA
2B AA–
AAA/AA+
AA/ AA–
AA-/A+
A+
Standard and Poor’s Mapping
BanksCredit Grade Corp/NBFIs *
1B AA+ 2A AA
5B BBB– 6A
6BBB+
BB+7A
A
A–
A–
BBB+
BBB/BBB–
BB+
BB
BB
BB–
3A A+3B A4A A– 4B BBB+
Page 19
Page 22
Standard Chartered Bank Malaysia Berhad
and its subsidiaries
Pillar 3 Disclosures
5.
(v) Risk grade profile (continued)
•
•
•
•
•
•
(vi) Problem credit management and provisioning
Credit monitoring (continued)
Pricing – In Corporates, Institutional and Commercial clients, a pre-deal pricing calculator is used which
takes into consideration PD, LGD and EAD in the calculation of expected loss and economic capital for
the proposed transactions to ensure appropriate return. Retail Clients pricing considers obligor's risk
profile (as it takes into account the loan size and customer segment), pricing regulations if any, and
competition in the market place;
Limit Setting – In Corporates, Institutional and Commercial clients concentration limits for some
portfolios, as counterparty limits are determined by PD, LGD and EAD. The limits operate on a sliding
scale to ensure that the Group does not have over concentration of low credit quality assets. The
Group’s concentration risk monitoring dashboard utilises IRB Model output such as credit grades, PD,
LGD and EADs. In Retail Clients, portfolio limits are based on recession loss;
In Retail Clients, where there are large numbers of small value loans, a primary indicator of potential impairment
is delinquency. However, not all delinquent loans (particularly those in the early stage of delinquency) will be
impaired. Within Retail Clients, an account is considered to be delinquent when payment is not received on the
due date. For delinquency reporting purposes, the Group measures delinquency as of 1, 30, 60, 90, 120 and
150+ days past due. Accounts that are overdue by more than 30 days are more closely monitored and subject
to specific collections processes.
Credit Approval and Decision – The level of authority required for the sanctioning of credit requests and
the decision made is based on PD, LGD, EL and EAD of the obligor with reference to the nominal
exposure;
Provisioning – Collective Impairment Provision ("CIP") are raised at the portfolio level and are set with
reference to expected loss which is based on PD, LGD and EAD amongst other qualitative and
quantitative factors;
Risk Appetite assessment – PD, LGD and EAD models provide some of the key inputs into the risk-
based methodologies used in the assessment of business and market variables which in turn are key
components in the approach taken in setting Risk Appetite assessment; and
Economic Capital – PD, LGD and EAD are key components of the model in credit risk economic capital
calculation.
Retail Clients
Credit risk (continued)
The Group makes use of internal risk estimates of PD, LGD, EL and EAD in the areas of:-
Credit grades for Retail Clients accounts covered by IRB models are based on a probability of default. These
models are based on application and behavioural scorecards which make use of credit bureau information as
well as the Group's own data.
IRB models cover a substantial majority of the Group's loans and are used extensively in assessing risks at
customer and portfolio level, setting strategy and optimising the Group’s risk-return decisions.
Page 20
Page 23
Standard Chartered Bank Malaysia Berhad
and its subsidiaries
Pillar 3 Disclosures
5.
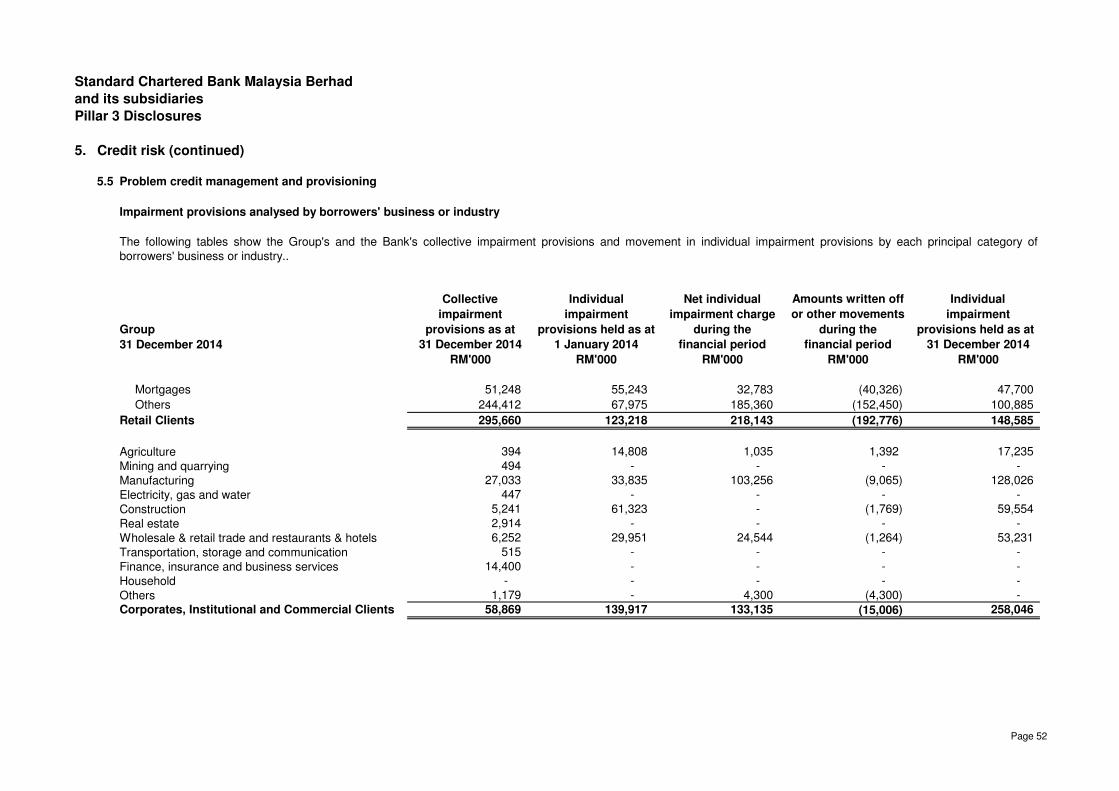
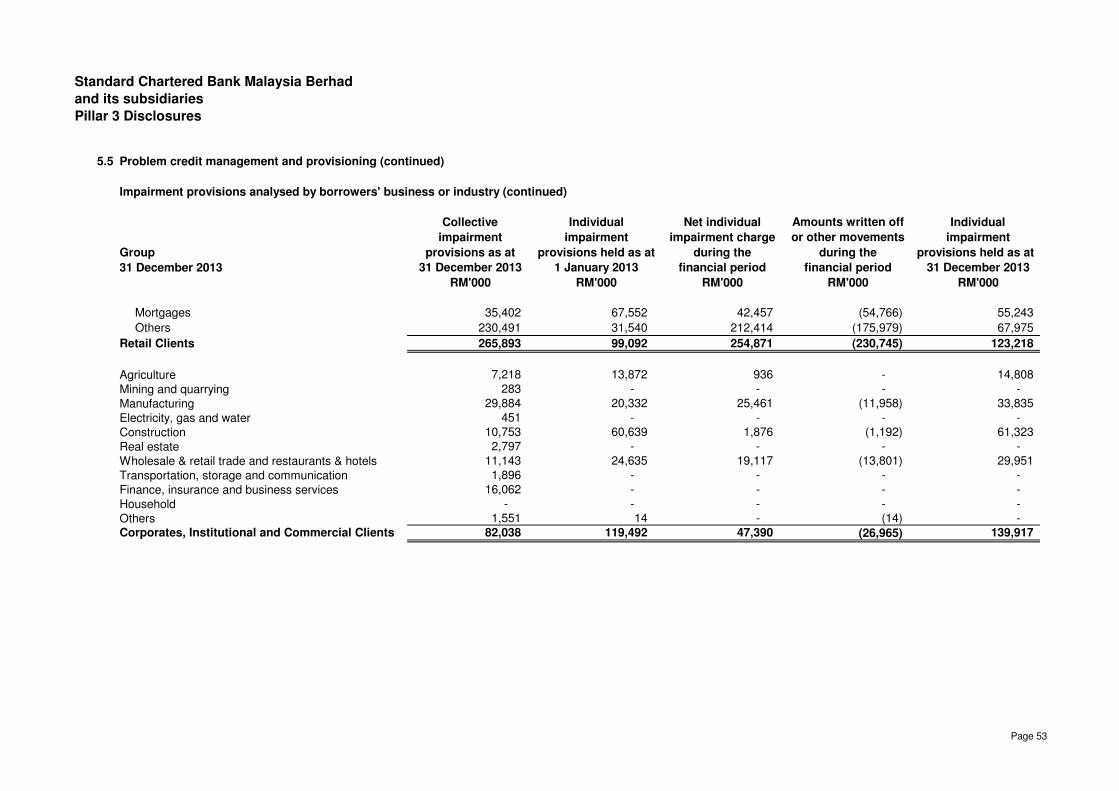
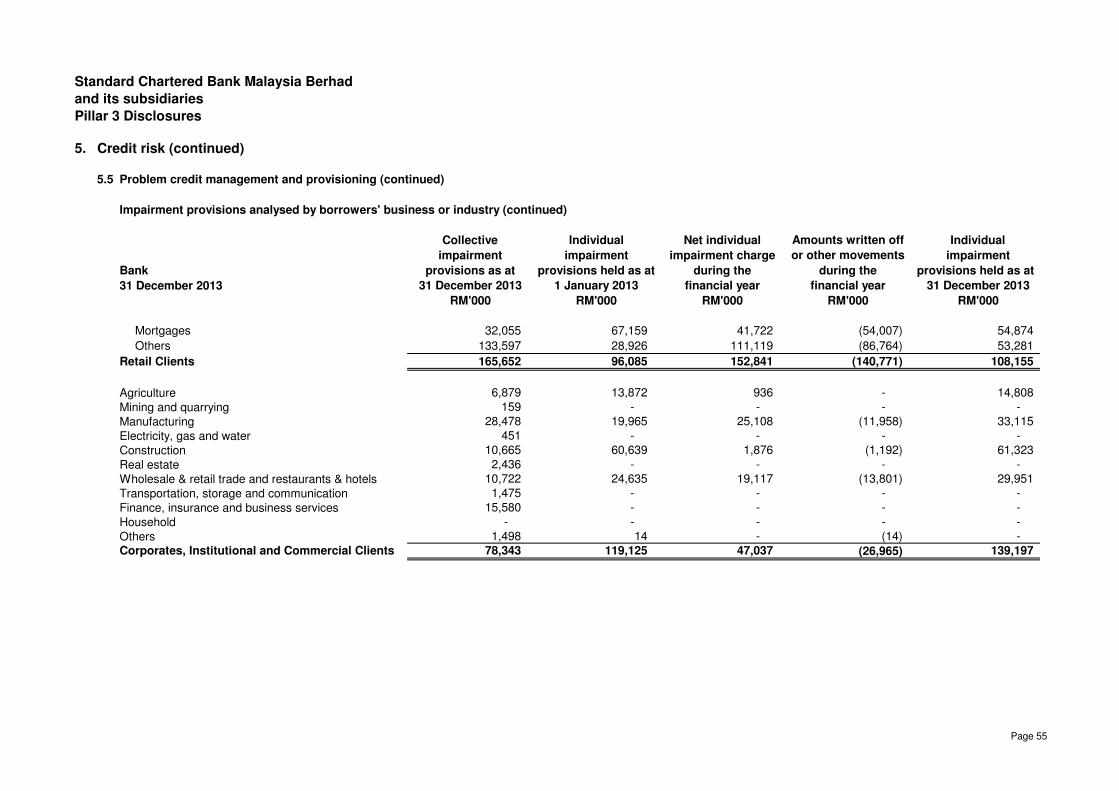
(vi) Problem credit management and provisioning (continued)
Loans are classified as impaired where analysis and review indicates that full payment of either interest or
principal is questionable, or as soon as payment of interest or principal is 90 days overdue. Impaired accounts
are managed by the specialist recovery unit, GSAM, which is separate from our main businesses. Where any
amount is considered irrecoverable, an individual impairment provision is raised. This provision is the difference
between the loan carrying amount and the present value of estimated future cash flows.
The individual circumstances of each customer are taken into account when GSAM estimates future cash flow.
All available sources, such as cash flow arising from operations, selling assets or subsidiaries, realising
collateral or payments under guarantees, are considered. In any decision relating to the raising of provisions,
the Group attempts to balance economic conditions, local knowledge and experience, and the results of
independent asset reviews.
For unsecured products, the entire outstanding amount is generally written off at 150 days past due. Secured
loans IIP are raised at 150 days past due.
The provisions are based on the estimated present values of future cash flows, in particular those resulting from
the realisation of security. Following such realisations any remaining amount will be written off. The days past
due used to trigger write offs and IIP are broadly driven by past experience, which shows that once an account
reaches the relevant number of days past due, the probability of recovery (other than by realising security where
appropriate) is low. For all products, there are certain situations where the individual impairment provisioning or
write off process is accelerated, such as in cases involving bankruptcy, fraud and death. Write off is accelerated
for all restructured accounts to 90 days past due (unsecured) and 120 days past due (secured), respectively.
Credit risk (continued)
Credit monitoring (continued)
Corporates, Institutional and Commercial Clients
As with Retail Clients, a CIP is held to cover the inherent risk of losses which, although not identified, are known
through experience to be present in any loan portfolio. In Corporates, Institutional and Commercial Banking
Clients, this is set with reference to historic loss rates and subjective factors such as the economic environment
and the trends in key portfolio indicators. The CIP methodology provides for accounts for which an IIP has not
been raised.
Where it is considered that there is no realistic prospect of recovering a portion of an exposure against which an
impairment provision has been raised, that amount will be written off.
Provisioning within Retail Clients reflects the fact that the product portfolios consist of a large number of
comparatively small exposures. A CIP is raised on a portfolio basis, however loss recognition / provisioning is
done at account level for problem credit within each product. CIP is set using expected loss rates, based on
past experience supplemented by an assessment of specific factors affecting the relevant portfolio. These
include an assessment of the impact of economic conditions, regulatory changes and portfolio characteristics
such as delinquency trends and early alert trends. The CIP methodology provides for accounts for which an
individual impairment provision ("IIP") has not been raised.
Section 5.5 provides further analysis on the Group's and the Bank's exposures on problem credit management
and provisioning.
Page 21
Page 24
Standard Chartered Bank Malaysia Berhad
and its subsidiaries
Pillar 3 Disclosures
5.
(vii) Counterparty credit risk in the trading book
Credit reserves
Wrong way risk
Exposure value calculation
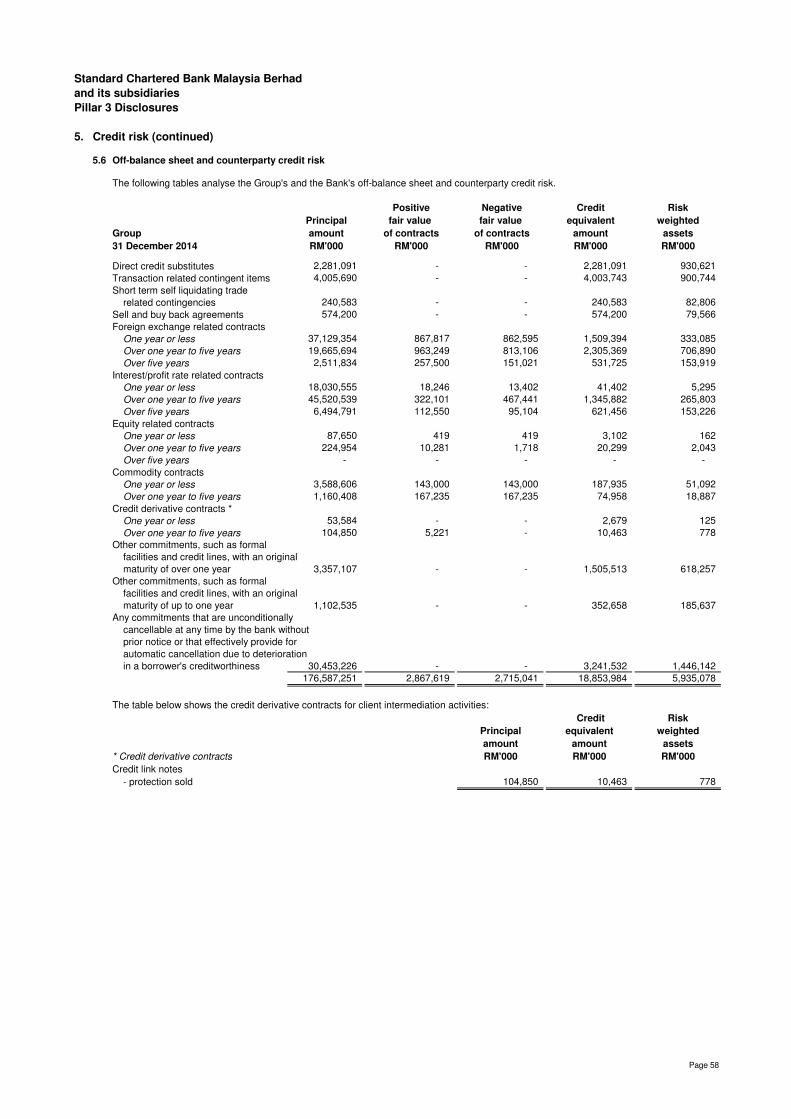
Section 5.6 provides further analysis on the Group's off-balance sheet and counterparty credit risk.
A daily operational process takes place to calculate the MTM on all trades captured under the CSA. Additional
collateral will be called from the counterparty if total uncollateralised MTM exposure exceeds the threshold and
minimum transfer amount specified in the CSA to provide an extra buffer to the daily variation margin process.
The Group will seek to negotiate Credit Support Annexes (“CSA”) with counterparties on a case by case basis,
where collateral is deemed a necessary or desirable mitigant to the exposure. The credit terms of the CSA are
specific to each legal document and determined by the credit risk approval unit responsible for the counterparty.
The nature of the collateral will be specified in the legal document and will typically be cash or highly liquid
securities.
Using risk factors such as PD and LGD, a Regulatory Expected Loss is calculated for each counterparty across
the CCR portfolio, and based on this calculation, credit reserves are set aside for traded products. The reserve
is a dynamic calculation based on the EAD risk profile for each counterparty, alongside PD and LGD factors.
In line with market convention, the Group negotiates CSA terms for certain counterparties where the thresholds
related to each party are dependent on their internal rating model. Such clauses are typically mutual in nature. It
is therefore recognised that a downgrade in the Group’s rating could result in counterparties seeking additional
collateral calls to cover negative MTM portfolios where thresholds are lowered.
Wrong way risk occurs when either the EAD or LGD increases as the credit quality of an obligor decreases. For
example, as the MTM on a derivative contract increases in favour of the Group, this can correspond to a higher
replacement cost (EAD), and the counterparty may increasingly be unable to meet its obligations. Furthermore
the EAD may become larger as the counterparty finds it harder to meet its payment, margin call or collateral
posting requirements. The Group employs various policies and procedures to ensure that deterioration in credit
grading is alerted to management.
Exposure values for regulatory capital purposes on over the counter traded products are calculated according
to the CCR MTM method. This is calculated as a sum of the current replacement cost and the potential future
credit exposure. The current replacement cost is the Ringgit equivalent amount owed by the counterparty to the
Group for various financial derivative transactions. The potential future credit exposure is an add-on based on a
percentage of the notional principal of each transaction. Such percentages vary according to the underlying
asset class and tenor of each trade.
Counterparty credit risk (“CCR”) is the risk that the Group’s counterparty in a foreign exchange, interest rate,
commodity, equity or credit derivative contract defaults prior to maturity date of the contract and that the Group
at the time has a claim on the counterparty. CCR arises predominantly in the trading book, but also arises in the
non-trading book due to hedging of external funding.
Credit risk (continued)
Credit monitoring (continued)
The credit risk arising from all financial derivatives is managed as part of the overall lending limits to banks and
customers.
Page 22
Page 25
Standard Chartered Bank Malaysia Berhad
and its subsidiaries
Pillar 3 Disclosures
5. Credit risk
5.1 Exposure values
Geographical analysis
Group
31 December 2014
IRB exposures
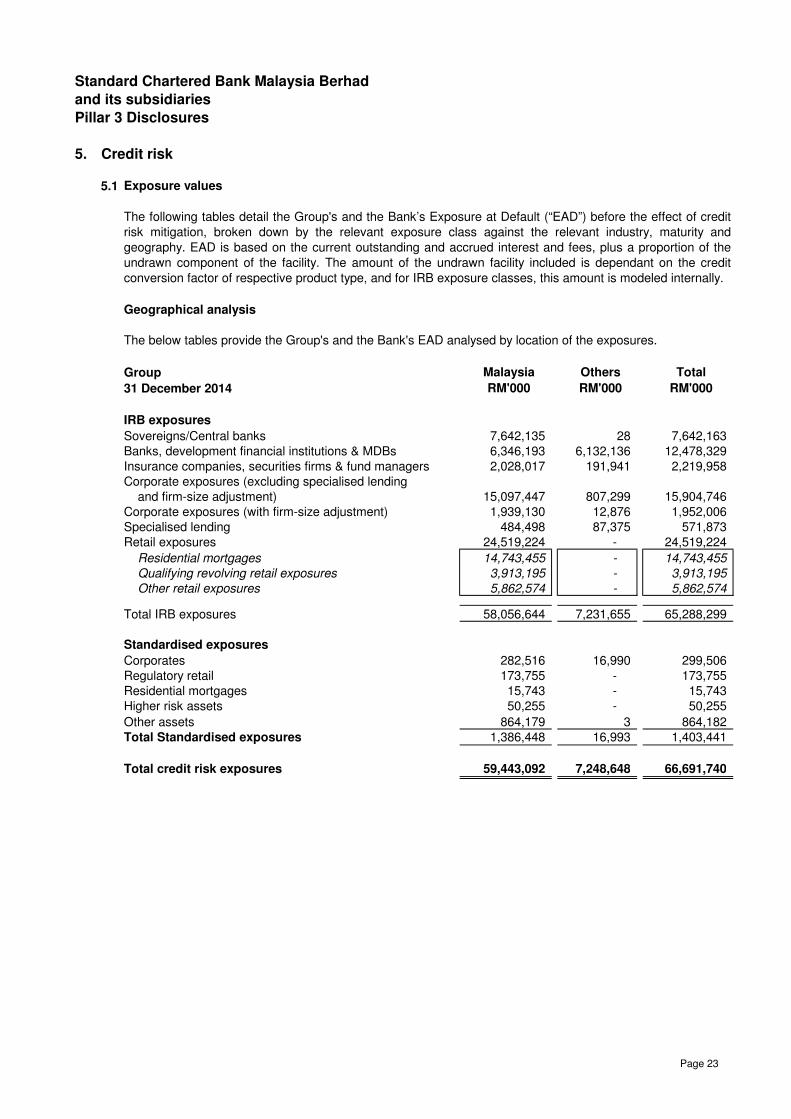
Sovereigns/Central banks 7,642,135 28 7,642,163
Banks, development financial institutions & MDBs 6,346,193 6,132,136 12,478,329
Insurance companies, securities firms & fund managers 2,028,017 191,941 2,219,958
Corporate exposures (excluding specialised lending
and firm-size adjustment) 15,097,447 807,299 15,904,746
Corporate exposures (with firm-size adjustment) 1,939,130 12,876 1,952,006
Specialised lending 484,498 87,375 571,873
Retail exposures 24,519,224 - 24,519,224
Residential mortgages 14,743,455 - 14,743,455
Qualifying revolving retail exposures 3,913,195 - 3,913,195
Other retail exposures 5,862,574 - 5,862,574
Total IRB exposures 58,056,644 7,231,655 65,288,299
Standardised exposures
Corporates 282,516 16,990 299,506
Regulatory retail 173,755 - 173,755
Residential mortgages 15,743 - 15,743
Higher risk assets 50,255 - 50,255
Other assets 864,179 3 864,182
Total Standardised exposures 1,386,448 16,993 1,403,441
Total credit risk exposures 59,443,092 7,248,648 66,691,740
RM'000 RM'000 RM'000
The following tables detail the Group's and the Bank’s Exposure at Default (“EAD”) before the effect of credit
risk mitigation, broken down by the relevant exposure class against the relevant industry, maturity and
geography. EAD is based on the current outstanding and accrued interest and fees, plus a proportion of the
undrawn component of the facility. The amount of the undrawn facility included is dependant on the credit
conversion factor of respective product type, and for IRB exposure classes, this amount is modeled internally.
OthersMalaysia Total
The below tables provide the Group's and the Bank's EAD analysed by location of the exposures.
Page 23
Page 26
Standard Chartered Bank Malaysia Berhad
and its subsidiaries
Pillar 3 Disclosures
5. Credit risk (continued)
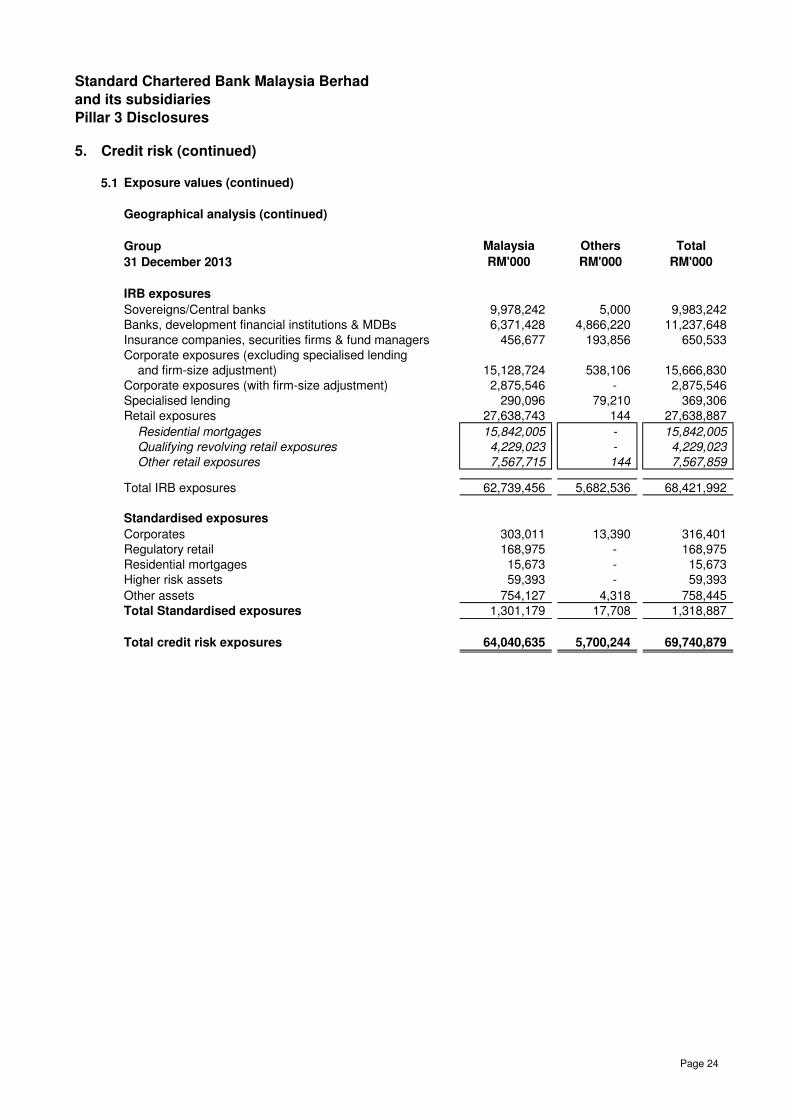
5.1 Exposure values (continued)
Geographical analysis (continued)
Group
31 December 2013
IRB exposures
Sovereigns/Central banks 9,978,242 5,000 9,983,242
Banks, development financial institutions & MDBs 6,371,428 4,866,220 11,237,648
Insurance companies, securities firms & fund managers 456,677 193,856 650,533
Corporate exposures (excluding specialised lending
and firm-size adjustment) 15,128,724 538,106 15,666,830
Corporate exposures (with firm-size adjustment) 2,875,546 - 2,875,546
Specialised lending 290,096 79,210 369,306
Retail exposures 27,638,743 144 27,638,887
Residential mortgages 15,842,005 - 15,842,005
Qualifying revolving retail exposures 4,229,023 - 4,229,023
Other retail exposures 7,567,715 144 7,567,859
Total IRB exposures 62,739,456 5,682,536 68,421,992
Standardised exposures
Corporates 303,011 13,390 316,401
Regulatory retail 168,975 - 168,975
Residential mortgages 15,673 - 15,673
Higher risk assets 59,393 - 59,393
Other assets 754,127 4,318 758,445
Total Standardised exposures 1,301,179 17,708 1,318,887
Total credit risk exposures 64,040,635 5,700,244 69,740,879
Malaysia Others Total
RM'000 RM'000 RM'000
Page 24
Page 27
Standard Chartered Bank Malaysia Berhad
and its subsidiaries
Pillar 3 Disclosures
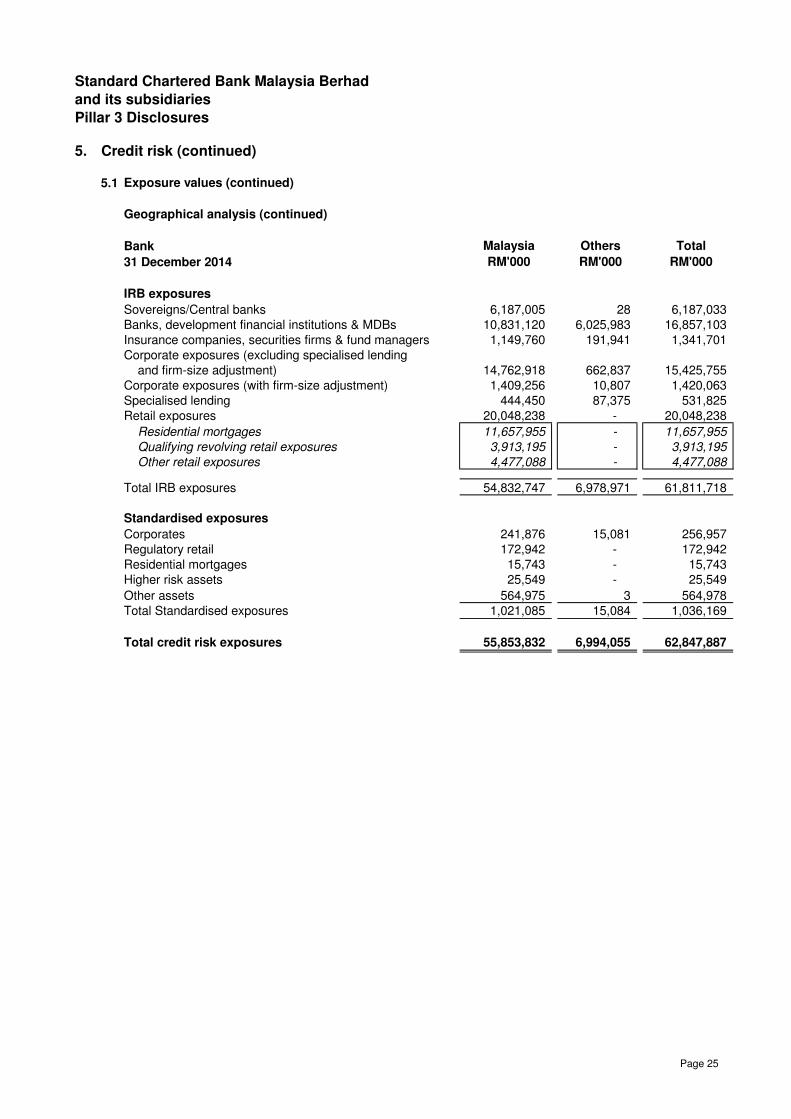
5. Credit risk (continued)
5.1 Exposure values (continued)
Geographical analysis (continued)
Bank
31 December 2014
IRB exposures
Sovereigns/Central banks 6,187,005 28 6,187,033
Banks, development financial institutions & MDBs 10,831,120 6,025,983 16,857,103
Insurance companies, securities firms & fund managers 1,149,760 191,941 1,341,701
Corporate exposures (excluding specialised lending
and firm-size adjustment) 14,762,918 662,837 15,425,755
Corporate exposures (with firm-size adjustment) 1,409,256 10,807 1,420,063
Specialised lending 444,450 87,375 531,825
Retail exposures 20,048,238 - 20,048,238
Residential mortgages 11,657,955 - 11,657,955
Qualifying revolving retail exposures 3,913,195 - 3,913,195
Other retail exposures 4,477,088 - 4,477,088
Total IRB exposures 54,832,747 6,978,971 61,811,718
Standardised exposures
Corporates 241,876 15,081 256,957
Regulatory retail 172,942 - 172,942
Residential mortgages 15,743 - 15,743
Higher risk assets 25,549 - 25,549
Other assets 564,975 3 564,978
Total Standardised exposures 1,021,085 15,084 1,036,169
Total credit risk exposures 55,853,832 6,994,055 62,847,887
RM'000 RM'000 RM'000
Malaysia Others Total
Page 25
Page 28
Standard Chartered Bank Malaysia Berhad
and its subsidiaries
Pillar 3 Disclosures
5. Credit risk (continued)
5.1 Exposure values (continued)
Geographical analysis (continued)
Bank
31 December 2013
IRB exposures
Sovereigns/Central banks 7,736,070 5,000 7,741,070
Banks, development financial institutions & MDBs 9,031,441 4,866,220 13,897,661
Insurance companies, securities firms & fund managers 450,397 193,856 644,253
Corporate exposures (excluding specialised lending
and firm-size adjustment) 14,565,346 507,714 15,073,060
Corporate exposures (with firm-size adjustment) 2,245,024 - 2,245,024
Specialised lending 179,168 79,210 258,378
Retail exposures 23,125,008 144 23,125,152
Residential mortgages 13,059,682 - 13,059,682
Qualifying revolving retail exposures 4,229,023 - 4,229,023
Other retail exposures 5,836,303 144 5,836,447
Total IRB exposures 57,332,454 5,652,144 62,984,598
Standardised exposures
Corporates 265,797 12,914 278,711
Regulatory retail 167,782 - 167,782
Residential mortgages 15,673 - 15,673
Higher risk assets 26,020 - 26,020
Other assets 567,151 4,318 571,469
Total Standardised exposures 1,042,423 17,232 1,059,655
Total credit risk exposures 58,374,877 5,669,376 64,044,253
Malaysia Others Total
RM'000 RM'000 RM'000
Page 26
Page 29
Standard Chartered Bank Malaysia Berhad
and its subsidiaries
Pillar 3 Disclosures
5. Credit risk (continued)
5.1 Exposure values (continued)
Sector or economic purpose analysis
The below tables provide the Group's and the Bank's EAD analysed by sector or economic purpose of the exposure.
storage and
Group
31 December 2014
IRB exposures
Sovereigns/Central banks - - - - - - - 7,642,163 - - - 7,642,163
Banks, development financial
institutions & MDBs - - - - - - - 12,478,329 - - - 12,478,329
Insurance companies, securities firms &
fund managers - - - - - - - 2,219,958 - - - 2,219,958
Corporate exposures (excluding
specialised lending and firm-size
adjustment) 213,246 1,098,949 6,220,661 174,841 1,701,814 3,123,868 905,123 888,674 1,269,143 - 308,427 15,904,746
Corporate exposures (with firm-size
adjustment) 15,723 37,708 294,664 1 63,881 207,790 97,066 142,093 96,344 - 996,736 1,952,006
Specialised lending - 7,213 121,250 129,722 - 1,500 - 183,701 128,487 - - 571,873
Retail exposures 5,967 4,028 110,244 727 63,499 275,635 28,540 50,522 11,813 20,576,764 3,391,485 24,519,224
Residential mortgages - - - - - - - - - 14,743,455 - 14,743,455
Qualifying revolving retail exposures - - - - - - - - - 3,913,195 - 3,913,195
Other retail exposures 5,967 4,028 110,244 727 63,499 275,635 28,540 50,522 11,813 1,920,114 3,391,485 5,862,574
Total IRB exposures 234,936 1,147,898 6,746,819 305,291 1,829,194 3,608,793 1,030,729 23,605,440 1,505,787 20,576,764 4,696,648 65,288,299
Standardised exposures
Corporates 288 - 32,874 - 234,434 10,031 - 52 - - 21,827 299,506
Regulatory retail - - - - 593 231 - - 4 172,927 - 173,755
Residential mortgages - - - - - - - - - 15,743 - 15,743
Higher risk assets - - 25,281 - - - - - - 24,974 - 50,255
Other assets - - 57 - 258 3,621 14,335 298 - 259,916 585,697 864,182
Total Standardised exposures 288 - 58,212 - 235,285 13,883 14,335 350 4 473,560 607,524 1,403,441
Total credit risk exposures 235,224 1,147,898 6,805,031 305,291 2,064,479 3,622,676 1,045,064 23,605,790 1,505,791 21,050,324 5,304,172 66,691,740
Total
RM'000RM'000RM'000 RM'000 RM'000RM'000 RM'000RM'000 RM'000
Real
Othersestatewater communication services Household
and business
and fishing
forestry
Agricultural, Finance,Wholesale &
Electricity, retail trade andhunting,
Manufacturing
gas and
insurance
restaurants
Transportation
Construction & hotelsquarrying
Mining and
RM'000 RM'000 RM'000
Page 27
Page 30
Standard Chartered Bank Malaysia Berhad
and its subsidiaries
Pillar 3 Disclosures
5. Credit risk (continued)
5.1 Exposure values (continued)
Sector or economic purpose analysis (continued)
storage and
Group
31 December 2013
IRB exposures
Sovereigns/Central banks - - - - - - - 9,983,242 - - - 9,983,242
Banks, development financial
institutions & MDBs - - - - - - - 11,237,648 - - - 11,237,648
Insurance companies, securities firms &
fund managers - - - - - - - 650,533 - - - 650,533
Corporate exposures (excluding
specialised lending and firm-size
adjustment) 650,545 927,372 5,338,544 97,123 1,868,338 2,509,445 1,580,056 1,037,931 886,428 - 771,048 15,666,830
Corporate exposures (with firm-size
adjustment) 1,513 53,410 522,155 - 14,516 632,842 189,799 23,517 468,784 - 969,010 2,875,546
Specialised lending - 9,725 68,029 111,140 - - - 69,484 110,928 - - 369,306
Retail exposures 5,255 4,380 297,772 2,048 97,163 609,597 55,262 60,987 6,934 22,798,761 3,700,728 27,638,887
Residential mortgages - - - - - - - - - 15,842,005 - 15,842,005
Qualifying revolving retail exposures - - - - - - - - - 4,229,023 - 4,229,023
Other retail exposures 5,255 4,380 297,772 2,048 97,163 609,597 55,262 60,987 6,934 2,727,733 3,700,728 7,567,859
Total IRB exposures 657,313 994,887 6,226,500 210,311 1,980,017 3,751,884 1,825,117 23,063,342 1,473,074 22,798,761 5,440,786 68,421,992
Standardised exposures
Corporates 4,184 - 28,248 - 240,497 21,085 259 14 - - 22,114 316,401
Regulatory retail - - 85 - 3,523 128 - - - 164,492 747 168,975
Residential mortgages - - - - - - - - - 15,673 - 15,673
Higher risk assets - - 25,748 - - - - - - 33,645 - 59,393
Other assets - - - - - - - - - 2,082 756,363 758,445
Total Standardised exposures 4,184 - 54,081 - 244,020 21,213 259 14 - 215,892 779,224 1,318,887
Total credit risk exposures 661,497 994,887 6,280,581 210,311 2,224,037 3,773,097 1,825,376 23,063,356 1,473,074 23,014,653 6,220,010 69,740,879
RM'000
Mining and
RM'000RM'000 RM'000
Total
Transportation
and business
RM'000
Finance,
communication
gas and
Wholesale &
Construction
retail trade and
Agricultural,
hunting, Electricity,
quarrying Manufacturing waterand fishing Householdestate
RM'000
Others
RM'000RM'000
restaurants
& hotels
RM'000
forestry
services
RM'000
Real
RM'000 RM'000
insurance
Page 28
Page 31
Standard Chartered Bank Malaysia Berhad
and its subsidiaries
Pillar 3 Disclosures
5. Credit risk (continued)
5.1 Exposure values (continued)
storage and
Bank
31 December 2014
IRB exposures
Sovereigns/Central banks - - - - - - - 6,187,033 - - - 6,187,033
Banks, development financial
institutions & MDBs - - - - - - - 16,857,103 - - - 16,857,103
Insurance companies, securities firms &
fund managers - - - - - - - 1,341,701 - - - 1,341,701
Corporate exposures (excluding
specialised lending and firm-size
adjustment) 92,596 1,072,906 5,773,890 174,841 1,689,580 2,958,465 814,127 916,097 1,142,877 - 790,376 15,425,755
Corporate exposures (with firm-size
adjustment) 15,723 37,368 261,282 1 7,091 206,239 71,515 112,739 83,525 - 624,580 1,420,063
Specialised lending - 7,213 121,250 129,722 - 1,500 - 183,701 88,439 - - 531,825
Retail exposures 4,166 1,406 75,836 446 38,566 202,649 15,917 27,253 11,442 17,020,016 2,650,541 20,048,238
Residential mortgages - - - - - - - - - 11,657,955 - 11,657,955
Qualifying revolving retail exposures - - - - - - - - - 3,913,195 - 3,913,195
Other retail exposures 4,166 1,406 75,836 446 38,566 202,649 15,917 27,253 11,442 1,448,866 2,650,541 4,477,088
Total IRB exposures 112,485 1,118,893 6,232,258 305,010 1,735,237 3,368,853 901,559 25,625,627 1,326,283 17,020,016 4,065,497 61,811,718
Standardised exposures
Corporates 288 - 32,874 - 193,794 10,031 - 52 - - 19,918 256,957
Regulatory retail - - - - 375 231 - - 4 172,332 - 172,942
Residential mortgages - - - - - - - - - 15,743 - 15,743
Higher risk assets - - 25,281 - - - - - - 268 - 25,549
Other assets - - 57 - 258 3,621 14,335 298 - 25,289 521,120 564,978
Total Standardised exposures 288 - 58,212 - 194,427 13,883 14,335 350 4 213,632 541,038 1,036,169
Total credit risk exposures 112,773 1,118,893 6,290,470 305,010 1,929,664 3,382,736 915,894 25,625,977 1,326,287 17,233,648 4,606,535 62,847,887
water ConstructionManufacturingquarrying & hotels
Sector or economic purpose analysis (continued)
hunting,
Others
Realgas and forestry Mining and
Agricultural,
RM'000
Electricity,
RM'000RM'000 RM'000RM'000 RM'000
and fishing Total
RM'000RM'000 RM'000
retail trade and insurance
Wholesale &
estate
RM'000
Household
and business
Transportation
communication
Finance,
RM'000
restaurants
RM'000
services
Page 29
Page 32
Standard Chartered Bank Malaysia Berhad
and its subsidiaries
Pillar 3 Disclosures
5. Credit risk (continued)
5.1 Exposure values (continued)
storage and
Bank
31 December 2013
IRB exposures
Sovereigns/Central banks - - - - - - - 7,741,070 - - - 7,741,070
Banks, development financial
institutions & MDBs - - - - - - - 13,897,661 - - - 13,897,661
Insurance companies, securities firms &
fund managers - - - - - - - 644,253 - - - 644,253
Corporate exposures (excluding
specialised lending and firm-size
adjustment) 660,366 852,876 5,208,487 97,123 1,829,644 2,344,326 1,563,785 1,029,312 754,423 - 732,718 15,073,060
Corporate exposures (with firm-size
adjustment) 1,513 53,410 476,198 - 14,516 626,191 31,482 8,718 451,291 - 581,705 2,245,024
Specialised lending - 9,725 68,029 111,140 - - - 69,484 - - - 258,378
Retail exposures 3,626 4,081 244,452 1,825 75,216 539,402 36,506 46,035 6,802 19,194,291 2,972,916 23,125,152
Residential mortgages - - - - - - - - - 13,059,682 - 13,059,682
Qualifying revolving retail exposures - - - - - - - - - 4,229,023 - 4,229,023
Other retail exposures 3,626 4,081 244,452 1,825 75,216 539,402 36,506 46,035 6,802 1,905,586 2,972,916 5,836,447
Total IRB exposures 665,505 920,092 5,997,166 210,088 1,919,376 3,509,919 1,631,773 23,436,533 1,212,516 19,194,291 4,287,339 62,984,598
Standardised exposures
Corporates 4,184 - 28,248 - 203,284 21,085 259 14 - - 21,637 278,711
Regulatory retail - - 85 - 3,077 128 - - - 164,492 - 167,782
Residential mortgages - - - - - - - - - 15,673 - 15,673
Higher risk assets - - 25,748 - - - - - - 272 - 26,020
Other assets - - - - - - - - - 2,082 569,387 571,469
Total Standardised exposures 4,184 - 54,081 - 206,361 21,213 259 14 - 182,519 591,024 1,059,655
Total credit risk exposures 669,689 920,092 6,051,247 210,088 2,125,737 3,531,132 1,632,032 23,436,547 1,212,516 19,376,810 4,878,363 64,044,253
Finance,
Sector or economic purpose analysis (continued)
Agricultural,
retail trade and
Wholesale &
and fishing quarrying Manufacturing water Construction
hunting, Electricity,
forestry Mining and gas and
Transportation insurance
and business Realrestaurants
RM'000 RM'000 RM'000
Total
RM'000 RM'000 RM'000 RM'000 RM'000 RM'000 RM'000 RM'000 RM'000
services estate& hotels communication Household Others
Page 30
Page 33
Standard Chartered Bank Malaysia Berhad
and its subsidiaries
Pillar 3 Disclosures
5. Credit risk (continued)
5.1 Exposure values (continued)
Residual contractual maturity analysis
Group
31 December 2014
IRB exposures
Sovereigns/Central banks 4,330,561 3,311,359 243 7,642,163
Banks, development financial institutions & MDBs 6,235,321 5,451,846 791,162 12,478,329
Insurance companies, securities firms & fund
managers 1,733,335 467,172 19,451 2,219,958
Corporate exposures (excluding specialised
lending and firm-size adjustment) 11,643,516 3,194,867 1,066,363 15,904,746
Corporate exposures (with firm-size adjustment) 890,497 170,922 890,587 1,952,006
Specialised lending 40,048 197,592 334,233 571,873
Retail exposures 4,449,489 5,544,002 14,525,733 24,519,224
Residential mortgages 3,243,168 394,505 11,105,782 14,743,455
Qualifying revolving retail exposures 623,408 3,146,124 143,663 3,913,195
Other retail exposures 582,913 2,003,373 3,276,288 5,862,574
Total IRB exposures 29,322,767 18,337,760 17,627,772 65,288,299
Corporates 207,874 70,973 20,659 299,506
Regulatory retail 72,673 12,493 88,589 173,755
Residential mortgages 43 786 14,914 15,743
Higher risk assets 49,996 6 253 50,255
Other assets 775,367 18,000 70,815 864,182
Total Standardised exposures 1,105,953 102,258 195,230 1,403,441
Total credit risk exposures 30,428,720 18,440,018 17,823,002 66,691,740
> 1 - 5
RM'000
year years
Over 5
RM'000
The following tables show the Group's and the Bank's residual maturity of EAD by each principal category of
exposure class.
years Total
RM'000 RM'000
Note: The above table shows that exposures with residual contractual maturity more than 5 years amounted to
RM17,823,001,660. Of this amount, 60% are collateralized.
Up to 1
Page 31
Page 34
Standard Chartered Bank Malaysia Berhad
and its subsidiaries
Pillar 3 Disclosures
5. Credit risk (continued)
5.1 Exposure values (continued)
Residual contractual maturity analysis (continued)
Group
31 December 2013
IRB exposures
Sovereigns/Central banks 7,909,936 2,073,063 243 9,983,242
Banks, development financial institutions & MDBs 6,473,546 4,038,785 725,317 11,237,648
Insurance companies, securities firms & fund
managers 371,197 220,880 58,456 650,533
Corporate exposures (excluding specialised
lending and firm-size adjustment) 10,769,157 4,187,230 710,443 15,666,830
Corporate exposures (with firm-size adjustment) 1,494,592 302,398 1,078,556 2,875,546
Specialised lending 50,011 136,200 183,095 369,306
Retail exposures 5,573,651 6,651,272 15,413,964 27,638,887
Residential mortgages 3,597,277 370,148 11,874,580 15,842,005
Qualifying revolving retail exposures 885,417 3,159,983 183,623 4,229,023
Other retail exposures 1,090,957 3,121,141 3,355,761 7,567,859
Total IRB exposures 32,642,090 17,609,828 18,170,074 68,421,992
Standardised exposures
Corporates 206,265 93,980 16,156 316,401
Regulatory retail 62,609 15,026 91,340 168,975
Residential mortgages 193 781 14,699 15,673
Higher risk assets 59,121 10 262 59,393
Other assets 641,873 8,676 107,896 758,445
Total Standardised exposures 970,061 118,473 230,353 1,318,887
Total credit risk exposures 33,612,151 17,728,301 18,400,427 69,740,879
Over 5
Total
RM'000
year years
Note: The above table shows that exposures with residual contractual maturity more than 5 years amounted to
RM18,400,426,317. Of this amount, 63% are collateralized.
years
Up to 1
RM'000
> 1 - 5
RM'000 RM'000
Page 32
Page 35
Standard Chartered Bank Malaysia Berhad
and its subsidiaries
Pillar 3 Disclosures
5. Credit risk (continued)
5.1 Exposure values (continued)
Residual contractual maturity analysis (continued)
Bank
31 December 2014
IRB exposures
Sovereigns/Central banks 3,126,881 3,059,909 243 6,187,033
Banks, development financial institutions & MDBs 12,004,841 3,960,118 892,144 16,857,103
Insurance companies, securities firms & fund
managers 1,056,040 266,210 19,451 1,341,701
Corporate exposures (excluding specialised
lending and firm-size adjustment) 11,392,151 3,227,564 806,040 15,425,755
Corporate exposures (with firm-size adjustment) 777,093 70,049 572,921 1,420,063
Specialised lending - 197,592 334,233 531,825
Retail exposures 1,454,508 5,075,216 13,518,514 20,048,238
Residential mortgages 431,145 387,896 10,838,914 11,657,955
Qualifying revolving retail exposures 623,408 3,146,124 143,663 3,913,195
Other retail exposures 399,955 1,541,196 2,535,937 4,477,088
Total IRB exposures 29,811,514 15,856,658 16,143,546 61,811,718
Standardised exposures
Corporates 194,668 43,265 19,024 256,957
Regulatory retail 72,673 11,897 88,372 172,942
Residential mortgages 43 786 14,914 15,743
Higher risk assets 25,290 6 253 25,549
Other assets 476,163 18,000 70,815 564,978
Total Standardised exposures 768,837 73,954 193,378 1,036,169
Total credit risk exposures 30,580,351 15,930,612 16,336,924 62,847,887
yearsyear
Note: The above table shows that exposures with residual contractual maturity more than 5 years amounted to
RM16,336,924,012. Of this amount, 64% are collateralized.
RM'000
Over 5Up to 1 > 1 - 5
Total
RM'000RM'000 RM'000
years
Page 33
Page 36
Standard Chartered Bank Malaysia Berhad
and its subsidiaries
Pillar 3 Disclosures
5. Credit risk (continued)
5.1 Exposure values (continued)
Residual contractual maturity analysis (continued)
Bank
31 December 2013
IRB exposures
Sovereigns/Central banks 5,667,764 2,073,063 243 7,741,070
Banks, development financial institutions & MDBs 9,129,374 4,040,466 727,821 13,897,661
Insurance companies, securities firms & fund
managers 364,916 220,888 58,449 644,253
Corporate exposures (excluding specialised
lending and firm-size adjustment) 10,427,717 3,937,605 707,738 15,073,060
Corporate exposures (with firm-size adjustment) 1,300,349 218,885 725,790 2,245,024
Specialised lending - 75,283 183,095 258,378
Retail exposures 2,820,247 5,768,991 14,535,914 23,125,152
Residential mortgages 1,119,826 363,617 11,576,239 13,059,682
Qualifying revolving retail exposures 885,417 3,159,983 183,623 4,229,023
Other retail exposures 815,004 2,245,391 2,776,052 5,836,447
Total IRB exposures 29,710,367 16,335,181 16,939,050 62,984,598
Standardised exposures
Corporates 200,104 62,588 16,019 278,711
Regulatory retail 62,493 14,528 90,761 167,782
Residential mortgages 193 781 14,699 15,673
Higher risk assets 25,748 10 262 26,020
Other assets 454,897 8,676 107,896 571,469
Total Standardised exposures 743,435 86,583 229,637 1,059,655
Total credit risk exposures 30,453,802 16,421,764 17,168,687 64,044,253
Note: The above table shows that exposures with residual contractual maturity more than 5 years amounted to
RM17,168,687,000. Of this amount, 65% are collateralized.
Up to 1 > 1 - 5 Over 5
RM'000 RM'000 RM'000 RM'000
year years years Total
Page 34
Page 37
Standard Chartered Bank Malaysia Berhad
and its subsidiaries
Pillar 3 Disclosures
5. Credit risk (continued)
5.2 Credit risk mitigation
Group
31 December 2014
On-balance sheet exposures
Sovereigns/Central banks 7,642,135 - - -
Banks, development financial institutions & MDBs 5,655,384 8,987 - -
Insurance companies, securities firms & fund
managers 1,930,976 222,378 3,570 -
Corporates 9,653,409 83,259 640,585 1,428,883
Regulatory retail 6,966,341 2,300 94,779 13,791
Residential mortgages 13,156,733 - - 12,283,837
Higher risk assets 24,706 - - -
Other assets 857,345 - 2,663 -
Specialised financing/investment 407,514 49,407 2,134 -
Defaulted exposures 1,543,213 - 40,226 391,484
Total on-balance sheet exposures 47,837,756 366,331 783,957 14,117,995
Off-balance sheet exposures
OTC derivatives 6,654,664 5 714 -
Off-balance sheet exposures other than OTC
derivatives or credit derivatives 12,174,440 55,837 190,707 312,307
Defaulted exposures 24,880 - 1,519 504
Total off-balance sheet exposures 18,853,984 55,842 192,940 312,811
Total on and off-balance sheet exposures 66,691,740 422,173 976,897 14,430,806
before CRM derivatives
RM'000RM'000
The following tables disclose the total exposure before the effect of Credit Risk Mitigation ("CRM") and the
exposures covered by guarantees/credit derivatives, eligible financial collateral and other eligible collateral shown
by exposure class.
Exposures Exposures
covered by
eligible Otherguarantees
Exposures
covered by
collateral collateral
RM'000 RM'000
covered by
eligiblefinancialor credit Exposures
Page 35
Page 38
Standard Chartered Bank Malaysia Berhad
and its subsidiaries
Pillar 3 Disclosures
5. Credit risk (continued)
5.2 Credit risk mitigation (continued)
Group
31 December 2013
On-balance sheet exposures
Sovereigns/Central banks 9,969,697 - - -
Banks, development financial institutions & MDBs 4,755,962 3,361 - -
Insurance companies, securities firms & fund
managers 430,026 214,828 2,592 -
Corporates 10,870,085 111,241 707,106 1,415,554
Regulatory retail 8,363,321 8,218 175,066 60,940
Residential mortgages 12,813,456 - - 12,046,443
Higher risk assets 33,468 - - -
Other assets 754,967 4,316 1,221 -
Specialised financing/investment 265,831 69,485 20 -
Defaulted exposures 1,457,355 - 7,125 380,896
Total on-balance sheet exposures 49,714,168 411,449 893,130 13,903,833
Off-balance sheet exposures
OTC derivatives 5,985,508 9 388 -
Off-balance sheet exposures other than OTC
derivatives or credit derivatives 14,013,792 7,707 691,099 790,872
Defaulted exposures 27,411 - 846 1,569
Total off-balance sheet exposures 20,026,711 7,716 692,333 792,441
Total on and off-balance sheet exposures 69,740,879 419,165 1,585,463 14,696,274
Exposures or credit
Exposures Exposures
Other
Exposures
RM'000
eligible
collateral
covered by covered by covered by
guarantees
RM'000 RM'000 RM'000
before CRM derivatives collateral
eligible
financial
Page 36
Page 39
Standard Chartered Bank Malaysia Berhad
and its subsidiaries
Pillar 3 Disclosures
5. Credit risk (continued)
5.2 Credit risk mitigation (continued)
Bank
31 December 2014
On-balance sheet exposures
Sovereigns/Central banks 6,187,005 - - -
Banks, development financial institutions & MDBs 9,436,704 8,987 - -
Insurance companies, securities firms & fund
managers 1,076,829 222,378 3,570 -
Corporates 9,246,674 80,762 566,365 1,261,213
Regulatory retail 5,806,129 2,300 94,779 13,726
Residential mortgages 10,576,304 - - 10,120,545
Higher risk assets - - - -
Other assets 558,141 - 2,663 -
Specialised financing/investment 367,466 49,407 2,134 -
Defaulted exposures 1,427,406 - 40,226 389,467
Total on-balance sheet exposures 44,682,658 363,834 709,737 11,784,951
Off-balance sheet exposures
OTC derivatives 6,650,316 5 714 -
Off-balance sheet exposures other than OTC
derivatives or credit derivatives 11,490,033 52,869 142,571 215,472
Defaulted exposures 24,880 - 1,519 504
Total off-balance sheet exposures 18,165,229 52,874 144,804 215,976
Total on and off-balance sheet exposures 62,847,887 416,708 854,541 12,000,927
Exposures Exposures
RM'000 RM'000 RM'000 RM'000
or credit
Exposures
guarantees
covered by
collateral
Exposures
before CRM derivatives collateral
eligiblefinancial
eligible other
covered by covered by
Page 37
Page 40
Standard Chartered Bank Malaysia Berhad
and its subsidiaries
Pillar 3 Disclosures
5. Credit risk (continued)
5.2 Credit risk mitigation (continued)
Bank
31 December 2013
On-balance sheet exposures
Sovereigns/Central banks 7,727,525 - - -
Banks, development financial institutions & MDBs 7,404,706 3,361 - -
Insurance companies, securities firms & fund
managers 430,034 214,828 2,592 -
Corporates 9,922,655 93,293 542,975 1,184,772
Regulatory retail 6,982,757 8,218 175,027 55,271
Residential mortgages 11,205,738 - - 10,686,364
Higher risk assets 95 - - -
Other assets 567,990 4,316 1,221 -
Specialised financing/investment 154,903 69,485 20 -
Defaulted exposures 1,350,619 - 7,125 379,214
Total on-balance sheet exposures 45,747,022 393,501 728,960 12,305,621
Off-balance sheet exposures
OTC derivatives 5,986,615 9 388 -
Off-balance sheet exposures other than OTC
derivatives or credit derivatives 12,283,205 7,632 685,845 360,671
Defaulted exposures 27,411 - 846 1,569
Total off-balance sheet exposures 18,297,231 7,641 687,079 362,240
Total on and off-balance sheet exposures 64,044,253 401,142 1,416,039 12,667,861
covered by covered by covered by
Exposures Exposures Exposures
Exposures or credit financial eligible
guarantees eligible other
RM'000 RM'000 RM'000 RM'000
before CRM derivatives collateral collateral
Page 38
Page 41
Standard Chartered Bank Malaysia Berhad
and its subsidiaries
Pillar 3 Disclosures
5. Credit risk (continued)
5.3 Exposures under IRB approach
Exposures under the IRB approach by risk grade or PD band for non-retail exposures
The below tables analyse the Group's and the Bank's PD range or internal risk grading of non-retail exposures.
Group
31 December 2014
Non-retail exposures (EAD)
On balance sheet exposures
Sovereign 7,642,135 - - - - - -
Bank 2,441,080 2,581,753 251,603 361,776 18,886 286 -
Corporate 19,722 2,817,112 2,832,030 5,316,593 802,041 50,802 812,315
Total on-balance sheet exposures 10,102,937 5,398,865 3,083,633 5,678,369 820,927 51,088 812,315
Undrawn commitments
Sovereign - - - - - - -
Bank 194,500 117,782 2,134 - - - -
Corporate 185,933 289,021 511,726 350,705 125,814 3,223 1,957
Total undrawn commitments 380,433 406,803 513,860 350,705 125,814 3,223 1,957
Derivatives
Sovereign 28 - - - - - -
Bank 2,374,898 2,609,660 295,278 89,336 - - -
Corporate 206,079 382,900 239,872 356,253 96,524 - -
Total derivatives 2,581,005 2,992,560 535,150 445,589 96,524 - -
Contingent
Sovereign - - - - - - -
Bank 608,794 381,278 95,544 41,600 12,141 - -
Corporate 156,125 1,275,998 2,108,681 1,601,523 85,129 6,775 13,730
Total contingent 764,919 1,657,276 2,204,225 1,643,123 97,270 6,775 13,730
Exposure weighted average LGD (%)
Sovereign 26.20% - - - - - -
Bank 26.17% 26.30% 30.00% 41.15% 41.20% 41.20% -
Corporate 40.05% 37.90% 37.85% 44.44% 57.58% 45.75% 42.91%
Exposure weighted average risk weight (%)
Sovereign 6.24% - - - - - -
Bank 6.98% 12.52% 32.54% 79.20% 135.19% 183.41% -
Corporate 12.32% 15.07% 39.57% 89.52% 201.38% 225.87% 318.26%
RM'000 RM'000
0<0.04%
RM'000 RM'000
Default or 100% 12.00<100%
RM'000RM'000 RM'000
3.05<12.00% 0.17<0.59% 0.59<3.05% 0.04<0.17%
Page 39
Page 42
Standard Chartered Bank Malaysia Berhad
and its subsidiaries
Pillar 3 Disclosures
5. Credit risk (continued)
5.3 Exposures under IRB approach (continued)
Exposures under the IRB approach by risk grade or PD band for non-retail exposures (continued)
Group
31 December 2013
Non-retail exposures (EAD)
On balance sheet exposures
Sovereign 9,969,697 - - - - - -
Bank 1,748,037 2,529,801 286,079 135,721 56,015 309 -
Corporate 35,115 1,944,718 2,768,201 5,674,986 578,385 405,892 750,935
Total on-balance sheet exposures 11,752,849 4,474,519 3,054,280 5,810,707 634,400 406,201 750,935
Undrawn commitments
Sovereign 5,000 - - - - - -
Bank 65,668 150,833 6,621 400 - - -
Corporate 46,160 60,853 206,578 481,926 8,573 13,399 708
Total undrawn commitments 116,828 211,686 213,199 482,326 8,573 13,399 708
Derivatives
Sovereign 8,525 - - - - - -
Bank 2,128,046 2,585,497 256,038 11,101 - - -
Corporate 46,634 373,442 370,422 199,384 2,212 656 13
Total derivatives 2,183,205 2,958,939 626,460 210,485 2,212 656 13
Contingent
Sovereign 20 - - - - - -
Bank 672,608 358,949 90,240 51,249 104,436 - -
Corporate 52,087 1,009,976 3,052,143 1,348,842 108,338 4,439 17,198
Total contingent 724,715 1,368,925 3,142,383 1,400,091 212,774 4,439 17,198
Exposure weighted average LGD (%)
Sovereign 26.21% - - - - - -
Bank 26.23% 26.08% 29.65% 40.33% 41.20% 41.20% -
Corporate 32.37% 41.72% 33.86% 45.24% 49.34% 64.66% 41.21%
Exposure weighted average risk weight (%)
Sovereign 5.70% - - - - - -
Bank 7.93% 12.97% 35.02% 80.62% 111.51% 182.73% -
Corporate 6.59% 18.09% 35.97% 92.53% 154.16% 242.93% 381.96%
0.17<0.59% 0.59<3.05% 3.05<12.00%
RM'000 RM'000
Default or 100% 0.04<0.17% 0<0.04% 12.00<100%
RM'000 RM'000RM'000 RM'000 RM'000
Page 40
Page 43
Standard Chartered Bank Malaysia Berhad
and its subsidiaries
Pillar 3 Disclosures
5. Credit risk (continued)
5.3 Exposures under IRB approach (continued)
Exposures under the IRB approach by risk grade or PD band for non-retail exposures (continued)
Bank
31 December 2014
Non-retail exposures (EAD)
On balance sheet exposures
Sovereign 6,187,005 - - - - - -
Bank 2,441,080 6,363,073 251,603 361,776 18,886 286 -
Corporate 19,722 2,825,295 2,439,825 4,547,637 678,874 46,439 810,990
Total on-balance sheet exposures 8,647,807 9,188,368 2,691,428 4,909,413 697,760 46,725 810,990
Undrawn commitments
Sovereign - - - - - - -
Bank 194,500 118,817 2,134 - - - -
Corporate 45,254 260,666 333,044 350,407 125,814 3,223 1,957
Total undrawn commitments 239,754 379,483 335,178 350,407 125,814 3,223 1,957
Derivatives
Sovereign 28 - - - - - -
Bank 2,356,476 2,738,069 295,278 1,605 - - -
Corporate 206,079 361,808 239,721 350,892 96,524 - -
Total derivatives 2,562,583 3,099,877 534,999 352,497 96,524 - -
Contingent
Sovereign - - - - - - -
Bank 608,794 955,440 95,544 41,600 12,141 - -
Corporate 156,125 1,267,497 2,093,638 1,372,372 65,037 6,775 13,730
Total contingent 764,919 2,222,937 2,189,182 1,413,972 77,178 6,775 13,730
Exposure weighted average LGD (%)
Sovereign 26.20% - - - - - -
Bank 26.17% 26.25% 30.00% 41.14% 41.20% 41.20% -
Corporate 40.05% 38.16% 37.15% 45.45% 59.04% 45.53% 42.85%
Exposure weighted average risk weight (%)
Sovereign 6.60% - - - - - -
Bank 6.97% 13.29% 32.54% 74.64% 135.19% 183.41% -
Corporate 12.32% 15.14% 38.08% 88.96% 207.59% 224.69% 317.10%
RM'000RM'000 RM'000
0<0.04% Default or 100% 12.00<100% 0.59<3.05% 3.05<12.00% 0.04<0.17% 0.17<0.59%
RM'000 RM'000 RM'000 RM'000
Page 41
Page 44
Standard Chartered Bank Malaysia Berhad
and its subsidiaries
Pillar 3 Disclosures
5. Credit risk (continued)
5.3 Exposures under IRB approach (continued)
Exposures under the IRB approach by risk grade or PD band for non-retail exposures (continued)
Bank
31 December 2013
Non-retail exposures (EAD)
On balance sheet exposures
Sovereign 7,727,525 - - - - - -
Bank 1,748,037 5,178,545 286,079 135,721 56,015 309 -
Corporate 17,590 1,991,792 2,476,711 4,971,847 522,162 388,398 750,935
Total on-balance sheet exposures 9,493,152 7,170,337 2,762,790 5,107,568 578,177 388,707 750,935
Undrawn commitments
Sovereign 5,000 - - - - - -
Bank 65,668 150,833 6,621 400 - - -
Corporate 46,085 48,853 197,727 346,555 8,437 13,399 708
Total undrawn commitments 116,753 199,686 204,348 346,955 8,437 13,399 708
Derivatives
Sovereign 8,525 - - - - - -
Bank 2,128,046 2,596,766 256,038 11,101 - - -
Corporate 46,634 368,140 370,258 195,102 1,798 656 13
Total derivatives 2,183,205 2,964,906 626,296 206,203 1,798 656 13
Contingent
Sovereign 20 - - - - - -
Bank 672,608 358,949 90,240 51,249 104,436 - -
Corporate 52,087 1,009,976 2,983,693 1,284,951 104,571 4,439 17,198
Total contingent 724,715 1,368,925 3,073,933 1,336,200 209,007 4,439 17,198
Exposure weighted average LGD (%)
Sovereign 26.21% - - - - - -
Bank 26.23% 26.12% 29.65% 40.33% 41.20% 41.20% -
Corporate 33.08% 41.86% 34.69% 46.86% 50.62% 67.13% 41.21%
Exposure weighted average risk weight (%)
Sovereign 5.99% - - - - - -
Bank 7.93% 13.26% 35.02% 80.62% 111.51% 182.73% -
Corporate 6.27% 18.08% 36.52% 93.88% 156.25% 252.09% 381.96%
RM'000
0.04<0.17% 0<0.04% 3.05<12.00% 12.00<100% 0.17<0.59% 0.59<3.05%
RM'000 RM'000 RM'000 RM'000
Default or 100%
RM'000RM'000
Page 42
Page 45
Standard Chartered Bank Malaysia Berhad
and its subsidiaries
Pillar 3 Disclosures
5. Credit risk (continued)
5.3 Exposures under IRB approach (continued)
Exposures under the IRB approach by risk grade or PD band for retail exposures
The below tables analyse the Group's and the Bank's PD range of retail exposures.
Group
31 December 2014
Retail exposures (EAD)
On balance sheet exposures
Residential mortgage 182,154 2,650,262 1,366,384 7,338,546 1,084,988 519,637 219,358
Qualifying revolving retail 35,827 199,358 64,629 648,053 565,817 278,056 141,171
Other retail 723,495 428,679 442,872 2,250,912 781,571 402,525 306,543
Total on-balance sheet exposures 941,476 3,278,299 1,873,885 10,237,511 2,432,376 1,200,218 667,072
Undrawn commitments
Residential mortgage 50 67,123 72,799 1,194,714 33,964 10,041 3,435
Qualifying revolving retail 329,303 479,955 101,980 680,152 299,397 89,497 -
Other retail 10,960 20,795 10,381 400,971 56,772 20,979 5,119
Total undrawn commitments 340,313 567,873 185,160 2,275,837 390,133 120,517 8,554
Exposure weighted average LGD (%)
Residential mortgage 12.33% 12.38% 12.65% 12.69% 12.60% 12.84% 14.66%
Qualifying revolving retail 67.07% 67.07% 67.07% 67.07% 67.07% 67.07% 60.28%
Other retail 14.65% 19.69% 24.90% 39.33% 64.32% 68.43% 70.42%
Exposure weighted average risk weight (%)
Residential mortgage 3.12% 5.91% 9.49% 18.28% 44.96% 69.75% 91.31%
Qualifying revolving retail 3.78% 7.26% 12.98% 32.62% 83.40% 170.63% 320.37%
Other retail 2.77% 9.71% 15.80% 44.92% 100.72% 144.34% 273.42%
RM'000 RM'000RM'000
0.43<3.05% Default or 100% 9.20<100%0.30<0.43%
RM'000 RM'000 RM'000
0<0.11% 0.11<0.30%
RM'000
3.05<9.20%
Page 43
Page 46
Standard Chartered Bank Malaysia Berhad
and its subsidiaries
Pillar 3 Disclosures
5. Credit risk (continued)
5.3 Exposures under IRB approach (continued)
Exposures under the IRB approach by risk grade or PD band for retail exposures (continued)
Group
31 December 2013
Retail exposures (EAD)
On balance sheet exposures
Residential mortgage 163,055 2,678,873 1,430,131 7,053,625 976,980 495,923 250,037
Qualifying revolving retail 37,228 175,960 50,024 697,053 616,577 310,854 120,226
Other retail 799,622 538,589 406,259 2,870,310 1,113,205 595,345 264,184
Total on-balance sheet exposures 999,905 3,393,422 1,886,414 10,620,988 2,706,762 1,402,122 634,447
Undrawn commitments
Residential mortgage 181 80,976 92,745 2,556,646 46,347 12,366 4,120
Qualifying revolving retail 349,587 468,974 118,536 838,088 353,349 92,567 -
Other retail 15,348 65,867 38,121 744,757 76,318 34,808 5,126
Total undrawn commitments 365,116 615,817 249,402 4,139,491 476,014 139,741 9,246
Exposure weighted average LGD (%)
Residential mortgage 12.38% 12.49% 12.70% 13.19% 12.63% 13.16% 14.90%
Qualifying revolving retail 67.07% 67.07% 67.07% 67.07% 67.07% 67.07% 60.36%
Other retail 16.40% 28.46% 27.08% 45.78% 70.10% 73.31% 71.97%
Exposure weighted average risk weight (%)
Residential mortgage 3.03% 5.66% 8.89% 19.24% 44.81% 71.25% 91.70%
Qualifying revolving retail 3.81% 7.21% 12.66% 31.74% 83.19% 172.56% 306.70%
Other retail 3.14% 14.04% 17.03% 54.88% 109.68% 155.74% 295.14%
RM'000
Default or 100%
RM'000 RM'000RM'000 RM'000
0.11<0.30% 0.30<0.43% 0.43<3.05% 3.05<9.20% 9.20<100% 0<0.11%
RM'000 RM'000
Page 44
Page 47
Standard Chartered Bank Malaysia Berhad
and its subsidiaries
Pillar 3 Disclosures
5. Credit risk (continued)
5.3 Exposures under IRB approach (continued)
Exposures under the IRB approach by risk grade or PD band for retail exposures (continued)
Bank
31 December 2014
Retail exposures (EAD)
On balance sheet exposures
Residential mortgage 178,324 2,476,971 1,166,382 5,618,588 720,574 400,703 217,610
Qualifying revolving retail 35,827 199,358 64,629 648,053 565,817 278,056 141,171
Other retail 678,345 387,019 339,951 1,600,967 595,390 268,958 193,833
Total on-balance sheet exposures 892,496 3,063,348 1,570,962 7,867,608 1,881,781 947,717 552,614
Undrawn commitments
Residential mortgage 50 67,123 72,481 702,929 23,806 8,979 3,435
Qualifying revolving retail 329,303 479,955 101,980 680,152 299,397 89,497 -
Other retail 10,849 20,354 10,381 288,424 56,519 20,979 5,119
Total undrawn commitments 340,202 567,432 184,842 1,671,505 379,722 119,455 8,554
Exposure weighted average LGD (%)
Residential mortgage 12.33% 12.40% 12.74% 12.85% 12.72% 12.86% 14.65%
Qualifying revolving retail 67.07% 67.07% 67.07% 67.07% 67.07% 67.07% 60.28%
Other retail 14.58% 20.27% 26.44% 37.23% 61.76% 62.99% 63.09%
Exposure weighted average risk weight (%)
Residential mortgage 2.99% 5.37% 8.39% 15.68% 42.60% 67.56% 91.27%
Qualifying revolving retail 3.78% 7.26% 12.98% 32.62% 83.40% 170.63% 320.37%
Other retail 2.79% 9.94% 16.84% 41.28% 96.73% 133.06% 275.29%
RM'000RM'000
3.05<9.20% Default or 100% 9.20<100% 0.43<3.05% 0<0.11%
RM'000 RM'000RM'000
0.11<0.30%
RM'000
0.30<0.43%
RM'000
Page 45
Page 48
Standard Chartered Bank Malaysia Berhad
and its subsidiaries
Pillar 3 Disclosures
5. Credit risk (continued)
5.3 Exposures under IRB approach (continued)
Exposures under the IRB approach by risk grade or PD band for retail exposures (continued)
Bank
31 December 2013
Retail exposures (EAD)
On balance sheet exposures
Residential mortgage 161,683 2,573,085 1,298,918 5,958,745 776,230 422,208 248,126
Qualifying revolving retail 37,228 175,960 50,024 697,053 616,577 310,854 120,226
Other retail 766,891 515,536 363,331 2,120,048 806,315 371,813 159,384
Total on-balance sheet exposures 965,802 3,264,581 1,712,273 8,775,846 2,199,122 1,104,875 527,736
Undrawn commitments
Residential mortgage 181 80,976 92,023 1,410,399 22,974 10,014 4,120
Qualifying revolving retail 349,587 468,974 118,536 838,088 353,349 92,567 -
Other retail 14,896 65,549 37,890 500,520 74,366 34,782 5,126
Total undrawn commitments 364,664 615,499 248,449 2,749,007 450,689 137,363 9,246
Exposure weighted average LGD (%)
Residential mortgage 12.38% 12.50% 12.76% 13.44% 12.71% 13.19% 14.89%
Qualifying revolving retail 67.07% 67.07% 67.07% 67.07% 67.07% 67.07% 60.36%
Other retail 16.37% 28.77% 27.81% 43.45% 63.31% 65.47% 64.30%
Exposure weighted average risk weight (%)
Residential mortgage 2.99% 5.38% 8.38% 16.91% 43.07% 69.83% 91.65%
Qualifying revolving retail 3.81% 7.21% 12.66% 31.74% 83.19% 172.56% 306.70%
Other retail 3.14% 14.17% 17.51% 50.58% 99.04% 139.10% 318.75%
RM'000RM'000
Default or 100% 3.05<9.20% 9.20<100%
RM'000
0<0.11% 0.11<0.30%
RM'000 RM'000RM'000
0.30<0.43% 0.43<3.05%
RM'000
Page 46
Page 49
Standard Chartered Bank Malaysia Berhad
and its subsidiaries
Pillar 3 Disclosures
5. Credit risk (continued)
5.3 Exposures under IRB approach (continued)
Exposures under the IRB approach by expected loss range for retail exposures
The below tables analyse the Group's and the Bank's expected loss range for retail exposures.
Group
31 December 2014
Retail exposures (EAD)
On balance sheet exposures
Residential mortgage 7,017,010 1,915,972 2,113,004 1,304,879 1,010,464 - -
Qualifying revolving retail 82,625 152,560 237,993 192,154 1,101,180 166,399 -
Other retail 1,553,337 1,143,071 368,067 379,189 1,545,321 347,612 -
Total on-balance sheet exposures 8,652,972 3,211,603 2,719,064 1,876,222 3,656,965 514,011 -
Undrawn commitments
Residential mortgage 229,073 187,902 454,487 479,012 31,652 - -
Qualifying revolving retail 468,845 340,413 269,303 299,799 591,739 10,185 -
Other retail 32,170 53,530 320,083 15,800 99,176 4,766 452
Total undrawn commitments 730,088 581,845 1,043,873 794,611 722,567 14,951 452
Exposure weighted average risk weight (%)
Residential mortgage 8.43% 17.60% 23.70% 34.92% 69.73% - -
Qualifying revolving retail 4.29% 8.00% 16.55% 26.49% 90.25% 290.94% -
Other retail 10.97% 16.68% 34.82% 58.41% 116.31% 248.92% -
31 December 2013
Retail exposures (EAD)
On balance sheet exposures
Residential mortgage 7,278,352 1,974,979 1,886,185 1,070,211 838,897 - -
Qualifying revolving retail 79,926 133,261 227,857 218,250 1,199,258 149,370 -
Other retail 1,712,723 845,934 773,631 473,084 2,443,845 338,298 -
Total on-balance sheet exposures 9,071,001 2,954,174 2,887,673 1,761,545 4,482,000 487,668 -
Undrawn commitments
Residential mortgage 310,836 324,373 1,010,970 1,110,099 37,103 - -
Qualifying revolving retail 502,807 315,754 393,652 319,082 685,778 4,028 -
Other retail 114,669 57,411 635,670 28,848 138,679 5,068 -
Total undrawn commitments 928,312 697,538 2,040,292 1,458,029 861,560 9,096 -
Exposure weighted average risk weight (%)
Residential mortgage 8.46% 17.78% 24.97% 35.32% 74.81% - -
Qualifying revolving retail 4.32% 8.04% 16.45% 26.63% 90.55% 279.01% -
Other retail 11.83% 17.61% 37.58% 63.01% 122.78% 250.21% -
RM'000
>30 to <100%
RM'000 RM'000RM'000 RM'000
>0.20 to 0.50% >0.50 to 1.00% >1.00 to 30.00% 100%
RM'000 RM'000
Up to 0.10% >0.10 to 0.20%
Page 47
Page 50
Standard Chartered Bank Malaysia Berhad
and its subsidiaries
Pillar 3 Disclosures
5. Credit risk (continued)
5.3 Exposures under IRB approach (continued)
Exposures under the IRB approach by expected loss range for retail exposures (continued)
Bank
31 December 2014
Retail exposures (EAD)
On balance sheet exposures
Residential mortgage 6,913,002 1,846,396 888,776 372,979 757,999 - -
Qualifying revolving retail 82,625 152,560 237,993 192,154 1,101,180 166,399 -
Other retail 1,363,753 868,436 275,947 297,047 1,057,840 201,441 -
Total on-balance sheet exposures 8,359,380 2,867,392 1,402,716 862,180 2,917,019 367,840 -
Undrawn commitments
Residential mortgage 228,904 187,897 426,249 9,613 26,140 - -
Qualifying revolving retail 468,845 340,413 269,303 299,799 591,739 10,185 -
Other retail 31,372 49,857 211,814 15,433 98,931 4,766 452
Total undrawn commitments 729,121 578,167 907,366 324,845 716,810 14,951 452
Exposure weighted average risk weight (%)
Residential mortgage 8.41% 17.57% 26.97% 43.52% 70.59% - -
Qualifying revolving retail 4.29% 8.00% 16.55% 26.49% 90.25% 290.94% -
Other retail 11.26% 16.82% 37.52% 58.62% 110.95% 242.74% -
31 December 2013
Retail exposures (EAD)
On balance sheet exposures
Residential mortgage 7,149,262 1,903,461 1,168,132 533,730 684,410 - -
Qualifying revolving retail 79,926 133,261 227,857 218,250 1,199,258 149,370 -
Other retail 1,609,743 761,481 506,309 429,564 1,619,619 176,603 -
Total on-balance sheet exposures 8,838,931 2,798,203 1,902,298 1,181,544 3,503,287 325,973 -
Undrawn commitments
Residential mortgage 310,659 324,368 947,886 13,416 24,358 - -
Qualifying revolving retail 502,807 315,754 393,652 319,082 685,778 4,028 -
Other retail 113,632 54,863 395,634 26,802 137,150 5,048 -
Total undrawn commitments 927,098 694,985 1,737,172 359,300 847,286 9,076 -
Exposure weighted average risk weight (%)
Residential mortgage 8.44% 17.77% 26.82% 46.44% 76.31% - -
Qualifying revolving retail 4.32% 8.04% 16.45% 26.63% 90.55% 279.01% -
Other retail 12.06% 17.71% 39.77% 61.63% 114.30% 255.74% -
100%
RM'000 RM'000 RM'000 RM'000
>0.20 to 0.50% >0.50 to 1.00%Up to 0.10% >0.10 to 0.20%
RM'000 RM'000 RM'000
>1.00 to 30.00% >30 to <100%
Page 48
Page 51
Standard Chartered Bank Malaysia Berhad
and its subsidiaries
Pillar 3 Disclosures
5. Credit risk (continued)
5.3 Exposures under IRB approach (continued)
Group
31 December 2014 RM'000 RM'000 RM'000 RM'000 RM'000
Income producing real estate
- 41,548 88,439 - -
- 37,393 101,705 - -
31 December 2013
Income producing real estate
- 110,928 - - -
99,836 - - -
Bank
31 December 2014 RM'000 RM'000 RM'000 RM'000 RM'000
Income producing real estate
- 1,500 88,439 - -
- 1,350 101,705 - -
31 December 2013
Income producing real estate
- - - - -
- - - -
Satisfactory or
70% 90% 115%
Strong or Good or
The following tables set out exposures subject to the supervisory risk weights under the IRB approach for the
Group and the Bank.
Strong or
70%
Satisfactory or
115%
Weak or Default orGood or
90%
Default or
0%
0%250%
Weak or
250%
- Total Exposures
- Risk Weighted Assets
- Total Exposures
- Risk Weighted Assets
- Risk Weighted Assets
- Total Exposures
- Risk Weighted Assets
- Total Exposures
Page 49
Page 52
Standard Chartered Bank Malaysia Berhad
and its subsidiaries
Pillar 3 Disclosures
5. Credit risk (continued)
5.4 Exposures under the Standardised approach
Group
31 Dec 2014
Risk weights
0% - - - - 118,262 118,262 -
20% - - - - - - -
35% - - 14,767 - - 14,767 5,168
50% - 24 36 - - 60 30
75% - 61,082 206 - - 61,288 45,966
100% 239,804 8,099 691 - 741,600 990,194 990,194
150% 626 20,794 44 50,255 - 71,719 107,583
1250% - - - - 1,658 1,658 20,725
Total exposures 240,430 89,999 15,744 50,255 861,520 1,257,948 1,169,666
Risk-weighted
exposures 240,743 85,114 6,098 75,383 762,328 1,169,666
Average risk
weight 100.1% 94.6% 38.7% 150.0% 88.5% 93.0%
Deduction from
Risk weights under the Standardised approach
weighted
Total exposuresExposures after netting and credit risk mitigation
Regulatory Other
The following tables set out analysis of risk weights under the Standardised approach for the Group and the Bank.
Residential
Higher after netting Total risk
and credit riskrisk
retail
RM'000 RM'000 RM'000
assetsCorporates*
RM'000
mortgages
RM'000 RM'000
assets mitigation
RM'000
assets
Deduction from
capital base - - - - - -
31 Dec 2013
Risk weights
0% - - - - 120,562 120,562 -
20% - - - - - - -
35% - - 14,501 - - 14,501 5,075
50% - 9 107 - - 116 58
75% - 77,778 168 - - 77,946 58,459
100% 236,473 8,413 853 - 635,005 880,744 880,744
150% 26,635 15,779 44 59,393 - 101,851 152,785
1250% - - - - 1,658 1,658 20,725
Total exposures 263,108 101,979 15,673 59,393 757,225 1,197,378 1,117,846
Risk-weighted
assets by
exposures 276,426 90,420 6,174 89,090 655,736 1,117,846
Average risk
weight 105.1% 88.7% 39.4% 150.0% 86.6% 93.4%
Deduction from
capital base - - - - - -
RM'000
retail
RM'000 RM'000 RM'000RM'000
assetsmortgages
RM'000
Corporates*
and credit risk
Total exposuresExposures after netting and credit risk mitigation
assets
Regulatory
assets
RM'000
mitigation
Residential risk
Total risk
Other weighted
Higher after netting
Page 50
Page 53
Standard Chartered Bank Malaysia Berhad
and its subsidiaries
Pillar 3 Disclosures
5. Credit risk (continued)
5.4 Exposures under the Standardised approach (continued)
Bank
31 Dec 2014
Risk weights
0% - - - - 105,604 105,604 -
20% - - - - - - -
35% - - 14,767 - - 14,767 5,168
50% - 24 36 - - 60 30
75% - 60,486 206 - - 60,692 45,519
100% 199,036 7,907 691 - 455,054 662,688 662,688
150% 626 20,770 44 25,549 - 46,989 70,488
1250% - - - - 1,658 1,658 20,725
Total exposures 199,662 89,187 15,744 25,549 562,316 892,458 804,618
Risk-weighted
assets by
exposures 199,975 84,439 6,098 38,324 475,782 804,618
Average risk
weight 100.2% 94.7% 38.7% 150.0% 84.6% 90.2%
Deduction from
capital base - - - - - -
Total risk
ResidentialRegulatory
Higher after netting
Risk weights under the Standardised approach (continued)
Corporates* retail
RM'000
Total exposuresExposures after netting and credit risk mitigation
Other
assetsassets mitigation
RM'000RM'000
mortgages
weightedand credit riskrisk
assets
RM'000 RM'000 RM'000 RM'000
capital base - - - - - -
31 Dec 2013
Risk weights
0% - - - - 106,554 106,554 -
20% - - - - - - -
35% - - 14,501 - - 14,501 5,075
50% - 9 107 - - 116 58
75% - 76,831 168 - - 76,999 57,749
100% 199,973 8,192 853 - 462,036 671,054 671,054
150% 26,635 15,754 44 26,020 - 68,453 102,687
1250% - - - - 1,658 1,658 20,725
Total exposures 226,608 100,786 15,673 26,020 570,248 939,335 857,348
Risk-weighted
assets by
exposures 239,926 89,451 6,174 39,030 482,767 857,348
Average risk
weight 105.9% 88.8% 39.4% 150.0% 84.7% 91.3%
Deduction from
capital base - - - - - -
* All corporate standardised exposures are unrated.
RM'000RM'000 RM'000 RM'000 RM'000
Total risk
Residential risk Other and credit risk
Higher after netting
RM'000 RM'000
weighted
Corporates* retail mortgages assets assets mitigation assets
Regulatory
Exposures after netting and credit risk mitigation Total exposures
Page 51
Page 54
Standard Chartered Bank Malaysia Berhad
and its subsidiaries
Pillar 3 Disclosures
5. Credit risk (continued)
5.5 Problem credit management and provisioning
Group provisions held as at
31 December 2014
Mortgages 51,248 55,243 32,783 (40,326) 47,700
Others 244,412 67,975 185,360 (152,450) 100,885
Retail Clients 295,660 123,218 218,143 (192,776) 148,585
Agriculture 394 14,808 1,035 1,392 17,235
Mining and quarrying 494 - - - -
Manufacturing 27,033 33,835 103,256 (9,065) 128,026
Electricity, gas and water 447 - - - -
Construction 5,241 61,323 - (1,769) 59,554
Real estate 2,914 - - - -
Wholesale & retail trade and restaurants & hotels 6,252 29,951 24,544 (1,264) 53,231
Transportation, storage and communication 515 - - - -
Finance, insurance and business services 14,400 - - - -
Household - - - - -
Others 1,179 - 4,300 (4,300) -
Corporates, Institutional and Commercial Clients 58,869 139,917 133,135 (15,006) 258,046
The following tables show the Group's and the Bank's collective impairment provisions and movement in individual impairment provisions by each principal category of
borrowers' business or industry..
Impairment provisions analysed by borrowers' business or industry
RM'000
impairment
31 December 2014 1 January 2014
provisions as at
Collective
RM'000 RM'000RM'000
during the
impairment
financial period
or other movementsimpairment impairment charge
IndividualAmounts written offIndividual Net individual
during the
financial period
provisions held as at
31 December 2014
RM'000
Page 52
Page 55
Standard Chartered Bank Malaysia Berhad
and its subsidiaries
Pillar 3 Disclosures
5.5 Problem credit management and provisioning (continued)
Group provisions held as at
31 December 2013
Mortgages 35,402 67,552 42,457 (54,766) 55,243
Others 230,491 31,540 212,414 (175,979) 67,975
Retail Clients 265,893 99,092 254,871 (230,745) 123,218
Agriculture 7,218 13,872 936 - 14,808
Mining and quarrying 283 - - - -
Manufacturing 29,884 20,332 25,461 (11,958) 33,835
Electricity, gas and water 451 - - - -
Construction 10,753 60,639 1,876 (1,192) 61,323
Real estate 2,797 - - - -
Wholesale & retail trade and restaurants & hotels 11,143 24,635 19,117 (13,801) 29,951
Transportation, storage and communication 1,896 - - - -
Finance, insurance and business services 16,062 - - - -
Household - - - - -
Others 1,551 14 - (14) -
Corporates, Institutional and Commercial Clients 82,038 119,492 47,390 (26,965) 139,917
impairment impairment
RM'000
impairment charge
31 December 2013
provisions as at
or other movements
Collective
financial period
provisions held as at
31 December 2013
impairment
during the during the
Net individualIndividual
1 January 2013 financial period
Amounts written off Individual
Impairment provisions analysed by borrowers' business or industry (continued)
RM'000 RM'000 RM'000 RM'000
Page 53
Page 56
Standard Chartered Bank Malaysia Berhad
and its subsidiaries
Pillar 3 Disclosures
5. Credit risk (continued)
5.5 Problem credit management and provisioning (continued)
Bank provisions held as at
31 December 2014
Mortgages 42,064 54,874 31,021 (38,716) 47,179
Others 139,495 53,281 108,036 (82,981) 78,336
Retail Clients 181,559 108,155 139,057 (121,697) 125,515
Agriculture 26 14,808 1,035 1,392 17,235
Mining and quarrying 494 - - - -
Manufacturing 25,060 33,115 103,256 (9,065) 127,306
Electricity, gas and water 447 - - - -
Construction 5,161 61,323 - (1,769) 59,554
Real estate 2,686 - - - -
Wholesale & retail trade and restaurants & hotels 5,085 29,951 24,544 (1,264) 53,231
Transportation, storage and communication 458 - - - -
Finance, insurance and business services 13,567 - - - -
Household - - - - -
Others 949 - 4,300 (4,300) -
Corporates, Institutional and Commercial Clients 53,933 139,197 133,135 (15,006) 257,326
Collective Individual Net individual
1 January 2014
impairment or other movements
during the
financial period
impairment charge
provisions as at provisions held as at
31 December 2014
impairment
RM'000
Individual
impairment
financial period
Amounts written off
Impairment provisions analysed by borrowers' business or industry (continued)
RM'000 RM'000 RM'000
31 December 2014
RM'000
during the
Page 54
Page 57
Standard Chartered Bank Malaysia Berhad
and its subsidiaries
Pillar 3 Disclosures
5. Credit risk (continued)
5.5 Problem credit management and provisioning (continued)
Bank provisions held as at
31 December 2013
Mortgages 32,055 67,159 41,722 (54,007) 54,874
Others 133,597 28,926 111,119 (86,764) 53,281
Retail Clients 165,652 96,085 152,841 (140,771) 108,155
Agriculture 6,879 13,872 936 - 14,808
Mining and quarrying 159 - - - -
Manufacturing 28,478 19,965 25,108 (11,958) 33,115
Electricity, gas and water 451 - - - -
Construction 10,665 60,639 1,876 (1,192) 61,323
Real estate 2,436 - - - -
Wholesale & retail trade and restaurants & hotels 10,722 24,635 19,117 (13,801) 29,951
Transportation, storage and communication 1,475 - - - -
Finance, insurance and business services 15,580 - - - -
Household - - - - -
Others 1,498 14 - (14) -
Corporates, Institutional and Commercial Clients 78,343 119,125 47,037 (26,965) 139,197
Impairment provisions analysed by borrowers' business or industry (continued)
31 December 2013 1 January 2013 financial year financial year
impairment
provisions as at provisions held as at during the
Collective
during the
31 December 2013
RM'000 RM'000 RM'000 RM'000 RM'000
Individual Net individual Amounts written off Individual
or other movementsimpairment impairment impairment charge
Page 55
Page 58
Standard Chartered Bank Malaysia Berhad
and its subsidiaries
Pillar 3 Disclosures
5. Credit risk (continued)
5.5 Problem credit management and provisioning (continued)
31 December 31 December 31 December 31 December
2014 2013 2014 2013
Mortgages 1,370,574 1,353,489 1,086,614 1,159,701
Others 530,150 653,388 348,526 410,581
Retail Clients 1,900,724 2,006,877 1,435,140 1,570,282
Agriculture - 11,163 - 11,163
Mining and quarrying - - - -
Manufacturing 27,836 41,210 27,822 41,210
Electricity, gas and water - - - -
Construction 3,500 - 3,500 -
Real estate - - - -
Wholesale & retail trade and restaurants & hotels 21,540 13,152 21,540 12,961
Transportation, storage and communication 1,221 440 106 -
Finance, insurance and business services - 81,488 - 65,985
Education, Health & Others - - - -
Household - - - -
Others - - - -
Corporates, Institutional and Commercial Clients 54,097 147,453 52,968 131,319
2014 2013 2014 2013
Loans, advances and financing past due
The following table analyses the Group's and the Bank's loans, advances and financing past due but not impaired, analysed by borrowers'
business or industry.
Bank
RM'000
Group Bank
Group
The following table analyses the Group's and the Bank's loans, advances and financing past due but not impaired, analysed by significant
geographical areas.
RM'000RM'000RM'000
2014 2013 2014 2013
Malaysia 1,954,821 2,154,330 1,488,108 1,701,601
Others - - - -
1,954,821 2,154,330 1,488,108 1,701,601
RM'000 RM'000 RM'000 RM'000
Page 56
Page 59
Standard Chartered Bank Malaysia Berhad
and its subsidiaries
Pillar 3 Disclosures
5. Credit risk (continued)
5.5 Problem credit management and provisioning (continued)
Group
31 December 2014
Gross impaired loans, advances and financing 1,123,925 507 1,124,432
Individual impairment provisions 406,124 507 406,631
Collective impairment provisions 350,399 4,130 354,529
31 December 2013
Gross impaired loans, advances and financing 1,088,614 263 1,088,877
Individual impairment provisions 262,872 263 263,135
Collective impairment provisions 345,178 2,753 347,931
Bank
31 December 2014
Gross impaired loans, advances and financing 1,085,804 507 1,086,311
Individual impairment provisions 382,334 507 382,841
Collective impairment provisions 231,362 4,130 235,492
31 December 2013
Gross impaired loans, advances and financing 1,048,005 263 1,048,268
Individual impairment provisions 247,089 263 247,352
Collective impairment provisions 241,242 2,753 243,995
Outside
Malaysia
RM'000RM'000
Summary analysis of loans, advances and financing
The following tables show the Group's and the Bank's impaired loans, advances and financing, individual impairment provisions and
collective impairment provisions by significant geographical areas.
Within
Malaysia Total
RM'000
Page 57
Page 60
Standard Chartered Bank Malaysia Berhad
and its subsidiaries
Pillar 3 Disclosures
5. Credit risk (continued)
5.6 Off-balance sheet and counterparty credit risk
Risk
weighted
Group assets
31 December 2014 RM'000
Direct credit substitutes 2,281,091 - - 2,281,091 930,621
Transaction related contingent items 4,005,690 - - 4,003,743 900,744
Short term self liquidating trade
related contingencies 240,583 - - 240,583 82,806
Sell and buy back agreements 574,200 - - 574,200 79,566
Foreign exchange related contracts
One year or less 37,129,354 867,817 862,595 1,509,394 333,085
Over one year to five years 19,665,694 963,249 813,106 2,305,369 706,890
Over five years 2,511,834 257,500 151,021 531,725 153,919
Interest/profit rate related contracts
One year or less 18,030,555 18,246 13,402 41,402 5,295
Over one year to five years 45,520,539 322,101 467,441 1,345,882 265,803
Over five years 6,494,791 112,550 95,104 621,456 153,226
Equity related contracts
One year or less 87,650 419 419 3,102 162
Over one year to five years 224,954 10,281 1,718 20,299 2,043
Over five years - - - - -
Commodity contracts
One year or less 3,588,606 143,000 143,000 187,935 51,092
Over one year to five years 1,160,408 167,235 167,235 74,958 18,887
Credit derivative contracts *
One year or less 53,584 - - 2,679 125
Over one year to five years 104,850 5,221 - 10,463 778
facilities and credit lines, with an original
maturity of over one year 3,357,107 - - 1,505,513 618,257
RM'000 RM'000
equivalentPrincipal
Positive Credit
The following tables analyse the Group's and the Bank's off-balance sheet and counterparty credit risk.
amount
fair value
of contracts of contracts
RM'000
amount
fair value
Negative
Other commitments, such as formal
Other commitments, such as formal
RM'000
facilities and credit lines, with an original
maturity of up to one year 1,102,535 - - 352,658 185,637
Any commitments that are unconditionally
cancellable at any time by the bank without
prior notice or that effectively provide for
automatic cancellation due to deterioration
in a borrower's creditworthiness 30,453,226 - - 3,241,532 1,446,142
176,587,251 2,867,619 2,715,041 18,853,984 5,935,078
The table below shows the credit derivative contracts for client intermediation activities:
Risk
Principal equivalent weighted
amount amount assets
* Credit derivative contracts RM'000 RM'000 RM'000
Credit link notes
- protection sold 104,850 10,463 778
Credit
Other commitments, such as formal
Page 58
Page 61
Standard Chartered Bank Malaysia Berhad
and its subsidiaries
Pillar 3 Disclosures
5. Credit risk (continued)
5.6 Off-balance sheet and counterparty credit risk (continued)
Risk
weighted
Group assets
Restated
31 December 2013 RM'000
Direct credit substitutes 2,390,276 - - 2,390,276 824,234
Transaction related contingent items 4,254,108 - - 4,253,025 952,615
Short term self liquidating trade
related contingencies 390,974 - - 390,974 105,794
Sell and buy back agreements - - - - -
Foreign exchange related contracts
One year or less 32,294,898 502,513 404,478 975,552 234,754
Over one year to five years 19,066,983 844,827 561,990 2,187,200 535,207
Over five years 1,744,078 156,343 121,677 345,249 129,674
Interest/profit rate related contracts
One year or less 19,220,803 11,644 12,868 40,177 4,996
Over one year to five years 48,719,725 364,498 527,681 1,581,268 333,331
Over five years 5,512,026 149,175 64,402 568,450 162,432
Equity related contracts
One year or less 69,406 765 765 2,245 93
Over one year to five years 286,641 16,676 14,463 26,494 4,616
Over five years 32,100 1,416 524 4,626 2,078
Commodity contracts
One year or less 1,814,838 20,392 20,392 118,973 29,297
Over one year to five years 1,647,953 24,797 24,797 126,744 41,898
Credit derivative contracts **
One year or less - - - - -
Over one year to five years 98,358 3,625 - 8,543 876
facilities and credit lines, with an original
maturity of over one year 7,498,951 - - 1,534,941 766,560
Other commitments, such as formal
RM'000 RM'000
amount of contracts
Positive Negative
Principal fair value fair value equivalent
of contracts
Other commitments, such as formal
Credit
RM'000 RM'000
amount
*
facilities and credit lines, with an original
maturity of up to one year 4,806,854 - - 3,070,330 926,593
Any commitments that are unconditionally
cancellable at any time by the bank without
prior notice or that effectively provide for
automatic cancellation due to deterioration
in a borrower's creditworthiness 29,303,278 - - 2,401,644 914,316
179,152,250 2,096,671 1,754,037 20,026,711 5,969,364
The table below shows the credit derivative contracts for client intermediation activities:
Risk
Principal equivalent weighted
amount amount assets
** Credit derivative contracts RM'000 RM'000 RM'000
Credit link notes
- protection sold 98,358 8,543 876
*
Credit
Other commitments, such as formal
The comparative figures have been restated to conform with current year presentation which reflected the results of revision to the
Group's and Bank's Corporate Exposure At Default model during the year.
*
*
Page 59
Page 62
Standard Chartered Bank Malaysia Berhad
and its subsidiaries
Pillar 3 Disclosures
5. Credit risk (continued)
5.6 Off-balance sheet and counterparty credit risk (continued)
Bank
31 December 2014
Direct credit substitutes 2,253,094 - - 2,253,094 906,297
Transaction related contingent items 3,851,546 - - 3,849,599 842,562
Short term self liquidating trade
related contingencies 137,547 - - 137,547 54,985
Sell and buy back agreements 574,200 - - 574,200 79,566
Foreign exchange related contracts
One year or less 37,358,841 870,499 862,598 1,515,505 333,507
Over one year to five years 19,665,694 963,248 813,106 2,305,369 646,254
Over five years 2,511,834 257,500 151,021 531,725 153,919
Interest rate related contracts
One year or less 18,030,555 18,246 13,402 41,402 5,295
Over one year to five years 45,498,840 320,841 464,511 1,333,854 264,258
Over five years 6,494,791 112,550 95,104 621,456 153,219
Equity related contracts
One year or less 87,650 419 419 3,102 161
Over one year to five years 244,565 10,281 2,395 21,868 2,439
Over five years - - - - -
Commodity contracts
One year or less 3,588,606 143,001 143,001 187,935 51,092
Over one year to five years 1,174,122 167,235 167,235 74,958 19,015
Credit derivative contracts *
One year or less 53,584 - - 2,679 125
Over one year to five years 104,850 5,221 - 10,463 778
facilities and credit lines, with an original
maturity of over one year 2,283,245 - - 843,162 337,531
facilities and credit lines, with an original
maturity of up to one year 1,418,588 - - 765,615 193,581
equivalent
Other commitments, such as formal
Other commitments, such as formal
Positive
RM'000 RM'000
fair value Principal
assetsof contracts
weightedfair value
Credit
RM'000RM'000
amount of contracts amount
Negative
RM'000
Risk
maturity of up to one year 1,418,588 - - 765,615 193,581
Any commitments that are unconditionally
cancellable at any time by the bank without
prior notice or that effectively provide for
automatic cancellation due to deterioration
in a borrower's creditworthiness 30,756,553 - - 3,091,696 1,393,712
176,088,705 2,869,041 2,712,792 18,165,229 5,438,296
The table below shows the credit derivative contracts for client intermediation activities:
Credit Risk
Principal equivalent weighted
amount amount assets
* Credit derivative contracts RM'000 RM'000 RM'000
Credit default swap
- protection sold 104,850 10,463 778
Page 60
Page 63
Standard Chartered Bank Malaysia Berhad
and its subsidiaries
Pillar 3 Disclosures
5. Credit risk (continued)
5.6 Off-balance sheet and counterparty credit risk (continued)
Bank
31 December 2013
Direct credit substitutes 2,387,464 - - 2,387,464 823,662
Transaction related contingent items 4,181,018 - - 4,179,934 931,868
Short term self liquidating trade
related contingencies 324,817 - - 324,817 74,723
Sell and buy back agreements - - - - -
Foreign exchange related contracts
One year or less 32,294,898 498,125 408,863 972,659 233,968
Over one year to five years 19,066,983 844,827 561,990 2,187,200 535,207
Over five years 1,744,078 156,343 121,677 345,249 129,674
Interest rate related contracts
One year or less 19,327,561 16,024 12,868 44,671 5,396
Over one year to five years 48,719,725 362,813 527,681 1,579,583 329,955
Over five years 5,512,026 149,174 64,402 568,449 162,427
Equity related contracts
One year or less 69,404 765 765 2,244 93
Over one year to five years 285,961 17,268 13,367 27,032 2,756
Over five years 32,035 2,077 - 5,281 1,161
Commodity contracts
One year or less 1,814,840 20,392 20,392 118,973 29,297
Over one year to five years 1,647,953 24,797 24,800 126,744 41,899
Credit derivative contracts **
One year or less - - - - -
Over one year to five years 98,358 3,626 - 8,543 876
facilities and credit lines, with an original
maturity of over one year 5,831,689 - - 1,302,260 679,210
facilities and credit lines, with an original
maturity of up to one year 2,589,506 - - 1,714,484 483,013
equivalent weighted
Positive Negative Credit Risk
Principal fair value fair value
Other commitments, such as formal
Other commitments, such as formal
assets
RM'000 RM'000 RM'000 RM'000 RM'000
amount of contracts of contracts amount
*
*maturity of up to one year 2,589,506 - - 1,714,484 483,013
Any commitments that are unconditionally
cancellable at any time by the bank without
prior notice or that effectively provide for
automatic cancellation due to deterioration
in a borrower's creditworthiness 32,153,615 - - 2,401,644 914,317
178,081,931 2,096,231 1,756,805 18,297,231 5,379,502
The table below shows the credit derivative contracts for client intermediation activities:
Risk
Principal equivalent weighted
amount amount assets
** Credit derivative contracts RM'000 RM'000 RM'000
Credit link notes
- protection sold 98,358 8,543 876
* The comparative figures have been restated to conform with current year presentation which reflected the results of revision to the
Group's and Bank's Corporate Exposure At Default model during the year.
Credit
*
Page 61
Page 64
Standard Chartered Bank Malaysia Berhad
and its subsidiaries
Pillar 3 Disclosures
6. Market risk
The primary categories of market risk for the Group are:-
•
•
The Group has adopted the Standardised approach for market risk.
The Group recognises market risk as the risk of loss resulting from changes in market prices and rates. The
Bank is exposed to market risk arising principally from customer-driven transactions. The objective of the
Bank’s market risk policies and processes is to obtain the best balance of risk and return while meeting
customers’ requirements.
Interest rate risk: arising from changes in yield curves, credit spreads and implied volatilities on interest
rate options; and
Currency exchange rate risk: arising from changes in exchange rates and implied volatilities on foreign
exchange options.
Market risk governance
The Board is responsible for setting Value at Risk ("VaR") limits at a business level. The Board is also
responsible for policies and other standards for the control of market risk and overseeing their effective
implementation. These policies cover both trading and non-trading books of the Group. Limits by desk are
proposed by the businesses within the terms of agreed policy.
The Board approves the Group’s market risk appetite taking account of market volatility, the range of traded
products and asset classes, the business volumes and transaction sizes. Market risk appetite has remained
broadly stable in 2014.
All permanent limits are approved by the Board prior to implementation. Exceptions are escalated to the Board
/ Board's delegated committees. Additional limits are placed on specific instruments and position
concentrations where appropriate. Sensitivity measures are used in addition to VaR as risk management tools.
Market & Traded Credit Risk ("MTCR") monitor exposures against these limits.
The Group applies two VaR methodologies:-
•
•
VaR is calculated for expected movements over a minimum of one business day and to a confidence level of
97.5 per cent. This confidence level suggests that potential daily losses, in excess of the VaR measure, are
likely to be experienced six times per year.
The Group measures the risk of losses arising from future potential adverse movements in market rates, prices
and volatilities using a VaR methodology. VaR, in general, is a quantitative measure of market risk which
applies recent historic market conditions to estimate the potential future loss in market value that will not be
exceeded in a set time period at a set statistical confidence level. VaR provides a consistent measure that can
be applied across trading businesses and products over time and can be set against actual daily trading profit
and loss outcome.
Value at Risk
concentrations where appropriate. Sensitivity measures are used in addition to VaR as risk management tools.
For example, interest rate sensitivity is measured in terms of exposure to a one basis point increase in yields,
whereas foreign exchange is measured in terms of the underlying values or amounts involved. Option risks are
controlled through revaluation limits on underlying price and volatility shifts, limits on volatility risk and other
variables that determine the options’ value.
Historical simulation: involves the revaluation of all existing positions to reflect the effect of historically
observed changes in market risk factors on the valuation of the current portfolio. This approach is applied
for general market risk factors and from the fourth quarter of 2012 has been extended to also cover the
majority of specific (credit spread) risk VaR.
Monte Carlo simulation: this methodology is similar to historical simulation but with considerably more
input risk factor observations. These are generated by random sampling techniques, but the results
retain the essential variability and correlations of historically observed risk factor changes. This approach
is now applied for some of the specific (credit spread) risk VaR in relation to idiosyncratic exposures in
credit markets.
Page 62
Page 65
Standard Chartered Bank Malaysia Berhad
and its subsidiaries
Pillar 3 Disclosures
6.
In both methods an historical observation period of one year is chosen and applied.
Back Testing
VaR is calculated as the Group’s exposure as at the close of business. Intra-day risk levels may vary from
those reported at the end of the day.
Stress scenarios are subject to periodic review to reflect changes in risk profile and economic events. The
ERC has responsibility for reviewing stress exposures and, where necessary, enforcing reductions in overall
market risk exposure. The ERC considers stress testing results as part of its supervision of risk appetite.
Stress testing
Stress testing is an integral part of the market risk management framework and considers both historical
market events and forward looking scenarios. A consistent stress testing methodology is applied to trading and
non-trading books. The stress testing methodology assumes that scope for management action would be
limited during a stress event, reflecting the decrease in liquidity that often occurs.
Market risk (continued)
MTCR complements the VaR measurement by quarterly stress testing market risk exposures to highlight
potential risk that may arise from extreme market events that are rare but plausible.
To assess their predictive power, VaR models are back tested against actual results.
Losses beyond the confidence interval are not captured by a VaR calculation, which therefore gives no
indication of the size of unexpected losses in these situations.
Value at Risk (continued)
Regular stress test scenarios are applied to interest rates, credit spreads and exchange rates. This covers all
major asset classes in the Financial Market banking and trading books.
Valuation framework
Products may only be traded subject to a formally approved Product Programme which identifies the risks,
controls and regulatory treatment. The control framework is assessed by the relevant Bank functions as well as
GIA on an ongoing basis. It is the Group’s policy that all assets and liabilities held are to be recorded in the
financial accounts on a fair-value basis that is consistent with Malaysian Financial Reporting Standards.
Ad-hoc scenarios are also prepared reflecting specific market conditions and for particular concentrations of
risk that arise within the businesses.
Page 63
Page 66
Standard Chartered Bank Malaysia Berhad
and its subsidiaries
Pillar 3 Disclosures
6.
Foreign exchange risk on the non-trading book portfolios is minimised by match funding assets and liabilities in
the same currency. Structural foreign exchange currency risks are not included within the Group's VaR.
The table below analyses VaR by primary categories of market risk:-
VaR and stress tests are therefore applied to these non-trading book exposures, including available for sale
securities. Securities classed as Loans and Receivables or Held to Maturity are not reflected in VaR or stress
tests since they are accounted on an amortised cost basis, so market price movements have no effect on
either profit and loss or reserves.
Interest rate risk from across the non-trading book portfolios is transferred to Financial Markets where it is
managed by the Group's Asset and Liability Management ("ALM") desks under the supervision of ALCO. The
ALM desks deal in the market in approved financial instruments in order to manage the net interest rate risk,
subject to approved VaR and risk limits.
Market risk (continued)
The Product Control function is responsible for valuation controls in accordance with policy. Where possible,
positions held are marked to market on a consistent and daily basis using quoted prices within active markets.
Where this is not possible, positions are marked to model using models which have been independently and
periodically validated by MTCR. Product Control ensures adherence to Standard Chartered PLC Group’s
policy for valuation adjustments to incorporate counterparty risk, bid/ask spreads, market liquidity and where
appropriate model risk reserves to mark all positions on a prudent basis. The BRC provides oversight and
governance of all policy.
Market risk VaR coverage
Valuation framework (continued)
31 December 2014
Actual as at
Average High Low 31 December 2014
RM'000 RM'000 RM'000 RM'000
Trading
Interest rate risk 2,558 4,372 1,751 2,483
Foreign exchange risk 631 2,453 218 554
Non-trading
Interest rate risk 2,588 3,694 1,770 2,039
Actual as at
Average High Low 31 December 2013
RM'000 RM'000 RM'000 RM'000
Trading
Interest rate risk 3,623 6,708 1,813 3,239
Foreign exchange risk 656 2,302 167 367
Non-trading
Interest rate risk 2,767 3,305 1,692 2,961
Value at Risk (VaR at 97.5%, 1 day)
2014
2013
31 December 2013
Page 64
Page 67
Standard Chartered Bank Malaysia Berhad
and its subsidiaries
Pillar 3 Disclosures
6. Market risk (continued)
Group
31 December 2014
Type of Currency
Ringgit Malaysia
US Dollar
Euro
Pound Sterling
Australian Dollar
Japanese Yen
Singapore Dollar
Thai Baht
New Zealand Dollar
Brunei Dollar
Hong Kong Dollar
Group
31 December 2013
Type of Currency
Ringgit Malaysia
US Dollar
Euro
Pound Sterling
Australian Dollar
Japanese Yen
Singapore Dollar
Bank
31 December 2014
Type of Currency
Ringgit Malaysia
US Dollar
Euro
Pound Sterling
Australian Dollar
Japanese Yen
Singapore Dollar
Thai Baht
New Zealand Dollar
Brunei Dollar
Hong Kong Dollar
Bank
31 December 2013
Type of Currency
Ringgit Malaysia
US Dollar
Euro
Pound Sterling
Australian Dollar
Japanese Yen
Singapore Dollar
619
583
493
339
(15)
(247)
(1,221)
RM'000
(145)
4
619
583
493
339
(15)
(247)
(145)
4
RM'000
(4,114)
1,166
2,787
(14)
The tables below detail the disclosure for interest rate risk in the banking book, the increase or decline in
earnings and economic value for upward and downward rate shocks which are consistent with shocks applied
in stress test for measuring interest rate risk, broken down by major currency exposures where relevant:-
Impact on positions as at reporting period
(200 basis points) parallel shift
Increase/(Decline)Increase/(Decline)
Impact on positions as at reporting period
Increase/(Decline) Increase/(Decline)
(200 basis points) parallel shift
1,197 (448)
(35,520)
(470)
RM'000
in earnings at risk
56,081
(207)
(58)
in earnings at risk
(356)
719
915
(11,893) 4,589
(5,085)
(33,118)
(207)
(356)
1,589
719
(11,893) 4,589
RM'000
Impact on positions as at reporting period
Increase/(Decline) Increase/(Decline)
(200 basis points) parallel shift
612
103
1,737
Increase/(Decline)
Impact on positions as at reporting period
(30,957)
Increase/(Decline)
(84,791)
(63)
904
(200 basis points) parallel shift
in economic value
RM'000
(66,970)
(63)
904
(82,828)
RM'000
108,630
in economic value
47
(4,114)
1,589
1,166
2,787
(14)
915 47
33,908 252,318
1,197
103
(448)
(28,615)
1,737 (58)
(71,558)
(470)
RM'000
in economic valuein earnings at risk
in earnings at risk in economic value
RM'000
87,315
Page 65
Page 68
Standard Chartered Bank Malaysia Berhad
and its subsidiaries
Pillar 3 Disclosures
7. Equity exposures in banking book
Risk weighted
Group and Bank assets
RM'000
Privately Held
For socio-economic purposes 9,098 9,098 9,098 9,098
For non socio-economic purposes 626 938 623 934
9,724 10,036 9,721 10,032
8. Operational risk
Objective
Governance structure
Roles and responsibilities
Gross Risk weighted Gross
Table below details the equity exposures in banking book of the Group.
31 December 2014 31 December 2013
exposures assets exposures
RM'000 RM'000 RM'000
Operational Risk is the potential for loss arising from the failure of people, process or technology or the impact of
external events.
BNM has formally approved the Bank's use of the TSA for calculating and reporting operational risk capital
requirement in November 2009. As a result, the Bank has been using TSA for calculating and reporting the
operational risk capital requirement from July 2010 onwards.
Operational risk exposures arise as a result of business activities. It is the Group’s objective to minimise such
exposures, subject to cost tradeoffs. This objective is met through a framework of policies and procedures
originating from Standard Chartered PLC Group that drive our risk management approach through six inter-
dependent risk management process categories of plan, inform, control, originate, optimize and communicate.
Governance over operational risk management is achieved through a defined structure of committees at the
group, business and function. At each level, operational risk governance committees integrate into Standard
Chartered PLC Group’s and the Bank's overall risk governance structure. Standard Chartered PLC Global
Business Risk Committee, a subcommittee of Standard Chartered PLC Group's ERC, supervises the
management of operational risks across all businesses and functions, while at a Country level, this role is
performed by the Country Operational Risk Committee ("CORC"), a subcommittee of local ERC. Escalation rules,
linked to risk tolerance limits, are in place to ensure that operational risk decisions are taken at the right level
within the governance structure.
Responsibility for the management of operational risk rests with business and function management as an integral
component of the management task. An independent Operational Risk function within the Risk function works
alongside them to ensure that exposure to operational risk remains within acceptable levels.
Page 66
Page 69
Standard Chartered Bank Malaysia Berhad
and its subsidiaries
Pillar 3 Disclosures
8.
Risk management approach
Assurance
Measurement
9. Comparative figures
The GIA function provides independent assurance of the effectiveness of management’s control of its own
business activities and of the processes maintained by the Risk Control Functions. As a result, GIA provides
assurance that the overall system of control effectiveness is working as required within the Risk Management
Framework.
The Group uses the standardised approach ("TSA") to assess its regulatory capital charge for Operational Risk.
The operational risk capital charge for TSA is calculated as the three-year average of the simple summation of the
regulatory capital charges across the eight business lines in each year. The capital charge for each business line
is calculated by multiplying the annual gross income by a factor assigned to that business line.
Except as disclosed in Section 5.6, certain comparative figures have been restated to conform with current year
presentation in line with the Standard Chartered PLC Group's refreshed strategy and the creation of new
customer segment group.
Standard Chartered PLC Group’s operational risk management procedures and processes are integral
components of the broader Risk Management Framework and is approved and adopted by the Board for local
adoption. Operational risks are managed through an end to end process of plan, inform, control, originate,
optimize and communicate. This six inter-dependent risk management process is performed at all levels across
the Group and country level, and is the foundation of the risk management approach. Once identified, risks are
assessed against standard criteria to determine their significance and the degree of risk mitigation effort required
to reduce the exposure to acceptable levels. The Group's operational risk management approach serves to
continually improve the Group's ability to anticipate all material risks and to increase our ability to demonstrate,
with a high degree of confidence, that those material risks are well controlled. Risk mitigation plans are overseen
by the appropriate local and Standard Chartered PLC Group's governance committee.
Operational risk (continued)
Page 67
Page 70
Standard Chartered Bank Malaysia Berhad
and its subsidiaries
Pillar 3 Disclosures
Chief Executive Officer Attestation
In accordance with Bank Negara Malaysia’s Risk Weighted Capital Adequacy Framework (Basel II) – Disclosure
Requirements (Pillar 3), I hereby attest that to the best of my knowledge, the disclosures contained in Standard
Chartered Bank Malaysia Berhad’s Pillar 3 Disclosures report for the financial year ended 31 December 2014
are consistent with the manner in which the Group and the Bank assesses and manages its risk, and are not
misleading in any particular way.
Mahendra Gursahani
Chief Executive Officer
Date: 10 June 2015
.....................................................................
Page 68