Stock Code: 2807 Standard Chartered Annual Report 2013 Standard Chartered Bank ( Taiwan )Limited MOPS website: http://newmops.twse.com.tw Bank website: https://www.sc.com/tw/ Date of publication: 28/05/2014
Addresses and phone numbers of the head office and branches :For detailed information, refer to the "Directory of Branches and Offices" from page 233 to page 236.
Stock registration agentStock Administration of Yuanta Securities Co. Ltd.
Address : B1, No. 210, Cheng De Rd., Sec. 3, Taipei City
Tel. No. : ( 02 ) 2586-5859
Website : http://www.yuanta.com.tw
Credit rating institutionsFitch Ratings Taiwan
Address : Room 1306, 13F, No. 205, Tunhua North Rd., Taipei City
Tel. No. : ( 02 ) 8175-7600
Taiwan Ratings Corporation
Address : 49F, No.7, Xinyi Rd., Sec. 5, Taipei City
Tel. No. : ( 02 ) 8722-5800
Names of CPAs certifying financial statements of the most recent year : Ming-Zhi Wang and Lin Wu
Company Name : Klynveld Peat Marwick Goerdeler (KPMG)
Address : 68F, No.7, Xinyi Rd., Sec. 5, Taipei City
Address : http://www.kpmg.com.tw
Tel. No. : ( 02 ) 8101-6666
Name of the stock exchange where the overseas securities are listed for trading and the enquiry method : None.
Bank website : https://www.sc.com/tw/
3
I. Letter to Shareholders 6
II. Bank Profile 8
III. Corporate Governance 1. Organization Structure 10
2. Information on Directors, Supervisors, Executive Officers and Branch Managers 12
3. Corporate Governance Practices 35
4. Information on CPA Charges 58
5. Information on Change of CPA 59
6. Information on the Bank’s Chairman, President or Executive Officer(s) in Charge of Financial and Accounting
Affairs Who Has Served a Position in an Independent Auditing Firm to Which the CPAs Belong or Its Affiliate(s)
During the Past Year 59
7. Change in the Equity (Shareholding, Share Transfer and Pledge) of Directors, Supervisors and Executive Officers 59
8. Information on Top 10 Shareholders Who Are Related Parties as Defined in the Statement of Financial
Accounting Standards No. 6 59
9. The Shares and Consolidated Shareholding Ratios 60
Acquisitions or Assignment involving Other Financial Institutions 72
4. Capital Utilization Plan and Execution Status 72
V. Operations Overview
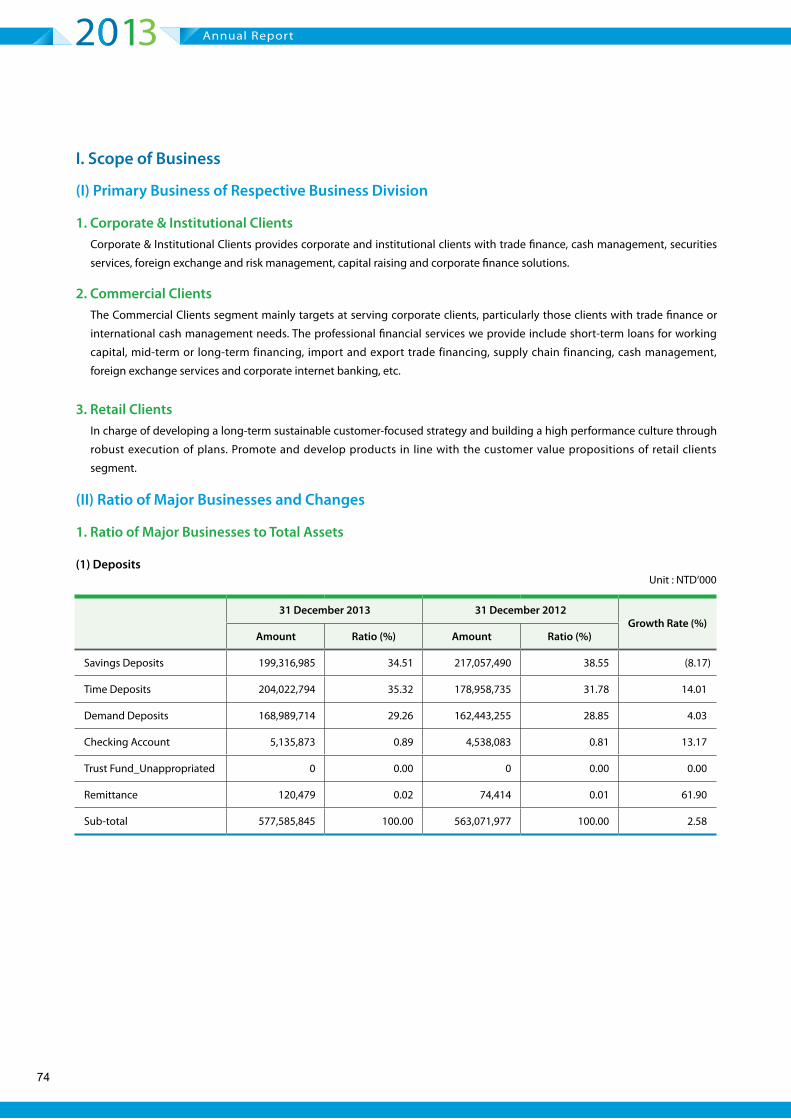
1. Scope of Business 74
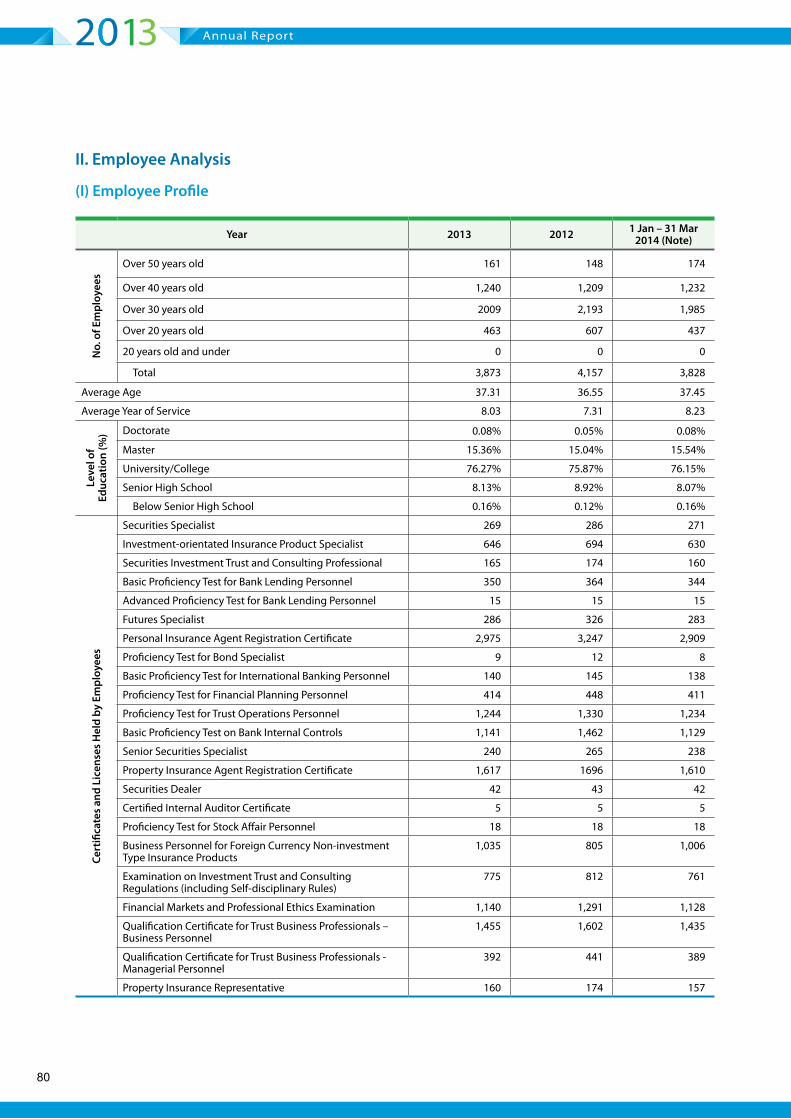
2. Employee Analysis 80
3. Corporate Responsibilities and Ethics 82
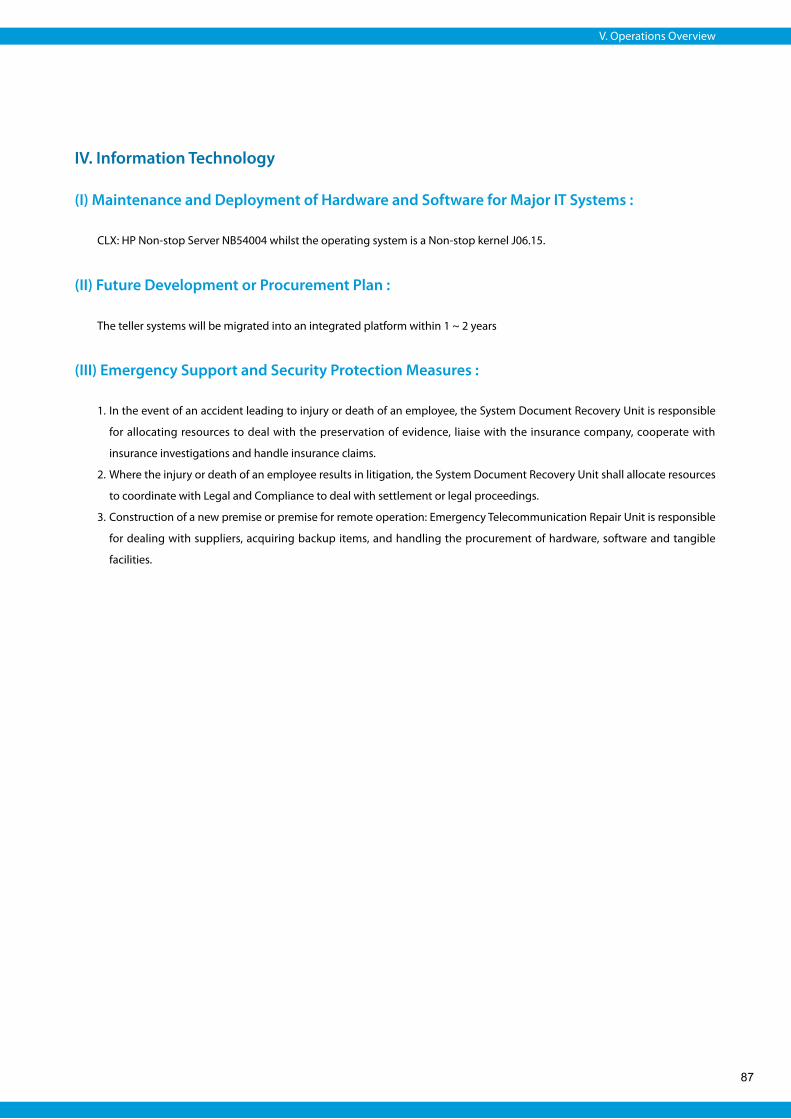
4. Information Technology 87
Contents
Contents
Annual Report
4
5. Labor-Management Relations 88
6. Important Contracts 90
7. Information on Financial Assets Securitization 90
VI. Financial Highlights
1. Condensed Balance Sheet and Statement of Profit or Loss and Other Comprehensive Income for the Past Five Years 92
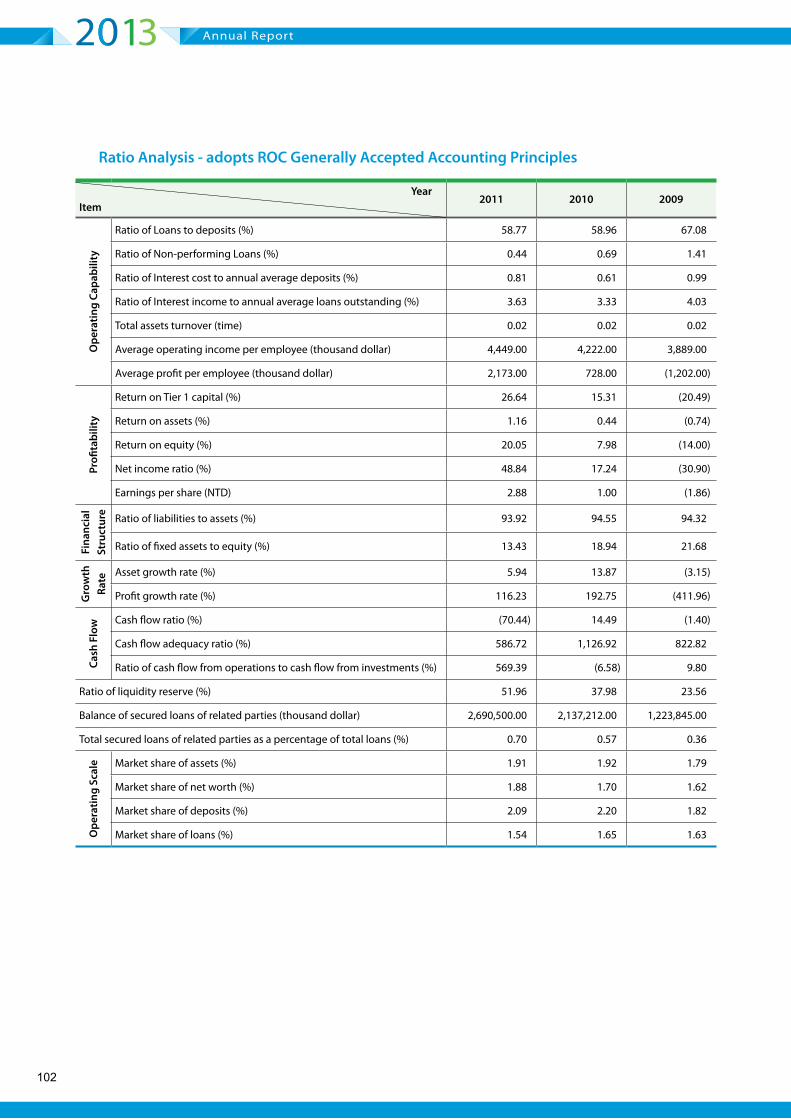
2. Financial Analysis for the Past Five Years 99
3. Supervisors’ Report for the 2013 Financial Statements 108
4. 2013 Standalone Financial Statements and Independent Auditors’ Report 109
5. 2013 Consolidated Financial Statements of the Bank and Its Subsidiaries Audited by the CPAs 201
6. Any Financial Crunch Confronted by the Bank and Its Affiliates and the Related Impacts 206
VII. Review and Analysis of Financial Conditions, Financial Results and Risk Management
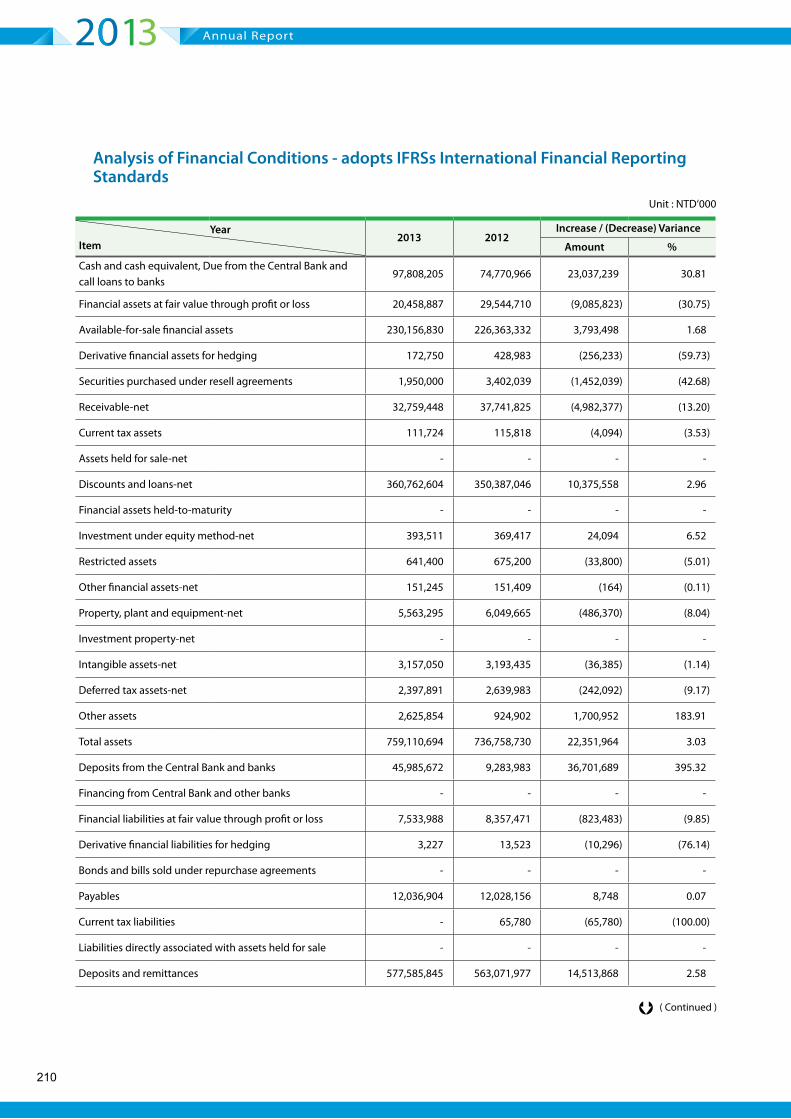
1. Analysis of Financial Conditions 208
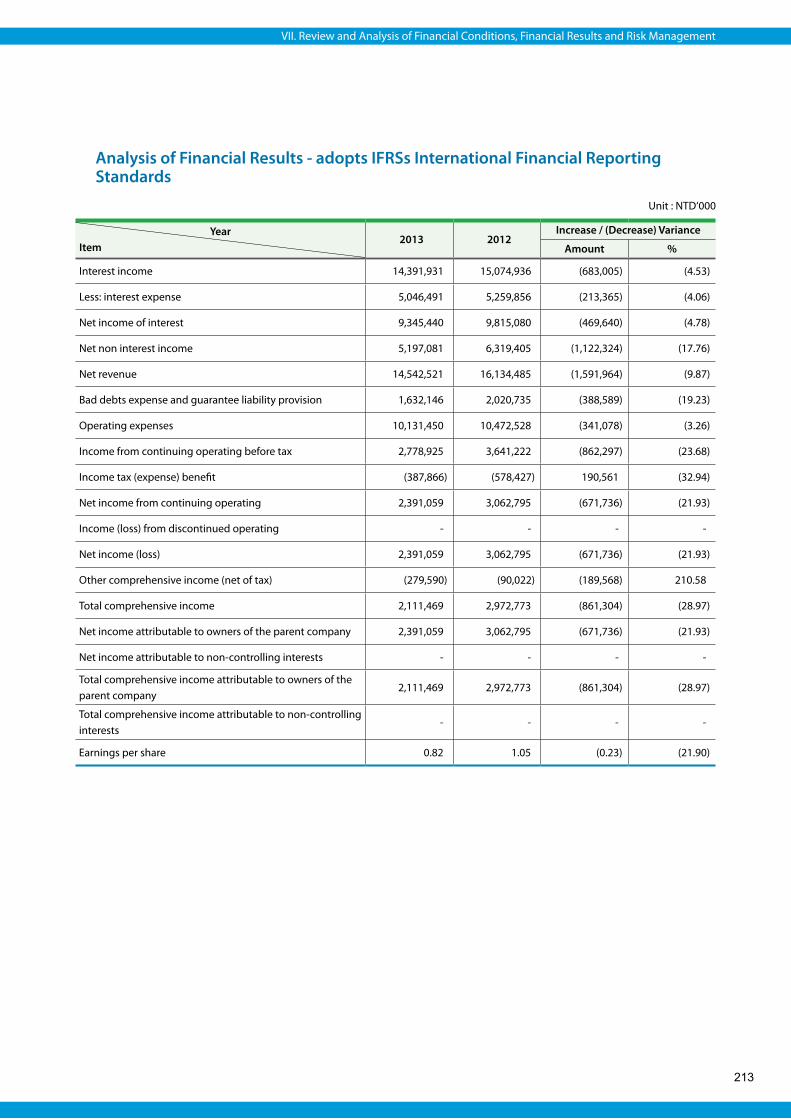
2. Analysis of Financial Results 212
3. Cash Flows 214
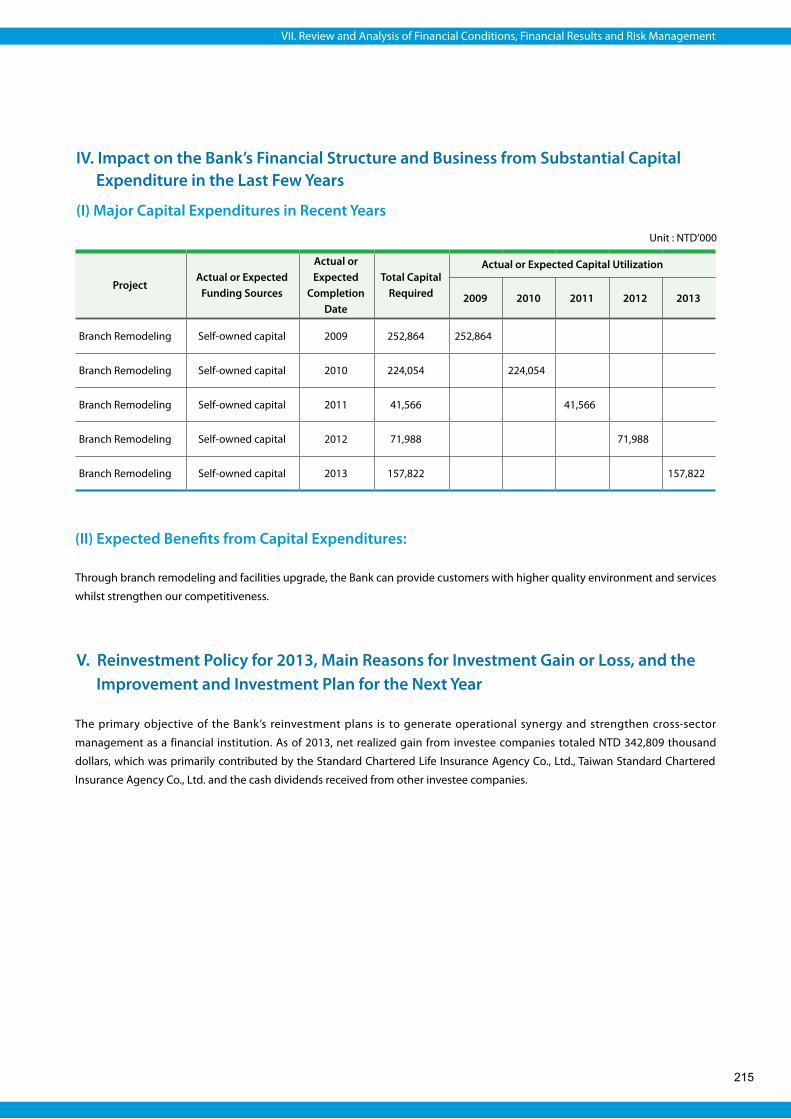
4. Impact on the Bank’s Financial Structure and Business from Substantial Capital Expenditure in the Last Few Years 215
5. Reinvestment Policy for 2013, Main Reasons for Investment Gain or Loss, and the Improvement and
Investment Plan for the Next Year 215
6. Risk Management 216
7. Emergency Response Mechanism 226
8. Other Important Matters 226
VIII.Special Notes
1. Information on Affiliated Enterprises 228
2. Private Placement of Securities and Bank Debentures 232
3. Shares Held or Disposed of by the Subsidiaries 232
4. Other Supplementary Notes 232
Appendix
Directory of Branches and Offices 234
5
Standard Chartered Bank Dunbei Branch
Letter to ShareholdersI
Annual Report
6
Taiwan’s economy grew by 2.2% in 2013, slightly faster than the
1.3% recorded in 2012. The continuing soft global economy had
dampened export growth, while Taiwan government’s on-going
efforts to curb speculative activities in the residential market,
recent hikes in utility prices, and the public concern over food
safety standards, had put a dent on consumer demand. On the
positive side, the government’s continuing effort to promote cross-
straits relations and exchanges with Mainland China provided a
strong boost to the local economy.
Taiwan also implemented aggressive reform measures aimed
at further enhancing its economic and financial service
competitiveness. These included the introduction of the Free
Economic Pilot Zone (FEPZ) project and the development of
an offshore RMB market. We expect the economy to rebound
strongly in 2014, on the back of improving global outlook, aided
in part by steady demand for high-tech products. This will lead to
increased capex and hiring in the local manufacturing sector, with
unemployment rate expected to fall below 4%.
However, this growth could be hampered by the increasing
possibility of an interest rate hike in June 2014, rising concern of
domestic inflation due to second-round impact of recent utility
and transportation price hikes. There is also potential risk on
Taiwan’s capital markets from a reduction in the size of quantitative
easing by the US Federal Reserve. Nonetheless, we forecast
Taiwan’s economy to grow 3.9% in 2014, supported by a healthy
current account balance.
In 2014, Taiwan’s banking sector is likely to benefit from the
steady growth in the global economy, continuing domestic
economic recovery, increasing credit appetite among corporate
and individual clients, an expansion of offshore RMB business in
Taiwan, and rising demands for local equity market and wealth
management services. We also expect the sector’s profitability and
overall asset quality to improve.
2013 had been a challenging year. Excluding one-offs, Standard
Chartered’s 2013 net profit equaled that of 2012. Total operating
income was down 5 percent, after excluding non-core business
gains, as a result of regulatory curbs on mortgage, margin
compression and lower investment yield, but partly alleviated
by higher income from corporate lending and strong wealth
management fee income. Overall operating expenses continued
to be tightly managed in 2013, with cost 3% lower year-on-year.
The Bank’s credit portfolio remained sound, with bad debt charges
lowered by 19% compared 2012. NPL ratio also improved from
0.70% a year ago to 0.53% in 2013, while the loan loss coverage
ratio increased substantially from 218.85% to 269.77% over the
same period.
The Bank’s balance sheet was strong and resilient with customer
loans increasing by 3%; strong trajectory in corporate loans was
partly offset by lower growth in unsecured and mortgage lending,
and asset quality remained solid. Total deposits remained healthy
with RMB becoming the fastest growing currency for the year.
The Bank continued to be highly liquid and well capitalized. Local
currency liquidity reserve ratio was 53.7% and loan-to-deposit
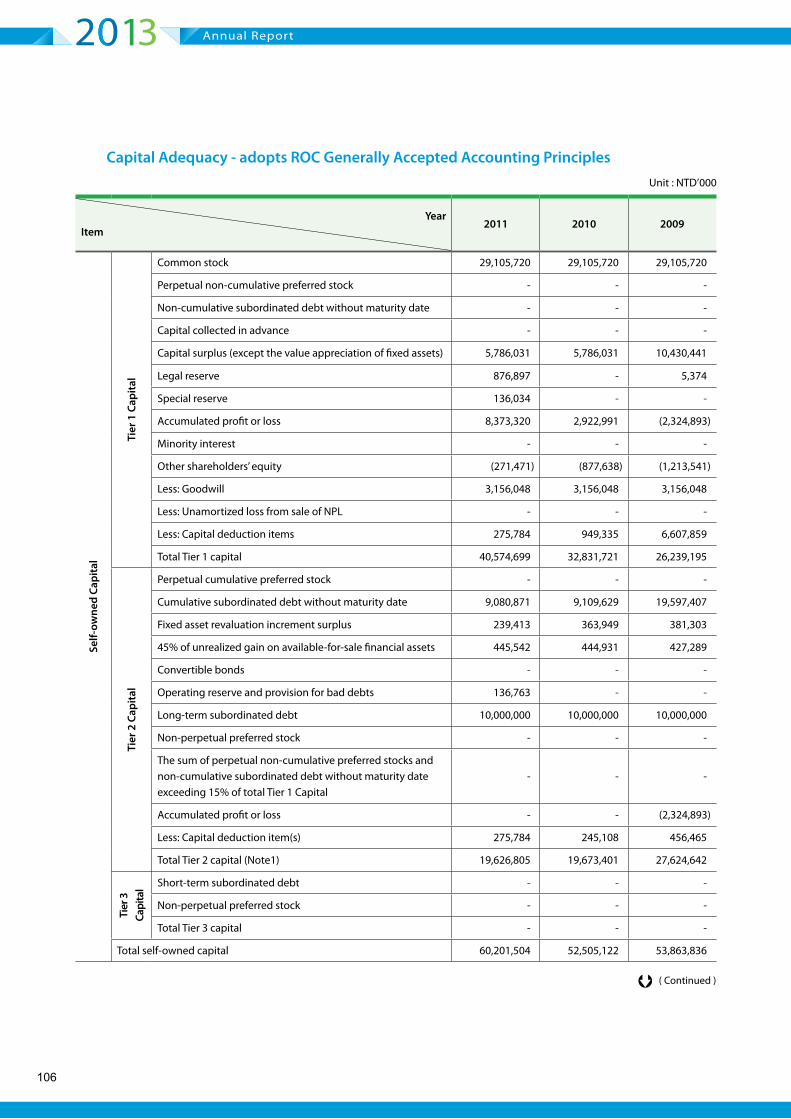
ratio was 63.4% as of December 31, 2013. The capital adequacy
ratio was 13.61%, and Tier 1 ratio was 9.12%, above regulatory
requirements.
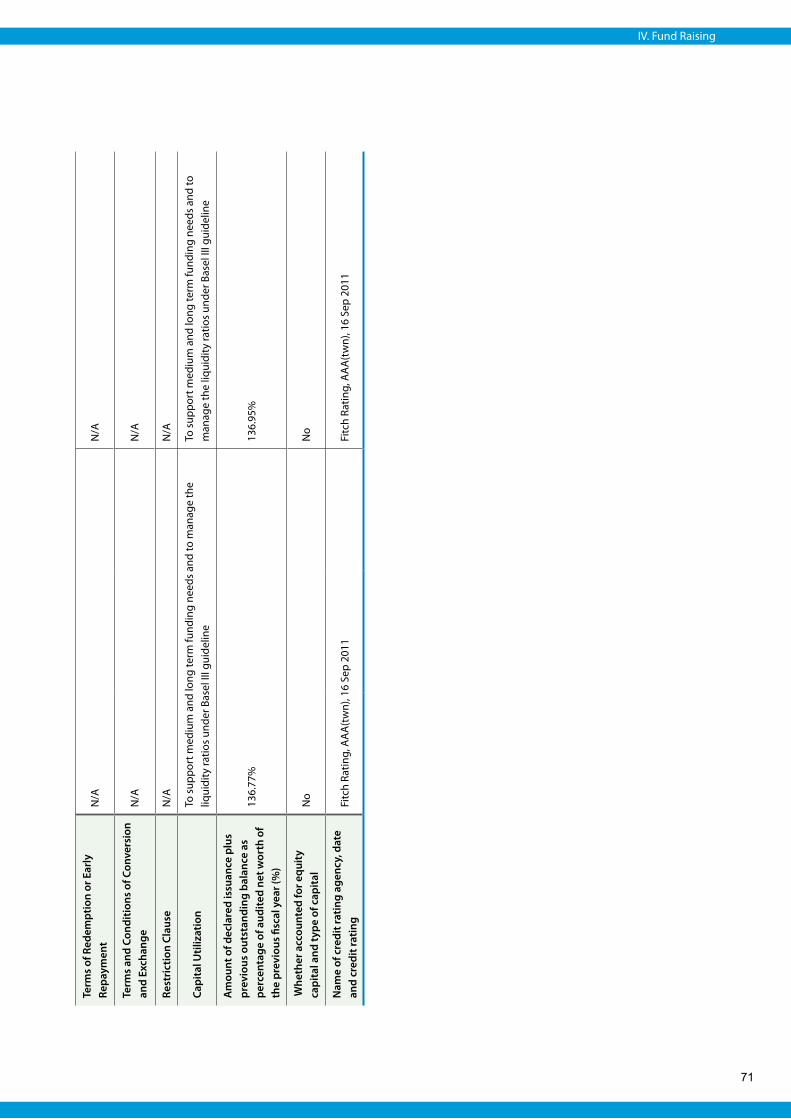
The Bank’s credit rating by Fitch Ratings in October 2013 was
AAA (twn) for domestic long-term credit, F1+(twn) for domestic
short-term credit, AA- for international long-term credit, F1+ for
international short-term credit, with an overall "stable" outlook. In
August 2013, Taiwan Ratings Corporation, a local arm of Standard
& Poor’s, rated the Bank as twAAA for long-term credit, twA-
1+ for short-term credit, with an overall "negative" outlook. By
adopting and implementing prudent business strategies, the Bank
is confident to deliver strong financial performance, and maintain
good asset quality and adequate capital levels in 2014.
Looking forward in 2014, the Bank will focus on:
accelerating growth in three key customer segments –
Corporate and Institutional Clients, Commercial and Private
Banking Clients, and Retail Customers – supported by five
dedicated product groups;
leveraging on our strong network in Greater China and beyond to
support our clients in their business expansion and investments
abroad;
leading in digitization to provide our clients with the best
mobile banking platform and services;
strengthening internal control and compliance, while remaining
vigilant on risks and costs; and
becoming the best international bank in Taiwan and the bank of
choice for RMB products and services.
With our long term commitment to Taiwan, we are living up to our
brand promise of being "Here for good" for our customers, our
shareholders and our staff.
Benjamin Pi-Cheng Hung
Chairman
Letter to Shareholders
7
"Here for good" façade in Taipei
Bank ProfileII
Annual Report
8
I. History
Standard Chartered PLC ("the Group") is a leading international banking group, with more than 86,000 employees and a 150-
year history in some of the world’s most dynamic markets. We bank the people and companies driving investment, trade and
the creation of wealth across Asia, Africa and the Middle East, where we earn around 90 per cent of our income and profits. Our
heritage and values are expressed in our brand promise, Here for good.
Standard Chartered PLC is listed on the London and Hong Kong Stock Exchanges as well as the Bombay and National Stock
Exchanges in India.
With nearly 4,000 Mandarin speaking talents, 88 branches across Taiwan, Standard Chartered is capable of offering individuals
and corporate clients full-scale banking services and innovative products and aspires to become the Bank of Choice in Taiwan.
Standard Chartered opened its first branch ("the Bank") in Taiwan in 1985. Between 2006 and 2008, the Bank grew with a great
leap in this robust market. The acquisition of Hsinchu International Bank in November 2006 marked a milestone in Standard
Chartered’s course of development in Taiwan. The completion of integration of the two banks in July 2007 made Standard
Chartered an international bank with the largest network in Taiwan. The amalgamation with American Express Bank and the
"Good Bank" part of Asia Trust and Investment Corporation in August and December 2008, respectively, further enhanced
Standard Chartered Group’s footprint in Taiwan and demonstrated the Bank’s strong commitment to the Taiwan market.
The Bank has been widely recognized for its commitment to enhancing services and brand reputation in Taiwan. In 2013,
the Bank received awards include "Benchmark Enterprise of Digital Services" from Business Next Magazine, Excellence of
Best Multinational Company in the Best Consumer’s Financial Brand Award jointly organized by Wealth Magazine and PwC,
certification of Elderly-Friendly Bank from the Hsinchu City Government, "Exemplary Organization of Collective Bargaining
Agreement (CBA)" from the Council of Labour Affairs, Executive Yuan
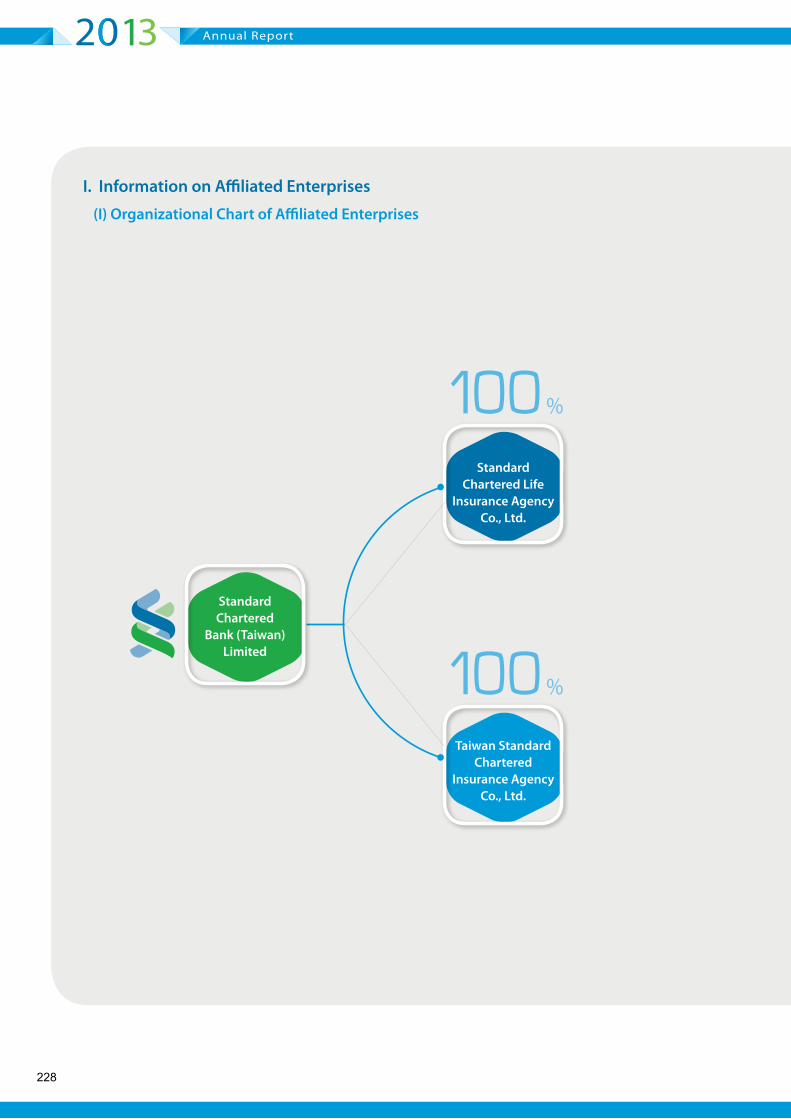
II. Information on mergers, acquisitions, reinvestment in affiliated enterprises and company restructure for the most recent fiscal year and up to the printing date of the annual report :
Current shareholding of the Bank in affiliated enterprises includes the following: 100% in Standard Chartered Life Insurance
Agency Co, Ltd. and 100% in Taiwan Standard Chartered Insurance Agency Co, Ltd. Please refer to page 228 for details.
III. Information on a major transfer or change in ownership of shares belonging to Directors, Supervisors or a concerned party requiring to declare any change in shareholding pursuant to Paragraph 3, Article 25 of the Banking Act :【None】
99
President Ma Ying-jeou participated in the Financial Times-Standard Chartered Taiwan Economic Summit.
Corporate GovernanceIII
Annual Report
10
I. Organization Structure
( I ) Organizational Chart
Legal&ComplianceDepartment
CorporateAffairsDepartment
HumanResourcesDepartment
RiskManagementDepartment
FinanceandCorporateRealEstateServiceDepartment
CompanySecretariat
FinancialMarkets
Corporate&InstitutionalClients
InternationalBankingDepartment
OffshoreBankingUnit
GroupTechnology&OperationsDepartment
CommercialClients
TrustDepartment
SecuritiesDepartment
Branches
TransactionBanking
WealthManagement
ShareholdersMeeting
BoardofDirectors
InternalAuditDepartment
President
RetailClients
11
(II) Responsibilities of Major Departments
III. Corporate Governance
Internal Audit Department In charge of audits of business, finance, asset management, IT and other functions; any other audit assignment required by Board of Directors and the regulator, etc.
Human Resources Department
Responsible for recruiting and hiring employees; the review and establishment of policies on compensations and benefits; management of employee performance and rewards; payroll processing; management of employee benefits, and administration procedures, operational risk, and HR systems; management of employee joining, exit, transfer processing; planning and implementing employee training and development; talent development and succession plan; welfare committee management, employees relations, equal employment, management of union relationships and employee grievances, etc.
Group Technology & Operations Department
In charge of overall banking operations; Re-engineering; service quality management; operational risk management for Retail Clients; Global sourcing, information security and system developments, Risk control and governance to Technology & Operations, soft and hardware technical supports, etc.
Legal & Compliance DepartmentIn charge of lawsuits, compliance, financial crime risks; legal & regulatory issues regarding new financial products and services; serves as the contact window with local regulators; conduct research on legal matters related to the Bank, etc.
Corporate Affairs DepartmentIn charge of the planning and execution of internal communication, media relations, government relations, sustainability, community investment, sponsorship policies and reputation risk management, etc.
Risk Management DepartmentResponsible for the Risk Management of the entire Bank. The main areas are credit risk, market risk, and operational risk, etc. It is also in charge of credit limits approval, risk monitoring, control of credit documents and the formulation of credit policies & procedures.
Finance and Corporate Real Estate Service Department
Finance is responsible for the forecast and execution of budget planning; tax returns filing and accounting; annual reporting; capital & balance sheet management; consultation, management, evaluation and analysis of operational businesses, etc.Corporate Real Estate Service is responsible for general administration, leasing, sales and acquisitions of real estate properties; managing and maintaining the Bank’s properties and facilities, risk management including health and safety, security, business continuity management and drills etc.
Company Secretariat Provide company secretarial, governance advisory and administrative support services for SCBTL and its directors, etc.
Financial MarketsEngaging in the treasury management and trading of interest rates, bond and NTD and foreign currencies; sales of FX, fixed income, rates and commodity related derivatives; management of Bank’s assets and liabilities; capital market and financial advisory related matters.
Corporate & Institutional ClientsEngaging in the maintenance, promotion, credit analysis, risk management, and sales of lending, transaction banking, financial markets and capital markets product and services to large corporate and institutional clients.
International Banking Department In charge of the management and supervision of foreign exchange businesses; management of institutional lending disbursement; serve as the contact window with local regulators. , etc
Offshore Banking Unit In charge of the management and supervision of offshore banking businesses; serve as the contact window with local regulators, etc.
Retail ClientsIn charge of developing a long-term sustainable customer-focused strategy and building a high performance culture through robust execution. Responsible for retail clients segment development in customer value propositions and product developments.
Commercial Clients
In charge of developing a sustainable customer-focused strategy by engaging in the development, promotion, credit analysis, risk management, and sale of commercial clients products and services. Responsible for business development and maintenance, sales channel management, operation process and risk management, enhancement of customer experience and service quality, analysis of business operations, evaluation of product performance, and project execution, etc.
Trust Department In charge of the planning, management and operation of trust business; and enacting the businesses authorised by the authorities, etc.
Securities Department Responsible for the planning, management and execution of securities businesses; and enacting the businesses authorised by the authorities
Branches Operating the Bank’s businesses pursuant to the Banking Act and approved by the competent authorities, etc
Transaction Banking
Engaging in product development, promotion and risk management of payments, collections, liquidity management, trade services, security services and other transaction banking products and services. Responsible for the product governance, risk management, planning and delivery through physical or virtual channels, service quality enhancement. Conduct operation analysis, performance evaluation and project execution for transaction banking products.
Wealth ManagementIn charge of establishing customer-focused wealth management business through a planning and implementation to execute investment business service, and responsible for Taiwan wealth management products and enacting the business authorized by authorities.
Note : The organizational Chart was approved by the board on 26 March 2014 with effective 1 April 2014
12
Annual Report
13
Title NameDate
electedTerm
Date first elected
Shareholding when elected
Current shareholding
Shareholding of spouse &
minors
Shareholding in other’s name
Experience / Education Also serve concurrently as
Other executives, directors or supervisors are spouse or
within second-degree relative of consanguinity to each other
SharesRatio (%)
SharesRatio (%)
SharesRatio (%)
SharesRatio (%)
Title Name Relationship
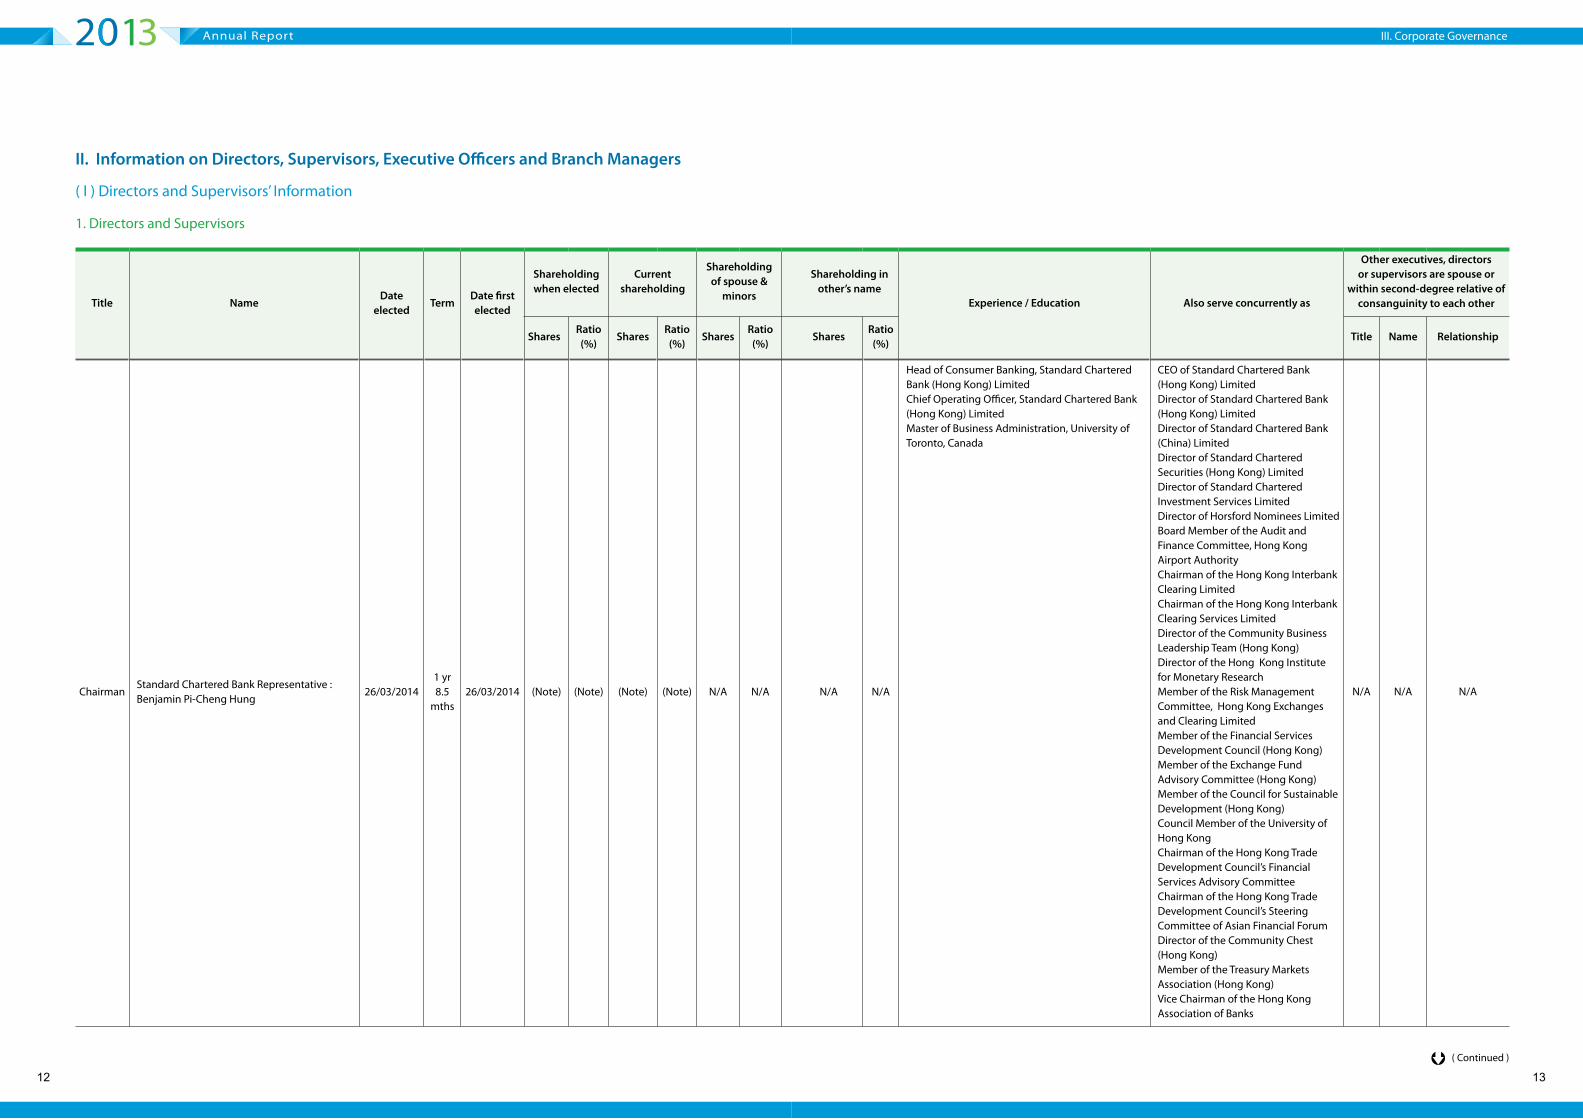
ChairmanStandard Chartered Bank Representative : Benjamin Pi-Cheng Hung
Head of Consumer Banking, Standard Chartered Bank (Hong Kong) LimitedChief Operating Officer, Standard Chartered Bank (Hong Kong) LimitedMaster of Business Administration, University of Toronto, Canada
CEO of Standard Chartered Bank (Hong Kong) LimitedDirector of Standard Chartered Bank (Hong Kong) LimitedDirector of Standard Chartered Bank (China) LimitedDirector of Standard Chartered Securities (Hong Kong) LimitedDirector of Standard Chartered Investment Services LimitedDirector of Horsford Nominees LimitedBoard Member of the Audit and Finance Committee, Hong Kong Airport AuthorityChairman of the Hong Kong Interbank Clearing LimitedChairman of the Hong Kong Interbank Clearing Services LimitedDirector of the Community Business Leadership Team (Hong Kong)Director of the Hong Kong Institute for Monetary ResearchMember of the Risk Management Committee, Hong Kong Exchanges and Clearing LimitedMember of the Financial Services Development Council (Hong Kong)Member of the Exchange Fund Advisory Committee (Hong Kong)Member of the Council for Sustainable Development (Hong Kong) Council Member of the University of Hong KongChairman of the Hong Kong Trade Development Council’s Financial Services Advisory CommitteeChairman of the Hong Kong Trade Development Council’s Steering Committee of Asian Financial ForumDirector of the Community Chest (Hong Kong)Member of the Treasury Markets Association (Hong Kong)Vice Chairman of the Hong Kong Association of Banks
N/A N/A N/A
II. Information on Directors, Supervisors, Executive Officers and Branch Managers
( I ) Directors and Supervisors’ Information
1. Directors and Supervisors
( Continued )
III. Corporate Governance
14
Annual Report
15
Title NameDate
electedTerm
Date first elected
Shareholding when elected
Current shareholding
Shareholding of spouse &
minors
Shareholding in other’s name
Experience/Education Also serve concurrently as
Other executives, directors or supervisors are spouse or
within second-degree relative of consanguinity to each other
SharesRatio (%)
SharesRatio (%)
SharesRatio (%)
SharesRatio (%)
Title Name Relationship
DirectorStandard Chartered Bank Representative : Ajay Chamanlal Kanwal
CEO/President of the Bank (until 31 March 2014)Regional Head of Consumer Banking, Southeast Asia, Standard Chartered Bank (Singapore)Head of Consumer Banking, Standard Chartered Bank (Singapore)Master in Management Studies, P. L.N.W. Institute of Management Studies and Research, India
Regional CEO of Northeast East Asia, Standard Chartered BankPresident and CEO of Standard Chartered Bank (Korea) LimitedDirector of Standard Chartered Bank (China) Limited
N/A N/A N/A
DirectorStandard Chartered Bank Representative : John Ming Kiu Tan
Head of Global Markets, Co-Head of Wholesale Banking, Standard Chartered Bank (Hong Kong) LimitedHead of Global Markets, Co-Head of Wholesale Banking, Standard Chartered Bank (China) LimitedExecutive Director & Head of Treasury of Dah Sing Bank, Hong KongMaster of Applied Finance, Macquarie University, Australia
CEO/President of the Bank (since 1 April 2014)
N/A N/A N/A
DirectorStandard Chartered Bank Representative : Yen-Ting Chen
Executive Vice President, Manulife-Sinochem Life, Shanghai (China)Chief Financial Officer, Nanshan Life Insurance Company (Taiwan)Master of Businesss Administration, City University Seattle, USABachelor of Science in Accounting, Washington University, USAAICPA - CPA, USA
Chief Financial Officer, Standard Chartered Bank (Taiwan) LimitedSupervisor of Standard Chartered Life Insurance Agency Co., LtdSupervisor of Taiwan Standard Chartered Insurance Agency Co., Ltd
N/A N/A N/A
DirectorStandard Chartered Bank Representative : Wei-Chih Chen
Head of Learning & Talent Development, Standard Chartered Bank (Taiwan) LimitedGeneral Manager, Shared distribution and Priority Banking, Standard Chartered Bank TaiwanMaster of Businesss Administration, Lehigh University, Pennsylvania, USA
Head of Human Resources, Standard Chartered Bank (Taiwan) Limited
N/A N/A N/A
INEDStandard Chartered Bank Representative : Man-Jung Chan
Executive Director, Chinese Taipei APEC Study CenterSenior Advisor to the President, National Security Council, Republic of ChinaChief of Staff, APEC Business Advisory Council Director General, International Secretariat, Pacific Economic Cooperation CouncilPh.D., Political Economy, Boston University, USA
Visiting Professor, International Doctorate on Asian Studies (IDAS) & Advanced Masters of Business Administration (AMASTER OF BUSINESS ADMINISTRATION) Program, National Chengchi UniversityDirector, Emerging Economies AssociationDirector, Prospect FoundationDirector, Sino- American Cultural and Economic AssociationAdvisor, APEC Study Center, Taiwan Institute of Economic ResearchDirector, Taiwan Environmental Resources Strategy Association
N/A N/A N/A
( Continued )
III. Corporate Governance
16
Annual Report
17
Title NameDate
electedTerm
Date first elected
Shareholding when elected
Current shareholding
Shareholding of spouse &
minors
Shareholding in other’s name
Experience/Education Also serve concurrently as
Other executives, directors or supervisors are spouse or
within second-degree relative of consanguinity to each other
SharesRatio (%)
SharesRatio (%)
SharesRatio (%)
SharesRatio (%)
Title Name Relationship
INEDStandard Chartered Bank Representative : Nei-Ping Yin
Member of Economic Advisory Group, Office of the President, TaiwanMember of National Stabilization Fund Management CommitteeChief of Asia-Pacific Financial Research Center, Business School, National Cheng Chi University , Taiwan5th term of LegislatorConsultant of Ministry of Economic AffairsMember of Economic Development Consulting CommitteeMaster of Economics, Washington University in St. Louis, USA
Professor, Department of Money and Banking, National Chengchi UniversityCounselor of Executive Yuan, Taiwan
N/A N/A N/A
SupervisorStandard Chartered Bank Representative : Norman Lyle
Group Finance Director, Jardine Matheson Holdings LimitedFellow of the Chartered Institute of Management AccountantsFellow of the Association of Corporate TreasurersHarvard Business School, Senior Management ProgrammeUK Cabinet Top Office Management Programme
Supervisor, Standard Chartered Bank (China) LtdINED, Standard Chartered Bank (Hong Kong) Ltd.INED, Grosvenor Asia Pacific LimitedINED, Lei Shing Hong Ltd, Hong KongINED, Msheireb Properties
N/A N/A N/A
SupervisorStandard Chartered Bank Representative : Ray Brown Duggins Jr.
Chief Risk Officer, Consumer Finance, GE Capital Services (USA)Senior Vice President & Chief Risk Officer, GE Consumer Finance (USA)Senior Vice President & Chief Risk Officer, GE Capital Services (USA)Master of Businesss Administration, Banking & Finance, Columbia University, New York, USAMA, Political Science, Columbia University, New York, USA
Chief Risk Officer, Consumer Banking Group, Standard Chartered BankDirector, Standard Chartered Bank (Singapore) Limited
N/A N/A N/A
Note : The Bank is a subsidiary wholly owned by Standard Chartered Bank. Directors and supervisors are appointed as legal representatives by the Bank’s parent company.
III. Corporate Governance
18
Annual Report
Qualification
Name
Over five years of experience in related fields and the following professional qualifications Independence Status ( Note ) The number
of public companies in which the director or supervisor also serves concurrently as an Independent Director
At least lecturer of business, law, finance or accounting departments or other relevant business departments/ divisions of public and private colleges/ universities as required by banking business needs
Judge, prosecutor, attorney, certified public accountant, or other professionally qualified and technical person who possesses certificates of national examinations as required by banking business needs
Experience in business, law, finance, accounting or other work as required by banking business needs
1 2 3 4 5 6 7 8 9 10
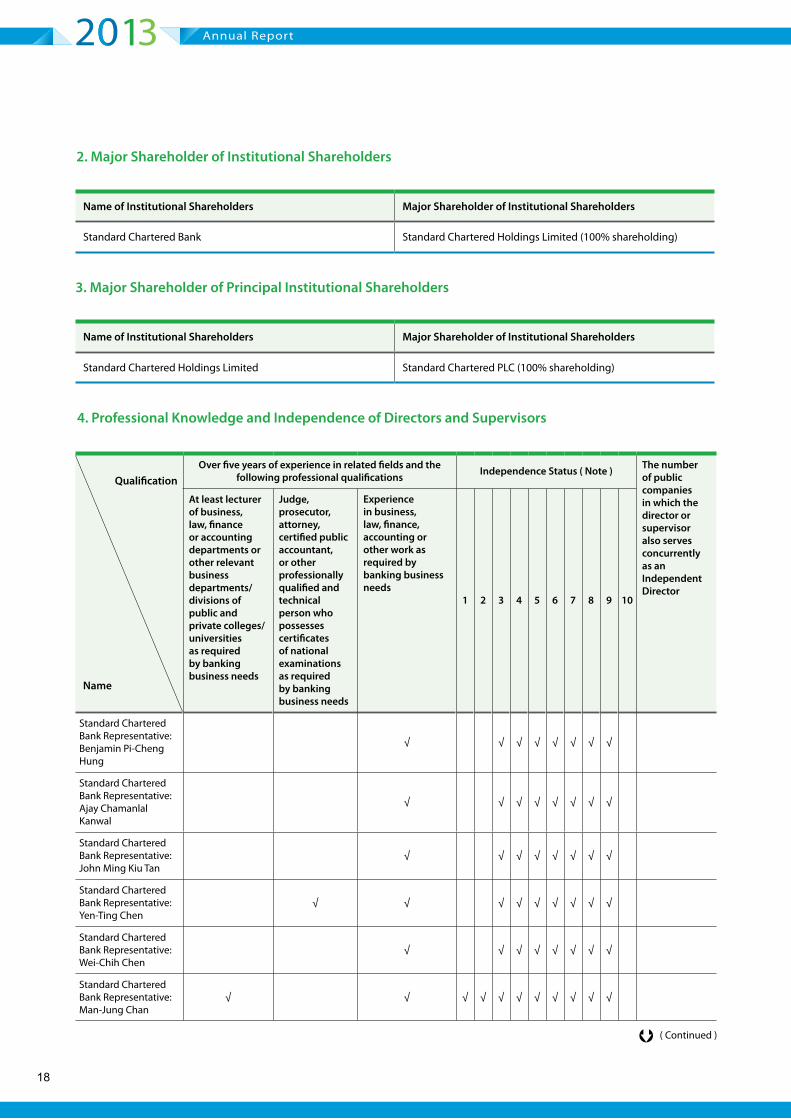
Standard Chartered Bank Representative: Benjamin Pi-Cheng Hung
√ √ √ √ √ √ √ √
Standard Chartered Bank Representative: Ajay Chamanlal Kanwal
√ √ √ √ √ √ √ √
Standard Chartered Bank Representative: John Ming Kiu Tan
√ √ √ √ √ √ √ √
Standard Chartered Bank Representative: Yen-Ting Chen
√ √ √ √ √ √ √ √ √
Standard Chartered Bank Representative: Wei-Chih Chen
√ √ √ √ √ √ √ √
Standard Chartered Bank Representative:Man-Jung Chan
√ √ √ √ √ √ √ √ √ √ √
2. Major Shareholder of Institutional Shareholders
3. Major Shareholder of Principal Institutional Shareholders
4. Professional Knowledge and Independence of Directors and Supervisors
Name of Institutional Shareholders Major Shareholder of Institutional Shareholders
Standard Chartered Bank Standard Chartered Holdings Limited (100% shareholding)
Name of Institutional Shareholders Major Shareholder of Institutional Shareholders
Standard Chartered Holdings Limited Standard Chartered PLC (100% shareholding)
( Continued )
19
Note : Mark “√ ” in the appropriate space where any director or supervisor qualifies the following criteria within two years prior to being
elected and while serving office.
(1) Neither an employee of the Bank, nor an employee of its affiliated enterprises.
(2) Neither a director, supervisor of the Bank, nor a director, supervisor of its affiliated enterprises (provided that this shall not apply
where the director/supervisor is an independent director of the Bank or its parent company, or any company of which over 50% of
shares with voting right are held by the Bank directly or indirectly.)
(3) Shareholder who is any natural person other than the director/supervisor, and the director’s/supervisor’s spouse or minor
possessing more than 1% of the Bank’s total issued shares, or the shareholder of natural person who possesses more than 1% of the
Bank’s total issued shares in the name of another person, or a top-ten shareholder of natural person.
(4) Neither a spouse, nor a relative within 2nd degree relationship or lineal relative within 3rd degree relationship to any person specified
in the preceding three criteria.
(5) Neither a director, supervisor, or employee of an institutional shareholder who directly owns more than 5% of the Bank’s issued
shares, nor a director, supervisor or employee of the top five institutional shareholders who are owners of the Bank’s issued shares.
(6) Neither a director, supervisor, manager of a company/institution doing business or having a financial relationship with the Bank, nor
a shareholder who owns more than 5% of such a company.
(7) Not an owner, partner, director, supervisor, manager or spouse of any sole proprietor business, partnership, company or institution
which has provided the Bank and its affiliates with business, legal, financial, accounting or counseling services. However, this
restriction does not apply to any member of the remuneration committee who exercises powers pursuant to Article 7 of the
Regulations Governing the Establishment and Exercise of Powers of Remuneration Committees of Companies Whose Stock is Listed
on the TWSE or Traded on the GTSM.
(8) Not a spouse or relative within 2nd degree relationship to other directors.
(9) Not a person under the circumstances specified in Article 30 of the Company Act.
(10) Not a government agency, juridical person or its representative pursuant to Article 27 of the Company Act.
Qualification
Name
Over five years of experience in related fields and the following professional qualifications Independence Status ( Note ) The number
of public companies in which the director or supervisor also serves concurrently as an Independent Director
At least lecturer of business, law, finance or accounting departments or other relevant business departments/ divisions of public and private colleges/ universities as required by banking business needs
Judge, prosecutor, attorney, certified public accountant, or other professionally qualified and technical person who possesses certificates of national examinations as required by banking business needs
Experience in business, law, finance, accounting or other work as required by banking business needs
1 2 3 4 5 6 7 8 9 10
Standard Chartered Bank Representative: Nei-Ping Yin
√ √ √ √ √ √ √ √ √ √ √
Standard Chartered Bank Representative:Norman Lyle
√ √ √ √ √ √ √ √ √ √
Standard Chartered Bank Representative: Ray Brown Duggins Jr.
√ √ √ √ √ √ √
III. Corporate Governance
20
Annual Report
21
( II ) Information on the Executive Officers and Branch Managers
Title NameDate
appointed
ShareholdingShareholding of spouse & minor
Shareholding in other’s name Education
Also serve concurrently as
Managers are spouse or within second-degree relative of
consanguinity to each other
Shares % Shares % Shares % Title Name Relationship
President & Chief Executive Officer John Ming Kiu Tan 01/04/2014 0 0 0 0 0 0 Master of Applied Finance, Macquarie University , Australia N/A N/A N/A N/A
Chief Auditor Tzyy-Guan Yang 08/01/2014 0 0 0 0 0 0 Master of Business Administration, Syracuse University, USA N/A N/A N/A N/A
Head of Human Resources Wei-Chih Chen 12/02/2010 0 0 0 0 0 0 Master of Business Administration, Lehigh University, Pennsylvania, USA N/A N/A N/A N/A
Chief Information Officer (acting) Vivian Shyy 29/01/2014 0 0 0 0 0 0 Dept. of Foreign Languages and Literature, Tunghai University N/A N/A N/A N/A
Head of Legal & Compliance Emma Chang 23/07/2012 0 0 0 0 0 0 Master of Law, Washington University, USA N/A N/A N/A N/A
Head of Corporate Affairs Hope Ong 21/12/2012 0 0 0 0 0 0Master of Laws, Soochow University; Master of Computer Science, Georgia Institute of Technology, USA
N/A N/A N/A N/A
Chief Risk Officer Qing Xu 01/07/2013 0 0 0 0 0 0PhD, Department of Real Estate and Project Management, Delft University of Technology, Delft, The Netherlands
Note 1 N/A N/A N/A
Chief Financial Officer Yen-Ting Chen 26/06/2012 0 0 0 0 0 0 Master of Business Administration, City University of Seattle, USA Note 2 N/A N/A N/A
Company Secretary Cathy Li 22/05/2008 0 0 0 0 0 0 Banking and Financial Law, LL.M. Boston University, USA N/A N/A N/A N/A
Head, Corporate & Institutional Clients Wai-Choong Hui 01/06/2012 0 0 0 0 0 0 Master of Business Administration, Nanyang Technological University, Republic of Singapore N/A N/A N/A N/A
Head of International Banking Department and Offshore Banking Unit
Susan Chen 17/11/2011 0 0 0 0 0 0 Master of Business Administration, Tulane University, USA N/A N/A N/A N/A
Head, Retail Clients Jin Ngee Chia 23/12/2013 0 0 0 0 0 0 Masters of Business Administration (Distinction) with major in Finance, Leeds University, UK Note 3 N/A N/A N/A
Head, Commercial Client Betty Yen 01/04/2014 0 0 0 0 0 0 Master of Business Administration in Finance, University of Illinois, USA N/A N/A N/A N/A
Head of Trust Hubert Wang 26/07/2013 0 0 0 0 0 0 Master of Information Management, Chang Gung University N/A N/A N/A N/A
Head of Securities Kevin Wu 18/02/2009 0 0 0 0 0 0 MA in Finance, Western Michigan University, USA N/A N/A N/A N/A
Branch Manager, Xingxing Securities Branch Yu-Ying Liu 19/08/1999 0 0 0 0 0 0 General Education Dept, Yu Da High School of Commerce and Home Economics N/A N/A N/A N/A
Branch Manager, Xinshe Securities Branch Tian-Song Feng 02/01/2004 0 0 0 0 0 0 Dept. of Bank Management, Tamsui Oxford College N/A N/A N/A N/A
Branch Manager, Xinming Securities Branch Shu-Jung Li 28/03/2013 0 0 0 0 0 0 Dept. of Finance and Management, Vanung University N/A N/A N/A N/A
Branch Manager, Nankan Securities Branch Hung-Jen Chang 16/09/2010 0 0 0 0 0 0 Dept. of Banking and Insurance , Chihlee Institute of Business N/A N/A N/A N/A
Branch Manager, Zhunan Securities Branch Xiu-Qiu Peng 23/11/2004 0 0 0 0 0 0 Dept. of International Trades, Open Jr. College under Taichung College of Commerce N/A N/A N/A N/A
Branch Manager, Banqiao Securities Branch Fred Hsu 29/11/2013 0 0 0 0 0 0 Master of Business Administration, Virginia Commonwealth University, USA N/A N/A N/A N/A
Branch Manager, Wenxin Securities Branch Jim Liu 08/07/2010 0 0 0 0 0 0 Dept. of Business Administration , Feng Chia University N/A N/A N/A N/A
Branch Manager, Taoyuan Securities Branch Shao-Kuang Wu 28/03/2013 0 0 0 0 0 0 Dept. of Accounting, Fu Jen Catholic University N/A N/A N/A N/A
Branch Manager, Sanduo Securities Branch Chih-Yang Chen 08/07/2010 0 0 0 0 0 0 Finance (Master of Business Administration) , Oklahoma City University, USA N/A N/A N/A N/A
Branch Manager, Xihu Securities Branch Shu-Hui Yu 28/03/2013 0 0 0 0 0 0 Dept. of General Business, Jhong Li Commercial High School N/A N/A N/A N/A
Branch Manager, Ren’ai Securities Branch Isaac Peng 23/11/2004 0 0 0 0 0 0 Master of Business Administration, National Cheng Kung University N/A N/A N/A N/A
Branch Manager, Business Department Michael Chang 21/09/2010 0 0 0 0 0 0 Dept. of International Business, Fu Jen CatholicUniversity N/A N/A N/A N/A
( Continued )
III. Corporate Governance
22
Annual Report
23
Title NameDate
appointed
ShareholdingShareholding of spouse & minor
Shareholding in other’s name Education
Also serve concurrently as
Managers are spouse or within second-degree relative of
consanguinity to each other
Shares % Shares % Shares % Title Name Relationship
Branch Manager, Hsinchu Branch Shu-Hui Wu 26/07/2013 0 0 0 0 0 0 Dept. of industrial Engineering and Management, Oriental institute of Technology N/A N/A N/A N/A
Branch Manager, Guangfu Branch Chris Lin 24/01/2013 0 0 0 0 0 0 MA in Insurance, Feng Chia University N/A N/A N/A N/A
Branch Manager, Miaoli Branch Shih-Ling Lai 12/05/2008 0 0 0 0 0 0 Dept. of Accounting, Ling Tung College of Commerce N/A N/A N/A N/A
Branch Manager, Neili Branch Chin-Fu Teng 01/07/2008 0 0 0 0 0 0 Dept. of International Trade, Tamsui Oxford College N/A N/A N/A N/A
Branch Manager, Nankan Branch Fei-Lung Lin 23/03/2009 0 0 0 0 0 0 Dept. of Business Administration, Chung Yuan Christian University N/A N/A N/A N/A
Branch Manager, Pingzhen Branch Hsiu-Ling Liu 27/07/2009 0 0 0 0 0 0 Dept. of International Trade, Takming Junior College of Commerce N/A N/A N/A N/A
Branch Manager, Xinwu Branch Cheng-Lung Yu 27/07/2009 0 0 0 0 0 0 Dept. of Economics, Fu Jen Catholic University N/A N/A N/A N/A
Branch Manager, Longtan Branch Mei-Tsun Chen 27/09/2009 0 0 0 0 0 0 Dept. of Accounting, Open Jr. College under National Taipei College of Business N/A N/A N/A N/A
Branch Manager, Guanyin Branch Yu-Fang Chang 14/12/2009 0 0 0 0 0 0 Dept. of Business Administration, Chihlee College of Business N/A N/A N/A N/A
Branch Manager, Gongguan Branch Wen-Chung Su 26/02/2010 0 0 0 0 0 0 Dept. of Business Administration , Feng Chia University N/A N/A N/A N/A
Branch Manager, Zhunan Branch Tsang-Yuan Lin 26/02/2010 0 0 0 0 0 0 Dept. of International Trade, Takming Junior College of Commerce N/A N/A N/A N/A
Branch Manager, Fuxing Branch Vincent Sha 26/02/2010 0 0 0 0 0 0 Dept. of Tourism Industry, Chinese Culture University N/A N/A N/A N/A
Branch Manager, Yuanli Branch Kuang-Huai Ho 26/02/2010 0 0 0 0 0 0Dept. of Industrial Engineering and Management, National Lien-Ho College of Technology and Commerce
N/A N/A N/A N/A
Branch Manager, Yangmei Branch Pei-Chin Chung 30/03/2010 0 0 0 0 0 0 Dept. of Industrial Engineering and Management, Nan Tai College N/A N/A N/A N/A
Branch Manager, Puxin Branch Hsiu-Ju Chiu 30/03/2010 0 0 0 0 0 0 Dept. of Accounting and Statistics, Ta Tung Junior College of Commerce N/A N/A N/A N/A
Branch Manager, East Tainan Branch Ken Lin 26/04/2010 0 0 0 0 0 0 Graduate Institute of Finance , National Chung Cheng University N/A N/A N/A N/A
Branch Manager, Sanmin Branch Meng-Hua Chen 15/12/2010 0 0 0 0 0 0 Dept. of Business Administration, Chihlee College of Business N/A N/A N/A N/A
Branch Manager, Wufu Branch Yu-Cheng Lin 15/12/2010 0 0 0 0 0 0 Dept. of Business Administration, Sun Yat-sen University N/A N/A N/A N/A
Branch Manager, Guanxi Branch Chin-Jen Ho 15/12/2010 0 0 0 0 0 0 Dept. of Accounting and Statistics, Tamsui Oxford College N/A N/A N/A N/A
Branch Manager, Gongxi Branch Edward Wang 15/12/2010 0 0 0 0 0 0 Dept. of Finance, Ming Chuan University N/A N/A N/A N/A
Branch Manager, Houlong Branch Hui-O Su 01/03/2011 0 0 0 0 0 0 Dept. of Accounting, Open Jr. College under Taichung College of Commerce N/A N/A N/A N/A
Branch Manager, Shanziding Branch Wei-Lung Tu 21/04/2011 0 0 0 0 0 0 Dept. of Economics, Chinese Culture University N/A N/A N/A N/A
( Continued )
III. Corporate Governance
24
Annual Report
25
Title NameDate
appointed
ShareholdingShareholding of spouse & minor
Shareholding in other’s name Education
Also serve concurrently as
Managers are spouse or within second-degree relative of
consanguinity to each other
Shares % Shares % Shares % Title Name Relationship
Branch Manager, Neihu Branch Rita Tai 21/06/2011 0 0 0 0 0 0 Dept. of Healthcare Management, Yuanpei College N/A N/A N/A N/A
Branch Manager, North Kaohsiung Branch Wayne Chuang 21/06/2011 0 0 0 0 0 0 Master of Business Administration ,Southern Illinois University at Carbondale, USA N/A N/A N/A N/A
Branch Manager, Ren’ai Branch Chin-Hsiang Chang 21/06/2011 0 0 0 0 0 0 Dept. of Business Administration, Chung Yuan Christian University N/A N/A N/A N/A
Branch Manager, Tainan Branch Wei-Ming Sun 21/06/2011 0 0 0 0 0 0 Dept. of Accounting, National Taiwan University N/A N/A N/A N/A
Branch Manager, Dongning Branch Yu-Ren Lin 21/06/2011 0 0 0 0 0 0 Dept. of Banking & Insurance , Feng Chia University N/A N/A N/A N/A
Branch Manager, Taichung Branch Rex Wang 21/06/2011 0 0 0 0 0 0 Dept. of Finance, Chaoyang University of Techology N/A N/A N/A N/A
Branch Manager, Jinling Branch Yao-Mo Huang 29/07/2011 0 0 0 0 0 0 Dept. of Finance and Tax Administration, Tamsui Oxford College N/A N/A N/A N/A
Branch Manager, East Neili Branch Chi-Cheng Huang 29/07/2011 0 0 0 0 0 0 Dept. of Accounting and Statistics, National Taipei College of Business N/A N/A N/A N/A
Branch Manager, Xinming Branch Su-Yueh Kang 29/07/2011 0 0 0 0 0 0 Dept. of Accounting, Hsing Wu Junior College of Commerce N/A N/A N/A N/A
Branch Manager, Zhongli Branch Conny Lee 29/07/2011 0 0 0 0 0 0 Dept. of Finance, National Chung Cheng University N/A N/A N/A N/A
Branch Manager, Zhuangjing Branch Jacky Pan 31/08/2011 0 0 0 0 0 0 Dept. of Sociology, Soo Chow University N/A N/A N/A N/A
Branch Manager, Xinyi Branch Roger Liao 31/08/2011 0 0 0 0 0 0 Dept. of Mechanical Engineering, National Chin-Yi University of Technology N/A N/A N/A N/A
Branch Manager, Dayuan Branch Li-Ying Chou 31/08/2011 0 0 0 0 0 0Dept. of Finance and Tax Administration, China Junior College of Industrial and Commercial Management
N/A N/A N/A N/A
Branch Manager, Kaohsiung Branch Ta-Sung Wang 24/10/2011 0 0 0 0 0 0 Master of Business Administration, University of LongIsland, USA N/A N/A N/A N/A
Branch Manager, Shengang Branch Po-Nien Su 02/12/2011 0 0 0 0 0 0 Dept. of International Trade , Tamsui Oxford College N/A N/A N/A N/A
Branch Manager, Wenxin Branch James Chien 02/12/2011 0 0 0 0 0 0 Dept. of Chinese Literature, Cheng Kung University N/A N/A N/A N/A
Branch Manager, Fengyuan Branch Lien-Huang Pan 02/12/2011 0 0 0 0 0 0 Dept. of Applied Business, National Taichung Institute of Technology N/A N/A N/A N/A
Branch Manager, Jinshan Branch Spencer Kuo 02/12/2011 0 0 0 0 0 0 Dept. of Business Administration, Tamkang University N/A N/A N/A N/A
Branch Manager, Tongxiao Branch Dylan Chang 02/12/2011 0 0 0 0 0 0Dept. of Industrial Engineering and Management, National Lien-Ho College of Technology and Commerce
N/A N/A N/A N/A
Branch Manager, Yong’an Branch Daisy Tang 02/12/2011 0 0 0 0 0 0 Master of Business Administration , University of Michigan, USA N/A N/A N/A N/A
Branch Manager, Xinzhuang Mini Branch Joseph Lu 02/12/2011 0 0 0 0 0 0 Dept. of Economics, National Chung Hsing University N/A N/A N/A N/A
Branch Manager, Huanbei Branch Shu-Hsueh Yeh 22/12/2011 0 0 0 0 0 0 Dept of General Business, Daxing Vocational Senior High School N/A N/A N/A N/A
Branch Manager, Banqiao Branch Jeff Chang 31/05/2012 0 0 0 0 0 0 Dept. of Mathematics, Soo Chow University N/A N/A N/A N/A
Branch Manager, Guishan Branch Cindy Wu 31/05/2012 0 0 0 0 0 0 Dept. of Business Administration, Ging Chung Business College N/A N/A N/A N/A
Branch Manager, Xinpu Branch Ben Liu 29/06/2012 0 0 0 0 0 0 Dept of Finance Taxation , Feng Chia University N/A N/A N/A N/A
Branch Manager, Chiayi Branch George Hsu 29/06/2012 0 0 0 0 0 0 Dept of Commerce, Open University N/A N/A N/A N/A
Branch Manager, Zhongshan Branch Derrick Mong 29/06/2012 0 0 0 0 0 0 Master of Business Administration, Centenary College of New Jersey, USA N/A N/A N/A N/A
Branch Manager, Donghai Branch Nick Hung 27/07/2012 0 0 0 0 0 0 Dept. of International Trade, Taichung Jr. College of Commerce N/A N/A N/A N/A
Branch Manager, Sanduo Branch Sonia Lin 27/07/2012 0 0 0 0 0 0 Dept. of Land Management, Feng Chia University N/A N/A N/A N/A
Branch Manager, Jianguo Branch Lolita Lee 29/11/2012 0 0 0 0 0 0 Dept. of Spanish, Providence University N/A N/A N/A N/A
( Continued )
III. Corporate Governance
26
Annual Report
27
Note 1 : Director of Standard Chartered Life Insurance Agency Co, Ltd and Director of Taiwan Standard Chartered Insurance Agency Co, Ltd..Note 2 : Supervisor of Standard Chartered Life Insurance Agency Co, Ltd and Supervisor of Taiwan Standard Chartered Insurance Agency Co, Ltd..Note 3 : Chairman of Standard Chartered Life Insurance Agency Co, Ltd and Chairman of Taiwan Standard Chartered Insurance Agency Co, Ltd..Note 4 : Director of Standard Chartered Life Insurance Agency Co, Ltd and Director of Taiwan Standard Chartered Insurance Agency Co, Ltd..
Title NameDate
appointed
ShareholdingShareholding of spouse & minor
Shareholding in other’s name Education
Also serve concurrently as
Managers are spouse or within second-degree relative of
consanguinity to each other
Shares % Shares % Shares % Title Name Relationship
Branch Manager, Dahu Branch Rita Yang 24/01/2013 0 0 0 0 0 0Dept. of Applied Business, National Open College of Continuing Education Affiliated to National Taichung University of Science and Technology
N/A N/A N/A N/A
Branch Manager, Kuaiji Branch Paul Huang 24/01/2013 0 0 0 0 0 0 Dept. of International Trade, Tamsui Oxford College N/A N/A N/A N/A
Branch Manager, North Hsinchu Branch Mei-Hui Chen 24/01/2013 0 0 0 0 0 0 Dept. of International Trade, Open Jr. College under Taichung College of Commerce N/A N/A N/A N/A
Branch Manager, Zhubei Branch Pin-Nien Chang 24/01/2013 0 0 0 0 0 0 Dept. of Business Administration, National Chung-Hsing University N/A N/A N/A N/A
Branch Manager, Taoyuan Branch Kuang-Jung Fan 24/01/2013 0 0 0 0 0 0 Dept. of Business Administration, Chung Yuan Christian University N/A N/A N/A N/A
Branch Manager, Sanyi Branch Shu-Ching Chiu 24/01/2013 0 0 0 0 0 0 Dept. of Finance, Yu Da College of Business N/A N/A N/A N/A
Branch Manager, Zhonghe Branch Vincent Sun 28/03/2013 0 0 0 0 0 0 Dept. of Accounting, Feng Chia University N/A N/A N/A N/A
Branch Manager, Changhua Branch Ken Liu 31/05/2013 0 0 0 0 0 0 Dept. of Social Work, Soo Chow University N/A N/A N/A N/A
Branch Manager, Dazhi Branch Monica Chen 31/05/2013 0 0 0 0 0 0 Dept. of Industrial Engineering and Management, Taipei Industrial College N/A N/A N/A N/A
Branch Manager, Daya Branch Sunny Kuo 31/05/2013 0 0 0 0 0 0 Dept. of Business Administration, Minghsin Industrial and Commercial Junior College N/A N/A N/A N/A
Branch Manager, Nantun Branch Leo Chang 31/05/2013 0 0 0 0 0 0 Dept. of Finance Management, Chung Hua University N/A N/A N/A N/A
Branch Manager, Beitun Branch Wen-Feng Tu 31/05/2013 0 0 0 0 0 0 Dept. of Banking and Insurance, Shih Chien College of Home Economics N/A N/A N/A N/A
Branch Manager, Luzhou Mini Branch Johnny Lin 31/05/2013 0 0 0 0 0 0Dept. of Electrical Engineering, Tung Fang Junior College of Industrial and Commercial Management
N/A N/A N/A N/A
Branch Manager, Tianmu Branch Kalice Wang 31/05/2013 0 0 0 0 0 0 Master of International Business, Wollongong University, Australia N/A N/A N/A N/A
Branch Manager, Tongluo Branch Tai-Yi Liu 26/07/2013 0 0 0 0 0 0 Dept. of Marketing & Logistics Management, Yu Da College of Business N/A N/A N/A N/A
Branch Manager, Toufen Branch Kuo-Chi Hsu 26/07/2013 0 0 0 0 0 0 General Executive Master's Program of Business Administration, Feng Chia University N/A N/A N/A N/A
Branch Manager, Science Park Branch Kuo-Hsin Hu 26/07/2013 0 0 0 0 0 0 Graduate School of Social Science and Management, National Chung Hsing University N/A N/A N/A N/A
Branch Manager, Bade Branch Jennifer Chiang 26/07/2013 0 0 0 0 0 0 Master of Business Administration, Yuan Ze University N/A N/A N/A N/A
Branch Manager, Daxi Branch Anita Yang 25/09/2013 0 0 0 0 0 0 Le Yu High School N/A N/A N/A N/A
Branch Manager, East Taipei Branch Stanley Tsai 26/09/2013 0 0 0 0 0 0 Master of Business Administration, National Taiwan University N/A N/A N/A N/A
Branch Manager, Dunhua Branch Cindy Liao 26/09/2013 0 0 0 0 0 0 Dept. of Banking and Finance, Tamkang University N/A N/A N/A N/A
Branch Manager, Xihu Branch Mavis Lin 26/09/2013 0 0 0 0 0 0 Dept. of Business Mathematics, Soo Chow University N/A N/A N/A N/A
Branch Manager, No.88 Branch Linda Wu 26/09/2013 0 0 0 0 0 0 EMBA, National Taiwan University N/A N/A N/A N/A
Branch Manager, Jiuru Branch Simon Chuang 24/10/2011 0 0 0 0 0 0 Graduate School of Business Administration, Cheng Kung University N/A N/A N/A N/A
Head, Transaction Banking Yen Yen, Setiawan 01/04/2014 0 0 0 0 0 0 Master of Business Administration, Loyola Marymount University, USA N/A N/A N/A N/A
Head, Wealth Management Cindy Fu 01/04/2014 0 0 0 0 0 0 Arts in Psychology and Economics/ The University of Manitoba Note 4 N/A N/A N/A
III. Corporate Governance
28
Annual Report
29
Title Name
Director’s Remuneration
Total of (A, B,C, D) as a percentage (%) of net
profit after tax
Relevant Remuneration Received by Directors who Are Also EmployeesTotal of (A, B,C,D,
E, F, G) as a percentage (%) of net profit after tax Remuneration
from investment companies other than
subsidiaries
Remuneration(A)Separation pay/
Pension (B)
Remuneration appropriated to directors from
earnings (C)
Costs incurred from performing duties (D)
Salaries, bonus and special allowance (E)
Separation pay/ Pension (F)
Employees’ bonus distributed from earnings (G)
Total No. of shares issued for employee
stock option (H)
Total No. of restricted stock awards (RSA)
obtained
TheBank
All companies included in
consolidated financial
statements
TheBank
All companies included in
consolidated financial
statements
The Bank
All companies included in
consolidated financial
statements
The Bank
All companies included in
consolidated financial
statements
The Bank
All companies included in
consolidated financial
statements
The Bank
All companies included in
consolidated financial
statements
The Bank
All companies included in
consolidated financial
statements
The Bank
All companies included in
consolidated financial statements
The Bank
All companies included in
consolidated financial
statements
The Bank
All companies included in
consolidated financial
statements
The Bank
All companies included in
consolidated financial
statementsCash
dividendStock
dividendCash
dividendStock
dividend
ChairmanStandard Chartered Bank Representative :Katherine King-Suen Tsang
3,623 3,623 0.15% 0.15% 54,110 54,110 2.41% 2.41%
DirectorStandard Chartered Bank Representative :Ajay Chamanlal Kanwal
DirectorStandard Chartered Bank Representative : Cheng Teck Lim
DirectorStandard Chartered Bank Representative : Yen-Ting Chen
DirectorStandard Chartered Bank Representative : Wei-Chih Chen
INEDStandard Chartered Bank Representative : Man-Jung Chan
INEDStandard Chartered Bank Representative : Nei-Ping Yin
INEDStandard Chartered Bank Representative : Teeh-Lin Wang (terminated on 9 Jun 2013)
( III ) Remuneration Paid to Directors, Supervisors and Executive Officers in 2013
1. Directors’ Remuneration and Remuneration Bracket
Note : Only 3 Directors are paid for director’s Remuneration; Only 6 directors who are also employees receive director’s remuneration plus salaries etc.
31
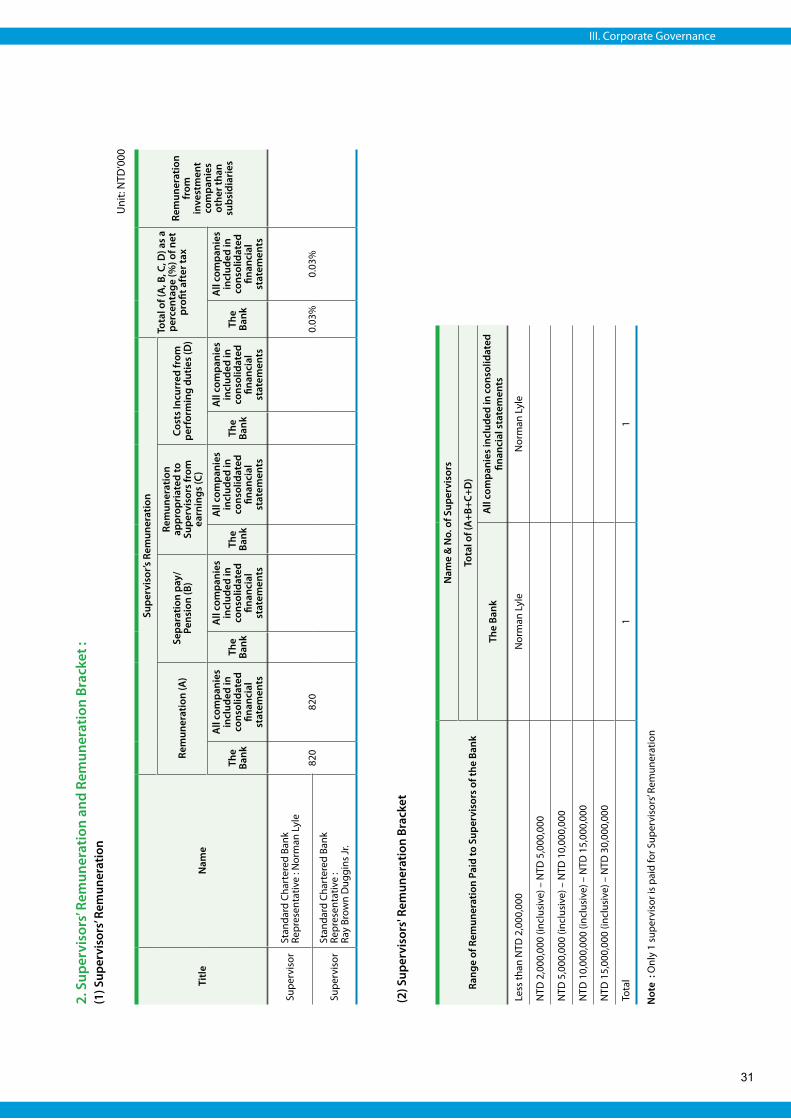
2. S
uper
viso
rs’ R
emun
erat
ion
and
Rem
uner
atio
n Br
acke
t :
(1) S
uper
viso
rs’ R
emun
erat
ion
(2) S
uper
viso
rs' R
emun
erat
ion
Brac
ket
Title
Nam
e
Supe
rvis
or’s
Rem
uner
atio
nTo
tal o
f (A
, B, C
, D) a
s a
perc
enta
ge (%
) of n
et
profi
t aft
er ta
xRe
mun
erat
ion
from
in
vest
men
t co
mpa
nies
ot
her t
han
subs
idia
ries
Rem
uner
atio
n (A
)Se
para
tion
pay/
Pe
nsio
n (B
)
Rem
uner
atio
n ap
prop
riat
ed to
Su
perv
isor
s fr
om
earn
ings
(C)
Cost
s In
curr
ed fr
om
perf
orm
ing
dutie
s (D
)
The
Bank
All
com
pani
es
incl
uded
in
cons
olid
ated
fin
anci
al
stat
emen
ts
The
Bank
All
com
pani
es
incl
uded
in
cons
olid
ated
fin
anci
al
stat
emen
ts
The
Bank
All
com
pani
es
incl
uded
in
cons
olid
ated
fin
anci
al
stat
emen
ts
The
Bank
All
com
pani
es
incl
uded
in
cons
olid
ated
fin
anci
al
stat
emen
ts
The
Bank
All
com
pani
es
incl
uded
in
cons
olid
ated
fin
anci
al
stat
emen
ts
Supe
rvis
orSt
anda
rd C
hart
ered
Ban
k Re
pres
enta
tive
: Nor
man
Lyl
e
820
820
0.03
%0.
03%
Supe
rvis
orSt
anda
rd C
hart
ered
Ban
k Re
pres
enta
tive
: Ra
y Br
own
Dug
gins
Jr.
Rang
e of
Rem
uner
atio
n Pa
id to
Sup
ervi
sors
of t
he B
ank
Nam
e &
No.
of S
uper
viso
rs
Tota
l of (
A+B
+C+D
)
The
Bank
All
com
pani
es in
clud
ed in
con
solid
ated
fin
anci
al s
tate
men
ts
Less
than
NTD
2,0
00,0
00N
orm
an L
yle
Nor
man
Lyl
e
NTD
2,0
00,0
00 (i
nclu
sive
) – N
TD 5
,000
,000
NTD
5,0
00,0
00 (i
nclu
sive
) – N
TD 1
0,00
0,00
0
NTD
10,
000,
000
(incl
usiv
e) –
NTD
15,
000,
000
NTD
15,
000,
000
(incl
usiv
e) –
NTD
30,
000,
000
Tota
l1
1
Not
e :
Onl
y 1
supe
rvis
or is
pai
d fo
r Sup
ervi
sors
’ Rem
uner
atio
n
III. Corporate Governance
Uni
t: N
TD‘0
00
32
Annual Report
33
3. Executive Officers’ Remuneration and Remuneration Bracket(1) Executive Officers’ Remuneration
Title Name
Salary (A) Separation pay / Pension (B)Bonus & Special
Allowance (C)Employees’ Bonus Distributed from Earnings (D)
Total of (A,B,C,D) as a Percentage (%) of Net Profit
after Tax
Total No. of Shares Issued for Employee Stock Option
Total No. of restricted stock awards (RSA) obtained
Remuneration from investment companies other than subsidiariesThe Bank
All companies included in
consolidated financial
statements
The Bank
All companies included in
consolidated financial
statements
The Bank
All companies included in
consolidated financial
statements
The BankAll companies included in
consolidated financial statementsThe Bank
All companies included in
consolidated financial
statements
The Bank
All companies included in
consolidated financial
statements
The Bank
All companies included in
consolidated financial
statements
Cash dividend
Stock dividend
Cash dividend Stock dividend
President & Chief Executive Officer (note 1)
Ajay Chamanlal Kanwal
89,996 89,996 69,679 69,679 6.68% 6.68%
Chief Financial Officer Yen-Ting Chen
Head, Corporate &Institutional Clients
Wai-Choong Hui
Head of Retail Clients Jin Ngee Chia
Head of Corporate Affairs Hope Ong
Head of Financial Markets David Wu
Chief Information Officer (note 2) Yuh-Hwa Chyr
Head of Human Resources Wei-Chih Chen
Head of Legal & Compliance Emma Chang
Chief Risk Officer Qing Xu
Chief Auditor (note 3) Evonne Chen
Head of Retail Clients (note 4) Tiew Siew Chuen
Chief Risk Officer (note 5)Henry Hing Lee Hooi
Unit: NTD‘000
Executive Officers’ expense for driver salary totaled NTD 7,952 (thousand) in 2013.Note 1 : President & Chief Executive Officer, Ajay Chamanlal Kanwal, removed on 31 Mar 2014.Note 2 : Chief Information officer, Yuh-Hwa Chyr, resigned on 28 Jan 2014.Note 3 : Chief Auditor, Evonne Chen, removed on 7 Jan 2014.Note 4 : Title updated based on re-org announced and effective 1 Apr 2014. Head of Retail Clients, Tiew Siew Chuen, removed on 22 December 2013.Note 5 : Chief Risk Officer, Henry Hing Lee Hooi, removed on 1 July 2013.
III. Corporate Governance
34
Annual Report
(V) Remuneration Policy, Procedures and Criteria for Determining Remunerations and their Correlation with Management Performance and Potential Risks
The remuneration policy of the Bank establishes defined salary ranges corresponding to different job grades, in accordance with
the average pay levels in banking industry and the Bank’s compensation capability.
Remuneration for the Bank’s executive officers is composed with two parts, the fixed and variable rewards :
Fixed reward : refers to the base salary and allowance. The fixed reward is determined pursuant to the preceding remuneration
policy of the Bank.
Variable reward : includes cash bonus and stock incentives as a compensation for achieving agreed goals. The variable reward
is distributed to individuals and varies based on the Bank’s management performance, levels of profitability, and annual
performance review of individual executive officers. The Bank also offers Share Scheme (i.e. incentive stock option plan) of
Standard Chartered PLC with deferral mechanism.
(IV) Analysis of Remuneration Paid to Directors, Supervisors, and Executive Officers of the Bank and All Companies in the Consolidated Financial Statements as a Percentage of Net Profit After Tax During the Past Two Years :
2013 2012
Directors 2.41% 2.84%
Supervisors 0.03% 0.03%
Executive Officers 6.68% 6.66%
(2) Executive Officers’ Remuneration Bracket
4. Bonus Distributed to Managers: 【None】
Range of Remuneration Paid to Executive Officers of the Bank
Name & No. of Executive Officers
The BankAll companies included in
consolidated financial statements
Less than NTD 2,000,000 Jin Ngee Chia Jin Ngee Chia
7 meetings were convened by the Board of Directors last year. Attendance of directors in the meetings is specified as follows :
Title NameNo. of
Attendance in Person
No. of Attendance
by Proxy
Actual Attendance
Ratio (%)Remarks
ChairmanStandard Chartered Bank Representative :Katherine King-Suen Tsang
7 0 100%
DirectorStandard Chartered Bank Representative :Ajay Chamanlal Kanwal
7 0 100%
DirectorStandard Chartered Bank Representative :Cheng Teck Lim
6 1 86%
DirectorStandard Chartered Bank Representative :Yen-Ting Chen
7 0 100%
DirectorStandard Chartered Bank Representative :Wei-Chih Chen
7 0 100%
INEDStandard Chartered Bank Representative :Teeh-Lin Wang
2 1 67% Removed on 9 June
INEDStandard Chartered Bank Representative :Nei-Ping Yin
6 1 86%
INEDStandard Chartered Bank Representative :Man-Jung Chan
6 0 100%Took office on 1 March
III. Corporate Governance
36
Annual Report
Other matters to be noted :
1. Matters specified in Article 14.3 of the Securities and Exchange Act, or Board resolutions where independent directors have expressed
objection or qualified opinions that have been noted in the record or declared in writing, please specify the date, term, content of the
motion and all independent directors’ opinions as the Bank’s response : 【None】
2. Avoidance of conflict of interest by directors: Information specifying the Directors’ names, content of the motion, reasons for
avoidance, and participation in the voting is in place.
3. Goals to enhance the function of the Board of Directors (e.g. establishment of the Audit Committee, improvement of information
transparency, etc.) and evaluation of the execution status in the current and most recent years: With the aim to achieve information
transparency, required documentation will be provided to the Board to ensure the directors have sufficient information prior to the
Board meeting. The President also continues to lead the Country Executive Committee members to present business reports of their
respective functions in quarterly main Board meetings and also report on the status of Country economies, political and regulatory
development of the country for the Board’s reference. According to Jin-Guan-Zheng-Fa-Zi No. 10200531121 ruling (31 Dec 2013),
the Bank will add one more independent non-executive director to the Board by the end of the term of current Board of Directors by
December 2015 and establish an audit committee by then.
Term and Session Name Content of Motion Reasons for Avoidance Participation in the Voting
28 March 2013, 13th Term 3rd Session
Nei-Ping Yin The remuneration of the Independent Non-executive Directors
Serve as an Independent Non-executive Director
The related party did not exercise the voting right to the proposal, and the other Directors unanimously resolved that the proposal be approved.
Teeh-Lin Wang The remuneration of the Independent Non-executive Directors
Serve as an Independent Non-executive Director
The related party did not exercise the voting right to the proposal, and the other Directors unanimously resolved that the proposal be approved.
Man-Jung Chan The remuneration of the Independent Non-executive Directors
Serve as an Independent Non-executive Director
The related party did not exercise the voting right to the proposal, and the other Directors unanimously resolved that the proposal be approved.
26 September 2013, 13th Term 7th Session
Katherine King-Suen Tsang
Approval of Related Party Transactions (with Standard Chartered Bank (Hong Kong) Limited)
Concurrently serve as the Chairman of Standard Chartered Bank (Hong Kong) Limited
The related party did not exercise the voting right to the proposal, and the other Directors unanimously resolved that the proposal be approved.
37
(II) Practices of Supervisors Attending the Board of Directors Meetings
7 meetings were convened by the Board of Directors in 2013. Attendance of supervisors in the meetings is specified as
follows :
Other matters to be noted :
1. Composition and responsibilities of the supervisors: (1) Communication with the Bank’s employees and shareholders (e.g. communication channels and methods, etc.) The Bank is wholly owned by our parent company, Standard Chartered Bank. Two supervisors have been appointed by the parent
company of the Bank to monitor the management related matters conducted by the directors and the Executive Committee. The Bank had conducted 2013 Internal Audit Discussion Forum with Directors and Supervisors on 26 September 2013. At the discussion forum, the Internal Audit personnel provided an update on the status of recent regulatory examinations, significant issues from internal audit, and mitigation plans thereof to the Board members and discussed on questions related to the presentation.
(2) Communication with the Chief Auditor and accountants (e.g. communication methods and results pertaining to matters of the Bank’s financial and business conditions)
Supervisors are invited to attend meetings held by the Board of Directors and express their opinions, if appropriate; discuss issues of business operations with senior management of the Bank, especially CFO and Chief Internal Auditor, to ensure full control of the Bank’s business and financial conditions, and hold discussion with accountants over the Bank’s financial statements. Based on Article 19 of "Implementation Rules of Internal Audit and Internal Control System of Financial Holding Companies and Banking Industries", the Bank submitted internal audit reports to the Supervisors twice a month for their review and replied to any questions arising from the reports.
2. Please specify the date, term, content of the motion, resolutions and the Bank’s response to supervisors’ opinions in the event supervisors have expressed opinions at the Board meetings: Please refer to the following items.
1. The 13th Term 7th Session Board Meeting (26 September 2013)Item 3 : President’s ReportSupervisor’s opinions: Supervisor Mr. Norman Lyle queried on the condition of attrition rate of the Bank in 2013.Response : The Head of Human Resources reported that the overall attrition rate for foreign banks in Taiwan was similar to the Bank’s, and the HR team had activated a related program engaging regional business managers across the island to closely monitor the attrition.
2. The 13th Term 8th Session Board Meeting (29 November 2013)Item 3 : President’s ReportSupervisor’s opinions : Supervisor Mr. Norman Lyle queried on the Bank’s confidence level to meet the targeted MCR ratio by 30 June 2014.Response : The CEO replied that the business heads in Taiwan were aware of the importance of the issue and were committed to working together to solve the challenges and finalize a solid plan by March 2014 to lower the mortgage book.Item 7 : Consumer Banking ReportSupervisor’s opinions : Supervisor Mr. Norman Lyle queried on the growth of the SME segment of the Bank.Response : The Acting Head of CB confirmed that the segment had grown through new customer acquisition and the team would recruit more experienced RMs for ME to support its growth.
(III) Compulsory Disclosure in Accordance with Corporate Governance Best-Practice Principles for Banks :
Please refer to the "About Us" information on the Bank’s Chinese website.
Title Name No. of Attendance in Person
Actual Attendance Ratio (%) Remarks
Supervisor Standard Chartered Bank Representative : Norman Lyle 6 86%
Supervisor Standard Chartered Bank Representative : Edward Martin Williams 5 83% Removed on 27
September
Supervisor Standard Chartered Bank Representative : Ray Brown Duggins Jr. 1 100% Took office on 27
September
III. Corporate Governance
38
Annual Report
(IV) Current Status of the Bank’s Corporate Governance Practices and Its Comparison Against the Corporate Governance Best-Practice Principles for Banks
Item Execution Status
Reasons of Discrepancies
Between the Bank’s
Corporate Governance
Practices and the "Corporate
Governance Best-Practice
Principles for Banks"
(I) Shareholdings structure and shareholders’
equity
1. Methodology of handling shareholders’
recommendations or disputes
2. List of the major shareholders of the Bank
and the ultimate controllers of the major
shareholders
3. Establishment of risk control mechanism and
firewalls between the Bank and its affiliated
enterprises
1. The Bank is owned by a sole shareholder -
Standard Chartered Bank.
2. Any recommendation or dispute of the
shareholder is reported to the Board of
Directors for review and consideration.
The Chairman, President and Executive
Committee of the Bank address
shareholder’s recommendations and
disputes with prudence.
3. In terms of transactions with related party,
any credit extension to the stakeholders
and affiliates of the Bank is conducted
pursuant to Articles 32, 33, 33-1 to 33-5 of
the Banking Act and report to the ALCO
committed on monthly basis. Any non-
credit extension is conducted pursuant
to Article 45-1 of the Financial Holding
Company Act.
No discrepancy is found.
(II) Composition and responsibilities of the Board
of Directors
1. Independent directors of the Bank
2. Regular evaluation of Independence of the
CPA
1. Two independent directors, upon expiration
of their term on 9 December 2012, were re-
elected on 10 December 2012 with a term
of 3 years. According to Jin-Guan-Zheng-
Fa-Zi No. 10200531121 ruling (31 Dec 2013),
the Bank will add one more independent
non-executive director to the Board by
the end of the term of current Board of
Directors by December 2015 and establish
an audit committee by then.
2. The Bank has conducted evaluation on the
independence of the CPA.
No discrepancy is found.
(III) Establishment of communication channels
with stakeholders
1. The respective departments are fully
responsible for dealing with stakeholders’
complaints or rights in accordance with
the relevant regulations and the Bona Fide
Principle.
No discrepancy is found.
( Continued )
39
Item Execution Status
Reasons of Discrepancies
Between the Bank’s
Corporate Governance
Practices and the "Corporate
Governance Best-Practice
Principles for Banks"
(IV) Information disclosure
1. Establishment of the Bank’s website where
information regarding financial/business
statements and corporate governance of the
Bank is disclosed.
2. Other disclosure channels of the Bank
(e.g. English website, have designated
personnel to collect and disclose the Bank’s
information, appoint spokesman, publish
investors’ conference on the website)
1. The Bank’s website is set up by responsible
departments including the Group Technology
and Operations, Customer Service and other
related departments for purpose of information
collection and disclosure. The Bank’s President
also serves as the Bank’s spokesman.
2. Same as above.
No discrepancy is found.
(V) Operations of the nomination, remuneration
committees or any other functional
committees established by the Bank
1. There are no nomination or remuneration
committees or any other functional
committees being established by the Bank.
The "Taiwan Governance
Framework of Performance
Evaluation and
Remuneration Structure and
Policy" is approved by the
Bank’s Board, and is comply
with Taiwan’s Company Act
and Corporate Governance
Best-practice Principles
for the banking industry
as well as the Summary
Remuneration Policy
Statement set by the Group’s
Remuneration Committee.
(VI) Any discrepancy between the corporate governance and the "Corporate Governance Best-Practice Principles for Banks". Reasons
for the difference: With regard to the current practice of the Bank’s corporate governance, the Bank is in compliance with the
provisions of the "Corporate Governance Best-Practice Principles for Banks", except for the establishment of Nomination or
Remuneration Committees.
(VII) Other information essential to understand the corporate governance of the Bank (e.g. employee welfare, employee care, investor
relationship, stakeholder rights, training records of directors and supervisors, risk management policies and implementation
of risk measurement criteria, implementation of customers’ policies, liability insurance purchased by the Bank for directors and
supervisors, donations to political parties, stakeholders and charity groups…etc.) :
1. The Bank strives to build a sustainable business as its long-term strategy, with the objective to deliver our corporate culture,
value and management philosophy to stakeholders through sharing of our financial expertise and various concerns on the
environment, minorities and communities.
( Continued )
III. Corporate Governance
40
Annual Report
Item Execution Status
Reasons of Discrepancies
Between the Bank’s
Corporate Governance
Practices and the "Corporate
Governance Best-Practice
Principles for Banks"
2. Directors and supervisors receive notifications regarding the change of corporate governance regulations from time to time;
directors and supervisors are arranged by the Company Secretariat to attend trainings related to corporate governance that are
held by the government or other institutions.
3. The Bank purchases the liability insurance for directors and supervisors on annual basis.
4. Except for the authority required to be exercised by the Board of Directors under the law, the Board of Directors has delegated
its authority, obligation and responsibility to the Executive Committee for their day-to-day management, operation and control
of the Bank’s businesses. The Board of Directors may, during the adjournment of the Board meeting, request the Executive
Committee (chaired by the President) to effectively supervise and review the Bank’s business operations, report the Bank’s
business performance at the Board meetings, and escalate information through adequate reporting procedures to ensure
necessary actions will be taken by the Board of Directors.
5. The Bank’s directors will avoid voluntarily any motions with conflict in benefit of the Bank.
6. The Bank has developed its own "Principles for the Acquisition and Disposal of the Bank’s Assets", "Investment Policy" and
other relevant procedures for compliance by all responsible departments in accordance with the "Regulations Governing the
Acquisition and Disposal of Assets by Public Companies".
7. To control credit risk of the businesses we operate in, the Bank has a sound framework for establishment of various committees.
Such framework is designed to ensure consistent criteria and policies will be followed across the Bank.
8. Any complaints or disputes raised by the Bank’s customers or consumers will be dealt with and followed up by the Customer
Service Center (or Call Center) in accordance with the Customer Service Procedures.
9. Pursuant to Article 16-1, Chapter 3 of the "Corporate Governance Best-Practice Principles for Banks", our donations to political
parties, stakeholders and charity groups required to be disclosed are :
1) EDEN Social Welfare Foundation
2) The Garden of Hope Foundation
3) Buddhist Compassion Relief Tzu Chi Foundation
4) Jinping Elementary School, Hsinchu County
5) ORBIS Taiwan
6) Taipei School for the Visually Impaired
7) National Taichung Special Education School for the Visually Impaired
(VIII) Corporate governance self-assessment report or result of assessment report made by an external professional institution on a
consignment basis, major defects (or recommendations) and improvement :【None】
(V) Organization Structure, Responsibility and Operation of Remuneration Committee Established by the Bank If Any :【None】
41
(VI) Practices of Corporate Social Responsibility :
Systems, measures and practices of the Bank’s social responsibility to environmental protection, community participation, social
contribution, social services, public welfare, consumer rights, human rights, safety and hygiene, and other social responsibility
related activities
Items Practices
I. Implement Corporate Governance
1. Establishment of the corporate social
responsibility policy or system, and the
review of its effectiveness by the Bank
2. Practices of the designated (sideline)
unit promoting corporate social
responsibility of the Bank
3. Business ethics training and education to
the board of directors, supervisors and
employees of the Bank, the combination
of which with the performance review
system, and the set-up of effective
reward & disciplinary system
1. Standard Chartered PLC (the “Group”) is committed to building a sustainable
business over the long term and upholding high standards of corporate
governance, social responsibility, environmental protection and employee
diversity.
2. "Here for good" was launched in 2010 as our new brand promise. It focuses
on building the Bank into a sustainable business, creating shareholder value,
providing customers with comprehensive services, contributing to local
economy, and being positive force in its communities.
3. Three main directions and seven priorities having critical impact on each
geography we operate in have been identified as our sustainability strategy to
exert our influence in maximizing the use and recycling of resources.
(1) Our sustainable business priorities : Contributing to the real economy Promoting sustainable finance Leading the way in communities
(2) Seven priority targets : Protecting the environment Tackling financial crime Responsible selling and marketing Great place to work Community investment Access to comprehensive banking network Sustainable finance
In Standard Chartered, senior managements from the Group, regional and
country levels are responsible for driving sustainable business agendas. A
designated Sustainability Team under the Corporate Affairs Department is in
place for building Standard Chartered Bank into a sustainable business. In Taiwan,
the Sustainability Committee is chaired by the President & Chief Executive Officer
John Tan. Each committee member takes charge of one sustainability agenda:
employee volunteering by Chief Information Officer, Diversity & Inclusion by
Head of Legal & Compliance, Health Safety & Environment by Chief Financial
Officer, Financial Education by Head of HR, Seeing is Believing by Head of Retail
Clients, Junior Golfer Sponsorship by Chief Risk Officer, Financial Times-Standard
Chartered Taiwan Economic Summit by Head of Corporate & Institutional Clients,
Aboriginal Children by Head of Financial Markets while Head of Corporate Affairs
supports all agenda functions.
( Continued )
III. Corporate Governance
42
Annual Report
Items Practices
1. Standard Chartered Group’s success in managing our environmental impact has
been certified by the Leadership in Energy and Environmental Design (LEED)
rating, an equivalent green building rating scheme.
2. We operate in many countries vulnerable to environmental challenges,
including the effects of climate change. Rather than simply continuing current
business practices, we work to inspire and encourage our employees and
customers to minimize their environmental footprint. This strategy is supported
by senior management on our Group EcoNet, our environment coordinators’
network, and implemented through our network of Country Health, Safety,
and Environment (HSE) Committee. This year we continued our drive for more
efficient use of resources in our offices. Our reduction in office paper usage
from 2012 is equivalent to 8,320 trees, our annual water usage saved from
2008 can fill 218 Olympic-size swimming pools, avoided 9345 tons of CO2 from
air travel saved, recycled 14,100 pieces of IT equipment. We were proud to be
included in the Dow Jones Sustainability Index (DJSI) for the fourth consecutive
year and the FTSE 350 Climate Disclosure Leadership Index for the second time.
This recognizes our achievements in managing our use of energy and travel.
3. In 2013, the Bank provided and supported USD 945m to renewable and clean
technology sector, which demonstrates our support for renewable energy
development, ongoing efforts for better environment and being a positive
force for a sustainable earth.
4. In 2013, the Bank has not only continuously adopted several practices to
reduce carbon dioxide emissions and save energy, but also took active part
in the world-renowned environmental protection activities. Employees
were encouraged to reduce CO2 emissions and save energy both at homes
and offices. In total, the Bank has saved at least 850,000 kWh of electricity
throughout the year. These practices include :
(1) Full replacement of traditional lighting with T5 energy-saving fixture for
branch signage;
(2) Gradual replacement of high energy consuming lighting with LED or energy
saving tubes in branches and offices;
(3) Periodical replacement of obsolete air-conditioning in offices and branches
with high energy efficient equipment that meets the world environmental
protection standard;
(4) Limited hours on air-conditioning in main offices for lower energy
consumption after office hours;
(5) Promotion of one-hour light-off campaign during the lunch time of main
offices;
(6) Continuous monitoring on the usage of electricity and water in main offices
and removal of exceptions through understanding of the causes and
deployment of countermeasures proactively;
(7) Support on the world-renowned environmental protection activities: For
the “Earth Hour” and the “World Water Day”, the Bank raised employees’
awareness on environmental protection and encouraged their participation
II. Develop Sustainable Environment
1. Improvement of the utilization rate
for various resources and the use of
renewable materials with minimal
impact on the environment by the Bank
2. Establishment of an adequate
environmental management system
by the Bank based on its industry
characteristics
3. Set-up of the designated environment
management unit or personnel for
environmental protection
4. Strategies for energy saving, emission
reduction and greenhouse gas
mitigation to cope with climate change
which would have business impact to
the Bank
( Continued )
43
Items Practices
III. Safeguard Public Welfare
1. Compliance with labor-related acts,
paying respect to internationally
recognized human rights and
fundamental principles at work,
protection of employees’ legitimate
rights and interests, exercise of
equal treatment in employment and
establishment of adequate management
methods & procedures by the Bank
2. Provision of a safe and healthy workplace
for employees and implementation of
periodical safety and hygiene education
by the Bank
3. Establishment of regular communication
with employees and the adequate
process of notifying changes in
operations that may have major impact
on employees
4. Establishment of the consumer rights
policy with transparent and effective
procedures in place for handling
customer complaints on products and
services of the Bank
5. Collaboration with vendors to reinforce
corporate social responsibility
6. Participation in community
development, charity and public
welfare activities through business
events, physical donations, employee
volunteering services or other free
professional services offered by the Bank
1. Employee rights protection:
The Bank complies with domestic labour laws to guarantee employees’
legitimate rights and interests and ensure a human labour’s freedom of
assembly and association as well as the rights of collective bargaining. We
care about the disadvantaged minority, prohibit to hire child labour and
prevent any kind of forced labour. We committed to ensure equal opportunity
in employment and prohibit the discrimination against any job applicant or
employee on the basis of race, class, language, thought, religion, political party,
place of origin, place of birth, gender, gender orientation, age, marital status,
appearance, facial features, disability, or past membership in any labour union.
All above are fulfilled in details and practices of the bank’s Collective Bargaining
Agreement, HR policies and procedures, as well as Diversity & Inclusion policy.
2. Employee safety and health
(1) Pursuant to local Labor Safety and Health Law and policies of the Group,
employees are provided with safety and health education below:
New joiners are required to receive a three-hour training of labor safety
and health education during the induction course.
All employees shall receive on-the-job training of labor safety and health
education and re-do the three-hour course every three years. The course
completion rate is regularly monitored.
Assist employees in charge of labor safety to obtain related licenses and
provide with business related information.
(2) Pursuant to Labor Health Protection Regulation, employees are provided
with labor health related assistance below:
All employees are regularly implemented the general health check.
Set up nursing room and hire competent nursing personnel to provide
health consultation service to employees.
Set up “Health News” section and update health news to employees.
Invite doctors to hold health seminar for sharing health and hygiene
knowledge/ information with staff.
Set up breastfeeding room for female staff who returned from maternity.
Set up breastfeeding room for female staff who return from maternity.
3 . Establishment of regular communication with employees:
The Bank conducts regular communication with employees through the
following channels:
in those activities; invited branches to turn off signage to support the
events. For the "World Environment Day" themed with "Think, Eat, Save”,
the Bank supported the anti-food waste and reduction of food wastage
footprint campaigns;
(8) Continual adoption of the Victoria Park, Lan-ya Park, and Bei-shr-hu Parki;
(9) On paper saving, the Bank has not only continuously promoted paperless
meetings, improvements on related facilities and rigid measures on copying
process, but also tracked the paper usage in offices on quarterly basis to
remind staff to save paper.
( Continued )
III. Corporate Governance
44
Annual Report
Items Practices
(1) E-newsletter Inside Taiwan: A biweekly, bilingual newsletter to all staff
to communicate information on administrative matters, policies and
procedures, staff benefits, bank-wide events, etc.
(2) Intranet (iConnect): A bilingual intranet site updated every 2-3 days
to communicate information on administrative matters, policies and
procedures, staff benefits, bank-wide events, etc.
(3) CEO Message: A monthly e-mail from the President & CEO to all staff to
communicate business directions and corporate vision.
(4) Department meeting: Regular weekly meetings within business and
support functions to communicate bank-wide affairs, business direction and
strategies, and actions required of staff accordingly.
The Bank keeps employees informed of situations that may have major impact
on the Bank’s operations through the following channels:
(1) E-mail “broadcasts”: Need-based e-mail message sent to all staff to
communicate significant bank-wide information such as financial
performance, senior movement, major incidents and issues, natural disasters
announcement, etc.
(2) Staff "townhall": Irregular meetings held for business and support function
heads to communicate major business direction and strategies through
face-to-face communication.
(3) Department meeting: Irregular meetings within business and support
function department heads to cascade major business direction and
strategies through face-to-face communication with employees.
4 . Consumer rights protection and customer services:
(1) The Bank has its policy and procedure in place to address customer
feedbacks on a timely manner. Also, customer opinions are incorporated
into the product/service design. A 24-hr customer hotline is provided to
ensure customer requirements and disputes are effectively taken care of.
(2) To ensure a smooth customer complaints channel, a customer complaints
hotline is posted on the Bank’s website for reference. In addition, a customer
service email is provided on the website to collect customer feedbacks and
respond consumer disputes. Any customer complaint, whether it is through
telephone, teller counter, letter, fax, media and/or official letter from relevant
regulator, will be addressed in compliance with the Bank’s standard process
for handling customer complaints.
(3) To efficiently process customer complaints, an e-form system is set up
for tracking customer complaints and results. In addition to reply and log
reasons, corrective actions and precautions on system by following the
Customer Complaints SOP, reports of disputable cases are compiled and
analyzed on weekly and monthly basis. Disputes with greater recurrence
rate are monitored of their corrective actions on continuous effort. Where
any inconsiderate service is identified through the customer complaints
channel or satisfactory survey, for instance, a product or process design
fails to meet customer expectation, a customer is not served by our staff
based on standard process, a problem is not adequately addressed and so
( Continued )
45
Items Practices
on, all relevant departments will be informed and corrective actions and
precautions will be carried out immediately to protect customers’ rights and
interests.
5. Collaboration with vendors to carry out corporate social responsibility
Our brand promise “Here for good” fully demonstrates our mission as well as
over 150 years of business model. The Bank is committed to ensure that we
operate with high standards of social, ethical and environmental considerations
in all aspects of our business. As a responsible corporate citizen, we expect our
suppliers uphold consistent standards as we do in aspects of ethics, human
rights, environments, health & safety, labor and environmental protection. The
Bank also has an obligation to ensure that our suppliers promote conservation
or protection of the environment as part of their business operations. To
implement the concept of environmental protection, Standard Chartered Bank
built into the selection process to develop specifications and recommendations
for environmentally friendly products as the preferred specification to review
the efforts made by a supplier on the more environmentally sensitive products
and the implementation of its corporate social responsibility system. The
above has been incorporated as one of the selection criteria of suppliers, so
that sourcing decisions will be made, to the extent practicable, to use a more
environmentally friendly product or service.
6. Participation in relevant events to support communities and charity groups by
ways of business activities, in-kind donations, employee volunteering services
and other free of charge professional services:
(1) Established the Standard Chartered VI Employment Advisory Council to
create jobs for the visually impaired. With the support of NGOs, the Council
has successfully helped 66 visually impaired people find jobs by 2013.
Besides, the Bank contributed NTD 10.8m through the Standard Chartered
Charity Run to support job placement of the visually impaired in Taiwan and
Seeing is Believing, a global programme to prevent avoidable blindness.
(2) Built on the Bank’s core competence and helped the visually impaired
students, elementary school teachers, college and elementary students to
improve their financial management knowledge. To date, 2,034 pupils have
benefitted from the programmes.
(3) Sponsored the cultivation of junior golfers of the Golf Association of ROC to
prepare them for the 2016 Olympic Games in Brazil.
(4) Sponsored the production of the first Taiwan Coastline bio-diversity map
and the Taiwan Coastline Protection website to lay the foundation for
Taiwan coastline watch.
(5) Partnered with the Taiwan AIDS Foundation to provide Living with HIV
refresher training to the employees; 585 employees were trained in 2013.
(6) Each employee is entitled to 3 paid volunteering leave days every year;
employees can devote the 3 days to the social and charitable causes of
their choice. In 2013, the employees contributed 3,809.5 days in voluntary
services.
(Please refer to the more details of Sustainability from page 82 to page 86.)
( Continued )
III. Corporate Governance
46
Annual Report
Items Practices
IV. Reinforce Information Disclosure
1. Methods to disclose critical and reliable
information of the Bank’s corporate
social responsibility
2. Production of the Corporate Social
Responsibility Report for disclosing
the Bank’s best practices on corporate
social responsibility
1. The Group has published its annual Sustainability Report since 2008. In 2010
we were included in the Dow Jones Sustainability World Index (DJSI World).
The DJSI evaluators noted our strong performance in stakeholder engagement,
human capital development, risk and crisis management, financial inclusion
and climate change governance.
2. Since 2010, we have been listed in the FTSE4Good index, which is designed
to measure the performance of companies that meet globally recognized
corporate responsibility standards.
3. Starting from March 2011, the Bank is required to disclose donations to political
parties, stakeholders and charity groups on the Bank’s website in accordance
with Article 16.1, Chapter 3 of the Corporate Governance Best-Practice
Principles for Banks.
V. In the event the Bank has developed its own Corporate Social Responsibility Best Practice Principles pursuant to the Corporate Social Responsibility Best Practice Principles for TWSE/GTSM-Listed Companies, please specify the practices and differences between the two Principles : Not applicable
VI. Other important information that helps to understand the best practices of corporate social responsibility (e.g. any systems, measures and practices pertaining to environmental protection, community participation, social contribution, social services, public welfare, consumer rights, human rights, safety and hygiene and other social responsibility related activities): Please refer to the section of Corporate Social Responsibility from page 82 to page 86.
VII. Please specify, if appropriate, any banking product or Corporate Social Responsibility Report already met the verification criteria of a certification institution :【None】
47
(VII) Information on Ethical Corporate Management and Measures Adopted by the Bank: Implementation of Ethical Corporate Management
Items Practices
I. Establish Ethical Corporate Management Policies and Programs 1. Stipulation of ethical corporate management policies in
internal rules and external documents of the Bank; the
implementation status of such policies actively committed
by the Board of Directors and senior management
2. Establishment of the Bank’s ethical corporate management
programs to forestall unethical conduct ("prevention
progra m"), including procedures, guidelines and trainings
3. When establishing the prevention program, the
preventative measures to be adopted against business
activities within their business scope which may be at
a higher risk of being involved in an unethical conduct,
including offering and acceptance of brides, illegal political
donations, etc.
II. Implement Ethical Corporate Management 1. When engaging in commercial activities, the Bank shall
avoid transactions with any counterparty having records of
unethical conduct, and shall include provisions demanding
ethical corporate management compliance in contracts.
2. Establishment of a dedicated (or sideline) unit for
promotion of the ethical corporate management, and its
monitoring by the Board of Directors
3. Establishment of the conflict of interest policy and
provision of the adequate reporting channel
4. Establishment of effective accounting system and
internal control system for the Bank’s ethical corporate
management; the results of examination conducted by
internal auditors
1. Promulgation of Legal and Compliance Principles and Prevention of Unethical Conduct : All of the Bank’s policies and related procedures to ethical corporate management are approved by the Executive Committee and Board of Directors, followed by enforcement of each policy by its owners and subject to Board of Directors’ review on an annual basis.
2. The Bank has established the "SCBTL Reputational Risk Policy"and "Group Gifts and Entertainment Policy". The relevant training modules, available in the e-Learning system, are mandated to be completed. To avoid the Bank's being exposed to risks, all new joiners are required to attend related training, which covers AML, Anti-Bribery, Reputation Risk and Group Code of Conduct, etc.
3. The Bank has established "Sponsorships and Donations Policy" which defines when the activities can be proceeded. Also the "Anti-Bribery Policy" is available to define and avoid bribery.
1. The Bank has established the "Group Vendor Management Policy" and "Group Personal Account Dealing Policy". In addition, we have set up terms and conditions for ethical conduct in the" Standard Contract-Purchase Contract Non-IT/IT."
2. Avoidance of conflict of interest by directors and supervisors: Where a director or legal representative is the stakeholder of a meeting proposal, and the participation of which may prejudice the Bank’s interest, such person is not permitted to join discussion over such proposal or exercise the voting right, nor can he/she exercise the voting on others’ behalf, however, providing opinion or responding to the proposal is not restricted.
3. The Bank has established the "Group Conflict Of Interest Procedures" to mitigate the occurred/expected/potential conflict of interest.
4. In accordance with the Implementation Rules of Internal Audit and Internal Control System of Financial Holding Companies and Banking Industries, internal audit conducts a general audit and a target audit on its business, finance, asset custodian and information department at least once a year.
The Bank has strict accounting system and related procedures in place for compliance with the "Business Entity Accounting Act", "Regulations Governing the Preparation of Financial Reports by Securities Issuers", "Regulations Governing the Preparation of Financial Statements by Public Banks", IFRSs endorsed by the FSC and the “Sample of Accounting System for Banking Sector” stipulated by the Bankers’ Association. In addition, the Bank’s financial statements are duly audited and certified by our CPA firm in accordance with relevant regulations and generally accepted accounting principles to ensure data accuracy.
( Continued )
III. Corporate Governance
48
Annual Report
Items Practices
(VIII) Corporate Governance Principles and Inquiry of Relevant Regulations
Please visit the website of Market Observation Post System (MOPS) for detailed information of the corporate governance at
http://newmops.twse.com.tw.
(IX) Other Material Information
Please visit the website of Market Observation Post System (MOPS) for other material information published at
http://newmops.twse.com.tw.
III. Establish a channel for receiving reports on unethical conduct, as well as a disciplinary and complaint system to handle violation of the ethical corporate management rules
The Bank has established "Speaking Up Policy" for escalating behaviors in breach. The identify of those who speak up will be kept confidential. "Disciplinary Committee" will be initiated once any staff breach is found. Disciplinary sanction will be made per the discussion of Discipline Committee.
IV. Reinforce Information Disclosure 1. Disclosure of information regarding the enforcement of
the Bank’s ethical corporate management on its website
2. Other methods of disclosure (e.g. set up English
website, assign a designated person to collect corporate
information and disclose on the Bank’s website, etc.)
1. The Bank has official website to disclose information on integrity & ethical operations.
2. The Bank has official website to disclose legally required announcements, including the annual report, important financial information, and financial reports etc.
V. In the event the Bank has developed its own Ethical Corporate Management Best Practice Principles pursuant to the "Ethical Corporate Management Best Practice Principles for TWSE/GTSM-Listed Companies", please specify the practices and differences between the two Principles : Not available. : 【None】
VI. Other important information that helps to understand the best practices of the Bank’s ethical corporate management (e.g. ensure the Bank’s counterparties understand our resolve to implement ethical corporate management and relevant policies,and invite them to join trainings, review/modify the Bank’s ethical corporate management best practices) :
As part of our 'Here for good' brand promise, we are committed to conducting our dealings with suppliers to the highest standards of quality and integrity.
We set out a suppliers charter which includes a number of principles for the behavioral standard that Standard Chartered expects from all its suppliers, and those within a supplier’s sphere of influence that assist them in performing their obligations to us. All references to the suppliers in this Charter therefore include the supplier’s sphere of influence.
One of major principles is that Standard Chartered expects its suppliers to conduct themselves ethically and morally and respect local laws, and strictly prohibits bribery and corruption in any form. Suppliers are encouraged to use our secure Speaking Up web service to report all suspected cases, actual breaches or concealment of any forbidden acts.
49
(X) Implementation of Internal Control System
1. Statement of Internal Controls
Internal Control System Statement to Financial Supervisory Commission
17 March 2014
On behalf of Standard Chartered Bank (Taiwan) Limited (the “Company”), we hereby certify that, for the fiscal year of 2013, the
Company had duly complied with the “Implementation Rules of Internal Audit and Internal Control System of Financial Holding
Companies and Banking Industries”. In 2013, we have in place an internal control system, implemented risk management
measures, and have an independent audit department undertake audits and report the results to the board of directors and
supervisors regularly.
With respect to the securities business, the Company has conducted an evaluation of the effectiveness of the design and
implementation of its internal control system in accordance with the criteria described in the “Regulations Governing the
Establishment of Internal Control Systems by Service Enterprises in Securities and Futures Markets”, promulgated by the Securities
and Futures Bureau of Financial Supervisory Commission.
After prudent evaluation, the Company confirms that, except for the items listed in attachment, its various units had implemented
effective internal control and compliance systems during the year. This statement will be included in the main content of the
Company’s annual report and prospectus, which would be published. Any falsehood, concealment, or other irregularities in the
aforementioned statement will be dealt with in accordance with the legal responsibilities stipulated in article 20, article 32, article
171, and article 174 of the Securities and Exchange Act.
Statement by
Chairman: ( Signature )
President: ( Signature )
Chief Internal Auditor: ( Signature )
Head of Compliance: ( Signature )
Standard Chartered Bank (Taiwan) Limited
III. Corporate Governance
50
Annual Report
Standard Chartered Bank (Taiwan) LimitedIssues and Corrective Actions for Internal Control System
As of 31 December 2013
Issues for Improvement Corrective Actions Target Completion Date
The Financial Supervisory Commission (“FSC”) conducted a target examination of the Company’s offshore outsourcing vendor, Scope International (M) Sdn Bhd in 2012. At the end of examination, the Company was not able to provide all the requested information or fully explain the overall controls imposed on the outsourced vendor. In addition, the Company’s supervision of the offshore outsourced vendor was inadequate. Hence, in 2013, FSC ruled that the Company had breached Article 45-1, Paragraph 1 and 3 of Article 45-1 of the Banking Act, as well as Subparagraph 4, Paragraph 1 of Article 129-1 and Paragraph 7 of Article 129 of the Banking Act. A monetary sanction (fine) of NTD2m each, NTD4m in total, was therefore imposed.The aforesaid weaknesses were also categorised as major findings in the relevant examination report. The Company had responded, in writing to FSC, with improvement actions and progress of these actions.(FSC Letter No. 10250002660 dated 26 September 2013)
1. To review and strengthen the preparation procedures for offshore audits;
2. To enhance the supervision over the offshore outsourced vendors by tightening the Company’s outsourcing policies and procedures;
3. To include checks on the outsourced vendor’s information security management and protection over the Company’s customer data in the Company’s self assessment;
4. To revise the contract addendum with the outsourced vendor by adding terms to cover guarantee of outsourced service quality and compensation for losses, and to review the quality of the service provided by the vendor;
5. To review all user accounts of the outsourced vendor within the Company’s operation environment and their access to the Company’s customer data;
6. To establish a review plan based on the risk level of the vendor;
7. To have an external auditor conduct due diligence checks on the outsourced vendor and track findings and improvement status in monthly review meetings.
Completed.
The Company changed the use of Non-Business Operation Office and the area of Branch without obtaining the regulator’s approval. Hence, FSC ruled a reprimand to be imposed in accordance with Paragraph 1, Article 61-1 of the Banking Act.(FSC Letter No. 10200025370 dated 29 April 2013)
1. To conduct a thorough check of all branches and non-Business Operation Offices and obtain FSC’s approval for any non-compliance observed;
2. To establish the “Operational Guidelines for Establishing, Closing and Relocation of Standard Chartered Bank Branches and Non-Business Operation Offices” and to include such operation in the regulatory compliance self assessment.
Completed.
FSC ruled that the data leakage incident involving telesales had affected the sound operation of the Company; hence a reprimand was imposed in accordance with Paragraph 1, Article 61-1 of the Banking Act.(FSC Letter No. 10200306831 dated 11 December 2013)
1. To dismiss the involved staff in accordance with the Company’s disciplinary policies and procedures;
2. To educate sales staff (including telesales & sales managers) about the importance of the Personal Information Protection Act and to emphasise the importance of regulatory compliance;
3. To enhance relevant controls, such as adding surveillance cameras, locking printers to control access to fax-in applications, and restricting data access rights in relevant systems.
Completed.
( Continued )
51
Issues for Improvement Corrective Actions Target Completion Date
The Company’s offshore outsourced vendor, Scope International (M) Sdn Bhd, did not maintain a complete audit trail of privilege IDs nor managed privilege IDs in the Privilege Identity Management (“PIM”) system, indicating inadequate management of privilege IDs.
1. To enhance the controls over privilege IDs and passwords: Going forward, password of privilege IDs need to be reset under dual control after every use. Privilege IDs will also be controlled by PIM system after the system upgrade is completed at the end of May 2014.
2. To enhance the review control on privilege IDs of the outsourced vendor and evaluate the execution in monthly review meetings;
3. To request the outsourced vendor to enhance checks on audit trails and to include checks in its self assessment, which the Company will review when performing due diligence checks.
1. Targeted to be completed by the end of May 2014.
2. Completed.3. Completed.
The Company’s employees, who were assigned to work at its subsidiary, were found to continue working for the Company at the same time, which was not in line with relevant regulations.
1. The subsidiary to revise its Delegation of Authority to provide a clear guideline on the delegation of authority.
2. The subsidiary to revise its Bylaws to specify restrictions on holding dual positions with the Company and its subsidiary.
3. The Company to revise its Employee Handbook to add rules concerning serving positions in the Company’s subsidiary.
4. Employee training to be held to strengthen employees’ compliance awareness.
Completed.
Before the Company entered the Consultation and Service Agreements with the Group, there was no item-by-item assessment to understand the necessity and cost efficiency of such services, and no detail on how services would be charged and process of fee recognition.
1. To establish internal guidelines for business units to follow in the event of signing a new Group agreement;
2. To establish internal guidelines on the settlement of operation advisory service fees;
3. To request business units to evaluate the necessity and reasonableness of royalty with supporting evidence before entering new or amended royalty agreements.
Targeted to be completed by July 2014.
The Group has established a Teamsite for its affiliates to share information. However, the Company has not established guidelines on internal approval, control, and audit over the setup of shared sites and data access.
1. To define a Teamsite management procedure;2. To establish a review control on the setup of
shared sites and data access, to generate the access list for shared sites, and to have the site administrators to perform the access review twice a year;
3. To set up appropriate access right for Legal, Risk and Internal Audit functions for control and audit purpose, whenever required.
Completed.
( Continued )
III. Corporate Governance
52
Annual Report
Issues for Improvement Corrective Actions Target Completion Date
The Company has not established a proper guideline for the avoidance of conflict of interests and for the tender process of the disposal of real estate. In addition, inadequate management was observed during tender waiting period, tender evaluation, and background checks on brokers and buyers, which resulted in suspected cover bidding.
1. To revise and rename the existing “Real Estate Management Guidelines” to “Operational Guidelines of Real Estate Acquisition and Divestment of Standard Chartered Bank Taiwan”.
2. To conduct a documentation review of all disposed transactions since the integration of Hsinchu International Bank (“HIB”): no other suspected cover bidding was found;
3. To suspend all business interactions with the involved brokers and to issue legal letters requesting them to reimburse the full amount of agency fee and related loss;
4. To conduct internal investigation and accountability review.
Completed.
Instances of incorrect data were found in the Company’s regulatory reporting of Offshore Banking Unit (“OBU”) business, which was not in line with the limit requirement stipulated in the relevant regulations.
1. To conduct a full-scope clean up check and verification;
2. To review and establish controls on the calculation of limit as well as investigation and review of fund flow and to set an alert model for better control;
3. To have Internal Audit conduct a target audit to confirm the completion of the corrective actions.
Completed.
53
2. CPA’s Special Audit Report on the Bank’s Internal Controls
Independent Auditors' Report on Internal Control
The Board of Directors
Standard Chartered Bank (Taiwan) Limited:
According to Article 28 of the Implementation Rules of Internal Audit and Internal Control System of Financial Holding
Companies and Banking Industries (the Rules) issued by the Financial Supervisory Commission (FSC), Republic of China (ROC), in
addition to having its annual financial statements audited and certified by an independent auditor, a bank should also engage
the auditor to examine its internal control systems and to express an opinion on the accuracy of and internal control over its
financial reporting, the status of its compliance with applicable laws and regulations, and the appropriateness of its policy on the
recording of bad debt provision.
We have been engaged by Standard Chartered Bank (Taiwan) Limited to conduct the aforementioned examination and have
summarized the examination scope, procedures, and conclusions in the attachment to this report in accordance with Article 31
of the Rules.
The report is intended solely for the information and use of the Board of Directors and the management of Standard Chartered
Bank (Taiwan) Limited and the Banking Bureau of FSC, Executive Yuan, ROC, and is not intended to be and should not be used by
anyone other than these specified parties.
KPMG
March 26, 2014
III. Corporate Governance
54
Annual Report
(XI) Penalty Received for Unlawful Practices Over the Past Two Years, and Corrective Actions Taken Against Major Defects
Disclosure Case & Amount
1. Indictment by prosecutors against the person in charge or employees because of a crime committed on duty
1. An ex-employee kept pre-signed transaction documents and manipulated customer accounts, which was a breach of the relevant regulations. The Bank filed a criminal claim against said ex-employee and the Taipei District Prosecutors Office indicted said ex-employee in December 2013.
2. An ex-employee conducted unauthorized fund transfers, which was a breach of the Bank’s internal policy and procedure. The Bank filed a criminal claim against said ex-employee. The Taipei District Prosecutors Office indicted said ex-employee in February 2013, and the Taipei District Court rendered a guilty judgment in October 2013. The ex-employee appealed to the High Court.
3. The Bank’s ex-employees in telesales illegally collected and used customers’ personal data with the intention to make profit. The Bank filed a criminal claim against said ex-employees. The Taipei District Prosecutors Office indicted said ex-employees in March 2014.
2. Penalty fine imposed by Financial Supervisory Commission (FSC) due to violation of the laws and regulations
1. The Bank’s staff has been found to keep pre-signed transaction documents and phone-banking token, and manipulated customer accounts. This points to defects in the implementation of internal control, and is non-compliant with Paragraph 1, Article 45-1 of the Banking Act. On the basis of Item 7, Article 129 of the same Act, Financial Supervisory Commission ("FSC") imposes an administrative fine of NT$4 million against the Bank. In addition, pursuant to Item 3, Paragraph 1, Article 61-1 of the same Act, FSC required the Bank to terminate the non-compliant staff. (29 Feb 2012)
2. The internal control and audit systems for the Bank’s personal loan business have not been soundly established or thoroughly implemented, which is non-compliant with Paragraph 1, Article 45-1 of the Banking Act. On the basis of Item 7, Article 129 of the same Act, FSC imposes an administrative fine of NT$6 million against the Bank. In addition, pursuant to Item 5, Paragraph 1, Article 61-1 of the same Act, FSC further imposes restrictions on the Bank’s personal loan business. (21 Aug 2012)
3. The Bank’s staff took advantage of the loopholes in credit card processing and defrauded the Bank’s funds. This points to the unsoundness in the establishment and implementation of the Bank’s internal control and audit systems, the ineffectiveness of the internal control checks, the Bank’s failure to sufficiently and comprehensively understand the full picture of the fraud case, and the Bank’s inability to identify weaknesses in the internal control system. The Bank is found non-compliant with Paragraph 1, Article 45-1 of the Banking Act. On the basis of Item 7, Article 129 of the same Act, FSC imposed an administrative fine of NT$5 million against the Bank. In addition, pursuant to Item 3, Paragraph 1, Article 61 of the same Act, FSC required the Bank to terminate the non-compliant staff. (26 Feb 2013)
4. The Bank’s has outsourced certain IT operations to SCB Group’s IT center in Malaysia, and is found to have lax supervision and management over the outsourcing vendor. This is non-compliant with Paragraph 1, Article 45 and Paragraphs 1 & 3, Article 45-1 of the Banking Act. The Bank is fined NTD$2 million for each non-compliance, for a total of NTD$4 million, on the basis of Item 4, Paragraph 1, Article 129-1, and Item 7, Article 129 of the Banking Act. (26 Sep 2013)
( Continued )
55
Disclosure Case & Amount
3. Penalty imposed by FSC due to violation of
Article 61-1 of the Banking Act
1. The Bank’s staff has been found to keep pre-signed transaction documents
and phone-banking token, and manipulated customer accounts. FSC
required the Bank to terminate the non-compliant staff on the basis of Item 3,
Paragraph 1, Article 61-1 of the Banking Act. (29 Feb 2012)
2. For operational defects arising from certain mortgages underwritten by the
Bank, FSC issues a reprimand letter against the Bank on the basis of Item 3,
Paragraph 1, Article 61-1 of the Banking Act. (10 August 2012)
3. FSC imposed restrictions on Bank’s personal loan business on the basis of
Article 61-1 of the Banking Act. (21 Aug 2012)
4. The Bank is found to have established, removed, and relocated branches and
non-business operating premises without obtaining regulatory approval
in advance. FSC issued a reprimand letter against the Bank on the basis of
Paragraph 1, Article 61-1 of the Banking Act. (29 Apr 2013)
5. The Bank’s telesales staff leaked customer data, which impedes sound banking
operations. FSC issued a reprimand letter against the Bank on the basis of
Paragraph 1, Article 61-1 of the Banking Act. (11 Dec 2013)
4. Any material frauds or contingencies (fraud,
theft, misappropriation and robbery of
assets, false transaction, forged documents
and marketable securities, kickbacks, natural
disaster loss, loss from external factors, hacker
attack, data theft, and disclosure of confidential
information and customer data and such major
incidents) or security accidents resulting from
the failure to abide by security instructions of
financial institutions, or the incidents which
resulted in loss over NTD 50 million, individually
or totally, in the respective year
None
5. Other matters required to be disclosed by FSC None
III. Corporate Governance
56
Annual Report
(XII) Major Resolutions Made in Shareholders’ Meetings, Board Meetings and Provisional Board Meetings
Date Type of Meeting Major Resolution Execution Status
24/01/2013 Monthly Meeting of Board of Directors
1. Approval of appointment of board of director.2. Approval of amendment to delegation of authorities
of the Bank.3. Approval of adjustment to the sale prices of
properties.
1. Executed as per resolution2. Executed as per resolution3. Executed as per resolution
28/03/2013 Quarterly Meeting of Board of Directors
1. Approval of 2012 annual financial statements, business reports and profit allocation statement of the Bank.
2. Approval of appointment and removal of senior executive officer.
3. Approval of remuneration of the Independent Non-Executive Directors. (In lieu of a general shareholders’ meeting.)
1. Executed as per resolution2. Executed as per resolution3. Executed as per resolution
31/05/2013 Quarterly Meeting of Board of Directors/ Shareholder Meeting
1. Approval of removal of board of director.2. Approval of 2012 annual report.3. Approval of 2012 annual financial statements,
business reports and profit allocation statement of the Bank.
4. Approval of amendment to the Governing Procedures for the Board of Directors Meetings of the Bank.
1. Executed as per resolution2. Executed as per resolution3. Executed as per resolution4. Executed as per resolution
26/07/2013 Monthly Meeting of Board of Directors
1. Approval of Authorisation Guidelines for Licensed Foreign Exchange Banks Engaging in Recommendation of Foreign Exchange Related Structured Products and Relevant Administrative Matters.
2. Approval of Taiwan Governance Framework of Performance Evaluation and Remuneration Structure and Policy of the Bank.
1. Executed as per resolution2. Executed as per resolution
29/08/2013 Monthly Meeting of Board of Directors
1. Approval of 2013 first semi-annual audited standalone and consolidated financial statements of the Bank.
2. Approval of application for senior note issuance.3. Approval of service agreement between the Bank
and SCB Indonesia.4. Approval of amendment to delegation of authorities
of the Bank.5. Approval of remuneration of the Supervisors. (In lieu
of a general shareholders’ meeting.)
1. Executed as per resolution2. Executed as per resolution3. Executed as per resolution4. Executed as per resolution5. Executed as per resolution
26/09/2013 Quarterly Meeting of Board of Directors
1. Approval of amendment to the Rules and Procedures for Loans and Non-Credit Transactions with Related Parties for SCBTL and Its Subsidiaries.
2. Approval of related party transaction between the Bank and SCB (Hong Kong) Ltd.
3. Approval of appointment and removal of board of director.
1. Executed as per resolution2. Executed as per resolution3. Executed as per resolution
( Continued )
57
(XIII) Disagreement Record or Written Statement of the Directors or Supervisors against the Important Resolutions Made by the Board Meetings :【None】
(XIV) Information on Persons Related to the Financial Statements Who Resigned or Were Discharged :
Date Type of Meeting Major Resolution Execution Status
29/11/2013 Quarterly Meeting of Board of Directors
1. Approval of 2014 annual budget of the Bank.2. Reviewed the Five Year Strategy from 2013 to 2017 of
the Bank.3. Approval of domestic bank required information for
the supervisory review process over capital adequacy package.
4. Approval of Taiwan Fixed Network contract.5. Approval of senior executive officer appointment and
removal.6. Approval of appointment and removal of the Chief
Internal Auditor.7. The 2014 renewal of the Directors’ & Officers’ Liability
Insurance be noted.8. The 2014 Board meeting schedule be noted.
1. Executed as per resolution2. Executed as per resolution3. Executed as per resolution4. Executed as per resolution5. Executed as per resolution6. Executed as per resolution7. Executed as per resolution8. Executed as per resolution
09/01/2014 Special Meeting of Board of Directors
1. Approval of appointment of senior executive officer. 1. Executed as per resolution
21/01/2014 Monthly Meeting of Board of Directors
1. Approval of related party transaction of senior note issuance.
2. Approval of outsourcing activities with related parties.
1. Executed as per resolution2. Executed as per resolution
26/03/2014 Quarterly Meeting of Board of Directors
1. Approval of appointment of board of director.2. Approval of 2014 final budget of the Bank.3. Approval of 2013 annual financial statements,
business reports and profit allocation statement of the Bank.
4. Approval of reorganisation of the business and organisation structure of the Bank.
5. Approval of appointment of senior executive officer.6. Election of the new Chairman of the Bank.
1. Executed as per resolution2. Executed as per resolution3. Executed as per resolution4. Executed as per resolution5. Executed as per resolution6. Executed as per resolution
Title Name Date appointed Date resigned Reason
Chief Risk Officer Henry Hing Lee Hooi 2009.09.01 2013.06.30 Removed
Head of Consumer Banking Tiew Siew Chuen 2012.06.26 2013.12.22 Removed
Chief Information Officer Yuh-Hwa Chyr 2010.10.01 2014.01.28 Resigned
(II) Non-audit fees paid to CPAs, the firm to which the CPAs belong and its affiliate(s) exceed 25% of the annual auditing fee :【Yes】
Name of CPA Firm Name of CPA Audit Period Remark
KPMG Ming-Zhi Wang Lin Wu Fiscal Year 2013
CPA Charge Bracket Audit Fee Non-audit Fee Total
1 Less than 2,000,000
2 2,000,000 (inclusive) - 4,000,000
3 4,000,000 (inclusive) - 6,000,000 5,402
4 6,000,000 (inclusive) - 8,000,000
5 8,000,000 (inclusive) - 10,000,000
6 Over 10,000,000 (inclusive) 14,989 20,391
Unit: NTD‘000
Name of CPA Firm
Name of CPA Audit Fee
Non-audit Fee
Audit Period RemarkSystem Design
Business Registration
Human Resources
Others Sub-total
KPMGMing-Zhi Wang Lin Wu
14,989 5,402 5,40201/01/2013– 31/12/2013
Internal control: $3.458Tax: $1,344CAR: $600
59
(III) Change of CPA firm and the audit fee for the year of change is less than that charged for the previous year :【None】
(IV) Auditing fee is 15% less or more below the fee charged for the previous year :【None】
V. Information on Change of CPA
(I) Information on the Former and Succeeding CPAs : 【None】
(II) Written response from the former CPAs in accordance with Articles 10.5.1 and 10.5.2.3 of the Regulations Governing Information to be Published in the Annual Reports of Banks :
【None】
VI. Name, title, and service period of the Bank’s Chairman, President or Executive Officer(s) in charge of financial and accounting affairs who has served a position in an independent auditing firm to which the CPAs belong or its affiliate(s) during the past year :【None】
VII. Change in the equity (shareholding, share transfer and pledge) of directors, supervisors and executive officers who are required to declare their equity in accordance with Article 25.3 of the Securities and Exchange Act:【None】
Note : The Bank is a subsidiary of Standard Chartered Bank. The directors, supervisors and executive officers are appointed as legal
representatives by the Bank’s parent company.
VIII. Information on Top 10 shareholders among which are related parties, spouses, or relatives within 2nd degree relationship :【None】
III. Corporate Governance
Annual Report
60
IX. The shares and consolidated shareholding ratios of the same investees held by the Bank, the Bank’s directors, supervisors, executive officers, branch managers, and the entities under the Bank’s direct or indirect control :
Name of Investee Company
The Bank’s Investment
Investment by Directors, Supervisors, Executive Officers, Branch Managers and the Entities Directly or Indirectly Controlled by the Bank
Comprehensive Investment
SharesShareholding
RatioShares
Shareholding Ratio
SharesShareholding
Ratio
Standard Chartered Life Insurance Agency Co., Ltd.
300,000 100.00% 300,000 100.00%
Taiwan Standard Chartered InsuranceAgency Co .,Ltd.
Par Value NTD 10 As of 31 December 2013(III) Distribution of Equity Holdings
Classification of Shareholding Number of Shareholders Number of Shares Shareholding (%)
Over 1,000,001 1 2,910,571,976 100
Total 1 2,910,571,976 100
Note : Standard Chartered Bank holds 100% shares of Standard Chartered Bank (Taiwan) Limited. It is the only shareholder.
63
(V) Market Price, Net Worth, Earnings, Dividends Per Share, and the Relevant Information over the Past Two Years : The Bank was delisted on 18 January 2007.
(VI) Dividend Policy and Enforcement :
Refer to the Dividend Policy in "Financial Highlights" on page 149.
(VII) Impact of Stock Dividends on Business Performance and EPS :【None】
(VIII) Employees’ Bonus and Remuneration to Directors and Supervisors 1. The ratio or range of employees’ bonus and remuneration to directors and supervisors as set forth in the Bank’s Articles
of Association: Refer to the Dividend Policy in "Financial Highlights" on page 149.
2. Proposal for the distribution of employees’ bonus resolved by the Board of Directors :【None】
3. Earnings in the previous year allocated to employees’ bonus and remuneration to directors and supervisors: Refer to
the Dividend Policy in "Financial Highlights" on page 149.
(IX) Share Buyback History :【None】
SharesName of Major Shareholders Shares Shareholding (%)
Standard Chartered Bank (100% shareholding) 2,910,571,976 100
(IV) List of Major ShareholdersAs of 31 December 2013
IV. Fund Raising
64
Annual Report
II. Issuance of Financial Debentures
Type of Financial Debenture 1st Issue (Term) of Financial Debenture in 2009
2nd Issue (Term) of Financial Debenture in 2009 (Private Placement)
3rd Issue (Term) of Financial Debenture in 2009 (Private Placement)
Date of Approval & Approval Document No.
Jin-Guan-Yin-Waizi-09800417430
Jin-Guan-Yin-Waizi-09800417430
Jin-Guan-Yin-Waizi-09800417430
Date of Issuance 28/10/2009 11/12/2009 11/12/2009
Par Value NTD 100,000 USD 1,000 USD 1,000
Location of Issuance and Trading
Taiwan, R.O.C Taiwan, R.O.C Taiwan, R.O.C
Currency New Taiwan Dollar US Dollar US Dollar
Issue Price 100 100 100
Total Amount 10,000,000 (thousand) 150,000 (thousand) 150,000 (thousand)
Interest Rate Annual rate is 2.9% for the first 5 years and 3.4% for the last 5 years
Floating rateUSD 3M LIBOR +3.33% from the issue date to 11 Jun 2015USD 3M LIBOR +4.33% after 11 Jun 2015
Floating rateUSD 3M LIBOR +3.33% from the issue date to 11 Jun 2015USD 3M LIBOR +4.33% after 11 Jun 2015
Upon expiration of 5 years after the issue date of the debentures, where the computed CAR after redemption meets the minimum regulatory requirement, and that the competent authority has given its consent, the Bank may redeem the debentures prior to maturity.
Starting from 11 Jun 2015, where the computed CAR after redemption meets the minimum regulatory requirement, and that the competent authority has given its consent, the Bank may redeem the debentures prior to maturity.
Starting from 11 Jun 2015, where the computed CAR after redemption meets the minimum regulatory requirement, and that the competent authority has given its consent, the Bank may redeem the debentures prior to maturity.
Terms and Conditions of Conversion and Exchange
N/A N/A Note 1 N/A Note 1
Restriction Clause
N/A
In the event the Bank’s CAR is less than the minimum regulatory requirement as a result of making interest payment, such payment may be deferred and no interest will be accrued on the deferred portion.
In the event the Bank’s CAR is less than the minimum regulatory requirement as a result of making interest payment, such payment may be deferred and no interest will be accrued on the deferred portion.
Capital Utilization To support medium and long term funding needs
To support medium and long term funding needs
To support medium and long term funding needs
Amount of Declared Issuance plus Previous Outstanding Balance as Percentage of Audited Net Worth of the Previous Fiscal Year (%)
93.76% 93.67% 93.67%
Whether Accounted for Equity Capital and Type of Capital
Yes, Tier II Yes, Tier II Yes, Tier II
Name of Credit Rating Agency, Date and Credit Rating
Fitch Ratings, AA(twn), 27 Oct 2009
N/A N/A
IV. Fund Raising
Note 1 : Where the Bank’s CAR is lower than the minimum regulatory requirement or the accumulated loss is greater than the sum of retained earnings and share premium, the interest and principal repayment shall be deferred and the repayment seniority of debenture holder(s) shall be the same as the shareholder(s) of perpetual cumulative preferred stocks in case of settlement and liquidation by the Bank.
66
Annual Report
Type
of F
inan
cial
D
eben
ture
1st F
inan
cial
Deb
entu
re in
201
1
A Is
sue
B Is
sue
C Is
sue
D Is
sue
E Is
sue
F Is
sue
G Is
sue
H Is
sue
I Iss
ue
Dat
e of
App
rova
l &
App
rova
l Doc
umen
t N
o.
Jin-
Gua
n-Yi
n-W
aizi
-100
0012
2100
Dat
e of
Issu
ance
19/0
5/20
11
Par V
alue
N
TD 1
,000
,000
Loca
tion
of Is
suan
ce
and
Trad
ing
Taiw
an, R
.O.C
Curr
ency
New
Tai
wan
Dol
lar
Issu
e Pr
ice
100
Tota
l Am
ount
800,
000
(tho
usan
d)10
0,00
0(t
hous
and)
650,
000
(tho
usan
d)6,
150,
000
(tho
usan
d)1,
000,
000
(tho
usan
d)2,
550,
000
(tho
usan
d)3,
700,
000
(tho
usan
d)40
0,00
0 (t
hous
and)
4,00
0,00
0 (t
hous
and)
Inte
rest
Rat
eFi
xed
rate
:1.
03%
Fixe
d ra
te:
1.17
%Fi
xed
rate
:1.
32%
Fixe
d ra
te:
1.45
%Fi
xed
rate
:1.
51%
Fixe
d ra
te:
1.60
%
Floa
ting
rate
:90
day
s CP
ra
te
Floa
ting
rate
:90
day
s CP
ra
te
Floa
ting
rate
:90
day
s CP
ra
te
Mat
urit
y2
year
s (m
atur
es o
n 19
May
, 201
3)
3 ye
ars
(mat
ures
on
19 M
ay, 2
014)
4 ye
ars
(mat
ures
on
19 M
ay, 2
015)
5 ye
ars
(mat
ures
on
19 M
ay, 2
016)
6 ye
ars
(mat
ures
on
19 M
ay, 2
017)
7 ye
ars
(mat
ures
on
19 M
ay, 2
018)
2 ye
ars
(mat
ures
on
19 M
ay, 2
013)
5 ye
ars
(mat
ures
on
19 M
ay, 2
016)
7 ye
ars
(mat
ures
on
19 M
ay, 2
018)
Seni
orit
yPr
imar
y - L
ien
Gua
rant
orN
/A
Trus
tee
N/A
Und
erw
rite
rIn
stitu
tions
with
fina
ncia
l adv
isor
y lic
ense
: SCB
Tai
pei B
ranc
h, Y
uant
a Se
curit
ies,
Mas
terli
nk S
ecur
ities
, Meg
a Se
curit
ies,
Pola
ris S
ecur
ities
Cert
ifyin
g A
ttor
ney
Bake
r & M
cKen
zie
Att
orne
y: Z
hi L
iang
, Hao
-Rui
Hu
Cert
ifyin
g A
ccou
ntan
tN
/A
Cert
ifyin
g Fi
nanc
ial
Inst
itutio
nN
/A
( Con
tinue
d )
67
Repa
ymen
t Met
hod
Inte
rest
pai
d qu
arte
rly, a
nd fu
ll pa
ymen
t on
prin
cipa
l upo
n m
atur
ity
Bala
nce
Out
stan
ding
0 (t
hous
and)
100,
000
(tho
usan
d)65
0,00
0(t
hous
and)
6,15
0,00
0(t
hous
and)
1,00
0,00
0(t
hous
and)
2,55
0,00
0 (t
hous
and)
0 (t
hous
and)
400,
000
(tho
usan
d)4,
000,
000
(tho
usan
d)
Paid
-in C
apita
l in
Prev
ious
Yea
r29
,105
,720
(tho
usan
d)
Aud
ited
Net
Wor
th in
Pr
evio
us Y
ear
38,2
89,7
88 (t
hous
and)
Repa
ymen
t Sta
tus
Nor
mal
Term
s of
Red
empt
ion
or E
arly
Rep
aym
ent
N/A
Term
s an
d Co
nditi
ons
of C
onve
rsio
n an
d Ex
chan
ge
N/A
Rest
rict
ion
Clau
seN
/A
Capi
tal U
tiliz
atio
n To
sup
port
med
ium
and
long
term
fund
ing
need
s an
d to
man
age
the
liqui
dity
ratio
s un
der B
asel
III g
uide
line
Am
ount
of D
ecla
red
Issu
ance
plu
s Pr
evio
us
Out
stan
ding
Bal
ance
as
Perc
enta
ge o
f Aud
ited
Net
Wor
th o
f the
Pr
evio
us F
isca
l Yea
r (%
)
121.
69%
Whe
ther
Acc
ount
ed fo
r Eq
uity
Cap
ital a
nd T
ype
of C
apita
lN
o
Nam
e of
Cre
dit R
atin
g A
genc
y, D
ate
and
Cred
it Ra
ting
Fitc
h Ra
tings
, AA
A(t
wn)
, 19
May
201
1
IV. Fund Raising
68
Annual Report
Type
of F
inan
cial
Deb
entu
re2nd
Fin
anci
al D
eben
ture
in 2
011
3rd F
inan
cial
Deb
entu
re in
201
14th
Fin
anci
al D
eben
ture
in 2
011
A Is
sue
B Is
sue
C Is
sue
A Is
sue
B Is
sue
C Is
sue
D Is
sue
Dat
e of
App
rova
l & A
ppro
val
Doc
umen
t No.
Ji
n-G
uan-
Yin-
Wai
zi-1
0000
1221
00Ji
n-G
uan-
Yin-
Wai
zi-1
0000
1221
00Ji
n-G
uan-
Yin-
Wai
zi-1
0000
1221
00
Dat
e of
Issu
ance
08/0
6/20
1123
/06/
2011
29/0
6/20
11
Par V
alue
N
TD 1
,000
,000
NTD
1,0
00,0
00N
TD 1
,000
,000
Loca
tion
of Is
suan
ce a
nd
Trad
ing
Taiw
an, R
.O.C
Taiw
an, R
.O.C
Taiw
an, R
.O.C
Curr
ency
New
Tai
wan
Dol
lar
New
Tai
wan
Dol
lar
New
Tai
wan
Dol
lar
Issu
e Pr
ice
100
100
100
Tota
l Am
ount
500,
000
(tho
usan
d)95
0,00
0 (t
hous
and)
700,
000
(tho
usan
d)1,
100,
000
(tho
usan
d)2,
000,
000
(tho
usan
d)40
0,00
0 (t
hous
and)
1,00
0,00
0 (t
hous
and)
2,00
0,00
0 (t
hous
and)
Inte
rest
Rat
e
Fixe
d ra
te:
1.45
1%Fi
xed
rate
:1.
04%
Floa
ting
rate
:90
day
s CP
ra
te
Fixe
d ra
te:
1.40
%Fi
xed
rate
:1.
32%
Floa
ting
rate
:90
day
s CP
ra
te+
0.15
%
Floa
ting
rate
:90
day
s CP
ra
te+
0.15
%
Floa
ting
rate
:90
day
s CP
ra
te+
0.15
%
Mat
urit
y
5 ye
ars
(mat
ures
on
8 Ju
n. 2
016)
2 ye
ars
(mat
ures
on
23 Ju
n 20
13)
2 ye
ars
(mat
ures
on
23 Ju
n 20
13)
5 ye
ars
and
3 m
onth
s (m
atur
es o
n 23
Sep
201
6)
3 ye
ars
(mat
ures
on
29 Ju
n 20
14)
2 ye
ars
(mat
ures
on
29 Ju
n 20
13)
3 ye
ars
(mat
ures
on
29 Ju
n 20
14)
10 y
ears
(m
atur
es o
n 29
Jun
2021
)
Seni
orit
yPr
imar
y- L
ien
Prim
ary-
Lie
nPr
imar
y-Li
en
Gua
rant
orN
/AN
/AN
/A
Trus
tee
N/A
N/A
N/A
Und
erw
rite
rIn
stitu
tions
with
fina
ncia
l ad
viso
ry li
cens
e: M
ega
Secu
ritie
s
Inst
itutio
ns w
ith fi
nanc
ial a
dvis
ory
licen
se: S
CB
Taip
ei B
ranc
h, Y
uant
a Se
curit
ies,
Mas
terli
nk
Secu
ritie
s
Inst
itutio
ns w
ith fi
nanc
ial a
dvis
ory
licen
se: S
CB T
aipe
i Bra
nch,
Yu
anta
Sec
uriti
es, M
aste
rlink
Sec
uriti
es
Cert
ifyin
g A
ttor
ney
Bake
r & M
cKen
zie
Att
orne
y: Z
hi
Lian
g, H
ao-R
ui H
uBa
ker &
McK
enzi
e A
ttor
ney:
Zhi
Lia
ng, H
ao-
Rui H
uBa
ker &
McK
enzi
e A
ttor
ney:
Zhi
Lia
ng, H
ao-R
ui H
u
Cert
ifyin
g A
ccou
ntan
tN
/AN
/AN
/A
Cert
ifyin
g Fi
nanc
ial
Inst
itutio
nN
/AN
/AN
/A
( Con
tinue
d )
69
Repa
ymen
t Met
hod
Inte
rest
pai
d qu
arte
rly, a
nd fu
ll pa
ymen
t on
prin
cipa
l upo
n m
atur
ity
Inte
rest
pai
d qu
arte
rly, a
nd fu
ll pa
ymen
t on
prin
cipa
l upo
n m
atur
ityIn
tere
st p
aid
quar
terly
, and
full
paym
ent o
n pr
inci
pal u
pon
mat
urity
Bala
nce
Out
stan
ding
500,
000
(tho
usan
d)0 (t
hous
and)
0 (tho
usan
d)1,
100,
000
(tho
usan
d)2,
000,
000
(tho
usan
d)0 (t
hous
and)
1,00
0,00
0 (t
hous
and)
2,00
0,00
0 (t
hous
and)
Paid
-in C
apita
l in
Prev
ious
Ye
ar29
,105
,720
(tho
usan
d)29
,105
,720
(tho
usan
d)29
,105
,720
(tho
usan
d)
Aud
ited
Net
Wor
th in
Pr
evio
us Y
ear
38,2
89,7
88 (t
hous
and)
38,2
89,7
88 (t
hous
and)
38,2
89,7
88 (t
hous
and)
Repa
ymen
t Sta
tus
Nor
mal
Nor
mal
Nor
mal
Term
s of
Red
empt
ion
or
Earl
y Re
paym
ent
N/A
N/A
N/A
Term
s an
d Co
nditi
ons
of
Conv
ersi
on a
nd E
xcha
nge
N/A
N/A
N/A
Rest
rict
ion
Clau
seN
/AN
/AN
/A
Capi
tal U
tiliz
atio
n
To s
uppo
rt m
ediu
m a
nd lo
ng
term
fund
ing
need
s an
d to
m
anag
e th
e liq
uidi
ty ra
tios
unde
r Bas
el II
I gui
delin
e
To s
uppo
rt m
ediu
m a
nd lo
ng te
rm fu
ndin
g ne
eds
and
to m
anag
e th
e liq
uidi
ty ra
tios
unde
r Bas
el II
I gui
delin
e
To s
uppo
rt m
ediu
m a
nd lo
ng te
rm fu
ndin
g ne
eds
and
to
man
age
the
liqui
dity
ratio
s un
der B
asel
III g
uide
line
Am
ount
of D
ecla
red
Issu
ance
plu
s Pr
evio
us
Out
stan
ding
Bal
ance
as
Perc
enta
ge o
f Aud
ited
Net
W
orth
of t
he P
revi
ous
Fisc
al
Year
(%)
121.
74%
121.
74%
121.
74%
Whe
ther
Acc
ount
ed fo
r Eq
uity
Cap
ital a
nd T
ype
of
Capi
tal
No
No
No
Nam
e of
Cre
dit R
atin
g A
genc
y, D
ate
and
Cred
it Ra
ting
Fitc
h Ra
tings
, AA
A(t
wn)
, 8 Ju
n 20
11Fi
tch
Ratin
gs, A
AA
(tw
n), 2
3 Ju
n 20
11Fi
tch
Ratin
gs, A
AA
(tw
n), 2
9 Ju
n 20
11
IV. Fund Raising
70
Annual Report
( Con
tinue
d )
Type
of F
inan
cial
Deb
entu
re1st
Fin
anci
al D
eben
ture
in 2
012
2nd F
inan
cial
Deb
entu
re in
201
2A
Issu
eB
Issu
eC
Issu
e
Dat
e of
App
rova
l & A
ppro
val
Doc
umen
t No.
Ji
n-G
uan-
Yin-
Wai
zi-1
0004
0560
0Ji
n-G
uan-
Yin-
Wai
zi-1
0004
0560
0
Dat
e of
Issu
ance
17/0
1/20
1224
/05/
2012
Par V
alue
N
TD 1
,000
,000
NTD
1,0
00,0
00
Loca
tion
of Is
suan
ce a
nd T
radi
ngTa
iwan
, R.O
.CTa
iwan
, R.O
.C
Curr
ency
New
Tai
wan
Dol
lar
New
Tai
wan
Dol
lar
Issu
e Pr
ice
100
100
Tota
l Am
ount
7,00
0,00
0 (t
hous
and)
700,
000
(tho
usan
d)60
0,00
0 (t
hous
and)
6,70
0,00
0 (t
hous
and)
Inte
rest
Rat
eFi
xed
Rate
1.0
5%Fl
oatin
g Ra
te :
90
days
CP
rate
+
0. 2
5%
Fixe
d Ra
te1.
09%
Fixe
d Ra
te1.
05%
Mat
urit
y2
year
s, m
atur
es o
n 17
Ja
n 20
142
year
s, m
atur
es o
n 17
Ja
n 20
143
year
s, m
atur
es o
n 17
Ja
n 20
152
year
s, m
atur
es o
n 24
May
201
4
Seni
orit
yPr
imar
y- L
ien
Prim
ary-
Lie
n
Gua
rant
orN
/AN
/A
Trus
tee
N/A
N/A
Und
erw
rite
rIn
stitu
tions
with
fina
ncia
l adv
isor
y lic
ense
: Yua
nta
Secu
ritie
s, G
rand
Cat
hy
Secu
ritie
s, SC
B Ta
ipei
Bra
nch
In
stitu
tions
with
fina
ncia
l adv
isor
y lic
ense
: Yua
nta
Secu
ritie
s, KG
I Sec
uriti
es, S
CB T
aipe
i Bra
nch
Cert
ifyin
g A
ttor
ney
Bake
r & M
cKen
zie
Att
orne
y: Z
hi L
iang
, Hao
-Rui
Hu
Bake
r & M
cKen
zie
Att
orne
y: Z
hi L
iang
, Hao
-Rui
Hu
Cert
ifyin
g A
ccou
ntan
tN
/AN
/A
Cert
ifyin
g Fi
nanc
ial I
nstit
utio
nN
/AN
/A
Repa
ymen
t Met
hod
Inte
rest
pai
d qu
arte
rly, a
nd fu
ll pa
ymen
t on
prin
cipa
l upo
n m
atur
ityIn
tere
st p
aid
quar
terly
, and
full
paym
ent o
n pr
inci
pal u
pon
mat
urity
Bala
nce
Out
stan
ding
7,00
0,00
0 (t
hous
and)
700,
000
(tho
usan
d)60
0,00
0 (t
hous
and)
6,70
0,00
0 (t
hous
and)
Paid
-in C
apita
l in
Prev
ious
Yea
r29
,105
,720
(tho
usan
d)29
,105
,720
(tho
usan
d)
Aud
ited
Net
Wor
th in
Pre
viou
s Yea
r45
,236
,038
(tho
usan
d)45
,236
,038
(tho
usan
d)
Repa
ymen
t Sta
tus
Nor
mal
Nor
mal
71
IV. Fund Raising
Term
s of
Red
empt
ion
or E
arly
Re
paym
ent
N/A
N/A
Term
s an
d Co
nditi
ons
of C
onve
rsio
n an
d Ex
chan
ge
N/A
N/A
Rest
rict
ion
Clau
seN
/AN
/A
Capi
tal U
tiliz
atio
n To
sup
port
med
ium
and
long
term
fund
ing
need
s an
d to
man
age
the
liqui
dity
ratio
s un
der B
asel
III g
uide
line
To s
uppo
rt m
ediu
m a
nd lo
ng te
rm fu
ndin
g ne
eds
and
to
man
age
the
liqui
dity
ratio
s un
der B
asel
III g
uide
line
Am
ount
of d
ecla
red
issu
ance
plu
s pr
evio
us o
utst
andi
ng b
alan
ce a
s pe
rcen
tage
of a
udite
d ne
t wor
th o
f th
e pr
evio
us fi
scal
yea
r (%
)
136.
77%
136.
95%
Whe
ther
acc
ount
ed fo
r equ
ity
capi
tal a
nd ty
pe o
f cap
ital
No
No
Nam
e of
cre
dit r
atin
g ag
ency
, dat
e an
d cr
edit
ratin
gFi
tch
Ratin
g, A
AA
(tw
n), 1
6 Se
p 20
11Fi
tch
Ratin
g, A
AA
(tw
n), 1
6 Se
p 20
11
Annual Report
72
III. Preferred Stocks, Overseas Depository Receipts, Employee Stock Options, Restricted Stock Awards, and Acquisitions or Assignment Involving Other Financial Institutions :【None】
IV. Capital Utilization Plan and Execution Status
(I) Capital Utilization Plan
Capital is utilized to enhance the Bank’s medium and long term funding stability and to meet liquidity requirements under Basel III
guideline.
(II) Execution Status of the Capital Utilization Plan
1. The purpose was to fulfill the liquidity gaps arising from time deposits, which were matured without rollover; the remains
were to support our lending business growth.
2. The Bank’s medium and long-term loans and capital adequacy ratios:
31 December 2013 31 December 2012 31 December 2011
Medium and Long Term Loan 278,401,627
(thousand)
290,833,891
(thousand)
306,230,461
(thousand)
Increase / (Decrease)(12,432,264)
(thousand)
(15,396,570)
(thousand)
(1,861,676)
(thousand)
Capital Adequacy Ratio 13.61% 16.01% 16.54%
Increase / (Decrease) (2.40)% (0.53)% 2.35%
73
CEO met with Direct Banking staff
Operations OverviewV
74
Annual Report
Unit : NTD‘000
I. Scope of Business
(I) Primary Business of Respective Business Division
1. Corporate & Institutional Clients Corporate & Institutional Clients provides corporate and institutional clients with trade finance, cash management, securities
services, foreign exchange and risk management, capital raising and corporate finance solutions.
2. Commercial Clients The Commercial Clients segment mainly targets at serving corporate clients, particularly those clients with trade finance or
international cash management needs. The professional financial services we provide include short-term loans for working
capital, mid-term or long-term financing, import and export trade financing, supply chain financing, cash management,
foreign exchange services and corporate internet banking, etc.
3. Retail Clients In charge of developing a long-term sustainable customer-focused strategy and building a high performance culture through
robust execution of plans. Promote and develop products in line with the customer value propositions of retail clients
Proficiency Test for Stock Affair Personnel 18 18 18
Business Personnel for Foreign Currency Non-investment Type Insurance Products
1,035 805 1,006
Examination on Investment Trust and Consulting Regulations (including Self-disciplinary Rules)
775 812 761
Financial Markets and Professional Ethics Examination 1,140 1,291 1,128
Qualification Certificate for Trust Business Professionals – Business Personnel
1,455 1,602 1,435
Qualification Certificate for Trust Business Professionals - Managerial Personnel
392 441 389
Property Insurance Representative 160 174 157
81
(II) Employee Education and Training
Year 2013 2012
Total No. of Learners 12,993 15,695
Total Training Hours 10,284 13,752
Total Training Sessions 1,296 1,303
Total Training Days 1,286 1,719
V. Operations Overview
82
Annual Report
To materialize our brand promise through our behaviours, Standard Chartered
revised our sustainability model to encompass 3 pillars: Contributing to
sustainable economic growth, Being a responsible company, and Investing in
communities.
Contributing to sustainable economic growth is about how we support our
clients and customers through our core business of banking
Being a responsible company is about how we manage our business and
operations to deliver long-term value for our shareholders and society.
Investing in communities is about how we work with our local communities to
promote social and economic development.
The Bank deeply believes that emphasizing only on revenues and profits will not lead to sustainability for industry of any kind;
only by fulfilling social responsibilities, building up credibility among customers, encouraging employees’ community service
participation, and solidifying employee engagement could it truly attain the win-win objectives for its employees, for the society,
and for itself. That is the reason we are proactively devoted to various charity programs in Taiwan concurrent to our business
expansion.
Our significant achievements of sustainability through investing in communities in 2013 :
The Bank was the title sponsor of the 2013 Taipei Standard Chartered Charity Run in June. Through the race, the Bank
contributed NTD 10.8 million (including the Group’s match) to support the visually impaired employment project. In addition,
the Standard Chartered Group matched the contribution dollar-by-dollar to support the Seeing is Believing global project to
tackle avoidable blindness. There were 154 pairs of visually impaired runners signed up for the run which made this event to
have the largest participation of visually impaired people.
Starting May 2013, the Bank has invited Chunghwa Telecom, Jardines Group, Fubon Culture and Education Foundation, Audi
Automobile Taiwan, and HP Taiwan to form the Standard Chartered Visually Impaired Corporate Advisory Council to provide
III. Corporate Responsibilities and Ethics
Our Commitment — Here for goodHere for good was globally launched in 2010 as Standard Chartered PLC’s new brand promise. Based on our solid business performance, we will leverage our history, heritage, success, and culture to largely enhance the public’s understanding of the Bank in our key markets and other areas and further boost our business growth.
Here for good incorporates the Bank’s past, present, and future. It is a deep commitment to the markets where we are: We are here for the long run, applying our knowledge and experience to create profits for our customers and clients. We are here for progress and committed to upholding the highest standards and doing the right things.
Being a Responsible
Company
Contributing to Sustainable
Economic Growth
Investing in
Communities
Here for good
83
employment support for the visually impaired. Supported by four NGOs that include the Parents' Association for the Visually
Impaired, Institute for the Blind of Taiwan, Eden Social Welfare Foundation, and Technology Development Association for
the Disabled, the project is a successful demonstration of the joint efforts among public and private sectors as well as the
nonprofits to support job placements of the visually impaired. The project has successfully placed 66 visually impaired workers
into jobs since inception in 2013.
The Bank initiated Junior Golfer Sponsorship with Golf Association of ROC in 2013 to prepare them for the 2016 Olympic Games
in Brazil.
To demonstrate leveraging the Bank’s core competence in community services, the Bank initiated the Standard Chartered
Financial Education Academy to promote financial education targeting at the elementary school teachers and students as well
as college students. In the 4-month long pilot program, 39 visually impaired people, 72 college students, 21 elementary school
teachers, and 2,034 pupils were impacted by this program.
In an attempt to enhance our quality of customer service and live up to our corporate social responsibility, Consumer Banking
designated its 8-minute service pledge program to support activities related to the visually impaired.
The Bank sponsored the Taiwan Coastline Protection Project by the Taiwan Environment Information Association and created
the very first coastline bio-diversity map of Taiwan, a Taiwan coastline watch website, and a research paper. The objective was
to raise the general public’s awareness on the protection of Taiwan’s coastline through public education.
Employee volunteering has been embedded in the Bank’s culture. In 2013, we have contributed 3,809.5 days of employee
volunteering service in the local communities through servicing the senior citizens and the disadvantaged, environmental
protection and financial education.
Awards in 2013
Awarded "Benchmark Enterprise of Digital Services" by Business Next Magazine in June 2013. The award demonstrates the
recognition of Standard Chartered’s customer services on eBanking and its brand promise "Here for good".
Awarded Excellence of Best Multinational Company in the Best Consumer’s Financial Brand Award jointly organized by Wealth
Magazine and PwC in December 2013.
Received certification of Elderly-Friendly Bank by the Hsinchu City Govemment
Received "Exemplary Organization of Collective Bargaining Agreement (CBA)" in 2012 by the Council of Labour Affairs,
Executive Yuan
Recognized as an Outstanding Park Sponsor by the Taipei City Government
Awarded the Green Sustainability Awards by the Himalaya Association for Nature and Culture Preservation. We were the only
Bank that received such recognition in 2013.
The Bank received recognitions from the Ministry of Education as well as the Taipei School for the Visually Impaired for over 100
audio books that the Bank produced and donated to all the libraries, schools, and resource centers for the visually impaired
during 2009-2012.
"Seeing is Believing"— Global campaign to tackle preventable blindness
Initiated in 2003, "Seeing is Believing" is Standard Chartered PLC’s global initiative on tackling preventable blindness, and also
the most unique, long-committed sustainability agenda by Standard Chartered PLC. We partnered with the International Agency
V. Operations Overview
84
Annual Report
for the Prevention of Blindness (IAPB) to conduct eye care, vision correction, and professional training for the medical staff in
developing countries. To date, Standard Chartered has raised USD 63 million across all markets.
In September 2011, Standard Chartered announced at the Clinton Global Initiative (CGI) in New York about our new commitment
in Seeing is Believing. Standard Chartered extended its commitment to a total of USD 100 million to tackle preventable blindness
in Asia, Africa, and the Middle East. This new target is three times the amount raised since "Seeing is Believing" launched in 2003.
It is a solid promise that Standard Chartered is committing to the social and economic development in developing countries.
The Bank also participated in the global fundraising campaign through organizing the 101 step-up races, around-the-island
cycling, and charity runs. Since 2009, the Bank has donated an accumulated amount of over NTD 30 million (half donation and
half Group match) to help the people in developing countries to tackle preventable blindness and restore eye sight.
In addition, the Bank encouraged the visually impaired people to embrace life by organizing different sports activities such as 101
step-up race, surfing, road run, 3-legged race, etc. We have also organized the Reading for Love campaign for 4 consecutive years
to encourage the visually impaired students to read while working with the NGOs to produce and distribute 127 audio books
to enrich the reading resources for the visually impaired and received recognitions by the Ministry of Education and the Taipei
School for the visually impaired in 2013.
Devoted to tackling preventable blindness around the world for 10 years, the Bank initiated the Visually Impaired Corporate
Advisory Council and invited Chunghwa Telecom, Jardines Group, Fubon Culture and Education Foundation, Audi Automobile
Taiwan, and HP Taiwan to support job placement of the visually impaired in May 2013. The goal was to integrate corporate,
government, and NGO resources to create jobs for the visually impaired. Supported by the Taipei Parents' Association for the
Visually Impaired, Institute for the Blind of Taiwan, Eden Social Welfare Foundation, and Technology Development Association for
the Disabled, the Corporate Advisory Council had successfully supported 66 visually impaired workers into jobs.
To further support the VI employment project, the Bank contributed NTD 10.8 million (including the Group’s match) through
the 2013 Taipei Standard Chartered Charity Run in June to help create jobs for the VI in Taiwan while the Group matched the
contribution dollar-by-dollar to tackle avoidable blindness in developing countries. Nearly 1,800 employees participated in the
run or volunteered as guide runners. This is also the run event that attracted the largest VI runner participation in Taiwan, a total
of 154 pairs of VI runners and guide runners participated. There were also booths by various NGO partners as well as games to
allow the participants to experience the darkness and enhance their awareness about the visually impaired.
Protecting the environment
Through a bank-wide volunteering project volunteering project, the Bank called for 1,600 employee volunteers to plant
over 3,000 trees. The amount of carbon reduced as a result of the tree planted equated to over 5,000 tons, thus the Bank was
awarded the Green Sustainability Award by the Himalaya Natural Culture Preservation Foundation. We were the only Bank that
received the honor in 2013.
Preserving the coastline biology of Taiwan: The Bank sponsored the Taiwan Coastline Protection Project by the Taiwan
Environment Information Association since 2012. The Association spent a year to conduct field researches, literature studies,
and coral reef checks, visited 338 coastline locations, and documented the latest status of the coastline of Taiwan. Then
85
selected 9 remaining natural locations out of the 148 km long coastline and enlist them as the neediest of preservation. The
project also created the very first coastline bio-diversity map of Taiwan, a Taiwan coastline watch website, and a research paper.
The objective was to raise the general public’s awareness on the protection and preservation of Taiwan’s coastline and marine
biology through public education. The map was sent to over 2,000 public schools as a teaching supplement. The 9 natural
coastline locations that are in desperate need of preservation was also announced through a press conference; the 9 locations
are in Taoyuan, Miaoli, Changhua, Tainan, Hualien-Taitung, Pingtung, and Yilan.
Replacing the lights of branch signs into T5 energy-saving lights: The Bank completed the light replacement in mid 2013 into
energy-saving lights, an estimated saving of 74,450 units can be expected.
Actively respond to World Earth Day and Water Day: On World Earth Day, the Bank shut off all branch signs for one hour at
night and encouraged the employees to go light-off for an hour at home as well.
Standard Chartered Financial Education Academy pilot program
To demonstrate leveraging the Bank’s core competence in community services, the Bank initiated the Standard Chartered
Financial Education Academy to promote financial education targeting at the elementary school teachers and students as well
as college students. In the 4-month long pilot program, 39 visually impaired people, 71 college students, 39 elementary school
teachers, and 2,034 pupils were impacted by this program. The program is expected to be scaled up in 2014.
Financial Education camps for the visually impaired: 4 sessions were held in 2013 in which the original module was adjusted
to allow the visually impaired students to learn through their ears and fingers, plus the one-on-one tutoring, the sessions were
proven to be a branch new yet essential to the visually impaired.
The impact of the Standard Chartered Financial Education Academy was demonstrated through the following ways:
1. Elementary school teachers workshops
The program aimed to enhance the elementary school teachers’ comprehension of financial knowledge and help them
deliver better quality financial education in class.
2. Elementary student outing to Standard Chartered’s simulation branch
127 students from 6 classes were invited to enjoy a fun day of outing by learning about money management, risks, what a
bank does and what ATMs do through games and visitation to our simulation branch.
3. College student train-the-trainer workshops
College students were trained to be seed trainers of the Bank’s financial education camps for elementary school students. In
the process, the college students also enhanced their personal financial management skills and event management while
fulfilling academic credits for community services.
4. Elementary school students holiday camps
Financial education holiday camps were organized by the college students for elementary school students on the weekends.
Youth Programs
Junior Golfer Sponsorship: To cultivate athletic talents for the future, the Bank began a 4-year sponsorship program by the Golf
Association of ROC. The program aimed to support the junior golfers and prepare them for the 2016 summer Olympic Games
in Brazil. The intention was to enhance the junior golfers’ mental maturity and stability through participating in competitions
against more senior and elite golfers, so that they can better cope with the crowd, the media, and the tension in the official
Olympic game.
V. Operations Overview
86
Annual Report
Standard Chartered Tayal Holy Land Expedition: In May, 11 Standard Chartered employees formed the Standard Chartered
Tayal Holy Land Expedition and accompanied the students of Jinping and Taoshan elementary schools to climb up the Tayal tribal
holy land in Mt. Dabajian to receive their commencement with the blessings of the tribal elders.
Employee Volunteering
Volunteerism is deeply embedded in the Standard Chartered corporate culture. Each employee is entitled to 3 days of
volunteering leave every year. In 2013, the Bank's employees contributed 3,809.5 days of volunteer services in the community.
Health Ambassadors
The Bank’s Seeing is Believing and Living with HIV programs have benefitted many people around the world. Although the Bank
provides regular health checks, doctor’s onsite consultations, and mental health counselling, caring for employee health is never
too much. In 2013, the Bank trained a group of employee volunteers called Health Ambassadors to watch over employees’ health
in close range to help watch over the physical and mental health of employees.
The Health Ambassadors were trained to support LwHIV employee refresher training; they were also oriented on eye-care and
hepatitis prevention. In 2014, they will learn more about cardiovascular disease. 542 employees received LwHIV refresher training
with help of the Health Ambassadors.
2013 Taiwan Lantern Festival in Hsinchu
193 employees in the Hsinchu area signed up for volunteering at the 2013 Hsinchu Lantern Festival to provide necessary
services to the 12 million patrons of the lantern festival. In 3 weeks, the employee volunteers leveraged their customer service
skills to serve the festival patrons, not only were our employees being high appraised by the City government, this is also a true
manifestation of the Bank’s brand promise Here for good.
Caring for the elderly
The Consumer Banking and Wholesale Banking Dept. have worked with the Huashan Foundation for several years consecutively
by collecting unified invoices, street parade to raise funds for the Foundation. In 2013, nearly 200 employees accompanied the
senior citizens who live alone to celebrate the Moon Festival by singing karaoke and having lunch together. Employees also
auctioned their hand-made jewellery and pastries to raise funds for the Foundation.
Protecting the environment
Environment protection is also a popular theme for employee volunteering. For example, the Finance Department has provided
cleaning services to a public park in Hsinchu 3 times a year for many years already. The Bank’s Corporate Real Estate Service has
also helped the Parent’s Association for the Visually Impaired by clean and fix their environment and appliances, handle their
mailing and packaging.
87
IV. Information Technology (I) Maintenance and Deployment of Hardware and Software for Major IT Systems :
CLX: HP Non-stop Server NB54004 whilst the operating system is a Non-stop kernel J06.15.
(II) Future Development or Procurement Plan :
The teller systems will be migrated into an integrated platform within 1 ~ 2 years
(III) Emergency Support and Security Protection Measures :
1. In the event of an accident leading to injury or death of an employee, the System Document Recovery Unit is responsible
for allocating resources to deal with the preservation of evidence, liaise with the insurance company, cooperate with
insurance investigations and handle insurance claims.
2. Where the injury or death of an employee results in litigation, the System Document Recovery Unit shall allocate resources
to coordinate with Legal and Compliance to deal with settlement or legal proceedings.
3. Construction of a new premise or premise for remote operation: Emergency Telecommunication Repair Unit is responsible
for dealing with suppliers, acquiring backup items, and handling the procurement of hardware, software and tangible
facilities.
V. Operations Overview
88
Annual Report
V. Labor-Management Relations
(I) Employee Welfare and Benefits
1. Employee Sharesave Scheme.
2. Labor insurance, national health insurance and group insurance.
3. Periodic health examination.
4. Special cash allowances distributed on major festivals and subsidy for travel allowances.
5. Preferential interest rate for staff deposits.
6. Preferential interest rate for staff loans.
7. Special offers for financial transactions: preferential transaction fees, special exchange rate and inter-bank transfer fees.
8. Special credit card offers (issued by the Bank): no annual fee, double reward points.
(II) Retirement Policy and Leaving Service Benefits
Retirement Scheme
1. The Bank’s retirement scheme, naming the Standard Chartered Bank Taiwan Retirement Plan. The full cost is borne by the
Bank and staff members are not required to make any contributions. (This scheme is only applicable to employees hired
before 1 July 2005. Those hired after 1 July 2005 will have to adopt the Labor Pension Act (LPA).
2. All local permanent employees, under the age of 65, are automatically recorded in the system as eligible for the Banks’
pension scheme, so as to protect employees’ and their beneficiaries’ interests upon retirement, or in the event of death or
permanent disability. Benefits are in addition to those provided under the Taiwan social insurances.
3. Pension fund criteria
A. For employees hired before 1 July 2005 and selected not to join the Labor Pension Act (LPA), the retirement benefit is
subject to an employee’s years of service, with 2 units to be awarded per year and up to 25 years.
B. For employees hired before 1 July 2005 and selected to join LPA, the Bank will contribute on a monthly basis, 6%
of employees’ average monthly wages to the pension fund. The pension fund will be contributed into employees’
individual pension fund accounts at the Bureau of Labor Insurance based on the prescribed “Table of Monthly Wages
and Contribution Rates”. Employees’ pension fund accounts are custodied by the Bureau of Labor Insurance, and the
payment will be subject to LPA regulation. Upon an employee’s normal retirement, his/her years of service before
joining LPA will be awarded with 2 units per year (maximum 25 years) for calculation of retirement benefit.
C. For employees hired on and after 1 July 2005, the Bank will contribute on a monthly basis, 6% of employees’ average
monthly wages to the pension fund. The pension fund will be contributed into employees’ individual pension fund
accounts at the Bureau of Labor Insurance based on the prescribed “Table of Monthly Wages and Contribution Rates”.
Employees’ pension fund accounts are custodied by the Bureau of Labor Insurance, and the payment will be subject to
LPA regulation.
D. For employees originated from Hsinchu International Bank and American Express Bank, and selected the old retirement
scheme, calculation on the years of service after the Integration Date will be the same with the retirement benefit as
described above, i.e. 2 units to be awarded per year. As to the years of service before the Integration Date, it will be
calculated subject to the old retirement scheme of Hsinchu International Bank or American Express Bank.
89
Leaving Service Benefits
1. For employees hired before 1 July 2005, upon leaving the service of the Bank and before becoming eligible to receive a
retirement benefit as described in the Normal Retirement Benefit and Voluntary Retirement Benefits, they may be qualified
for a Leaving Service Benefits (LSB) subject to a minimum of 10 years of service.
2. For employees originated from Hsinchu International Bank and hired before 1 July 2005, they will be subject to the same
LSBs as described above 12 months from the Integration Date with their HIB service fully preserved for benefit calculation
purpose. For the determination of units, the full total years of service will be used. For determination of years of service,
the total service years under the Labor Standards Act retirement plan will be used.
3. For employees originated from American Express Bank, they will be subject to the Standard Chartered Bank LSB scheme
effective from the Integration Date. As to the years of service before the Integration Date, it will be calculated subject to
the Leaving Service Benefits scheme of American Express Bank.
(III) Labor-Management Agreements and Measures to Protect Employees’ Rights and Interests :
To exemplify our brand promise to be Here for good, the Bank signed the second Collective Bargaining Agreement (CBA) with the
SCB Union on 15 May 2012. Our harmony and trustworthy partnership between labour and management is highly esteemed not
only a unique model of leading by example among all the foreign banks in Taiwan, but also a global standard of demonstrating
a great collaborative strategy leading to win-wins with all employees benefited. By upholding the spirits of co-existence, co-
prosperity, co-benefit, and customer centricity, together we will pursue business sustainability, maintain harmonic labor-
management relationship and commit to protect employees’ rights and interests.
(IV) Loss resulting from labor disputes in recent years, the amount of estimated potential loss and the Bank’s responses :
As of January 2014, no loss was incurred from litigations relating to labor disputes. Since the ruling is given on case by case basis,
it is difficult for the Bank to anticipate the ruling result or estimate the potential loss arising from such disputes.
V. Operations Overview
Annual Report
90
VII. Information on Financial Assets Securitization
The Bank has no other securitization assets.
VI. Important Contracts
Nature of Contract Concerned Party Contract Term Main Content Restriction Clause
Insurance Sales Agreement
PCA Life Assurance Co. 07/2007 ~ PCA Life has signed the insurance product promotion tripartite contract with Standard Chartered Life Insurance Agency Co., Ltd. and Standard Chartered Bank (Taiwan) Limited.
None
Telecom (Voice & Data) Integrated Services
Taiwan Fixed Network 08/2013 ~ 07/2016
Provide the fixed lines of data and voice network, and the operational management services, including 2 onsite support personnel
None
Data Center Management Services
ATOS INFORMATION TECHNOLOGY HK LTD
01/11/2004 ~ 31/12/2016
Data storage and maintenance of the data center in Hong Kong
Comply with the "Regulations Governing Internal Operating Systems and Procedures for the Outsourcing of Financial Institution Operation"
Other financial liabilities (Note) 10,188,173 11,460,148 19,669,511
Other liabilities 10,585,636 11,164,608 11,524,373
Total liabilities
Before distribution 698,424,865 663,662,730 581,433,509
After distribution 698,424,865 663,662,730 581,433,509
Common stock 29,105,720 29,105,720 29,105,720
Capital surplus 5,786,031 5,786,031 10,430,441
Retained earnings
Before distribution 9,386,251 2,922,991 (4,644,410)
After distribution 5,020,393 877,102 (4,644,410)
Unrealized gain or loss on financial instruments 962,709 439,450 28,128
Other shareholders’ equity (4,673) 35,596 89,166
Cumulative translation adjustment - - -
Total Shareholders’ Equity
Before distribution 45,236,038 38,289,788 35,009,045
After distribution 40,870,180 36,243,899 35,009,045
Note : The principal from Structured products as of 2009 have been reclassified from Deposits and remittances to Other financial liabilities to conform to the presentation as of 2010 and 2011.
97
(II) Condensed Statements of Profit or Loss and Other Comprehensive Income - adopts IFRSs International Financial Reporting Standards - and Its Subsidiaries
(I) Ratio Analysis - adopts IFRSs International Financial Reporting Standards - and Its Subsidiaries
YearItem
2013 20121 Jan. – 28 Feb. 2014
(unaudited)
Ope
ratin
g Ca
pabi
lity
Ratio of loans to deposits (%) 63.45 63.24 65.27
Ratio of non-performing loans (%) 0.53 0.70 0.51
Ratio of interest cost to annual average deposits (%) 0.64 0.69 0.11
Ratio of interest income to annual average loans outstanding (%) 2.85 3.02 0.43
Total assets turnover (time) 0.02 0.02 -
Average operating income per employee (thousand dollar) 3,891.00 3,999.00 721.00
Average profit per employee (thousand dollar) 616.00 735.00 178.00
Profi
tabi
lity
Return on Tier 1 capital (%) 7.43 9.33 2.07
Return on assets (%) 0.32 0.41 0.09
Return on equity (%) 5.60 7.01 1.60
Net income ratio (%) 15.83 18.38 24.66
Earnings per share (NTD) 0.82 1.05 0.23
Fina
ncia
lSt
ruct
ure
Ratio of liabilities to assets (%) 94.41 94.16 94.44
Ratio of property and equipment to equity (%) 13.12 14.07 12.88
Gro
wth
Ra
te Asset growth rate (%) 3.03 (1.07) 2.29
Profit growth rate (%) (23.16) (62.29) -
Cash
Flo
w Cash flow ratio (%) 51.69 (99.96) -
Cash flow adequacy ratio (%) (207.10) (238.65) -
Ratio of cash flow from operations to cash flow from investments (%) 228,182.95 (387.80) -
Ratio of liquidity reserve (%) 53.70 54.96 58.45
Balance of secured loans of related parties (thousand dollar) 2,691,498 2,633,353 2,745,945
Total secured loans of related parties as a percentage of total loans (%) 0.68 0.68 0.70
Ope
ratin
g Sc
ale
Market share of assets (%) 1.72 1.84 1.70
Market share of net worth (%) 1.50 1.64 1.49
Market share of deposits (%) 1.83 1.90 1.76
Market share of loans (%) 1.47 1.51 1.44
Please explain reasons for changes (if any) in the financial ratios for the past two years:1. Non-performing loans (NPL) ratio decreased year-on-year: The lower NPL ratio was mainly because the NPL customers in the
previous year have been making repayment or have paid off their loans in 2013. As a result, there was fewer number of additional loans booked as NPL than that of NPLs converting to performing loans in 2013.
2. Return on Tier 1 capital dropped year-on-year: The lower return on Tier 1 capital was mainly driven by decrease in profits. However, the drop on return was partly offset by lower Tier 1 capital thanks to the adoption of IFRS and Basel III for the first time in 2013.
3. Return on assets (%), return on equity (%), earnings per share, and profit growth rate (%) decreased year-on-year: Such decrease was mainly driven by lower net income before tax, with elaboration below: (1) In 2012, there was additional net profit of NTD 860 million generated from the disposal of assets and non-performing loans. (2) In 2013, profits were affected by the lower return on Central Bank’s negotiable certificates of deposit (NCD) invested by the Bank as well as slower growth in consumer lending business. (3) The foregoing adverse factors were offset in part by the WM business growth, tightly controlled operating expenses, and improved asset quality.4. Asset growth rate increased year-on-year: The increase was mainly due to growth in corporate lending business and unsecured loans,
as well as more available funds arising from the RMB deposits growth.5. Cash flow ratio increased year-on-year: The main reason for the increase was higher net cash flow from operating activities, which
was driven by the rapid growth in RMB deposits business for the year 2013.
VI. Financial Highlights
100
Annual Report
YearItem
2013 20121 Jan. – 28 Feb. 2014
(unaudited)
Ope
ratin
g Ca
pabi
lity
Ratio of loans to deposits (%) 63.37 63.16 65.15
Ratio of non-performing loans (%) 0.53 0.70 0.51
Ratio of interest cost to annual average deposits (%) 0.64 0.69 0.11
Ratio of interest income to annual average loans outstanding (%) 2.85 3.02 0.43
Total assets turnover (time) 0.02 0.02 -
Average operating income per employee (thousand dollar) 3,755.00 3,881.00 690.00
Average profit per employee (thousand dollar) 617.00 737.00 178.00
Profi
tabi
lity
Return on Tier 1 capital (%) 7.29 9.19 2.01
Return on assets (%) 0.32 0.41 0.09
Return on equity (%) 5.60 7.01 1.60
Net income ratio (%) 16.44 18.98 25.82
Earnings per share (NTD) 0.82 1.05 0.23
Fina
ncia
lSt
ruct
ure
Ratio of liabilities to assets (%) 94.41 94.17 94.45
Ratio of property and equipment to equity (%) 13.12 14.07 12.88
Gro
wth
Ra
te Asset growth rate (%) 3.03 (1.05) 2.32
Profit growth rate (%) (23.68) (62.75) -
Cash
Flo
w Cash flow ratio (%) 51.71 (100.04) -
Cash flow adequacy ratio (%) (213.93) (267.95) -
Ratio of cash flow from operations to cash flow from investments (%) 255,884.15 (387.81) -
Ratio of liquidity reserve (%) 53.70 54.96 58.45
Balance of secured loans of related parties (thousand dollar) 2,691,498 2,633,353 2,745,945
Total secured loans of related parties as a percentage of total loans (%) 0.68 0.68 0.70
Ope
ratin
g Sc
ale
Market share of assets (%) 1.72 1.84 1.70
Market share of net worth (%) 1.50 1.64 1.49
Market share of deposits (%) 1.83 1.90 1.76
Market share of loans (%) 1.47 1.51 1.44
Please explain reasons for changes (if any) in the financial ratios for the past two years:1. Non-performing loans (NPL) ratio decreased year-on-year: The lower NPL ratio was mainly because the NPL customers in the previous
year have been making repayment or have paid off their loans in 2013. As a result, there was fewer number of additional loans booked as NPL than that of NPLs converting to performing loans in 2013.
2. Return on Tier 1 capital dropped year-on-year: The lower return on Tier 1 capital was mainly driven by decrease in profits. However, the drop on return was partly offset by lower Tier 1 capital thanks to the adoption of IFRS and Basel III for the first time in 2013.
3. Return on assets (%), return on equity (%), earnings per share, and profit growth rate (%) decreased year-on-year: Such decrease was mainly driven by lower net income before tax, with elaboration below: (1) In 2012, there was additional net profit of NTD 860 million generated from the disposal of assets and non-performing loans. (2) In 2013, profits were affected by the lower return on Central Bank’s negotiable certificates of deposit (NCD) invested by the Bank as well as slower growth in consumer lending business. (3) The foregoing adverse factors were offset in part by the WM business growth, tightly controlled operating expenses, and improved asset quality.4. Asset growth rate increased year-on-year: The increase was mainly due to growth in corporate lending business and unsecured loans,
as well as more available funds arising from the RMB deposits growth.5. Cash flow ratio increased year-on-year: The main reason for the increase was higher net cash flow from operating activities, which
was driven by the rapid growth in RMB deposits business for the year 2013.
Ratio Analysis - adopts IFRSs International Financial Reporting Standards
101
Note : Financial ratios are computed as follows :
1. Operating capability
(1) Ratio of Loans to Deposits = Total loans / Total deposits
(2) Ratio of Non-performing Loans = Total NPL / Total loans
(3) Ratio of Interest cost to annual average deposits = Total interest cost associated with deposits / Annual average deposits
(4) Ratio of Interest income to annual average loans outstanding = Total interest income associated with loans / Annual average
loans outstanding
(5) Total assets turnover = Operating income / Average total assets
(6) Average operating income per employee = Operating income / Total number of employees
(7) Average profit per employee = Net income after tax / Total number of employees
2. Profitability
(1) Return on Tier 1 capital = Net income before tax / Average net Tier 1 capital
(2) Return on assets = Net income after tax / Average total assets
(3) Return on equity = Net income after tax / Average total equity
(4) Net income ratio = Net income after tax / Operating income
(5) Earnings per share = (Net income attributable to owners of the parent company- Preferred stock dividend) / Weighted
average number of shares issued
3. Financial structure
(1) Ratio of liabilities to total assets = Total liabilities / Total assets
(2) Ratio of property and equipment to equity = Net property and equipment / Net equity
4. Growth rate
(1) Asset growth rate = (Total assets of the year - Total assets of previous year) / Total assets of previous year
(2) Profit growth rate = (Net income before tax of the year - Net income before tax of previous year) / Net income before tax of
previous year
5. Cash flow
(1) Cash flow ratio = Net cash flow from operating activities / (Call loans and overdrafts from banks + Commercial paper
payable + Financial liabilities at fair value through profit or loss + Bonds and bills sold under repurchase agreements +
Current portion of payables )
(2) Cash flow adequacy ratio = Net cash flow from operating activities for the past five years / (Capital expenditures + Cash
dividends )for the past five years
(3) Ratio of cash flow from operations to cash flow from investments = Net cash flow from operating activities / Net cash flow
from investing activities
6. Ratio of liquidity reserve = Liquid assets defined by the Central Bank / Reserve for liabilities
7. Operating scale
(1) Market share of assets = Total assets / Total assets of all authorized deposit-taking and loan-underwriting financial
institutions
(2) Market share of net worth = Net worth / Total net worth of all authorized deposit-taking and loan-underwriting financial
institutions
(3) Market share of deposits = Total deposits / Total deposits of all authorized deposit-taking and loan-underwriting financial
institutions
(4) Market share of loans = Total loans / Total loans of all authorized deposit-taking and loan-underwriting financial institutions
VI. Financial Highlights
102
Annual Report
YearItem
2011 2010 2009
Ope
ratin
g Ca
pabi
lity
Ratio of Loans to deposits (%) 58.77 58.96 67.08
Ratio of Non-performing Loans (%) 0.44 0.69 1.41
Ratio of Interest cost to annual average deposits (%) 0.81 0.61 0.99
Ratio of Interest income to annual average loans outstanding (%) 3.63 3.33 4.03
Total assets turnover (time) 0.02 0.02 0.02
Average operating income per employee (thousand dollar) 4,449.00 4,222.00 3,889.00
Average profit per employee (thousand dollar) 2,173.00 728.00 (1,202.00)
Profi
tabi
lity
Return on Tier 1 capital (%) 26.64 15.31 (20.49)
Return on assets (%) 1.16 0.44 (0.74)
Return on equity (%) 20.05 7.98 (14.00)
Net income ratio (%) 48.84 17.24 (30.90)
Earnings per share (NTD) 2.88 1.00 (1.86)
Fina
ncia
lSt
ruct
ure
Ratio of liabilities to assets (%) 93.92 94.55 94.32
Ratio of fixed assets to equity (%) 13.43 18.94 21.68
Gro
wth
Ra
te Asset growth rate (%) 5.94 13.87 (3.15)
Profit growth rate (%) 116.23 192.75 (411.96)
Cash
Flo
w Cash flow ratio (%) (70.44) 14.49 (1.40)
Cash flow adequacy ratio (%) 586.72 1,126.92 822.82
Ratio of cash flow from operations to cash flow from investments (%) 569.39 (6.58) 9.80
Ratio of liquidity reserve (%) 51.96 37.98 23.56
Balance of secured loans of related parties (thousand dollar) 2,690,500.00 2,137,212.00 1,223,845.00
Total secured loans of related parties as a percentage of total loans (%) 0.70 0.57 0.36
Ope
ratin
g Sc
ale Market share of assets (%) 1.91 1.92 1.79
Market share of net worth (%) 1.88 1.70 1.62
Market share of deposits (%) 2.09 2.20 1.82
Market share of loans (%) 1.54 1.65 1.63
Ratio Analysis - adopts ROC Generally Accepted Accounting Principles
103
Note : Financial ratios are computed as follows:
1. Operating capability
(1) Ratio of Loans to Deposits = Total loans / Total deposits
(2) Ratio of Non-performing Loans = Total NPL / otal loans
(3) Ratio of Interest cost to annual average deposits= Total interest cost associated with deposits / Annual average deposits
(4) Ratio of Interest income to annual average loans outstanding= Total interest income associated with loans / annual
average loans outstanding
(5) Total assets turnover = Operating income / Total assets
(6) Average operating income per employee = Operating income / Total number of employees
(7) Average profit per employee = Net income after tax / Total number of employees
2. Profitability
(1) Return on Tier 1 capital = Net income before tax / Average total Tier 1 capital
(2) Return on assets = Net income after tax / Average total assets
(3) Return on equity = Net income after tax / Average net shareholders' equity
(4) Net income ratio = Net income after tax / Operating income
(5) Earnings per share = (Net income after tax- Preferred stock dividend) / Weighted average number of shares issued
3. Financial structure
(1) Ratio of liabilities to assets = Total liabilities / Total assets
(2) Ratio of fixed assets to equity = Net fixed assets / Net shareholders' equity
4. Growth rate
(1) Asset growth rate = (Total assets of the year- Total assets of previous year) / Total assets of previous year
(2) Profit growth rate = (Net income before tax of the year- Net income before tax of previous year) / Net income before tax
of previous year
5. Cash flow
(1) Cash flow ratio = Net cash flow from operating activities /(Call loans and overdrafts from banks+ Commercial paper
payable+ Financial liabilities at fair value through profit or loss+ Bonds and bills sold under repurchase agreements+
Current portion of payables)
(2) Cash flow adequacy ratio = Net cash flow from operating activities for the past five years /(Capital expenditures+ Cash
dividends) for the past five years
(3) Ratio of cash flow from operations to cash flow from investments = Net cash flow from operating activities / Net cash flow
from investing activities
6. Ratio of liquidity reserve = Liquid assets defined by the Central Bank / Reserve for liabilities
7. Operating scale
(1) Market share of assets = Total assets / Total assets of all authorized deposit-taking and loan-underwriting financial
institutions
(2) Market share of net worth = Net worth / Total net worth of all authorized deposit-taking and loan-underwriting financial
institutions
(3) Market share of deposits = Total deposits / Total deposits of all authorized deposit-taking and loan-underwriting financial
institutions
(4) Market share of loans = Total loans / Total loans of all authorized deposit-taking and loan-underwriting financial
institutions
VI. Financial Highlights
104
Annual Report
(II) Capital Adequacy - adopts IFRSs International Financial Reporting Standards - and Its Subsidiaries
Total risk-weighted assets 364,012,628 370,072,983 381,429,287
Capital adequacy ratio 16.54 14.19 13.76
Tier 1 capital to risk-weighted assets ratio (%) 11.15 8.87 6.88
Tier 2 capital to risk-weighted assets ratio (%) (Note1) 5.39 5.32 6.88
Tier 3 capital to risk-weighted assets ratio (%) - - -
Common stock to total assets ratio (%) 3.91 4.15 4.72
Note 1 : Since the total Tier II capital exceeded total Tier I capital in 2009, the unqualified Tier II capital was about NTD 1,385,447
thousand dollars.
Note 2 : The ratios are computed as follows :
1. Total self-owned capital = Tier 1 capital + Tier 2 capital + Tier 3 capital
2. Total risk weighted assets = Credit risk weighted assets + Capital charge of (Operational risk + Market risk)×12.5
3. Capital adequacy ratio = Total self-owned capital / Total risk-weighted assets
4. Tier 1 capital to risk-weighted assets ratio = Tier 1 capital / Total risk-weighted assets
5. Tier 2 capital to risk-weighted assets ratio = Tier 2 capital / Total risk-weighted assets
6. Tier 3 capital to risk-weighted assets ratio = Tier 3 capital / Total risk-weighted assets
7. Common stock to total assets ratio = Common stock / Total assets
VI. Financial Highlights
108
Annual Report
Norman Lyle
109
VI. Financial Highlights
The Board of Directors
Standard Chartered Bank (Taiwan) Limited:
We have audited the accompanying balance sheets of Standard Chartered Bank (Taiwan) Limited as ofDecember 31, 2013 and 2012 , and January 1, 2012, and the related statements of profit or loss and othercomprehensive income, statements of changes in stockholders' equity, and statements of cash flows for theperiod ended December 31, 2013 and 2012. These financial statements are the responsibility of the Bank'smanagement. Our responsibility is to express an opinion on these financial statements based on our audits.
We conducted our audits in accordance with the Regulations Governing Auditing and Certification of FinancialStatements of Financial Institutions by Certified Public Accountants and Republic of China generally acceptedauditing standards. Those standards and regulations require that we plan and perform the audit to obtainreasonable assurance about whether the financial statements are free of material misstatement. An audit includesexamining, on a test basis, evidence supporting the amounts and disclosures in the financial statements. An auditalso includes assessing the accounting principles used and significant estimates made by management, as well asevaluating the overall financial statement presentation. We believe that our audits provide a reasonable basis forour opinion.
In our opinion, the financial statements referred to in the first paragraph present fairly, in all material respects,the financial position of Standard Chartered Bank (Taiwan) Limited as of December 31, 2013 and 2012, andJanuary 1, 2012 and the results of its performances and its cash flows for the period ended December 31, 2013and 2012, in conformity with the Regulations Governing the Preparation of Financial Statements by PublicBanks.
March 26, 2014
110
Annual Report
Stan
dard
Cha
rter
ed B
ank
(Tai
wan
) L
imit
ed
Bal
ance
She
ets
Dec
embe
r 31
, 201
3 an
d 20
12,
and
Janu
ary
1, 2
012
(Exp
ress
ed in
tho
usan
ds o
f N
ew T
aiw
an D
olla
rs)
Dec
embe
r 31
, 201
3D
ecem
ber
31, 2
012
Janu
ary
1, 2
012
Ass
ets
Am
ount
Am
ount
Am
ount
1100
0C
ash
and
cash
equ
ival
ents
(no
te 6
(1))
$29
,274
,099
46,
697,
772
111
,469
,535
2
1150
0D
ue f
rom
the
Cen
tral
Ban
k an
d ca
ll lo
ans
to b
anks
(no
tes
6(2)
and
7)
68,5
34,1
069
68,0
73,1
9410
74,3
98,5
4110
1200
0Fi
nanc
ial a
sset
s at
fai
r va
lue
thro
ugh
prof
it or
loss
(no
te 6
(3))
20,4
58,8
874
29,5
44,7
104
40,8
67,6
916
1230
0D
eriv
ativ
e fi
nanc
ial a
sset
s fo
r he
dgin
gne
t (no
tes
6(4)
and
7)
172,
750
-42
8,98
3-
728,
959
-
1250
0Se
curi
ties
purc
hase
d un
der
rese
ll ag
reem
ents
(no
te 6
(5))
1,95
0,00
0-
3,40
2,03
9-
8,45
6,41
41
1300
0R
ecei
vabl
ene
t (no
tes
6(6)
, (7)
and
7)32
,759
,448
437
,741
,825
534
,206
,432
5
1320
0C
urre
nt ta
x as
sets
(no
te 6
(21)
)11
1,72
4-
115,
818
-22
4,89
0-
1350
0D
isco
unts
and
loan
sne
t (no
tes
6(4)
, (7)
and
7)
360,
762,
604
4835
0,38
7,04
648
346,
151,
003
47
1400
0A
vail
able
-for
-sal
e fi
nanc
ial a
sset
sne
t
(not
es 6
(4),
(8)
and
7)
230,
156,
830
3022
6,36
3,33
231
211,
874,
021
28
1500
0In
vest
men
ts m
easu
red
by e
quity
met
hod
net (
note
6(9
))39
3,51
1-
369,
417
-27
9,57
9-
1550
0O
ther
fin
anci
al a
sset
s (n
ote
6 (9
))15
1,24
5-
151,
409
-15
8,07
2-
1850
0Pr
oper
ty, p
lant
and
equ
ipm
ent
net (
note
6(1
0))
5,56
3,29
51
6,04
9,66
51
6,81
1,87
31
1900
0In
tang
ible
ass
ets
net (
note
6(1
1))
3,15
7,05
0-
3,19
3,43
5-
3,21
7,94
1-
1930
0D
efer
red
tax
asse
ts (
note
6(2
1))
2,39
7,89
1-
2,63
9,98
3-
2,80
0,90
2-
1950
0O
ther
ass
ets
net (
note
s 6(
12)
and
8)3,
267,
254
-1,
600,
102
-2,
897,
516
-
Tot
al a
sset
s$
759,
110,
694
100
736,
758,
730
100
744,
543,
369
100
Dec
embe
r 31
, 201
3D
ecem
ber
31, 2
012
Janu
ary
1, 2
012
Lia
bilit
ies
and
stoc
khol
ders
' equ
ity
Am
ount
%A
mou
nt%
Am
ount
%C
urre
nt li
abili
ties
:
2100
0D
epos
its f
rom
the
Cen
tral
Ban
k an
d ba
nks
(not
es 6
(13)
and
7)
$45
,985
,672
69,
283,
983
118
,390
,389
3
2200
0Fi
nanc
ial l
iabi
litie
s at
fai
r va
lue
thro
ugh
prof
it or
loss
(no
te 6
(3))
7,53
3,98
81
8,35
7,47
11
14,8
63,3
552
2230
0D
eriv
ativ
e fi
nanc
ial l
iabi
liti
es f
or h
edgi
ngne
t (no
tes
6(4)
and
7)
3,22
7-
13,5
23-
92,4
41-
2300
0Pa
yabl
es (
note
6(1
4))
4,53
8,85
61
6,01
6,09
21
4,87
1,99
91
2310
0R
elat
ed p
artie
s pa
yabl
e (n
ote
7)7,
498,
048
16,
012,
064
14,
284,
892
1
2320
0C
urre
nt ta
x lia
bilit
ies
(not
e 6(
21))
--
65,7
80-
21,1
91-
2350
0D
epos
its a
nd r
emitt
ance
s (n
otes
6(4
), (
15)
and
7)57
7,58
5,84
576
563,
071,
977
7759
6,15
1,69
280
2400
0B
ank
note
s pa
yabl
ene
t (no
tes
6(4)
, (16
) an
d 7)
55,5
59,9
257
62,0
14,5
379
47,5
12,1
706
2550
0O
ther
fin
anci
al li
abili
ties
(not
e 6(
17))
13,1
20,0
222
34,6
90,2
365
10,0
95,7
321
2560
0Pr
ovis
ions
(no
tes
6(18
) an
d (2
0))
1,91
5,12
4-
1,98
1,02
8-
1,82
2,55
7-
2930
0D
efer
red
tax
liabi
litie
s (n
ote
6(21
))59
2,78
7-
665,
364
-58
6,80
8-
2950
0O
ther
liab
ilitie
s (n
otes
6(1
9) a
nd 9
(3))
2,37
1,68
8-
1,60
2,63
2-
1,47
3,01
5-
Tota
l lia
bilit
ies
716,
705,
182
9469
3,77
4,68
795
700,
166,
241
94
3110
1C
omm
on s
tock
(no
te 6
(23)
)29
,105
,720
429
,105
,720
429
,105
,720
4
3150
0C
apita
l sur
plus
(no
te 6
(23)
)5,
786,
031
15,
786,
031
15,
786,
031
1
Ret
aine
d ea
rnin
gs:
3200
1L
egal
res
erve
(no
te 6
(23)
)4,
289,
836
13,
388,
832
-87
6,89
7-
3200
3Sp
ecia
l res
erve
(no
te 6
(23)
)34
7,70
6-
136,
034
-13
6,03
4-
3200
5U
napp
ropr
iate
d ea
rnin
gs (
note
6(2
3))
2,26
7,77
7-
3,58
2,70
6-
7,50
9,73
71
6,90
5,31
91
7,10
7,57
2-
8,52
2,66
81
3250
0O
ther
equ
ity in
tere
st (
note
6(2
3))
608,
442
-98
4,72
0-
962,
709
-
Tota
l sto
ckho
lder
s' e
quit
y42
,405
,512
642
,984
,043
544
,377
,128
6
Tot
al li
abili
ties
and
sto
ckho
lder
s' e
quit
y$
759,
110,
694
100
736,
758,
730
100
744,
543,
369
100
See
acco
mpa
nyin
g no
tes
to f
inan
cial
sta
tem
ents
111
VI. Financial Highlights
Standard Chartered Bank (Taiwan) Limited
Statements of Profit or Loss and Other Comprehensive Income
For the years ended December 31, 2013 and 2012
(expressed in thousands of New Taiwan Dollars)
2013 2012 ChangeAmount Amount %
41000 Interest income (notes 6(26) and 7) $ 14,391,931 99 15,074,936 94 (5)
51000 Less Interest expense (notes 6(26) and 7) 5,046,491 35 5,259,856 33 (4)
Net interest income 9,345,440 64 9,815,080 61 (5)
Net non-interest income
49100 Net service fee income (notes 6(27) and 9(3)) 2,917,173 20 2,808,275 17 4
49200 Gain on financial assets or liabilities measured at fair value
through profit or loss (note 6(28)) 1,172,009 8 1,951,909 12 (40)
49300 Realized loss on available-for-sale financial assets (note 6(29)) (1,085) - (6,451) - 83
47000 Share of profit of associates and joint ventures accounted for using equity
method (note 6(9)) 323,219 2 299,125 2 8
49600 Foreign exchange gain 695,480 5 249,202 2 179
49800 Net other non-interest income (notes 6(9), (30) and 7) 94,923 1 1,030,177 6 (91)
55000 Impairment losses on assets (note 6(9) and (31)) (4,638) - (12,832) - 64
Net revenue 14,542,521 100 16,134,485 100 (10)
58200 Bad debt expenses and guarantee liability provision
Profit before tax $ 2,778,925 3,641,222Adjustments
Adjustments to reconcile profit (loss)Depreciation expense 299,584 404,292Amortization expense 36,385 25,489Bad debt expense and guarantee liability provision 1,632,146 2,020,735Interest expense 5,046,491 5,259,856Interest income (14,391,931) (15,074,936)Net change in other provisions 11,115 49,858Gain on sale of non-performing loans - (648,300)Impairment loss on financial assets 4,638 12,832Share of profit of subsidiaries, associates and joint ventures accounted for using equity method (323,219) (299,125)Gain on disposal of property and equipment (19,553) (232,585)
Total adjustments to reconcile profit (loss) (7,704,344) (8,481,884)Change in operating assets and liabilities
Change in operating assetsDue from the Central Bank and call loans to banks 1,617,778 (679,519)Financial assets at fair value through profit or loss 9,085,823 11,322,981Receivables 4,890,482 (3,456,938)Discounts and loans (11,968,230) (6,408,078)Available-for-sale financial assets (3,950,652) (14,376,044)Other financial assets - 6,663
Total changes in operating assets (324,799) (13,590,935)Changes in operating liabilities
Deposits from the Central Bank and banks 36,701,689 (9,106,406)Financial liabilities at fair value through profit or loss (823,483) (6,505,884)Payables 426,029 2,605,414Deposits and remittances 14,542,869 (33,018,107)Other financial liabilities (21,570,214) 24,594,504Other liabilities 769,056 129,617Total changes in operating liabilities 30,045,946 (21,300,862)
Total changes in operating assets and liabilities 29,721,147 (34,891,797)Total adjustments 22,016,803 (43,373,681)
Cash inflow (outflow) generated from operations 24,795,728 (39,732,459)Interest received 14,483,826 14,996,481Dividend received 299,125 209,287Interest paid (5,463,772) (4,994,005)Income taxes paid (215,375) (160,641)
Net cash flows from (used in) operating activities 33,899,532 (29,681,337)Cash flows from investing activities
Proceeds from disposal of property, plant and equipment 471,733 565,952Acquisition of property, plant and equipment (269,868) (37,475)Decrease in securities purchased under resell agreements 1,452,039 5,054,375Sale of non-performing loans - 773,234(Increase) decrease in other assets (1,667,152) 1,297,414
Net cash flows from investing activities (13,248) 7,653,500Cash flows (used in) from financing activities
Decrease in derivative financial liabilities for hedging (235,755) (6,546)(Decrease) increase in bank notes payable (6,305,512) 14,623,612Cash dividends paid (2,690,000) (4,365,858)
Net cash flows (used in) from financing activities (9,231,267) 10,251,208Net increase (decrease) in cash and cash equivalents 24,655,017 (11,776,629)Cash and cash equivalents at beginning of period 41,390,526 53,167,155Cash and cash equivalents at end of period $ 66,045,543 41,390,526Components of cash and cash equivalents:
Cash and cash equivalents reported in the statement of financial position $ 29,274,099 6,697,772Due from the Central Bank and call loans to banks qualifying for cash and cash equivalents under
the definition of IAS 7 36,771,444 34,692,754Cash and cash equivalents at end of period $ 66,045,543 41,390,526
114
Annual Report
Standard Chartered Bank (Taiwan) LimitedNotes to the Financial Statements
December 31, 2013 and 2012(expressed in thousands of New Taiwan Dollars, unless otherwise specified)
(1) Organization
Standard Chartered Bank (Taiwan) Limited (the "Bank") was established on September 15, 1948, in theTaoyuan, Hsinchu, and Miaoli areas. The original name of the Bank was Hsinchu District's Mutual LoanInc., which specialized in the mutual loan business, deposits, loans, and payment collection. In compliancewith the Banking Act of the Republic of China ("ROC"), the Bank restructured to become The Small andMedium Business Bank of Hsinchu District on January 1, 1978, and in addition to the original lines ofbusiness, the Bank started to conduct checking deposit and regular banking businesses.
Pursuant to an approval granted by the Securities and Futures Commission ("SFC"), which subsequentlychanged its name to the Securities and Futures Bureau ("SFB") on July 1, 2004, the Bank's shares wereauthorized to be publicly traded beginning March 22, 1983. Additionally, pursuant to approval granted bythe Ministry of Finance ("MOF"), the Bank established a Trust Department in January 1989 and anInternational Business Department in March 1993. In July 1992, the Bank established the securities tradingbusiness and the securities broker business, respectively, and both were approved by the MOF. On January16, 1995, the Bank established an Offshore Banking Unit ("OBU"), which began operations immediately.
The Bank was approved by the MOF to operate as a commercial bank in September 1998 and changed itsname to Hsinchu International Bank Co., Ltd. on April 20, 1999.
During 2006, Standard Chartered Bank provided a tender offer to acquire the outstanding shares of HsinchuInternational Bank Co., Ltd. Accordingly, Standard Chartered Bank acquired over 95% of the outstanding.After completion of the acquisition of shares, Hsinchu International Bank Co., Ltd. immediately submittedthe delisting application, which was approved by the related authorities on January 18, 2007. On June 30,2007, the operations of Standard Chartered Bank, Taipei Branch were transferred to Hsinchu InternationalBank Co., Ltd.; subsequently, Hsinchu International Bank Co., Ltd. was renamed Standard Chartered Bank(Taiwan) Limited on July 2, 2007.
The Bank acquired the outstanding assets, liabilities and operations of American Express Bank, TaipeiBranch ("AEB") and Asia Trust Investment Co., Ltd. ("ATIC") on August 1 and December 27, 2008,respectively.
(2) Approval date and Procedures of the Individual Financial Statements
The financial statements were authorized for issue by the Board of Directors on March 26, 2014.
115
VI. Financial Highlights
(3) New Standards and Interpretations Not yet Adopted
1) New standards and interpretations endorsed by the Financial Supervisory Commission R.O.C.("FSC") but not yet in effect
The International Accounting Standards Board ("IASB") issued International Financial ReportingStandard 9 Financial Instruments ("IFRS 9"), and the IASB issued revision to International FinancialReporting Standard 9 Financial Instruments ("IFRS 9") on November, 2009. (IASB deferred theeffective date of IFRS 9 to January 1 of 2015 on December 2011, and on November 2013, IASBdeclared to abolish the above effective date, resulting financial statements compiler would have moretime to adopt IFRS 9, and the new effective date has not been announced.) In accordance with FSCrules, early adoption is not permitted, and companies shall follow the guidance in the 2009 version ofInternational Accounting Standard 39 Financial Instruments ("IAS 39") and effective date has notbeen announced until the report date. Upon the adoption of this new standard, it is expected therewill be impacts on the classification and measurement of financial instruments in the individualfinancial statements.
2) New standards and interpretations not yet endorsed by the FSC
A summary of the new standards and amendments issued by the IASB that may have an impact onthe Bank's financial statements. As of the reporting date the standards and amendments were not yeteffective nor endorsed by the FSC.
Issue dateNew standards and
amendments Description and potential impactEffective date
per IASB
May 12, 2011 IFRS 13 "Fair ValueMeasurement"
Replaces fair value measurement guidance inother standards, and consolidates as one singleguidance. The Bank might process extraanalysis to confirm the possibility of effects onassets and liabilities if the Bank adopts thisstandard. In addition, the standard enhancesdisclosures about fair value measurement.
January 1, 2013
June 16, 2011 Revision to IAS 1"Presentation of FinancialStatements"
Items presented in other comprehensive incomeshall be based on whether they are potentiallyreclassifiable to profit or loss subsequently. Theobjective of this change was to make clearer theeffects these items may have on profit or loss inthe future.
July 1, 2012
June 16, 2011 Revision to IAS 19"Employee Benefits"
Eliminates the corridor method and eliminatesthe option to recognize changes in the netdefined benefit liability (asset) in profit or loss;in addition, requires the immediate recognitionof past service cost. The improvement ofdisclosure requirements that will better show thecharacteristics of defined benefit plans and therisks arising from those plans.
January 1, 2013
116
Annual Report
Issue dateNew standards and
amendments Description and potential impactEffective date
per IASB
November 19,2013
Revision to IFRS 9"Financial Instruments"
Firstly, a new chapter on hedge accounting hasbeen added to IFRS 9. This represents a majoroverhaul of hedge accounting and puts in placea new model that introduces significantimprovements principally by aligning theaccounting more closely with risk management.There are also improvements to the disclosuresabout hedge accounting and risk management.If adopted, transactions qualifying for hedgeaccounting may increase and would result inchanges to the measurement and presentation ofthe related hedging instrument and hedged item.
Effective datehas not beenannounced.Earlyapplication ispermitted
(4) Summary of Significant Accounting Policies
Significant accounting policies adopted in the individual financial statements are summarized as below.Unless otherwise stated, they apply consistently to all presentation periods in the individual financialstatements and opening IFRS balance sheets as of January 1, 2012, prepared for the purpose ofconversion to IFRSs approved by the FSC, International Accounting Standards ("IASs"), InternationalFinancial Reporting Interpretations Committee ("IFRICs"), and Standing Interpretations Committee("SICs").
1) Statement of compliance
Financial statements have been prepared in accordance with the Regulations Governing thePreparation of Financial Reports by Public Banks, Regulations Governing the Preparation ofFinancial Reports by Securities Firms (hereinafter referred to as the Regulations), and other relatedregulations applicable.
2) Basis of preparation
The financial statements have been prepared on a historical cost basis except for the followingmaterial items in the balance sheets:
(a) Financial instruments at fair value through profit or loss are measured at fair value;
(b) Available-for-sale financial assets are measured at fair value;
(c) Liabilities for cash-settled share-based payment arrangements are measured at fair value; and
(d) The defined benefit asset is recognized as plan assets, plus unrecognized past service costs andunrecognized actuarial loss, less the unrecognized actuarial gain and the present value of thedefined benefit obligation.
117
VI. Financial Highlights
3) Foreign currency transactions
Except for accounts in the OBU of the Bank that are denominated in US dollars, accounts in allentities are denominated in New Taiwan dollars. For those transactions denominated in foreigncurrencies, assets and liabilities are recorded in their original foreign currencies, while all income andexpense accounts are denominated in original foreign currencies and translated into New Taiwandollars at the daily closing exchange rates. At the balance sheet date, the financial statement amountsin all foreign currencies are translated into New Taiwan dollars at ruling exchange rates assigned onthat date. The Bank's individual financial statements are presented in New Taiwan Dollar, thefunctional currency of the Bank. All financial information presented in New Taiwan Dollars isexpressed in thousands of New Taiwan Dollars, unless otherwise specified. Foreign currencydifferences arising on the translation of a foreign currency transaction are recognized in current profitor loss.
4) Cash and cash equivalents
Cash on hand, checks for clearing, and due from banks are considered as cash and cash equivalentsby the Bank.
5) Reserves for deposits
Reserves against deposits placed with the Central Bank of the Republic of China ("CBC") arecalculated based on the monthly average balance of the various deposit accounts, using specificreserve ratios promulgated by the CBC. There is no interest offered on the reserve againstdeposits checking account and foreign currency account, and the deposits can be withdrawn at anytime. Except for the monthly reserve adjustment, deposits and withdrawals from the reserve againstdeposits demand account are restricted.
The reserve against deposits settlement account is placed with the CBC for interbank settlement.
6) Financial instruments
(a) Financial assets
Financial assets held by the Bank are recorded on the trading date. Except for financialinstruments classified as held for trading, other financial instruments are initially recognized atacquiring or issuing cost plus transaction costs.
i. Financial assets at fair value through profit or loss
Financial assets are classified as held for trading if they have been acquired principallyfor the purpose of selling or repurchasing in the near term. The derivative financialinstruments held by the Bank, except for those designated and effective hedginginstruments, are classified under these accounts. At each balance sheet date, the fairvalue is remeasured, and the resulting gain or loss from such remeasurement isrecognized in current profit or loss.
118
Annual Report
ii. Available-for-sale financial assets net
At each balance sheet date, the fair value is remeasured, and the resulting gain or lossfrom such remeasurement is recognized directly in other comprehensive income. Intereston a debt instrument classified as available-for-sale is accrued; the relevantpremium/discount is amortized by using the effective-interest-rate method. If there isobjective evidence that an available-for-sale financial asset is impaired, the carryingamount of the asset is reduced, and impairment loss is recognized. If, in a subsequentperiod, the amount of the impairment loss of the available-for-sale equity securitiesdecreases, the impairment loss recognized in profit or loss shall not be reversed throughprofit or loss. If, in a subsequent period, the amount of the impairment loss of theavailable-for-sale debt securities decreases and the decrease can be related objectively toan event occurring after the impairment was recognized, the previously recognizedimpairment loss is reversed through profit or loss. The carrying amount after the reversalshall not exceed the recoverable amount or the depreciated or amortized balance of theassets assuming no impairment loss was recognized. A gain or loss on available-for-salefinancial assets is recognized directly in other comprehensive income, except forimpairment losses and foreign exchange gains or losses arising from monetary financialassets, until the financial assets are derecognized, at which time the cumulative gain orloss previously recognized in other comprehensive income is charged to profit or loss.
iii. Securities under repurchase/resell agreements
Securities sold/purchased with a commitment to repurchase/resell at predetermined priceare treated as financing transactions. The difference between the cost and therepurchase/resell price is treated as interest expenses/revenue and recognized over theterm of the agreement. On the selling/purchasing date, these agreements are recognized assecurities sold under repurchase agreements or securities purchased under resellagreements.
iv. Loans, receivables and allowance for bad debts
Loans are non derivative financial assets with fixed or determinable payments that are notquoted in an active market.
The term of credit is decided by the length of credit maturity. Credit maturing less thanone year is called short term credit; credit maturing more than one year but less thanseven years is called medium term credit; and credit maturing more than seven years iscalled long term credit. Loans with collateral, pledged assets and qualified guarantees tosecure credit are secured loans.
Loans are recorded initially at principal and reported at their outstanding balances afternetting with any provisions for doubtful accounts. In accordance with the BankingInstitutions to Evaluate Assets and Deal with Non-performing/Non-accrual Loansapproved by FSC, an allowance for doubtful accounts is determined by evaluating thecollectability of loans and days past due of receivables (including non performing loans,overdue receivables, and interest receivable) and of advance accounts. Any non-performing loans or non-accrual loans, after subtracting the estimated recoverableportion, having one of the following characteristics shall be written off:
119
VI. Financial Highlights
i) The loan cannot be recovered in full or in part because the debtors have dissolved,gone into hiding, reached a settlement, declared bankruptcy, or for other reasons;
ii) The collateral and property of the primary/subordinate debtors have been appraisedat a very low value or become insufficient to repay the loan after the subtraction ofsenior mortgages; or the execution cost approaches or possibly exceeds the amountthat the Bank might collect from the debtors where there is no financial benefit inexecution;
iii) The primary/subordinate debtor's collateral has failed to sell at successive auctionswhere the price of such collateral has been successively lowered, and there is nofinancial benefit to be derived from the Bank's taking possession of such collateral;
iv) More than two years have elapsed since the maturity date of the non-performingloans or non-accrual loans, and the collection efforts have failed;
v) Other non-performing loans or non-accrual loans for which it has been ascertainedthat the efforts of collection have failed.
However, when requested by the competent authority or any financial examinationagency (organization), loans must be immediately written off, a report must be made tothe subsequent board meeting, and the supervisors must be notified for acknowledgement.Collections after write off shall be reversed from the allowance for bad debt expense.
Principal or interest overdue over three months is categorized as overdue accounts. Ifprincipal or interest of any outstanding loan is overdue for over six months, both theprincipal and accrued interest are reclassified as non-performing loan. Accrued intereston a non-performing loan will only be calculated and booked into memo accounts.
The objective evidence should be identified first to reveal impairment existing forfinancial assets that are individually significant, and individually or collectively forfinancial assets that are not individually significant. If no objective evidence ofimpairment exists for an individually assessed financial asset, it should be furtherincluded in a set of financial assets with similar credit risk characteristics and collectivelyassesses them for impairment. Assets that are individually assessed for impairment arenot required to be collectively assessed because impairment is or continued to berecognized.
If there is an objective evidence that an impairment loss on financial assets has beenincurred, the amount of the loss is recognized and measured as the difference between theasset's carrying amount and the present value of estimated future cash flows discounted atthe financial asset's original effective interest rate; the amount of the loss should berecognized as bad debt expenses in profit or loss in the current period. When determiningthe amount of the loss, the estimation of future cash flows includes the recoverableamount of collateral and related insurance, which cannot be less than the one set by theBanking Institutions to Evaluate Assets and Deal with Non-performing/ Non- accrualLoans approved by FSC.
120
Annual Report
v. Financial assets carried at cost
Equity instruments with no quoted market price are initially recognized at whose fairvalue plus transaction costs. At each balance sheet date, fair value can be reliablymeasured if either of the below conditions are met. The financial assets should bemeasured at fair value and reclassified as available-for-sale. If there is objective evidenceof impairment, the impairment loss should be recognized. Such impairment losses are notallowed to be reversed:
i) The variability in the range of reasonable fair value estimates is not significant forthat instrument or;
ii) The probabilities of the various estimates within the range can be reasonablyassessed and used in estimating fair value. If the range of reasonable fair valueestimates is significant and the probabilities of the various estimates cannot bereasonably assessed, it is not permissible to measure the instrument at fair value;instead, the instrument shall be carried at cost.
Cash dividends received from the aforementioned financial assets are recorded under"other non-interest income, net" on the ex-dividend date or the date that the boarddeclares a cash dividend. Nevertheless, dividends received will be deducted from theequity investment if they are declared out of profits prior to the acquisition of theinvestment. Stock dividends are not recognized as income but only treated as increases inthe number of shares held.
vi. Financial assets initially classified as measured at fair value through profit or loss (otherthan derivative financial assets and those designated as assets measured at fair valuethrough profit or loss) may be reclassified into other categories if those financial assetsare no longer held for the purpose of selling and meet the criteria listed below; financialassets initially classified as available-for-sale that would have met the definition of loansand receivables may be reclassified out of the available-for-sale category to the loans andreceivables. The accounting treatments on the date of reclassification are summarized asfollows:
i) When financial assets initially classified as measured at fair value through profit orloss have met the definition of loans and receivables and the entity has the intentionand ability to hold the financial assets for the foreseeable future or until maturity,they shall be reclassified at their value on the date of reclassification, which willbecome their new cost or amortized cost, as applicable. Any previous gain or lossalready recognized in profit or loss shall not be reversed.
ii) Financial assets initially classified as measured at fair value through profit or losswhich do not meet the preceding criterion may be reclassified out of the fair valuethrough profit or loss category only in rare circumstances and shall be reclassified attheir fair value on the date of reclassification, which will become their new cost oramortized cost, as applicable. Any previous gain or loss already recognized inprofit or loss shall not be reversed.
121
VI. Financial Highlights
iii) When financial assets initially classified as available-for-sale have met thedefinition of loans and receivables and the entity has the intention and ability tohold the financial assets for the foreseeable future or until maturity, they shall bereclassified at their value on the date of reclassification, which will become theirnew cost or amortized cost, as applicable.
iv) For any previous gain or loss on a financial asset that has been recognized directlyunder owners' equity, if the financial asset has a fixed maturity, the gain or lossshall be amortized to current profit or loss over the remaining life of the financialasset; if not, the gain or loss remains under owners' equity.
vii. Financial asset impairment
If there is an objective evidence that an impairment loss on financial assets has beenincurred, the amount of the loss is recognized and measured as the difference between theasset's carrying amount and the present value of estimated future cash flows discounted atthe financial asset's original effective interest rate; the amount of the loss shall berecognized in profit or loss in the current period. The estimation of future cash flowsincludes the recoverable amount of collateral and related insurance when determining theamount of the loss.
The aforesaid objective evidence includes:
i) Significant financial difficulty of the issuer or obligor;
ii) A breach of contract, such as a default or delinquency in interest or principalpayments;
iii) The lender, for economic or legal reasons relating to the borrower's financialdifficulty, granting to the borrower a concession that the lender would not otherwiseconsider;
iv) It becoming probable that the borrower will enter bankruptcy or other financialreorganization;
v) The disappearance of an active market for that financial asset because of the issuer'sfinancial difficulties;
vi) Adverse changes in the payment status of the borrower; and
vii) Changes in national or local economic conditions that correlate with defaults on theassets.
viii. Derecognition of financial assets
The Bank shall derecognize a financial asset when the contractual rights to the cash flowsfrom the financial asset expire or transfers substantially all the risks and rewards ofownership of the financial assets.
(b) Financial liabilities
The financial liabilities held by the Bank includes a financial liability measured at fair valuethrough profit or loss (including the instruments designated at fair value through profit or loss),financial liability at amortized cost and hedge derivatives.
122
Annual Report
i. Financial liabilities measured at fair value through profit or loss
A financial liability is held for trading if it is acquired or incurred principally for thepurpose of selling or repurchasing it in the near term; on initial recognition it is part of aportfolio of identified financial instruments that are managed together and for which thereis evidence of a recent actual pattern of short-term profit-taking. A derivative, except fora derivative that is a financial guarantee contract or a designated and effective hedginginstrument, is classified as instrument held for trading as well. Financial liabilities heldfor trading include obligations to deliver financial assets borrowed by a short seller.
ii. Financial liabilities at amortized cost
Financial liabilities are classified at amortized cost of a financial liability, except forfinancial liabilities measured at fair value through profit or loss, hedged derivativesfinancial liability, financial guarantee contracts, commitments to provide a loan at abelow-market interest rate and financial liabilities that arise when a transfer of a financialasset does not qualify for derecognition or when the continuing involvement approachapplies.
iii. Financial debentures
The issuance of a debt instrument is recorded at its fair value using a valuation technique.If the issuing price of such debt instrument is different from its face value, the differenceis amortized as interest income or expense by the interest method over the period from theacquisition date to the maturity date.
The difference between the payment and carrying amount of a debt instrument at theearly extinguishment date should be recognized as extraordinary losses or gains in thecurrent period if it is material.
iv. Derecognition of a financial liability
The Bank shall remove a financial liability from its balance sheets when, and only when,it is extinguished.
(c) Derivatives and hedging accounting
Derivatives instruments is initially recognized at fair value on contract date and subsequentlymeasured at fair value. Fair value includes quoted price in an active market, occurring markettransaction prices or model valuation technique. All derivatives instruments are recognized asassets with positive fair value and as liability with negative fair value.
The Bank should accounts for an embedded derivative separately from the host contract whenthe host contract is not itself carried at fair value through profit or loss, the terms of theembedded derivative would meet the definition that the economic characteristics and risks ofthe embedded derivative are not closely related to the economic characteristics and risks of thehost contract, and the entire hybrid contract is not designated as at fair value through profit orloss. In addition, the embedded derivative is recognized as financial asset or liability asmeasured at fair value through profit or loss.
123
VI. Financial Highlights
When a fair value hedge, cash flow hedge, and hedge of a net investment in a foreign operationare in conformity with all the conditions for applying hedge accounting, the affected profit orloss is recognized by offsetting the changes in the fair value of hedging instruments and hedgeditems. The related accounting treatments are as follows:
i. Fair value hedge: Changes in the fair value of derivatives that are designated andqualified as fair value hedging instruments against the exposure to changes in fair valueof a recognized asset or liability or an unrecognized firm commitment are recognizedthrough profit or loss in the current period.
ii. Cash flow hedge: Where a derivative financial instrument is designated as a hedge of thevolatility in cash flow of a recognized asset or liability or a highly foreseeable forecasttransaction, the effective hedged portion of any gain or loss on remeasurement of thederivative financial instrument to fair value is recognized directly under othercomprehensive income. When the hedged transaction actually affects the profit or loss,the gain or loss previously recognized under other comprehensive income shall berecognized through current profit or loss. Any gain or loss from the change in fair valuerelating to an ineffective hedged portion of the hedge transaction is recognizedimmediately through profit or loss in the current period.
7) Investment in affiliated companies
Entities that the Bank has significant influence and control over are accounted for according to theequity method. Investment is initially measured at cost. The carrying amount of the investment inassociates includes goodwill initially recognized less any accumulated impairment. When significantinfluence is lost, the equity method is no longer applicable and the carrying amount is deemed to bethe cost of the investment.
When the Bank holds directly or indirectly 20% of the voting rights in the investee, the Bank hassignificant influence over the investee. When the Bank holds 50% or more of the voting rights in theinvestee, the Bank has control over the investee. Unless the Bank can demonstrate that it does nothave either significant influence or control over the investee.
Share of profit of the associate is recognized as profit or loss in the period. Dividends received frominvestments in associates, accounted for according to the equity method, are accounted for as areduction of the carrying amount of the investment. Carrying amount of the investment shall beadjusted with changes in other comprehensive income that may impact the right of the Bank toreceive benefits. When the Bank's share of losses exceeds its interest in an equity-accountedinvestee, the carrying amount of that interest is reduced to nil and the recognition of further losses isdiscontinued except to the extent that the Bank has an obligation or has made payments on behalf ofthe investee.
Changes in the interests in subsidiaries that did not result in a loss of control should be treated as anequity transaction. And the Bank should adjust the interest attributable to equity holders and thecarrying amount of non-controlling interests to reflect the changes in their relative interests in thesubsidiary.
124
Annual Report
8) Non-financial asset impairment
In terms of International Accounting Standard No. 36, the Bank, at each balance sheet date, therecoverable amount of an asset is estimated and compared with the carrying amount whenever thereis an indication that the non-financial asset may be impaired. An impairment loss is recognized whenthe recoverable amount is less than the carrying amount. For assets other than goodwill, reversal ofimpairment loss is recognized when the recoverable amount of the asset has increased from its prior-period estimation. The carrying amount after the reversal shall not exceed the recoverable amount orthe depreciated or amortized balance of the assets assuming no impairment loss was recognized inprior periods.
9) Lease classification
Lease contracts in accordance with the International Accounting Standards No. 17 and the FSCinterpretation note No. 4 are divided into financial leases and operating leases.
The Bank classifies all its leases as operating leases.
The Bank's lease fees, which categorized under operating leases, are calculated using the straight-linemethod over the lease period where fees paid or received are recognized under income as "Otheroperating and administrative expenses" and "Other non-interest income".
10) Property, plant and equipment
Property, plant and equipment are measured at cost on acquisition. Subsequently, property, plant andequipment are measured at cost plus any revaluation increments. Interest expense incurred directlyattributable to bringing an asset to the condition necessary for it to be capable of operating should becapitalized. Major additions, improvements, and renewals are treated as capital expenditure andcapitalized, while maintenance and repair costs are expensed when incurred.
The Bank evaluates the estimated useful lives, depreciation method, and residual value on a regularbasis. Changes in the estimated useful lives, depreciation method, and residual value are accountedfor as changes in accounting estimates and recognized in current profit or loss.
Except for land, depreciation of property and equipment is calculated using the straight-line methodover its estimated useful life. Gains or losses on the disposal of property and equipment arerecognized as other non-interest income or losses.
Except for land, useful lives of property and equipment held by the Bank are as follows:
Buildings 5 to 60 years
Office equipment 3 to 8 years
Leasehold improvement Not exceed the shorter of 10 years or lease term
Other equipment 3 to 10 years
11) Intangible assets
(a) Computer software
Computer software system expenses, which are recorded on the basis of the actual cost ofacquisition, are amortized using a straight-line method. Its amortization method, useful life andresidual value are referred to the regulation of properties and equipment. The Bank use costmodel to proceed subsequently measurement.
125
VI. Financial Highlights
(b) Goodwill
The acquirer shall measure the identifiable assets acquired from business combination and theliabilities or contingent liabilities assumed at their acquisition-date fair values withoutconsidering non-controlling interest. The acquirer shall recognize goodwill as of theacquisition date measured as the excess of the consideration transferred over the fair value ofnet identifiable assets held according to holding proportion. Adversely, the difference mayresult in directly recognizing a gain on a purchase. Goodwill is carried out cost lessaccumulated impairment.
Goodwill relating to cash-generating units is tested for impairment periodically each year. Animpairment loss is recognized when the recoverable amount is less than the carrying amount.Impairment losses cannot be reversed once an impairment loss has been recognized.
12) Provisions
The Bank recognizes provisions only if all of the following conditions are met:
(a) An entity has a present obligation, legal or constructive, as a result of a past event;
(b) It is probable that an outflow of resources embodying economic benefits will be required tosettle the obligation; and
(c) A reliable estimate can be made of the amount of the obligation.
The Bank shall not recognize provisions for future operating losses.
Where there are a number of similar obligations the probability that an outflow will be required insettlement is determined by considering the class of obligations as a whole. Although the likelihoodof outflow for any one item may be small, it may well be probable that some outflow of resourceswill be needed to settle the class of obligations as a whole. If that is the case, a provision isrecognized.
The amount of a provision is measured subsequently as the present value of the expendituresexpected to be required to settle the obligation. The discount rate is a pre-tax rate that reflects currentmarket assessments of the time value of money and the risks specific to the liability. The deficiencyis recognized as profit or loss of the current period.
13) Revenue and expense recognition
Interest income and expense on available-for-sale assets, financial assets or liabilities at amortizedcost and financial assets and liabilities at fair value through profit or loss excluding derivatives isrecognized in the current profit or loss using the effective interest rate method.
Once a financial asset or a group of similar financial assets has been written down as a result of animpairment loss, interest income is recognized at the original effective interest rate of the financialasset applied to the impaired carrying amount.
Service fees are generally recognized on an accrual basis when the service has been provided orsignificant act performed.
126
Annual Report
14) Employee benefit
(a) Short-term employee benefit (including employee bonus, remuneration of directors andsupervisors): The Bank charges the short-term and non-discounted benefit to be paid in the nearfuture to current expenses in the periods during which services are rendered by employees.
(b) Post-employment benefit: The Bank pension plan comprises defined contribution plan anddefined benefit plan.
i. A defined contribution plan is a post-employment benefit plan under which the Bankpays fixed contributions into a separate entity and will have no legal or constructiveobligation to pay further amounts. Obligations for contributions to defined contributionpension plans are recognized as an employee benefit expense in profit or loss in theperiods during which services are rendered by employees. Prepaid contributions arerecognized as an asset to the extent that a cash refund or a reduction in future payments isavailable. Contributions to a defined contribution plan that is due more than 12 monthsafter the end of the period in which the employees render the service are discounted totheir present value.
ii. A defined benefit plan is a post-employment benefit plan under which benefit is paid toan employee on the basis of their ages, service periods and compensated salaries at thedate of retirement. The Bank recognizes actuarial gains and losses which are incurred bythe change of actual experience and actuarial assumption in other comprehensive income,and recognize pension asset or liability in balance sheets in which asset or liability is theamount of actuarial present value of defined benefit obligation deducting fair value ofplan assets. The calculation of defined benefit obligation is performed annually by anactuary using the projected unit credit method. The actuarial present value of definedbenefit obligation is calculated by discounting future cash flow at the yield rate on AAcredit rated bonds that have maturity dates approximating the terms of the obligation andthat are denominated in the same currency in which the benefits are expected to be paid.
15) Share-based payment transactions
Equity-settled share-based payments are measured at fair value at the grant date. The fair valuedetermined at the grant date of the equity-settled share-based payments is expensed over the vestingperiod, and the corresponding increase in owners' equity is recognized. The recognized compensationcost is expected to meet with the service conditions and the non-market vesting conditions of thereward adjustments. The final amounts recognized after meeting the service conditions and non-market vesting conditions are based on the reward measured. Regarding the non-vesting conditionsof share-based payments, the difference between the expected and actual results without adjustmentsare measured by the fair value determined at the grant date of the payment.
Employees are paid stock appreciation rights, which are based on the fair value measurement takenafter cash settlement. For employee payments within the period, the increase in relative cost will berecognized under liabilities. The associated liability is recognized at its current fair value determinedat each balance sheets date and at the date of settlement, with any changes in the fair valuerecognized in profit or loss of the period under employee benefit expense.
127
VI. Financial Highlights
16) Income tax
Estimation of income tax expense is based on the financial income recognized in accordance withfinancial accounting standards. Due to the differences between the income tax amount in thefinancial statements and the tax basis of asset and liability accounts, deferred income tax isrecognized by taking into account the income tax consequences and enacted tax rates for the periodsin which deferred tax liabilities or assets are expected to be settled or realized. The deferred incometax consequences attributable to taxable temporary differences are recognized as deferred taxliabilities. The deferred income tax consequences attributable to deductible temporary differences,loss carryforwards, and income tax credits are recognized as deferred tax assets. The probability ofrealization of a deferred tax asset is evaluated, and a valuation allowance account is recognizedaccordingly.
The items that are directly debited or credited to stockholders' equity do not affect pretax financialincome for the current period but are, according to the tax laws, included in taxable income, affectingcurrent income tax. Items that are directly debited or credited to stockholders' equity are not includedin taxable income, but a difference between that tax basis and the book value of the related asset orliability will arise. When the related asset or liability is recovered or settled, a taxable or deductibleamount will result. The deferred tax asset or liability is recognized in the current period.
In accordance with the R.O.C. Income Tax Act, an additional income tax at the rate of 10 percent onundistributed earnings is recognized as current income tax expense in the year of the resolution in theshareholders' meeting to distribute earnings.
The Income Basic Tax Act was announced and became effective on January 1, 2006 and amendedand became effective on January 1, 2013. The calculation of the Bank's basic income is the sum ofthe taxable income as defined in accordance with the Income Tax Act and the provisions or taxbenefits that are included in the Income Tax Act and other laws. The amount of basic tax of theBank is the amount of basic income as calculated in accordance with the preceding rules, and thenmultiplied by the tax rate prescribed by the Executive Yuan. The greater of income basic tax expenseor income tax expense is the current tax expense actually paid by the Bank.
17) Earnings per share of common stock
Earnings per share ("EPS") are computed by dividing the amount of net income (or loss) attributableto common stock outstanding for the period by the weighted-average number of issued commonshares outstanding during the period. If the number of common shares or potential common sharesoutstanding increases as a result of capitalization of retained earnings, additional paid-in capital, oremployee bonuses, or decreases as a result of a reverse capitalization due to losses, the calculation ofbasic EPS and diluted EPS for all periods presented is adjusted retrospectively. If these changesoccur after the balance sheet date but before the issuance date of the financial statements, such EPScalculations are also adjusted retrospectively. When calculating diluted EPS, the net income (or loss)attributable to common shareholders and the weighted-average number of shares outstanding shall beadjusted for the effects of all dilutive potential common shares.
128
Annual Report
(5) Primary Sources of Significant Accounting Judgments, Estimates and Assumptions Uncertainty
When preparing the individual financial statements in accordance with the Regulations Governing thePreparation of Financial Reports by Public Banks, Regulations Governing the Preparation of FinancialReports by Securities Firms and other related regulations, management requires to make judgments,estimates, and assumptions that affect the adoption of accounting policies, reported amounts of assets,liabilities, revenues, and expenses. Actual results could differ from these estimates.
The assumptions and estimates by the Bank are best estimates, which are made following IFRSs asendorsed by the FSC. They are based on past experience and other factors, including expectations for thefuture, and are continuously evaluated.
Accounting policies and management judgments for certain account items have significant impacts onfinancial statements of the Bank.
1) Impairment loss on loans
When the Bank decides whether to recognize impairment loss, they mainly decide if there are anyobservable evidence indicating possible impairment. The evidence may include observableinformation indicating unfavorable changes in debtor payment status, or sovereign or local economicsituation related to debt payment in arrears. When analyzing expected cash flow, the estimates by themanagement are based on past losses experience on assets of similar credit risk characteristics. TheBank periodically reviews methods and assumptions behind the amount and schedule of expectedcash flow, to reduce the difference between expected and actual loss. Please refer to note 6(7) forimpairment loss on loans.
2) Valuation of financial instruments
Fair value of financial instruments is determined using valuation techniques when there is no activemarket or quoted price. Under this circumstance, fair value is assessed through relevant observableinformation or model. If there is no observable market parameters, fair value of financial instrumentscan be evaluated based on appropriate assumptions. When valuation technique is used to determinefair value, all models shall be calibrated to ensure that all outputs reflect the actual data and themarket price. Valuation techniques that rely to a greater extent on unobservable inputs require ahigher level of management judgment to calculate a fair value than those based wholly on observableinputs.
The valuation techniques are adopted as much as possible from observable data. However, for credit risk(risk between itself and counterparty), management shall estimate volatility and correlation.
(6) Disclosures of Significant Account
1) Cash and cash equivalents
December 31,2013
December 31,2012
January 1,2012
Cash on hand $ 4,373,127 5,096,769 5,728,508
Deposits with other banks 19,796,089 447,927 767,217
Deposits with other banks-affiliates 5,104,883 1,153,076 4,973,810
Total $ 29,274,099 6,697,772 11,469,535
129
VI. Financial Highlights
2) Due from the Central Bank and call loans to banks
Pursuant to the Banking Law, the "required reserve" and "interbank settlement accounts" aredeposited with the Central Bank.
"Required reserve" is calculated at prescribed rates on a monthly basis on the average balances ofvarious deposit accounts and no interest is accrued on the checking account and the foreign currencyaccount. Balances can be withdrawn on demand. Demand account accrues interests, other than themonthly adjustments to the account, no withdrawal is allowed.
3) Financial instruments at fair value through profit or loss
The financial assets measured at fair value through profit or loss of the Bank were as follows:
A fair value hedge is the hedging of the hedged items exposure to change in fair value ofrecognized fixed-rate assets or liabilities that are attributable to particular hedged risks thatcould affect profit or loss. As of December 31, 2013 and 2012 and January 1, 2012, marked-to-market adjustments of hedged items and the corresponding hedging instruments (recordedunder other financial assets or liabilities, net) accounts as fair value hedge were as follows:
For the years ended December 31, 2013 and 2012, net losses on the hedging derivativefinancial instruments listed above amounted to $179,202 thousand and $179,261 thousand,respectively, and net gains from the hedged risk of the hedged items amounted to $157,182thousand and $152,491 thousand, respectively.
(b) Cash flow hedge
The Bank currently holds long-term floating rate loans with interest rate risks and hedginginterest rate swap contracts. The future cash flows arising from the hedging of these financialderivative instruments are caused by the changes in the interest rate from cash flow risk.
Financial instruments Fair value
Hedged itemsdesigned as hedging
instrumentsDecember31, 2013
December31, 2012
January 1,2012
Discounts and loans-floatinginterest rate
Interest rate swap $ 6,788 68,651 157,279
5) Securities purchased under resell agreements
December 31,2013
December 31,2012
January 1,2012
Securities purchased under resell agreement $ 1,950,000 3,402,039 8,456,414Face value of securities $ 1,950,000 3,400,000 8,530,700
Subtotal 365,948,620 355,613,683 350,298,762Premium adjustments on discount and loans 88,600 221,704 85,739Less: allowance for bad debts 5,274,616 5,448,341 4,233,498Total $ 360,762,604 350,387,046 346,151,003
As of December 31, 2013 and 2012, and January 1, 2012, the Bank's long term loan with floating ratementioned above has adopted cash flow hedge in order to reduce the impact of cash flow that wasaffected by interest rate fluctuation.
Allowance for bad debt is provided by evaluating the risk of non recovery of specific outstandingloans, and the risk of non recovery is assessed by the probability of default.
The movements of allowance for bad debts were as follows:
2013Individual
assessment ofimpairment
Portfolioassessment ofimpairment Total
Beginning balance of January 1, 2013 $ 3,201,818 2,469,908 5,671,726Add: provision for bad debts (reversal) 1,630,227 (37,555) 1,592,672
recovery from written-off loans 779,522 - 779,522Less: charge-off and temporary payments 2,180,164 - 2,180,164
exchange rate movements and other 262,893 18 262,911Ending balance of December 31, 2013 $ 3,168,510 2,432,335 5,600,845
2012Individual
assessment ofimpairment
Portfolioassessment ofimpairment Total
Beginning balance of January 1, 2012 $ 2,338,688 2,363,885 4,702,573Add: provision for bad debts 1,957,413 89,688 2,047,101
recovery from written-off loans 957,854 - 957,854Less: charge-off and temporary payments 1,785,614 - 1,785,614
exchange rate movements and others 266,523 (16,335) 250,188Ending balance of December 31, 2012 $ 3,201,818 2,469,908 5,671,726
133
VI. Financial Highlights
Discounts and loans included in the total amounts of impairment assessment to determine theallowance for bad debts were as follows:
December 31, 2013
Item
Discounts and loansand accounts
receivableAllowance for
bad debtsWith the objective evidence of impairment Individual
assessment of impairment
$ 5,457,382 3,168,510
Portfolio assessment of impairment 10,758,798 262,676
Without the objective evidence of impairment Portfolio assessment of impairment 382,818,117 2,169,659
Total $ 399,034,297 5,600,845
December 31, 2012
Item
Discounts and loansand accounts
receivableAllowance for
bad debtsWith the objective evidence of impairment Individual
assessment of impairment
$ 5,255,110 3,201,818
Portfolio assessment of impairment 12,751,831 299,088
Without the objective evidence of impairment Portfolio assessment of impairment 375,571,952 2,170,820
Total $ 393,578,893 5,671,726
January 1, 2012
Item
Discounts and loansand accounts
receivableAllowance for
bad debtsWith the objective evidence of impairment Individual
assessment of impairment
$ 5,295,353 2,338,688
Portfolio assessment of impairment 12,328,890 592,760
Without the objective evidence of impairment Portfolio assessment of impairment 367,350,026 1,771,125
Total $ 384,974,269 4,702,573
As of December 31, 2013 and 2012, and January 1, 2012, the amounts of outstanding loans withinterest charges suspended amounted to $1,121,421 thousand, $1,204,944 thousand and $530,267thousand, respectively. The amounts of interest not accrued derived from the aforementioned loanswere $5,500 thousand, $4,213 thousand and $2,203 thousand, respectively.
134
Annual Report
8) Available-for-sale financial assets net
December 31,2013
December 31,2012
January 1,2012
Negotiable certificates of deposit $ 186,508,439 177,852,550 178,865,781
Marked-to-market adjustments for hedged assets included in the above balance $ 735 3,088 26,641
In December 2005, the carrying value of $12,005,275 thousand of the mortgage loans was entrustedby the Bank to Deutsche Bank AG, Taipei Branch for issuance of beneficiary certificates viasecuritization. Deutsche Bank AG, Taipei Branch issued both an "Investor Certificate" and a "SellerCertificate" amounting to $10,204,484 thousand and $1,800,791 thousand, respectively, at faceamount. The duration period of the first beneficiary certificates is from December 20, 2005, to July20, 2027.
In September 2006, the carrying value of $13,234,322 thousand of the mortgage loans was entrustedby the Bank to Deutsche Bank AG, Taipei Branch for issuance of beneficiary certificates viasecuritization. Deutsche Bank AG, Taipei Branch issued both an "Investor Certificate" and a "SellerCertificate" amounting to $10,322,771 thousand and $2,911,551 thousand, respectively, at faceamount. The duration period of the second beneficiary certificates is from September 2006 to thetrust distribution date in January 2028.
The Bank redeemed their first and second mortgage loan securitization on October 9, 2012 andDecember 19, 2011, respectively.
135
VI. Financial Highlights
9) Investment measured by equity method and financial assets carried at cost net
December 31, 2013 December 31, 2012Percentage ofownership %
Investmentcost
Bookvalue
Percentage ofownership %
Investmentcost
Bookvalue
Investment measured by equity method:Standard Chartered Life Insurance Agency Co., Ltd. 100.00 $ 21 367,190 100.00 21 345,889Taiwan Standard Chartered Insurance Agency Co., Ltd. 100.00 368 26,321 100.00 368 23,528
$ 389 393,511 389 369,417
Financial assets carried at cost (recognized as other financial assets):
Fuji Enterprise Management Consulting Co., Ltd. - $ - - 0.99 - -Taiwan Small and Medium Enterprises Development Corp. 4.84 29,000 29,000 4.84 29,000 29,000Financial Information Service Co., Ltd. 1.14 45,500 45,500 1.14 45,500 45,500Taipei Forex Inc. 3.18 6,673 6,673 3.18 6,673 6,673TSC Bio Venture Management, Inc. 5.00 15,188 15,188 5.00 15,188 15,188Liyu Venture Investment, Inc. 4.76 8,549 8,549 4.76 8,549 8,549Windance Co., Ltd. 2.73 188,500 188,500 2.73 188,500 188,500Taiwan Asset Service Corporation 2.94 50,000 50,000 2.94 50,000 50,000Yang Guang Asset management Company
For the years ended December 31, 2013 and 2012, the Bank recognized share of profit of associatesand joint ventures accounted for using equity method of $323,219 thousand and $299,125 thousand,respectively. For the years ended December 31, 2013 and 2012, the cash dividends from associatesunder the equity method were $299,125 thousand and $209,287 thousand, respectively.
For the years ended December 31, 2013 and 2012, the cash dividends from financial assets carried atcost under net other non-interest income were $16,548 thousand and $16,757 thousand, respectively.
Fuji Enterprise Management Consulting Co., Ltd. completed the liquidation process on April 24,2013. The distribution of remaining assets amount to $1,090 thousand. The cost of the investment isat $0 thousand, the full amount is recognized as gain on investment under net other non-interestincome.
Taiwanpay Corporation began the process of liquidation on March 30, 2012 and paid back $987thousand for the company's investment in its shares. On June 13, 2012, Taiwanpay Corporationwound up and completed the liquidation process. The distribution of remaining assets amounts to$421 thousand and paid back $23 thousand for the Bank's investment in its shares. The cost of theinvestment is at $0 thousand, the full amount is recognized as gain on investment under net othernon-interest income. TSC Bio Venture Management Inc. bought back capital on July 31, 2012 with acapital reduction rate of 25% and paid the company $5,062 thousand for the Company's investmentin its shares at $10 per share. Liyu Venture Investment Inc. bought back capital on July 31, 2012with a capital reduction rate of 15.19% and paid the company $1,509 thousand for the company'sinvestment in its shares, and a loss on investment of $22 thousand was recognized. On 2013, thecompany recognized impairment losses of $164 thousand from Liyu Venture Investment Inc..
On 2013 and 2012, the Bank recognized impairment loss of $164 thousand and $0 thousand(recognized as assets impairment loss).
for the first 3 years is 4.25%, and 4.5% for the last 2 years; maturity date: July 19, 2007
$ 1,000 1,000
94-1 No maturity date, interest payable semi annually, based on the average one year regular floating rate of the nine largest banks plus 1.493%
2,400 2,400
94-2 No maturity date, interest payable semi annually, based on the average one year regular floating rate of the nine largest banks plus 1.493%
500 1,500
98-1 10 year term, interest payable quarterly, annual interest rate for the first 5 years is 2.9% and 3.4% for the last 5 years; maturity date: October 28, 2019
10,000,000 10,000,000
98-2 No maturity date, interest payable quarterly, annual interest rate from issuance date to June 11, 2015, is USD 3M LIBOR plus 3.33%, and USD 3M LIBOR plus 4.33% from June 11, 2015
4,478,036 4,355,292
98-3 No maturity date, interest payable quarterly, annual interest ratefrom issuance date to June 11, 2015, is USD 3M LIBOR plus3.33%, and USD 3M LIBOR plus 4.33% from June 11, 2015
4,478,036 4,355,292
100-1A 2 year term, interest payable quarterly, annual interest rate is 1.03%; maturity date: May 19, 2013
- 800,000
100-1B 3 year term, interest payable quarterly, annual interest rate is 1.17%; maturity date: May 19, 2014
100,000 100,000
100-1C 4 year term, interest payable quarterly, annual interest rate is 1.32%; maturity date: May 19, 2015
650,000 650,000
100-1D 5 year term, interest payable quarterly, annual interest rate is 1.45%; maturity date: May 19, 2016
6,150,000 6,150,000
100-1E 6 year term, interest payable quarterly, annual interest rate is 1.51%; maturity date: May 19, 2017
1,000,000 1,000,000
100-1F 7 year term, interest payable quarterly, annual interest rate is 1.60%; maturity date: May 19, 2018
2,550,000 2,550,000
100-1G 2 year term, interest payable quarterly, TWD 90 day CP interest rate; maturity date: May 19, 2013
- 3,700,000
100-1H 5 year term, interest payable quarterly, TWD 90 day CP interest rate; maturity date: May 19, 2016
400,000 400,000
100-1I 7 year term, interest payable quarterly, TWD 90 day CP interest 4,000,000 4,000,000 rate; maturity date: May 19, 2018
100-2 5 year term, interest payable quarterly, annual interest rate is 1.451%; maturity date: June 8, 2016
500,000 500,000
100-3A 2 year term, interest payable quarterly, annual interest rate is 1.04%; maturity date: June 23, 2013
- 950,000
100-3B 2 year term, interest payable quarterly, TWD 90 day CP interest rate; maturity date: June 23, 2013
- 700,000
100-3C 5 year and 3 month term, interest payable quarterly, annual interest rate is 1.40%; maturity date: September 23, 2016
1,100,000 1,100,000
141
VI. Financial Highlights
Bond Conditions for issuanceDecember 31,
2013December 31,
2012100-4A 3 year term, interest payable quarterly, annual interest rate is
1.32%; maturity date: June 29, 2014$ 2,000,000 2,000,000
100-4B 2 year term, interest payable quarterly, TWD 90 day CP interest rate plus 0.15% interest rate; maturity date: June 29, 2013
- 400,000
100-4C 3 year term, interest payable quarterly, TWD 90 day CP interest rate plus 0.15% interest rate; maturity date: June 29, 2014
1,000,000 1,000,000
100-4D 10 year term, interest payable quarterly, TWD 90 day CP interest rate plus 0.15% interest rate; maturity date: June 29, 2021
2,000,000 2,000,000
101-1A 2 year term, interest payable quarterly, annual interest rate is 1.05%; maturity date: January 17, 2014
7,000,000 7,000,000
101-1B 2 year term, interest payable quarterly, TWD 90 day CP interest rate plus 0.25% interest rate; maturity date: January 17, 2014
700,000 700,000
101-1C 3 year term interest payable quarterly, annual interest is 1.09%; maturity date: January 17, 2015
600,000 600,000
101-2 2 year term, interest payable annually, annual interest 6,700,000 6,700,000 rate is 1.05%; maturity date: May 24, 2014
201291-1A 5 year term, interest payable semi annually, annual interest rate for the first 3 years
is 4.25%, and 4.5% for the last 2 years; maturity date: July 19, 2007$ 1,000
94-1 No maturity date, interest payable semi annually, based on the average one yearregular floating rate of the nine largest banks plus 1.493%
4,100
94-2 No maturity date, interest payable semi annually, based on the average one yearregular floating rate of the nine largest banks plus 1.493%
5,900
98-1 10 year term, interest payable quarterly, annual interest rate for the first 5 years is2.9% and 3.4% for the last 5 years; maturity date: October 28, 2019
10,000,000
98-2 No maturity date, interest payable quarterly, annual interest rate from issuance dateto June 11, 2015, is USD 3M LIBOR plus 3.33%, and USD 3M LIBOR plus4.33% from June 11, 2015
4,540,436
98-3 No maturity date, interest payable quarterly, annual interest rate from issuance dateto June 11, 2015, is USD 3M LIBOR plus 3.33%, and USD 3M LIBOR plus4.33% from June 11, 2015
4,540,436
100-1A 2 year term, interest payable quarterly, annual interest rate is 1.03%; maturity date:May 19, 2013
800,000
100-1B 3 year term, interest payable quarterly, annual interest rate is 1.17%; maturity date:May 19, 2014
100,000
100-1C 4 year term, interest payable quarterly, annual interest rate is 1.32%; maturity date:May 19, 2015
650,000
100-1D 5 year term, interest payable quarterly, annual interest rate is 1.45%; maturity date:May 19, 2016
6,150,000
100-1E 6 year term, interest payable quarterly, annual interest rate is 1.51%; maturity date:May 19, 2017
1,000,000
100-1F 7 year term, interest payable quarterly, annual interest rate is 1.60%; maturity date:May 19, 2018
2,550,000
100-1G 2 year term, interest payable quarterly, TWD 90 day CP interest rate; maturity date:May 19, 2013
3,700,000
142
Annual Report
Bond Conditions for issuanceJanuary 1,
2012100-1H 5 year term, interest payable quarterly, TWD 90 day CP interest rate; maturity date:
May 19, 2016$ 400,000
100-1I 7 year term, interest payable quarterly, TWD 90 day CP interest rate; maturity date:May 19, 2018
4,000,000
100-2 5 year term, interest payable quarterly, annual interest rate is 1.451%; maturity date:June 8, 2016
500,000
100-3A 2 year term, interest payable quarterly, annual interest rate is 1.04%; maturity date:June 23, 2013
950,000
100-3B 2 year term, interest payable quarterly, TWD 90 day CP interest rate; maturity date:June 23, 2013
700,000
100-3C 5 year and 3 month term, interest payable quarterly, annual interest rate is 1.40%;maturity date: September 23, 2016
1,100,000
100-4A 3 year term, interest payable quarterly, annual interest rate is 1.32%; maturity date:June 29, 2014
2,000,000
100-4B 2 year term, interest payable quarterly, TWD 90 day CP interest rate plus 0.15%interest rate; maturity date: June 29, 2013
400,000
100-4C 3 year term, interest payable quarterly, TWD 90 day CP interest rate plus 0.15%interest rate; maturity date: June 29, 2014
1,000,000
100-4D 10 year term, interest payable quarterly, TWD 90 day CP interest rate plus 0.15% 2,000,000 interest rate; maturity date: June 29, 2021
47,091,872Marked-to-market adjustment on hedged items 420,298Total $ 47,512,170
Advance received from customers $ 281,196 355,950 474,943Deferred income 70,028 77,645 107,400Guarantee deposits received 49,254 124,037 156,360Tax payable 435,538 393,582 302,720Derivatives collateral 1,518,323 487,613 362,871Other 17,349 163,805 68,721
$ 2,371,688 1,602,632 1,473,015
143
VI. Financial Highlights
20) Employee benefits
(a) Defined contribution plan
The Bank's defined contribution plan follows the Labor Pension Act of the R.O.C. and makesmonthly cash contributions to the employees' individual pension accounts at the Bureau ofLabor Insurance at the rate of 6% of the employees' monthly salary. Under this plan, the Bankhas no legal or constructive obligation to make other payments after the Bank makes the fixedamount of contribution to the Bureau of Labor Insurance.
For the years ended December 31, 2013 and 2012, the pension expense under definedcontribution plan of the Bank amounted to $166,538 thousand and $161,125 thousand,respectively.
(b) Employee benefits provision
December 31,2013
December 31,2012
January 1,2012
Defined benefits plan $ 1,724,645 1,836,169 1,651,333
The reconciliation between present value of the Bank's defined benefits obligation and fairvalue of defined benefits plan assets were as follows:
December 31,2013
December 31,2012
Present value of defined benefits obligation $ 3,221,111 3,404,040Less: fair value of defined benefits plan assets 1,496,466 1,567,871Liability recognized in balance sheets $ 1,724,645 1,836,169
The Bank adopted the defined benefit plan, which contributes 2.2% of eligible employees'monthly salary to the retirement reserve trust account at Bank of Taiwan. Employees' pensionis calculated based on the employees' years of service under the Labor Standard Act and theemployees' final average monthly salary at the time of retirement. Final average monthlysalary refers to the average 6-month monthly salary preceding retirement, including basicmonthly salary, meal allowance, car allowance, shift allowance, transportation allowance, salesincentives, and overtime payment.
i) The percentage of pension assets were as follows:
The change in defined benefit obligation for the years 2013 and 2012 were as follows:
2013 2012DBO at January 1 $ 3,404,040 3,227,856Benefit paid from plan assets (115,617) (29,891)Current service cost and interest cost 193,464 192,285Actuarial (gain) loss (120,294) 104,519Benefits paid directly (140,482) (90,729)DBO at December 31 $ 3,221,111 3,404,040
iii) Change in plan assets
The change in plan assets for the years 2013 and 2012 were as follows:
2013 2012Fair value of plan assets at January 1 $ 1,567,871 1,554,651Contributions 24,623 28,079The experience adjustment for fair value of plan assets (3,801) (8,588)Expected return on plan assets 23,390 23,620Plan of benefit payments (115,617) (29,891)Fair value of plan assets at December 31 $ 1,496,466 1,567,871
iv) Recognized as profit and loss cost
The recognized as profit and loss cost for the years 2013 and 2012 were as follows:
2013 2012Current service cost $ 153,865 148,527Interest cost 39,599 43,758Actual return on plan assets (23,390) (23,620)
$ 170,074 168,665
v) Recognized as other comprehensive income of actuarial gain and loss
The recognized as other comprehensive income of actuarial gain and loss for the years2013 and 2012 were as follows:
2013 2012Cumulated surplus at January 1 $ 134,979 -The experience adjustment for fair value of defined benefits plan 42,929 (2,708)The experience adjustment for fair value of plan assets 3,801 30,460The change of actuarial assume for plan obligations (163,223) 107,227Cumulated surplus at December 31 $ 18,486 134,979
145
VI. Financial Highlights
vi) Primary actuarial respectively assumptions
2013 2012Defined benefits plan discount rate %1.20 %1.40Expected rate of return on plan assets %2.00 %1.50Incremental rate of future compensation levels %3.50 %3.50
vii) The experience adjustment of historical information
December 31,2013
December 31,2012
January 1,2012
Defined benefit obligation $ (3,221,111) (3,404,040) (3,227,856)Fair value of plan assets 1,496,466 1,567,871 1,576,523Fair value of plan obligation, net $ (1,724,645) (1,836,169) (1,651,333)The experience adjustment for fair value of defined benefits plan $ 42,929 (2,708) 95,728The experience adjustment for fair value of plan assets $ 3,801 8,588 21,872The change of actuarial assume for plan obligations $ (163,223) 107,227 (29,971)
21) Income tax
The Bank adopts a 17% statutory tax rate and calculates the basic income tax based on the IncomeBasic Tax Act.
For the years ended December 31, 2013 and 2012, the income tax expense and related accounts wereas follows:
2013 2012Current income tax benefit $ (540) (7,084)Deferred income tax expense 249,373 264,12510% surtax on undistributed earnings - 149,532Basic income tax 139,033 171,854Income tax expense $ 387,866 578,427
As of December 31, 2013 and 2012, and January 1, 2012, the current tax assets of the Bankamounted to $111,724 thousand, $115,818 thousand and $224,890 thousand, respectively.
The differences between the expected income tax at statutory rates and the income tax expense wereas follows:
2013 2012Income tax from profit before tax at statutory rate $ 472,417 619,008Permanent difference (257,614) (395,265)10% surtax on undistributed earnings - 149,532Prior-year income tax adjustments (8,704) (7,084)Basic income tax 139,033 171,854Other adjustments per tax regulation 42,734 40,382Income tax expense $ 387,866 578,427
146
Annual Report
The components of deferred income tax (benefits) expenses recognized as other comprehensiveincome were as follows:
2013 2012Unrealized fair value (losses) gains on available-for-sale financial assets $ (32,457) 9,908Fair value losses on effective portion of cash flow hedges (52,010) (11,612)Defined benefits plan actuarial gains and losses 19,805 (22,946)Total $ (64,662) (24,650)
The components of deferred income tax expenses (benefits) were as follows:
2013 2012Unrealized interest income from financial assets $ (26,567) 26,608
Bad debt expense and guarantee liability 28,996 (224,820)
Depreciation expense (1,733) (3,604)
Amortization of goodwill 53,653 53,652
Impairment loss on assets 4,503 5,421
Expenses from share-based payments 8,029 (1,836)
Employee benefits 16,564 (8,474)
Provisions 1,257 (13,775)
Deferred income 67,128 61,842
Loss carryforwards 97,543 369,111
$ 249,373 264,125
The Bank's temporary difference of deferred tax asset components, based on the 17% tax rate forDecember 31, 2013 and 2012, and January 1, 2012 were as follows:
December 31,2013
December 31,2012
January 1,2012
Deferred tax assets:
Bad debt expense and guarantee liability
provision $ 404,747 433,743 208,923
Depreciation expense 17,230 15,497 11,893
Impairment loss on assets 37,706 42,209 47,630
Expenses from share-based payments 30,506 38,535 36,699
Employee benefits 293,188 329,557 298,137
Provisions 12,679 13,936 161
Deferred income 290,578 357,706 419,548
Loss carryforwards 1,311,257 1,408,800 1,777,911
Total $ 2,397,891 2,639,983 2,800,902
147
VI. Financial Highlights
December 31,2013
December 31,2012
January 1,2012
Deferred tax liabilities:
Unrealized interest revenue on financial assets $ 75,134 101,701 75,093
Amortization of goodwill 268,264 214,611 160,959
Land value increment tax 137,179 152,375 152,375
Unrealized gain on available-for-sale financial
assets 136,841 169,298 159,390
Unrealized (loss) gain on cash flow hedge (24,631) 27,379 38,991
Total $ 592,787 665,364 586,808
The movements of deferred tax items were as follows:
2013 2012Beginning balance $ 1,974,619 2,214,094Recognized in current period profit and loss (249,373) (264,125)Land value increment tax 15,196 -Recognized in other comprehensive income 64,662 24,650Ending balance $ 1,805,104 1,974,619
The income tax returns of the prior years have been assessed up to the year 2011.
22) Information of imputation credit account
The balances of the imputation credit account (ICA) were as follows:
The accumulated earnings were all generated after 1998, which is according to RegulationsGoverning the Preparation of Financial Reports and the IFRSs as endorsed by the FSC.
2013 (estimated) 2012 (actual)Tax creditable ratios of distribution of retained earnings to R.O.C. residents 2.76 % 1.33 %
Preceding information of imputation credit account is according with the Treasury Department inOctober 17, 2013 Tai Tsai Shui No.10204562810 amount of processing requirements.
23) Stockholders’ equity
(a) Capital
As of December 31, 2013, the Bank's authorized capital was $30,000,000 thousand,representing 3,000,000 thousand shares with par value of NTD 10 per share, and issued capital$29,105,720 thousand, representing 2,910,572 thousand common shares.
148
Annual Report
(b) Capital surplus
The R.O.C. Company Act as amended in January 2012 requires capital surplus to be used tooffset an accumulated deficit before capitalization to shareholders' equity as realized capitalsurplus or distribution of cash dividends. The aforementioned realized capital surplus includesthe proceeds received in excess of the par value of common stock issued and any amountsdonated to the Bank. In accordance with "Regulations Governing the Offering and Issuance ofSecurities", the amount of capital surplus capitalized each year may not exceed 10 percent(10%) of the Bank's issued share capital.
(c) Legal reserve
Whenever the Bank generates a profit in accordance with "The Banking Act of The Republic ofChina". A bank, at the time of distributing its earnings for each fiscal year, shall set aside thirtypercent (30%) of its after tax earnings as a legal reserve. However, unless and until theaccumulated legal reserve equals the Bank's paid in capital, the maximum cash profits whichmay be distributed shall not exceed fifteen percent (15%) of the Bank's paid in capital. Inaddition to the legal reserve, a special reserve can be appropriated and approved by thestockholders' meeting. The board of directors approved the distribution of the 2012 and 2011earnings on May 31, 2013 and June 29, 2012, and appropriated legal reserve of $901,004thousand and $2,511,935 thousand, respectively.
(d) Special reserve
In terms of the Financial Supervisory Commission, Executive Yuan, Jin Guan Zheng Fa No.1010012865 dated April 6, 2012, the first time a public company adopts International FinancialReporting Standards ("IFRS"), it must set aside special reserves equal in amounts to thoseportions of unrealized revaluation gains and cumulative translation adjustments (both of whichare sub accounts under booked shareholder equity) that is shifted to retained earnings as a resultof the claiming of an IFRS 1 exemption. However, if the increment of retained earningsresulted from first time adoption of IFRS is not sufficient at the date of transition; the companycould recognize that incremental amount only. When a company subsequently uses, disposesof, or reclassifies the assets in question, a proportional amount of its originally set aside specialreserve may be shifted back to distributable earnings. In accordance with that regulation, underthe situation of not having sufficient increment of retained earnings resulted from first timeadoption of IFRS, the Bank can shift that incremental amount $239,413 thousand to specialreserves.
As result from the disposal of the related asset, an amount of $27,741 thousands was releasedfrom the special reserve recognized on the first time adoption of the International FinancialReporting Standards and transferred to unappropriated retained earnings.
149
VI. Financial Highlights
(e) Other item in stockholders' equity
Changes in the Bank's other items in stockholders' equity were as follows:
Unrealized gainsand losses on
available-for-salefinancial assets
Unrealizedgains (loss)
on cash flowhedge Total
January 1, 2013 $ 851,045 133,675 984,720Available-for-sale financial assets net
Cash flow hedgeUnrealized gain (loss) - (56,692) (56,692)
December 31, 2012 $ 851,045 133,675 984,720
(f) Dividend policy and appropriation of earnings
Whenever the Bank generates a profit, 30 percent of its net income is appropriated as legalreserve after the deduction of income tax. Any special reserve would be set aside if necessaryfor the Bank's ongoing operations. The remaining balance, if any, is distributed as follows:
i. Shareholders' dividends and bonus: 99.99%
ii. Employee bonus: 0.01%
The appropriation of the aforementioned special reserve is required by law, or is proposed bythe board of directors, depending on the needs for business operations.
The board of directors can propose to the annual shareholders' meeting a resolution regardingthe proportion of employee bonus for distribution if necessary.
On May 31, 2013 and June 29, 2012, the board of directors, representing shareholders,approved the distribution of retained earnings and distributed cash dividends for 2012 and 2011were as follows:
Cash dividends of ordinary share 2,690,000 4,365,858
Total $ 3,591,004 6,877,793
150
Annual Report
The estimated amount of staff bonus accrued were based on the possibility of bonusdistribution and estimated bonus distribution and resolution approved by the board of directors.Nevertheless, in the event of difference in the amount actually distributed upon resolution ofshareholders' meeting and the estimated figures, this difference shall be identified as changes inaccounting estimate and recognized as profit or loss for the current period.
The board of directors approved the distribution of 2012 earnings on May 31, 2013 anddistributed bonus to employees for $210 thousand; the difference between the actual andestimated distributed bonus shall be treated as changes in accounting estimate and recognizedas profit or loss in 2013. Furthermore, the board of directors approved the distribution of 2011earnings on June 29, 2012, and distributed bonus to employees for $586 thousand; thedifference between the actual and estimated distributed bonus shall be treated as changes inaccounting estimate and recognized as profit or loss in 2012.
The relevant information about earnings distribution or deficit compensation approved by theboard of directors can be accessed through Market Observation Post System or other sites.
24) Share-based payments
Standard Chartered PLC Group (the SC PLC Group) has established five main share-based paymentschemes for its directors and employees. On December 31, 2013 and 2012, the share-based paymentschemes adopted by the Bank were as follows:
(a) All Employee Sharesave Plan (Original: International Sharesave Schemes "ISS")
Under the Sharesave plans, employees have the choice of opening a savings contract. Within aperiod of six months after the third or fifth anniversary, as appropriate, employees maypurchase ordinary shares in the Group at a discount of up to 20 percent on the share price at thedate of invitation. There are no performance conditions attached to options granted under theSharesave plans.
The option movements of the AESP were as follows:
2013 2012Beginning balance 529,534 576,342
Add: granted - 182,838
Less: exercised 63,334 144,161
lapsed 78,903 85,485
Ending balance 387,297 529,534
For the years ended December 31, 2013 and 2012, the costs of the AESP charged to profits orlosses were $27,361 thousand and $27,936 thousand, respectively, recognized as operatingexpenses employees' benefit costs.
Options under the Sharesave plans are valued using a binomial option-pricing model. The samefair value is applied to all employees including directors. The fair value per option granted andthe assumptions used in the calculation are as follows:
151
VI. Financial Highlights
2013Granted date October 9Share price at granted date 14.36
Execution price 11.78
Period from granted date (year) 3
Expected volatility (%) 26.80
Expected share option period (year) 3.33
Risk free rate (%) 0.80
Expected dividend (earning rate) (%) 4.30
Fair value 3.30
2012Granted date October 11 October 1Share price at granted date 13.95 14.35
Execution price 11.40 11.40
Period from granted date (year) 3 3
Expected volatility (%) 29.80 30.00
Expected share option period (year) 3.33 3.33
Risk free rate (%) 0.40 0.40
Expected dividend (earning rate) (%) 3.10 3.10
Fair value 3.28 3.53
The expected volatility is based on historical volatility over the last three to five years, or threeto five years prior to grant. The expected life is the average expected period to exercise. Therisk free rate of return is the yield on zero-coupon UK Government bonds of a term consistentwith the assumed option life. The expected dividend yield is based on historical dividend forthree years prior to grant.
(b) Restricted Share Award (Original: Restricted Share Scheme)
Restricted share awards which are made outside of the annual performance process, asadditional incentive or retention mechanisms. These awards vest in equal installments on thesecond and the third anniversaries of the award date. In line with similar plans operated by ourcompetitors, restricted share awards are not subject to an annual limit and do not have anyperformance conditions.
152
Annual Report
The option movements of the RSA were as follows:
2013 2012Beginning balance 127,704 254,648
Add: granted - 1,454
Less: exercised 57,753 95,518
lapsed 14,485 32,880
Ending balance 55,466 127,704
For the years ended December 31, 2013 and 2012, the costs of the RSA charged to profits orlosses were $21,486 thousand and $45,304 thousand, respectively, recognized as operatingexpenses employee's benefit.
The dividend yield assumption is based on a historical average over a period commensuratewith this ‘average’ period until vesting, or over one year if the average period until vesting isless than one year.
2013Granted date December 17 September 18 June 19 March 11Share price at granted date 13.04 15.14 14.62 18.22Period from granted date (year) 2/3 1/2/3/4 2/3 1/2/3/4 2/3 1/2/3/4 2/3 1/2/3/4Expected dividends (earning rate) (%) 4.90 4.60 4.60 4.60Fair value 11.59 13.54 13.05 16.27
2012Granted date December 21 September 19 June 20 March 13Share price at granted date 15.84 14.82 14.17 15.65Period from granted date (year) 2/3 1/2/3/4 2/3 2/3 2/3Expected dividends (earning rate) (%) 3.70 3.00 3.80 3.80Fair value 14.46 13.76 12.91 14.26
(c) Executive Share Option Scheme
The Executive Share Option Scheme (ESOS) was designed for executive directors and selectedsenior managers and there remain outstanding vested awards. Executive share options topurchase ordinary shares in Standard Chartered PLC were exercisable after the third, but beforethe tenth, anniversary of the date of grant subject to EPS performance criteria being satisfied.The exercise price per share is the share price at the date of grant.
The option movements of the ESOS were as follows:
2013 2012Beginning balance - 6,233
Less: exercised - 6,233
Ending balance - -
There were no costs of the ESOS charged to profit or loss recognized for the years endedDecember 31, 2013 and 2012.
153
VI. Financial Highlights
(d) Performance Share Award (Original: Performance Share Plan)
Performance shares are subject to a combination of three performance measures, TotalShareholder Return (TSR), Earnings Per Share (EPS) and Return on Risk Weighted Assets(RoRWA). The weighting between the three elements is split equally, one third of the awarddepending on each measure, assessed independently. Performance share awards for executivedirectors are currently subject to an annual limit of 400 per cent of base salary in face valueterms and delivered as nil cost options.
The option movements of the PSA (PSP) were as follows:
For the years ended December 31, 2013 and 2012, the costs of the PSA (PSP) charged to profitor loss were $5,126 thousand and $5,372 thousand, respectively, recognized as operatingexpenses employees' benefits.
The fair value of the TSR component is derived by discounting a third of the award by the lossof expected dividends over the vesting period together with the probability of meeting the TSRcondition, which is calculated by the area under the TSR vesting schedule curve. The EPS fairvalue is derived by discounting one third of the award respectively by the loss of expecteddividends over the vesting period. The same approach is applied to calculate the RoRWA fairvalue for one third of the award. In respect of the EPS and RoRWA components, the number ofshares expected to vest is adjusted for actual performance when calculating the share basedpayment charge for the year. The same fair value applies to all employees including directors.
2013Granted date September 18 June 19 March 11Share price at granted date 15.14 14.62 18.22Period from granted date (year) 3 3 3Expected dividends (earning rate) (%) 4.60 4.10 4.10Fair value (earning per share) 4.43 4.32 5.38Fair value (return on risk weighted
2012Granted date December 21 September 19 June 20 March 13Share price at granted date 15.84 14.82 14.17 15.65Period from granted date (year) 3 3 3 3Expected dividends (earning rate) (%) 3.73 3.15 3.50 3.50Fair value (earning per share) 4.73 4.50 4.26 4.71Fair value (return on risk-weighted
The dividend yield assumption is based on a historical average over a period commensuratewith this period until vesting, or over 1 year if the period until vesting is less than 1 year.
154
Annual Report
(e) Supplementary Restricted Share Award (Original: Supplementary Restricted Share Scheme)
The Supplementary Restricted Share Scheme (SRSS) is now replaced by the Restricted ShareAward. There remain unvested and vested awards outstanding under this plan. Awards weregenerally in the form of nil cost options and do not have any performance conditions. For thisaward half vests two years after the date of grant and the balance after three years.
The option movements of the SRSS were as follows:
2013 2012Beginning balance 20,451 32,457
Less: exercised 2,043 11,515
lapsed 1,409 491
Ending balance 16,999 20,451
For the years ended December 31, 2013 and 2012, the costs of the SRSS charged to profit orloss were $154 thousand and $1,024 thousand, respectively, recognized as operatingexpenses employees' benefits.
The dividend yield assumption is based on a historical average over a period commensuratewith this ‘average’ period until vesting, or over one year if the average period until vesting isless than one year.
2013Granted date December 17 September 18 June 19 March 11Share price at granted date 13.04 15.14 14.62 18.22Period from granted date (year) 2/3 1/2/3/4 2/3 1/2/3/4 2/3 1/2/3/4 2/3 1/2/3/4Expected dividends (earning rate) (%) 4.90 4.60 4.60 4.60Fair value 11.59 13.54 13.05 16.27
2012Granted date December 21 September 19 June 20 March 13Share price at granted date 15.84 14.82 14.17 15.65Period from granted date (year) 2/3 1/2/3/4 2/3 2/3 2/3Expected dividends (earning rate) (%) 3.70 3.00 3.80 3.80Fair value 14.46 13.76 12.91 14.26
25) Earnings per share
2013 2012Net income attributable to common stockholders $ 2,391,059 3,062,795Common stock (in thousands) $ 2,910,572 2,910,572Basic EPS (in dollars) $ 0.82 1.05
Since the Bank's implementation of share-based payment transactions would proceed by cashsettlement, there is no impact on the Bank's weighted-average shares of common stock outstandingduring the period.
155
VI. Financial Highlights
26) Net interest income
2013 2012Interest income
Interest income, discounts and loans $ 10,545,644 11,178,294Interest income, accounts receivable factoring without recourse 294,778 485,147Interest income, due from banks 896,272 406,417Interest income, available-for-sale financial assets 1,948,396 2,131,823Interest income, credit card recurrence 451,149 416,958Interest income, other 255,692 456,297
Total 14,391,931 15,074,936Interest expense
Interest expense, deposits 3,667,859 3,836,247Interest expense, due to banks 329,477 187,701Interest expense, due to bank notes 1,001,426 1,092,995Interest expense, other 47,729 142,913
2013 2012Net gain on sale of non-performing loans $ - 648,300Net gain on disposal of property 19,553 232,585Net gain on securities brokering income 54,867 90,229Gains on financial assets carried at cost 17,661 18,143Rental income 16,074 18,551Net loss on fair value hedge (22,020) (26,770)Other 8,788 49,139Total $ 94,923 1,030,177
31) Impairment losses on assets
2013 2012Impairment loss buildings $ 4,474 61,041
Impairment loss other financial assets 164 -
Gain on reversal of impairment loss available-for-sale
financial assets - (48,209)
Total $ 4,638 12,832
157
VI. Financial Highlights
32) Bad debt expense and provision for guarantee liabilities (reversal)
2013 2012Salary expenses $ 4,498,626 4,579,281Labor and health insurance 344,349 324,230Pension
Deferred contribution plan 166,538 161,125Deferred benefits plan 170,074 168,665
Other 281,849 398,926Total $ 5,461,436 5,632,227
34) Depreciation and amortization expense
2013 2012Depreciation expenses
Buildings $ 93,045 98,757
Office equipment 57,500 92,671
Leasehold improvements 94,135 123,061
Other equipment 54,904 89,803
Subtotal of depreciation 299,584 404,292
Computer software amortization 36,385 25,489
Total $ 335,969 429,781
35) Other general and administrative expenses
2013 2012Rental expense $ 569,306 565,154Office supplies 117,511 128,987Postage 243,065 239,108Repairs and maintenance 166,643 189,379Advertising expense 246,807 212,156Utilities fee 112,647 112,946Taxes 502,907 540,550Professional service fee 121,011 109,593Operational and advisory service fee 903,989 1,052,814Consulting and technical support service fee 507,753 535,044Wholesale banking business service fee 263,198 277,831Building management fee 138,300 130,003Computer management fee 280,964 273,172Other 159,944 43,783Total $ 4,334,045 4,410,520
158
Annual Report
36) Disclosure of financial instruments
(a) Fair value of financial instruments
December 31, 2013 December 31, 2012Financial assets Book value Fair value Book value Fair value
Non-derivative financial instrumentsCash and cash equivalents $ 29,274,099 29,274,099 6,697,772 6,697,772Due from the Central Bank and
call loans to banks 68,534,106 68,534,106 68,073,194 68,073,194Financial assets at fair value
through profit or loss debtinstruments 12,655,284 12,655,284 21,512,425 21,512,425
Securities purchased under resellagreements 1,950,000 1,950,000 3,402,039 3,402,039
Receivables net 32,759,448 32,759,448 37,741,825 37,741,825Discounts and loans net 360,762,604 360,762,604 350,387,046 350,387,046Available-for-sale financial
assets, net 230,156,830 230,156,830 226,363,332 226,363,332Other financial assets net 151,245 151,245 151,409 151,409
January 1, 2012Financial assets Book value Fair value
Non-derivative financial instrumentsCash and cash equivalents $ 11,469,535 11,469,535Due from the Central Bank and call loans to banks 74,398,541 74,398,541Financial assets at fair value through profit or loss debt
instruments 25,458,794 25,458,794Securities purchased under resell agreements 8,456,414 8,456,414 Receivables net 34,206,432 34,206,432 Discounts and loans net 346,151,003 346,151,003 Available-for-sale financial assets net 211,874,021 211,874,021 Other financial assets net 158,072 158,072
December 31, 2013 December 31, 2012Financial liabilities Book value Fair value Book value Fair value
Non-derivative financial instrumentsDeposits from the Central Bank
January 1, 2012Financial liabilities Book value Fair value
Non-derivative financial instrumentsDeposits from the Central Bank and banks $ 18,390,389 18,390,389Payables 4,871,999 4,871,999Related parties payable 4,284,892 4,284,892Deposits and remittances 596,151,692 596,151,692Bank notes payable net 47,512,170 47,512,170Other financial liabilities 10,095,732 10,095,732
159
VI. Financial Highlights
(b) The following methods and assumptions were used by The Bank's management to estimate thefair value of financial instruments:
i. Non-derivative short-term financial assets include cash and cash equivalents, due fromthe Central Bank and call loans to banks, securities purchased under resell agreementsand receivables; other short-term financial liabilities include due to the Central Bank andother banks, notes and bonds issued under repurchase agreements and payables. The fairvalues of these financial instruments are estimated to be the carrying amounts because ofthe short maturities of these financial instruments.
ii. Financial assets and liabilities at fair value through profit or loss and available for salefinancial assets: if there is a quoted price in an active market for the financial asset, thenuse this market price as the fair value; if there is no quoted price in an active market forthe financial asset, the fair value is estimated using the evaluation methods.
iii. The interest on discounts and loans to customers is mainly based on floating rates.Therefore, the book value approximates the fair value.
iv. Other financial assets and liabilities: the stocks held which is not listed on an exchange orOTC, and no derivative is significant influenced or linked with these stocks are calledother financial assets. Other financial assets that are prepared in accordance withguidelines shall be measured at cost; other financial liabilities as required by legislation todisclose the principle amounts of the structured deposits, thus liabilities are presented inits book value.
v. Based on the characteristics of the financial industry, most deposits and remittances havematurities of less than one year, so the book value should be reasonable based onestimated fair value.
vi. Bank notes payable is mainly a financial liability with floating rate, so its fair valueequals its book value.
vii. If there are no active market prices available pertaining to derivative financial instruments(including structured notes), the options trading contracts will use the Black-Scholesmodel to assess. The exchange rate for forward foreign exchange contracts are quoted bythe FBS program. Meanwhile the forward foreign exchange contracts individual maturitydate and exchange rates are individually calculated at fair value. The fair value of interestrate swaps and cross currency swap contracts quotation are based on Reuters programinformation system with each individual contracts estimated at fair value.
160
Annual Report
(c) Levels of fair value of financial instruments and statement of movement
i. Fair value hierarchy information of financial instruments
December 31, 2013Level 1 Level 2 Level 3
Financial instruments at fair value Total (note1) (note 2) (note 3)Non-derivative financial instruments:
Assets:Financial assets at fair value through profit or loss
Bond investments $ 12,655,284 4,773,205 7,882,079 -Available-for-sale financial assets net
Financial assets at fair value through profit or loss 7,803,603 5,401 7,798,202 -Derivative financial assets for hedging 172,750 - 172,750 -
Liabilities:Financial liabilities at fair value through profit or loss 7,533,988 10,838 7,523,150 -Derivative financial liabilities for hedging 3,227 - 3,227 -
December 31, 2012Level 1 Level 2 Level 3
Financial instruments at fair value Total (note1) (note 2) (note 3)Non-derivative financial instruments:
Assets:Financial assets at fair value through profit or loss
Bond investments $ 21,512,425 4,366,153 17,146,272 -Available-for-sale financial assets net
Financial assets at fair value through profit or loss 8,032,285 2,631 8,029,654 -Derivative financial assets for hedging 428,983 - 428,983 -
Liabilities:Financial liabilities at fair value through profit or loss 8,357,471 3,935 8,353,536 -Derivative financial liabilities for hedging 13,523 - 13,523 -
161
VI. Financial Highlights
January 1, 2012Level 1 Level 2 Level 3
Financial instruments at fair value Total (note1) (note 2) (note 3)Non-derivative financial instruments:
Assets:Financial assets at fair value through profit or loss
Bond investments $ 25,458,794 6,386,879 19,071,915 -Available-for-sale financial assets net
Financial assets at fair value through profit or loss 15,408,897 3,403 15,042,539 362,955Derivative financial assets for hedging 728,959 - 728,959 -
Liabilities:Financial liabilities at fair value through profit or loss 14,863,355 1,955 14,585,681 275,719Derivative financial liabilities for hedging 92,441 - 92,441 -
ii. Statement of movement in financial assets which were classified to Level 3 based on fairvalue measurement
2012Increase in current period Decrease in current period
Financial assets at fair value through profit or loss 362,955 - - - - - (362,955) - - -
Total $ 2,115,537 - - - - - (2,115,537) - - -
iii. Statement of changes in financial liabilities which were classified to Level 3 based on fairvalue measurement
2012Increase in current period Decrease in current period
ItemsBeginning
balance
Recognizedin current
years'profit or
loss
Recognized inother
comprehensive inco
me
Purchaseor
issuance
Transfer-into level 3
from otherlevels
Transfer-into level 3financialliabilities
from level 3financial
assets
Saledisposal, orsettlement
Transfer-outto other levelsfrom level 3
Transfer-outto level 3financial
assets fromlevel 3
financialliabilities
Endingbalance
Derivative financial instruments
Financial liabilities at fair value throughprofit or loss $ 275,719 - - - - - (275,719) - - -
162
Annual Report
Note 1: Level 1 inputs are quoted prices in active markets for identical assets orliabilities. According to the SFAS No. 34 "Financial Instruments: Recognitionand Measurement", paragraph 5, active markets are defined as markets that meetthe following criteria: (1) the asset or liability traded in the market have similarattributes; (2) there is a willing buyer and seller for the asset or liability in themarket at any given time; (3) price information on the asset or liability can beaccessed by the general public.
Note 2: Level 2 inputs are inputs other than quoted prices in active markets that areobservable, including those inputs that can be observed directly (quoted prices)or indirectly (derived from quoted prices) from active markets. For example:
i) The quoted price in similar financial instruments' active market wasreferred to the fair value of financial instruments held by and based onsimilar financial instruments' recent quoted prices; the judgment of similarfinancial instruments should follow the characteristics of the financialinstruments and trading conditions. The factors that require the fair valueof financial instruments to be adjusted with compatible similar financialinstruments which have observable trading prices might include recentfinancial instruments trading price already have time gap (i.e. has been awhile since last trading time), the difference between the financialinstruments trading conditions, transaction prices involved with a relatedparty, and the correlation between observable transaction price similarfinancial instruments and the price of financial instruments held.
ii) Quoted prices for identical or similar assets or liabilities in markets thoseare not active.
iii) Fair value determined based on a valuation model. Inputs for the model(for example, interest rates, yield curves, volatilities, etc.) can be observedfrom the market (these observable inputs are obtained from marketinformation, and when they are being used in the model, the resultingvaluation for the asset or liability shall represent prices anticipated by themarket participants).
iv) Inputs are derived principally from or corroborated by observable marketdata by correlation or other means.
Note 3: Level 3 means to measure the fair value of the input parameters are not based onobservable market data (inputs are unobservable for example, using historicalvolatilities in a model that determines option value represent usingunobservable inputs, since historical volatilities do not reflect future volatilitiesas anticipated by the overall market participants).
163
VI. Financial Highlights
(d) Information on financial risk
The Bank's risk management framework encompasses servicing client interests and fulfillinglong term operation goals while keeping overall risk tolerance and compliance to localregulations. This framework serves to diversify or transfer risk in an effective manner,benefiting not only our customers and shareholders but ourselves as well. The Bank encounterscredit risk, operational risk, market risk, (interest rate swaps, exchange rate swaps, equity, andcommodity) and liquidity risk both on and off the balance sheets in our day-to-day operations.
The Bank has formulated both the risk management policy and operation procedures intostructured operation manuals, which have been approved by the Board of Directors. Thesemanuals set out a clear guidance on distinguishing, measuring, monitoring, and managingcredit risk, operation risk, market risk, and liquidity risk.
i. Market risk
i) Strategy and procedure of market risk management
The Bank recognizes market risk as the risk of loss resulting from changes inmarket prices and rates. The Bank is exposed to market risk arising principallyfrom customer-driven transactions. The objective of the Bank's market riskpolicies and processes is to obtain the best balance of risk and return while meetingcustomers' requirements.
ii) Market risk management organization and structure
Market risk management organization and structure changes in market prices andrates. The Bank is exposed to market risk arising principally from customer-driventransactions. The objective of the companies limits are annually reviewed by GMRTaiwan and are in line with Group Market Risk Committee guidance. The policiesand procedures are presented to the Board for approval.
Market risk limits are proposed by the business within the terms of the agreedpolicy. Limits are presented to the Risk Committee for approval with its authoritydelegated by the Board. Limits for derivatives require approval from the Board.
GMR Taiwan monitors exposures against these limits on a daily basis. Relatedmarket risk management results are reported to the Risk Committee at a minimumon a quarterly basis.
The Bank also receives strong support from SCB regional and group business andmarket risk management functions based outside of Taiwan.
iii) The scope and characteristics of market risk report and evaluation system
The scope of market risk report covers market exposures in both trading book andbanking book. The primary categories of market risk for the Bank are interest raterisk and currency exchange rate risk linked to trading products in financial markets,as the Bank has not held any positions relating to commodities price risk andequity price risk.
164
Annual Report
The Bank measures the risk of losses arising from future potential adversemovements in market rates, prices and volatilities using a Value at Risk (VaR)methodology. VaR, in general, is a quantitative measure of market risk whichapplies recent historical market conditions to estimate the potential future loss inmarket value that will not be exceeded in a set time period at a set statisticalconfidence level. VaR provides a consistent measure that can be applied acrosstrading businesses.
The table below lists the market risk of financial instruments of the Bank as ofDecember 31, 2013 and 2012. Market risk represents potential losses that the Bankmay suffer in one day when unfavorable changes occur on the Bank's position at a97.5% confidence interval under a certain price probability distribution.
2013 2012Average Maximum Minimum Average Maximum Minimum
Foreign exchange VaR $ 4,538 8,024 2,064 6,213 12,847 2,233Interest rate VaR 18,675 24,441 9,652 14,695 25,317 8,270Risk rate VaR 19,287 25,184 10,311 16,134 26,827 8,933
Losses beyond the confidence interval are not captured by a VaR calculation,which therefore gives no indication of the size of unexpected losses in thesesituations. GMR Taiwan complements the VaR measurement by stress testing ofmarket risk exposures to highlight the potential risk that may arise from extrememarket events that are rare but plausible. Stress testing is an integral part of themarket risk management framework and considers both historical market eventsand forward looking scenarios. Stress testing is applied to trading and bankingbooks respectively.
iv) Policies for market risk hedge/mitigation, as well as the strategy and procedure formaintaining efficiency in risk hedge/mitigation tools
Market Risk is mitigated by the Bank's standard process as risk is measured,monitored, reported and controlled on a portfolio basis.
Market risk policies, procedures and limits are annually reviewed by GMR Taiwan.The policies and procedures cover both trading and banking books and arepresented to Board for approval.
All products used in risk mitigation must be authorized products in their own rightwith appropriate Product Programs.
Any product a business uses for risk mitigation must be explicitly referenced in theMarket Risk limit for the business.
v) Method used for regulatory capital calculation
Standardized Approach / Delta-Plus for Options
165
VI. Financial Highlights
vi) Exchange rate risk exposure information
The significant exposure to foreign currency exchange rates are as follows:
December 31, 2013 December 31, 2012Foreigncurrency
Interest rate sensitive gap (1,392,793) 233,824 (88,618) (354,037) (1,601,624)
Net worth 57,159
Ratio of interest rate sensitive assets to liabilities (%) 65.35
Ratio of interest rate sensitive gap to net equity (%) (2,802.05)
ii. Operational risk
i) Strategy and procedure of operational risk management
Operational risk is the risk of direct or indirect loss due to an event or actionresulting from inadequate or failed internal processes, people and systems, or fromexternal events.
Operational risk arises as a result of business activities. It is the Bank's objective tominimize exposure to operational risk, subject to cost tradeoffs. Operational riskexposures are managed through a framework of policies and procedures that driverisk identification, assessment, control, and monitoring.
Responsibility for the management of operational risk rests with businesses andfunctions as an integral component of their first line risk managementresponsibility.
ii) Operational risk management organization and structure
Governance over operational risk management is achieved through a definedstructure of committees.
The Risk Committee is responsible for ensuring processes and procedures are inplace for the monitoring and control of overall risk. The Risk Committee meetsregularly to review exposure and compliance reports for limit compliance andstress testing.
168
Annual Report
The Country Operational Risk Committee ("CORC"), headed by the ChiefExecutive Officer, is responsible for the direct management of operational risksacross the Bank, and for ensuring that an appropriate and robust risk managementframework is in place to monitor and manage operational risk.
The Bank also receives strong support from SCB regional and group business andoperational risk management functions based outside of Taiwan.
iii) The scope and characteristics of operational risk report and evaluation system
The following risk types fall within the scope of operational risk, including taxrisk, financial risk, vendor risk, technology risk, operations risk, Corporate RealEstate Services (CRES) risk, employee risk, legal risk, financial crime risk, andcompliance risk.
The on-going effectiveness of operational risk controls is ensured through anassurance approach that comprises three distinct lines of responsibility. At itsfoundation is the responsibility that businesses and functions have to adhere tocontrol requirements and to periodically test adherence through control sampletesting performed on controls embedded within critical processes.
iv) Policies for operational risk hedge/mitigation, as well as the strategy and procedurefor maintaining efficiency in risk hedge/mitigation tools
The operational risk management procedures and processes are integralcomponents of the broader Risk Management Framework. Operational risks aremanaged through an end to end process of identification, assessment, control andmonitoring. This four step management process is performed at all levels acrossthe Bank and is the foundation of the management approach. Once identified risksare assessed against standard criteria to determine their significance and the degreeof risk mitigation effort required to reduce the exposure to acceptable levels. Riskmitigation plans are overseen by the appropriate governance committee.
v) Method used for regulatory capital calculation
Basic Indicator Approach
iii. Legal risk
Legal risk arises from the possibility that an entity may not be able to comply withregulations issued by the government and may not be able to enforce a contract againstanother party. Legal risk arises from possible risk of loss due to an unenforceablecontract or an "ultra vires" act of a counterparty. Legal risk involves the potentialillegality of the contract, as well as the possibility that the other party entered into thecontract without proper authority. The legal affairs department of the Bank is responsiblefor providing professional legal consulting and review services for internal regulationsand all counterparty's contracts, and making sure that the Bank follows the financialregulations and operational regulations.
169
VI. Financial Highlights
iv. Credit risk management
i) Credit risk strategy, goal, policy and procedure
The management of risk lies at the heart of Standard Chartered's business. One ofthe main risks we incur arises from extending credit to customers through ourtrading and lending operations.
Effective risk management is fundamental to being able to generate profitsconsistently and sustainably and is thus a central part of the financial andoperational management of the Bank.
A. Strategy and Goal
Through our risk management framework we manage enterprise-wide risks,with the objective of optimizing risk-adjusted returns while remaining withinour risk appetite.
As part of this framework, we use a set of principles that describe the riskmanagement culture we wish to sustain:
a. Balancing risk and reward: risk is taken in support of the requirements ofour stakeholders, in line with our strategy and within our risk appetite;
b. Responsibility: it is the responsibility of all employees to ensure that risk-taking is disciplined and focused. We take account of our social,environmental and ethical responsibilities in taking risk to produce areturn;
c. Accountability: risk is taken only within agreed authorities and wherethere is appropriate infrastructure and resource. All risk-taking must betransparent, controlled and reported;
d. Anticipation: We seek to anticipate future risks and maximize awarenessof all risks; and
e. Competitive advantage: We seek competitive advantage through efficientand effective risk management and control
B. Policies and Procedures
The credit policies and procedures are considered and approved by the BOD,which also oversees the delegation of credit approval and loan impairmentprovisioning authorities. Policies and procedures that are specific to eachbusiness are established. These are consistent with the Group-wide creditpolicies, but are more detailed and adapted to reflect the different riskenvironments and portfolio characteristics.
ii) Credit risk management organization and structure
Ultimate responsibility for the effective management of risk rests with the BankBoard. The Risk Committee, through its authority delegated by the Board via theExecutive Committee, is directly responsible for the management of credit risk.
170
Annual Report
The management of credit risk includes approving standards (and policies) for themeasurement and management of credit risk, approval of delegated approvalauthority framework and responsibilities to sub-committees and to Risk Officers.The Risk function is independent of the origination, trading and sales functions toensure that the necessary balance in risk/return decisions is not compromised. TheBoard and Executive Committee receive regular reports on risk management andare authorized to investigate or seek any information relating to an activity withinits term of reference.
Internal Audit is an independent function that reports to the Board. It providesassurance that policies and procedures are being complied with. The findings andrecommended corrective actions from the audits are reported to all relevantmanagement and governance bodies.
To ensure the effectiveness of risk management processes in maintaining the riskprofile of the Bank, it maintains three lines of defence. The First Line of Defencerequires that all employees ensure the effective management of all risks within thescope of their direct organizational responsibilities. The Second Line of Defencecomprises Risk Control Owners, supported by their respective control andassurance functions. The Third Line of Defence is the independent assuranceprovided by Internal Audit of the effectiveness of the First and Second Lines ofDefence.
iii) The scope and characteristics of credit risk report and evaluation system
Risk measurement plays a central role, along with judgment and experience, ininforming risk-taking and portfolio management decisions. It is a primary area forsustained investment and senior management attention.
Various risk measurement systems are available to the Risk function to enablethem to assess and manage the credit portfolio. These include systems to calculateprobability of default (PD), loss given default (LGD) and exposure at default(EAD) on a transaction, counterparty and portfolio basis.
A number of internal risk management reports are produced on a regular basis,providing information such as; individual counterparty, counterparty group,portfolio exposure, credit grade migration, the status of accounts or portfoliosshowing signs of weakness or financial deterioration, models performance andupdates on credit markets.
The Bank regularly monitors credit exposures, portfolio performance, and externaltrends which may impact risk management outcomes. Internal risk managementreports are presented to risk committees, containing information on keyenvironmental, political and economic trends across major portfolios and countries;portfolio delinquency and loan impairment performance.
iv) Policies for credit risk hedge and mitigation, as well as the strategy and procedurefor maintaining efficiency in risk hedge and mitigation tools
171
VI. Financial Highlights
Potential credit losses from any given account, customer or portfolio are mitigatedusing a range of tools such as collateral, netting agreements, credit insurance, creditderivatives and other guarantees. The reliance that can be placed on thesemitigates is carefully assessed in light of potential issues such as legal certainty andenforceability, market valuation correlation and counterparty risk of the guarantor.
Risk mitigation policies determine the eligibility of collateral types. Collateraltypes which are eligible for risk mitigation include: cash, residential, commercialand industrial property; fixed assets such as motor vehicles, aircraft, plant andmachinery; marketable securities; commodities; bank guarantees and letters ofcredit. The Bank also enters into collateralized reverse repurchase agreements.
Where guarantees or credit derivatives are used as Credit Risk Mitigation (CRM)the creditworthiness is assessed and established using the credit approval process inaddition to that of the obligor or main counterparty.
Collateral is valued in accordance with the CRM, which prescribes the frequencyof valuation for different collateral types, based on the level of price volatility ofeach type of collateral and the nature of the underlying product or risk exposure.Collateral held against impaired loans is maintained at fair value.
Certain credit exposures, e.g. non-recourse receivable service, are mitigated usingcredit default insurance.
Bilateral and multilateral netting are used to reduce settlement counterparty risk.Settlement exposures are generally netted using bilateral netting documentation inlegally approved jurisdictions, Delivery vs Payments or Payment vs Paymentssystems.
v) Method used for regulatory capital calculation
Standardized Approach
vi) Maximum exposure to credit risk
Without taking collateral or other credit enhancement mitigation effect intoaccount, the maximum exposure to credit risk of on-balance-sheet financial assetsis equal to their carrying values. Maximum exposures of financial instruments(without taking collateral or other credit enhancement, and irrevocable maximumexposure) were as follows:
Maximum exposure to credit risk
Off-balance-sheet itemsDecember 31,
2013December 31,
2012January 1,
2012Unused amount of irrevocable credit commitments $ 3,927,407 2,177,170 1,169,610Unused amount of irrevocable letters of credit 2,166,243 1,878,599 2,291,150Other guarantees 7,194,171 7,066,722 9,390,534Total $ 13,287,821 11,122,491 12,851,294
172
Annual Report
Due to the Bank's use of a more strict selection process for credit risk followed bysubsequent periodic review, the Bank's management assessed a more sustainablecontrol to minimize the Bank's off-balance-sheet items for credit risk.
vii) Concentrations of credit risk
Financial instruments counterparties are significantly concentrated onto one personor multiple persons. Concentration of credit risk exists if a number ofcounterparties are engaged in similar activities or activities in the same region, orhave similar economic characteristics that would cause their ability to meetcontractual obligations to be similarly affected by changes in economic or otherconditions.
The Bank's concentration of credit risk are derived from assets, liabilities or off-balance sheet items, compliance or enforcement by transactions (regardless of theproduct or service), or arises from a combination of categories including credit, duefrom banks and call loans to banks, portfolio investments, and other receivablesand derivatives. The Bank currently has no concentration of transaction to a singlecounterparty nor a single transaction with a counterparty for the Bank's discountand loans, and non-performing loans that are significant. The following tableillustrates the diversification of the loan portfolio among industry sectors,geographical regions and collateral types of the Bank and its subsidiaries:
viii) Credit quality and impairment analysis on financial asset
Some of the financial assets held by the Bank, such as cash and equivalent cash,due from Central Bank, call loans to banks, and financial assets measured at fairvalue through profit or loss are excluded from this analysis since the counterpartyis normally with good credit quality and can be considered as low credit risk.Below tables provide the credit quality analysis for other financial assets.
B. Credit quality analysis on neither past due nor impaired loans and advances.The credit quality categorization based on the bank's internal risk rating whichis defined in internal master scale.
Total $ 36,758,284 16,028,580 312,413,334 365,200,198
C. Credit quality analysis on past due but not impaired loans and receivables.The credit quality categorization based on the Bank's internal risk rating whichis defined in internal master scale.
D. Credit quality analysis on neither past due nor impaired financial assets. Thecredit quality categorization based on the issuer's internal risk rating which isdefined in internal master scale.
December 31, 2013Investment
gradeSub-investment
gradeHigh risk
grade TotalAvailable-for-sale financial assets
Bonds $ 230,073,502 - - 230,073,502
December 31, 2012Investment
gradeSub-investment
gradeHigh risk
grade TotalAvailable-for-sale financial assets
Bonds $ 226,284,479 - - 226,284,479
January 1, 2012Investment
gradeSub-investment
gradeHigh risk
grade TotalAvailable-for-sale financial assets
Bonds $ 210,037,844 - - 210,037,844
ix) Aging analysis on past due but not impaired financial assets
Customer in the early stage of delinquency due to some temporary administrationreasons can result in past due but not impairment. According to the internal creditrisk assets impairment evaluation guideline, a less than 90-day past due loan istypically not to be treated as impairment unless there is other objective evidenceshowing the potential loss.
177
VI. Financial Highlights
December 31, 2013Up to 1 month 1-2 months 2-3 months Over 3 months Total
The information below shows that may be exempted from reporting as overdueloans and overdue receivables, respectively.
Unit: in thousands of New Taiwan Dollars
December 31, 2013 December 31, 2012Loans that
may beexempted
fromreporting asoverdue loan
Receivablesthat may be
exempted fromreporting as
overduereceivables
Loans thatmay be
exemptedfrom
reporting asoverdue loan
Receivablesthat may be
exempted fromreporting as
overduereceivables
The amount under inter-bank debt relief program without default by debtors $ 15,678 57,287 20,895 75,306The amount under debt discharge program and rehabilitation program without default by debtors 553,150 55,447 475,817 -
$ 568,828 112,734 496,712 75,306
179
VI. Financial Highlights
January 1, 2012Loans that
may beexempted
fromreporting asoverdue loan
Receivablesthat may be
exempted fromreporting as
overduereceivables
The amount under inter-bank debt relief program without default by debtors $ 27,145 99,544The amount under debt discharge program and rehabilitation program without default by debtors 429,271 -
$ 456,416 99,544
B. Concentration of corporate credit risk for the bank
Units: in thousands of New Taiwan Dollars, %
December 31, 2013
Rank Industry classification of group enterpriseOutstanding
credit% of net
assets1 A Group Other computer peripheral
manufacturing industry4,925,019 %11.61
2 B Group Petrochemical manufacturing 3,595,451 %8.483 C Group Other computer peripheral
manufacturing industry3,403,307 %8.03
4 D Group Other weaving industry 3,143,766 %7.415 E Group Sheet glass and glass manufacturing
products manufacturing3,027,298 %7.14
6 F Group Semiconductors packaging and testing 2,790,026 %6.587 G Group Shoes industry 2,391,620 %5.648 H Company Other chemical manufacturing 2,386,828 %5.639 I Group Aviation transportation 2,032,068 %4.79
10 J Group Other computer peripheralmanufacturing industry
2,015,117 %4.75
180
Annual Report
December 31, 2012
Rank Industry classification of group enterpriseOutstanding
credit% of net
assets1 B Group Petrochemical manufacturing 3,187,547 %7.422 A Group Other computer peripheral
manufacturing industry3,048,214 %7.09
3 K Group Cement manufacturing 2,846,157 %6.624 E Group Sheet glass and glass manufacturing
products manufacturing2,605,617 %6.06
5 D Group Other weaving industry 2,445,178 %5.696 F Group Semiconductors packaging and testing 1,923,089 %4.477 L Company Banking 1,914,763 %4.458 M Company Banking 1,859,884 %4.339 N Company Banking 1,806,378 %4.20
10 O Company Tire manufacturing 1,742,134 %4.05
January 1, 2012
Rank Industry classification of group enterpriseOutstanding
credit% of net
assets1 P Company Audio and video electronic products
manufacturing4,540,436 %10.23
2 A Group Other computer peripheralmanufacturing industry
2,539,332 %5.72
3 F Group Semiconductors packaging and testing 2,048,904 %4.624 K Group Cement manufacturing 1,944,819 %4.385 O Company Tire manufacturing 1,816,174 %4.096 Q Company Drugs and medicines manufacturing 1,774,955 %4.007 R Company Integrated circuit manufacturing 1,696,163 %3.828 E Group Sheet glass and sheet glass products
manufacturing1,572,072 %3.54
9 S Company Monitors and terminals manufacturingindustry
1,503,064 %3.39
10 D Group Other weaving industry 1,422,670 %3.21
Note: the above listed group enterprises refer to a group of corporate entitiesdefined by the Sixth Article of the Supplementary Provisions to theTaiwan Stock exchange Corporation Criteria for Review of SecuritiesListings.
v. Liquidity risk management mechanism
i) Definition and sources of liquidity risk
Liquidity risk is the potential that the Bank either does not have sufficient liquidfinancial resources available to meet all its obligations as they fall due, or can onlyaccess these financial resources at excessive cost.
181
VI. Financial Highlights
ii) Management procedure of liquidity risk
The Liquidity Risk Framework governs liquidity risk and is managed by Asset andLiability Committee. The Bank maintains a liquid portfolio of marketablesecurities as a liquidity buffer as required by local regulation. In total, it maintainsa liquidity buffer of TWD239.6bn, which is equivalent to 31.6% of the Bank's totalassets. The level of the Bank's aggregate liquid reserves is in accordance with localregulatory minimum liquidity requirements.
The asset side of the balance sheet is of equal importance to the Bank's balancesheet as the liability side. The Bank's balance sheet is fluid as evidenced by themajority of WB lending and fixed income assets are contractually less than oneyear in tenor.
The Bank is of the view that capital is not a mitigant for liquidity risk; liquidreserves and a short tenured book are the appropriate mitigant. Accordingly, theBank does not hold capital in respect of liquidity risk.
iii) Financial assets held for liquidity risk management
The Bank holds cash and high quality liquid interest earning assets to support therepay liability and the potential urgency for cash demand emerges from marketenvironment. The assets held for liquidity risk management include cash and cashequivalent, due from the Central Bank and call loans to banks, financial assets atfair value through profit or loss, discounts and loans, available-for-sale financialassets, and held-to-maturity financial assets.
iv) Maturity analysis of non-derivatives liabilities
The table below shows the analysis of cash outflows of non-derivatives liabilitiesbased on time remaining until the contractual maturity date. The amount disclosedis based on contractual cash flows and may be different from that included in thebalance sheets.
December 31, 2013Within 3months
3 months~1year 1~5 years
Over 5years Total
Deposits from the Central Bank and the banks $ 37,668,206 8,317,466 - - 45,985,672Deposits and remittances 406,509,716 165,749,484 5,326,645 - 577,585,845Bank notes payable 16,660,044 9,803,015 17,039,669 12,057,197 55,559,925Other financial liabilities 1,577,657 10,263,786 1,278,579 - 13,120,022Total $ 462,415,623 194,133,751 23,644,893 12,057,197 692,251,464
December 31, 2012Within 3months
3 months~1year 1~5 years
Over 5years Total
Deposits from the Central Bank and the banks $ 8,220,944 1,063,039 - - 9,283,983Deposits and remittances 397,093,200 162,292,496 3,686,281 - 563,071,977Bank notes payable 8,715,484 6,550,805 28,026,643 18,721,605 62,014,537Other financial liabilities 3,157,766 2,000,000 28,532,470 1,000,000 34,690,236Total $ 417,187,394 171,906,340 60,245,394 19,721,605 669,060,733
182
Annual Report
January 1, 2012Within 3months
3 months~1year 1~5 years
Over 5years Total
Deposits from the Central Bank and the banks $ 17,243,476 1,146,913 - - 18,390,389Deposits and remittances 420,055,136 147,055,447 29,041,109 - 596,151,692Bank notes payable 9,091,871 - 18,600,092 19,820,207 47,512,170Other financial liabilities 5,884,948 100,000 1,210,783 2,900,001 10,095,732Total $ 452,275,431 148,302,360 48,851,984 22,720,208 672,149,983
v) Maturity analysis of derivative financial liabilities
The Bank evaluates the maturity of the derivative financial liabilities listed on thebalance sheets to analyze their basic elements. The amount disclosed in based oncontractual cash flows and may be different from those included in the balancesheets. The maturity analysis of net settled derivative liabilities is as follows:
A. Maturity analysis of net settled derivatives
December 31, 2013
0-30 days 31-90 days 91-180 days181 days-1
year Over 1 year TotalDerivative financial liabilities measured at fair value through profit and loss
Net cash flow $ (1,124,303) (1,348,567) (152,648) 688,620 264,820 (1,672,078)
184
Annual Report
vi) Maturity analysis of off-balance-sheet items
Table below shows the maturity analysis of off-balance-sheet items for the Bank.The amount of the guarantee and committed credit lines will be allocated to theearliest period when such obligation can be exercised anytime by clients. Theamount disclosed is based on contractual cash flow and may be different from thatincluded in the individual balance sheets.
December 31, 2013
0-30 days 31-90 Days91 days-1
year Over 1 year TotalOther guarantees $ 293,288 731,379 2,640,670 3,528,834 7,194,171Unused amount of irrevocable loan commitment 150,000 - 2,609,090 1,168,317 3,927,407Unused amount of irrevocable letter of credit 517,559 1,428,833 219,851 - 2,166,243
year Over 1 year TotalOther guarantees $ 30,656 119,157 684,011 6,232,898 7,066,722Unused amount of irrevocable loan commitment 200,000 - 1,036,512 940,658 2,177,170Unused amount of irrevocable letter of credit 74,387 1,263,717 324,321 216,174 1,878,599
year Over 1 year TotalOther guarantees $ 30,656 297,887 465,064 8,596,927 9,390,534Unused amount of irrevocable loan commitment - - 286,949 882,661 1,169,610Unused amount of irrevocable letter of credit 292,200 1,036,400 828,626 133,924 2,291,150
vii) Structure Analysis of Maturity Date New Taiwan Dollars
December 31, 2013Remaining period to expiration
Total 0~10 days 11~30 days 31~90 days 91~180 days181 days~
Over 1 year Over 1 yearCapital provided $ 764,150,784 103,922,050 53,989,266 92,366,834 78,450,819 174,376,893 261,044,922Capital used 764,508,329 36,224,072 94,775,117 132,265,008 114,039,394 102,079,450 285,125,288Cap (357,545) 67,697,978 (40,785,851) (39,898,174) (35,588,575) 72,297,443 (24,080,366)
December 31, 2012Remaining period to expiration
Total 0~10 days 11~30 days 31~90 days 91~180 days181 days~
Over 1 year Over 1 yearCapital provided $ 796,223,830 144,337,128 46,486,205 56,801,342 101,985,455 176,682,452 269,931,248Capital used 796,639,425 75,352,281 69,232,627 90,529,993 124,157,229 92,979,710 344,387,585Cap (415,595) 68,984,847 (22,746,422) (33,728,651) (22,171,774) 83,702,742 (74,456,337)
January 1, 2012Remaining period to expiration
Total 0~10 days 11~30 days 31~90 days 91~180 days181 days~
Over 1 year Over 1 yearCapital provided $ 828,288,527 131,077,702 48,699,865 120,082,839 72,244,490 174,627,253 281,556,378Capital used 845,379,289 57,517,132 64,066,084 184,292,171 108,323,178 89,799,803 341,380,921Cap (17,090,762) 73,560,570 (15,366,219) (64,209,332) (36,078,688) 84,827,450 (59,824,543)
185
VI. Financial Highlights
viii) Structure Analysis of Maturity Date US Dollars
December 31, 2013
Units: in thousands of US Dollars
Remaining period to expiration
Total 0~30 days 31~90 days 91~180 days181 days~
Over 1 year Over 1 yearCapital provided $ 14,636,005 6,430,950 3,863,505 1,901,014 1,291,366 1,149,170Capital used 14,747,801 5,962,576 3,438,741 1,439,953 1,956,107 1,950,424Gap (111,796) 468,374 424,764 461,061 (664,741) (801,254)
December 31, 2012
Remaining period to expiration
Total 0~30 days 31~90 days 91~180 days181 days~
Over 1 year Over 1 yearCapital provided $ 11,924,036 4,903,564 3,166,560 1,575,848 1,303,847 974,217Capital used 11,955,176 4,559,336 3,356,929 959,154 1,338,252 1,741,505Gap (31,140) 344,228 (190,369) 616,694 (34,405) (767,288)
January 1, 2012
Remaining period to expiration
Total 0~30 days 31~90 days 91~180 days181 days~
Over 1 year Over 1 yearCapital provided $ 12,475,547 4,363,809 5,017,542 1,509,401 1,199,636 385,159Capital used 12,618,871 4,209,749 4,914,597 1,108,572 1,508,339 877,614Gap (143,324) 154,060 102,945 400,829 (308,703) (492,455)
(e) Capital management
i. Summary
The goal of the Bank's capital management is shown below:
i) Meeting the regulatory capital requirement and the minimum capital adequacy ratiois the Bank's basic goal for capital management. The Bank calculates qualifiedcapital and regulatory capital requirement in accordance with rules issued by theregulator.
ii) To ensure keeping adequate capital to support all the risks surrounding its business,the Bank should take the risk combination and the characters of risk intoconsideration when measuring the Bank's required capital. At the meanwhile, theBank should maximize resource allocation through risk management by means ofcapital allocation.
ii. Capital management procedure
The Bank maintains the capital adequacy ratio in line with the requirement made by theregulator, and report to the regulator on a quarterly basis.
The Bank's capital is managed by the Asset and Liability Committee. The Bank's capitalis divided into Tier 1 Capital and Tier 2 Capital following the "Regulations Governingthe Capital Adequacy and Capital Category of Banks":
186
Annual Report
i) Tier 1 Capital: The aggregate amount of Common Equity and additional Tier 1Capital.
A. Common equity Tier 1 capital: Consists of the common equity deductingintangible assets, the deferred tax assets due to losses from previous years, theinsufficiency of operation reserves and loan loss provisions, the revaluationsurplus of real estate, unamortized losses on sales of non-performing loans,and the statutory adjustment items calculated in accordance with other rulesfor calculation methods.
The common equity Tier 1 capital shall mean the sum of the followingitems:a. Common stock and additional paid-in capital in excess of par-common
stock
b. Capital collected in advance
c. Capital reserves
d. Statutory surplus reserves
e. Special reserves
f. Accumulated profit or loss
g. Non-controlling interests
h. Other items of interest
B. Additional Tier 1 capital: Consists of the aggregate amount of non cumulativeperpetual preferred stock and its capital stock premium, non cumulative andnon perpetual subordinated debts etc.
ii) Tier 2 capital: Consists of the aggregate amount of cumulative perpetual preferredstock and its capital stock premium, cumulative perpetual subordinated debts,convertible subordinated debts, long-term subordinated debts and Non-perpetualpreferred stock and its capital stock premium etc.
187
VI. Financial Highlights
iii. Capital adequacy
Period-endItem
December 31,2013
December 31,2012
Common stock capital 37,704,360 38,501,448
Self-owned Other Tier 1 capital - -
capital Tier 2 capital 18,536,851 19,881,317
Total self-owned capital 56,241,211 58,382,765
Credit Standard approach (SA) 363,779,689 320,675,692
Total risk-weighted assets 413,294,562 370,973,944
Total risk-based capital %13.61 %15.74
Ratio of common stock to total risk-based assets %9.12 %10.38
Ratio of Tier 1 capital to risk-based assets %9.12 %10.38
Leverage ratio %4.21 %4.52
(7) Related-Party Transactions
1) Name and relationship of related parties
Name RelationshipStandard Chartered Bank ("SCB") The Bank's parent companyStandard Chartered Bank Taipei Branch ("SCB Taipei") AffiliateStandard Chartered Bank New York ("SCB New York") AffiliateStandard Chartered Bank Tokyo ("SCB Tokyo") AffiliateStandard Chartered Bank Singapore ("SCB Singapore") AffiliateStandard Chartered Bank Germany ("SCB Germany") AffiliateScope International Private Limited AffiliateScope International (M) Sdn Bhd AffiliateStandard Chartered Bank Hong Kong Limited ("SCB HK") AffiliateStandard Chartered Bank China Limited ("SCB China") AffiliateStandard Chartered Bank Bangkok Limited ("SCB BKK") AffiliateStandard Chartered Life Insurance Agency Co., Ltd.
("Standard Chartered Life Insurance Agency")Investee under equity method
Taiwan Standard Chartered Insurance Agency Co., Ltd.("Taiwan Standard Chartered Insurance Agency")
Investee under equity method
Directors, Supervisors, President and Vice Presidents The senior management of the BankOthers Families, spouses of the senior
management of the Bank
188
Annual Report
2) Significant transactions with related parties
(a) Deposits
December 31, 2013
Name Ending balancePercentage ofdeposits (%)
Interest rate(%)
Deposits by individual related partiesnot over 1% of total deposits $ 863,815 0.15 0.00~5.48
December 31, 2012
Name Ending balancePercentage ofdeposits (%)
Interest rate(%)
Deposits by individual related partiesnot over 1% of total deposits $ 790,139 0.14 0.00~5.28
The interest rate on employee savings accounts was calculated based on the interest rate of timesavings deposits with three year term offered to the general public plus 3%.
For the years ended December 31, 2013 and 2012, interest expenses on the above deposits were$4,812 thousand and $4,191 thousand, respectively, and the interest payables on the abovetransaction were $270 thousand and $252 thousand, respectively.
(b) Loans
December 31, 2013 Repayment Difference
Type of loanNumber of
accounts or nameof related party
Maximumduring the
periodEnding balance
On-schedule Overdue Collateral
between terms and conditionsoffered to the accounts and to
the general public
Employee consumerloans
11 5,199 2,305 2,305 - Unsecuredlending
None
Mortgage 21 189,231 144,797 144,797 - House NoneOther 2 6,610 6,068 6,068 - Overdraft on the
comprehensivedeposits
None
December 31, 2012 Repayment Difference
Type of loanNumber of
accounts or nameof related party
Maximumduring the
periodEnding balance
On-schedule Overdue Collateral
between terms and conditionsoffered to the accounts and to
the general public
Employee consumerloans
8 5,950 3,188 3,188 - Unsecuredlending
None
Mortgage 17 170,970 160,719 160,719 - House NoneOther 2 6,994 6,610 6,610 - Overdraft on the
comprehensivedeposits
None
For the years ended December 31, 2013 and 2012, interest income on the above loans were$2,833 thousand and $2,205 thousand, respectively, and the interest receivables on the abovetransaction were $136 thousand and $142 thousand, respectively.
189
VI. Financial Highlights
(c) Derivative transactions
December 31, 2013 Contract Net valuation Balance sheet
Name Contracts duration period Notional adjustment Account BalanceSCB Interest rate swap 2014.1.17~
2017.10.11$ 25,105,084 (59,195) Financial assets at fair value
through profit or loss98,387
Financial liabilities at fairvalue through profit or loss
(157,582)
Interest rate optioncontract
2017.5.15~2017.8.22
1,194,143 (10,760) Financial liabilities at fairvalue through profit or loss
(10,760)
Forward contract 2014.1.2~2014.11.20
100,319,785 (532,298) Financial assets at fair valuethrough profit or loss
343,306
Financial liabilities at fairvalue through profit or loss
(875,604)
Foreign exchangeoption contract
2014.1.2~2016.3.24
51,785,359 (827,474) Financial assets at fair valuethrough profit or loss
186,696
Financial liabilities at fairvalue through profit or loss
(1,014,170)
Commodity swap 2014.1.3~2014.8.4
362,610 (5,979) Financial assets at fair valuethrough profit or loss
8,637
Financial liabilities at fairvalue through profit or loss
As of December 31, 2013 and 2012, the interest receivables resulting from the above loans andadvances to affiliates were $62,130 thousand and $101,489 thousand, respectively
(f) Deposits from banks affiliates
2013Balance Interest rate % Interest expense
SCB Taipei $ 828,609 0.01 24
2012Balance Interest rate % Interest expense
SCB Taipei $ 489 0.01~0.20 7
As of December 31, 2013 and 2012, the interest payables resulting from the above deposits andadvances to affiliates were $3 thousand, and $0 thousand, respectively.
(g) Overdrafts on banks affiliates
2013Balance Interest rate % Interest expense
SCB New York $ - 0.60 277SCB HK - 6.25 185SCB Germany - 1.50 54Other - 1.50 5
$ - 521
192
Annual Report
2012Balance Interest rate % Interest expense
SCB Germany $ 89,885 - -SCB HK 33,844 0.01 52SCB New York - 0.60 559SCB Tokyo - 1.55 194SCB - 1.50 44Other 45 - -
$ 123,774 849
As of December 31, 2013 and 2012, the interest payables, resulting from the above overdraftsand advances to affiliates were both $0 thousand.
SCB Tokyo $ 303,496 0.01 14SCB HK 235,366 0.07~3.00 25,127SCB Taipei - 0.20~1.38 42,797Other - 0.17~0.25 930
$ 538,862 68,868
As of December 31, 2013 and 2012, the interest payables resulting from the above loans fromaffiliates were $24,070 thousand and $494 thousand, respectively.
(i) The fair values of financial debentures acquired from affiliates, which were recognized asavailable for sale financial assets were as follows:
Fair value
NameDecember 31,
2013December 31,
2012January 1,
2012SCB HK $ 5,492,108 5,247,836 5,092,553
As of December 31, 2013 and 2012, the interest receivable resulting from the above transactionwere $271,755 thousand and $240,648 thousand, respectively.
193
VI. Financial Highlights
(j) Bank notes payables deriving from the issuance of financial debentures to affiliates were asfollows:
Note: The issuance conditions and details of financial debentures are stated in note 4(16).
For the years ended December 31, 2013 and 2012, the interest expense on the above transactionwere $325,801 thousand and $341,765 thousand, respectively, and the interest payables on theabove transaction were $18,665 thousand and $18,493 thousand, respectively.
(k) For the years ended December 31, 2013, operational and advisory service fees, consulting andtechnical support service fees and wholesale banking business service fees were $903,989thousand, $507,753 thousand, and $263,198 thousand, respectively. For the years endedDecember 31, 2012, operational and advisory service fees, consulting and technical supportservice fees and wholesale banking business service fees were $1,052,814 thousand, $535,044thousand, and $277,831 thousand, respectively. As of December 31, 2013 and 2012, feespayables to SCB were $7,302,507 thousand and $5,465,118 thousand, respectively, recordedunder accounts payables related parties. Moreover, for the years ended December 31, 2013and 2012, the royalty expenses for obtaining the right to use intellectual property of SC PLCGroup amounted to $40,786 thousand and $44,794 thousand, respectively. As of December 31,2013 and 2012, the royalty expenses payable to SCB were $90,156 thousand and $48,663thousand, respectively, recorded under accounts payables related parties.
(l) For the years ended December 31, 2013 and 2012, the related cost of the Executive ShareOption Scheme amounted to $54,127 thousand and $79,636 thousand, respectively. As ofDecember 31, 2013 and 2012, accounts payable to SCB for the share-based payment schemecosts amounted to $55,063 thousand and $473,700 thousand, respectively, recorded underaccounts payables related parties.
(m) For the years ended December 31, 2013 and 2012, expenses resulting from operating activitieswith affiliates were as follows:
Name 2013 2012Technical support mandate services:
SCB $ 55,097 62,667Information technology service fees:
Scope International Private Ltd. $ 70,302 67,418Scope International (M) Sdn Bhd 84,550 70,914
Total $ 154,852 138,332
(n) As of December 31, 2013 and 2012, the deposit ending balance, related interest expense andaccrued interest of SCLIA were $645,157 thousand and $608,503 thousand, $2,409 thousandand $2,126 thousand, and $88 thousand and $48 thousand, respectively; the deposit endingbalance, related interest expense and accrued interest of SCIAC were $37,980 thousand and$33,442 thousand, $129 thousand and $173 thousand, and $9 thousand and $1 thousand,respectively.
194
Annual Report
(o) For the years ended December 31, 2013 and 2012, SCBTL signed a rental contracts with SCBTaipei, related rental were both $15 thousand.
(p) As of December 31, 2013 and 2012, the accounts receivable and related service income thatSCBTL supported the SCLIA for its sales were $420,370 thousand and $387,140 thousand,$432,007 thousand, $394,233 thousand, respectively; the accounts receivable and relatedservice income that SCBTL supported the SCIAC for its sales were $11,230 thousand and$9,720 thousand, and $12,191 thousand and $10,767 thousand, respectively.
(q) For the years ended December 31, 2013 and 2012, SCBTL signed a rental contracts with SCBTaipei. Related rental were both $4,278 thousand.
3) The salary and remuneration of directors and supervisors
2013 2012Salary and other short term benefits $ 218,228 291,704
(8) Pledged Assets
Unit: in thousands of New Taiwan dollarsAmount
Pledged assets Pledged for December 31,2013
December 31,2012
January 1,2012
Bonds (recognized as other assets)Provision seizure $ 131,400 165,200 209,200
Securitization of mortgage loans - - 700,000
$ 131,400 165,200 909,200
Refundable security deposits made in accordance with the relevant regulations governing bankoperations:
Amount
Pledged assets Pledged forDecember 31,
2013December 31,
2012January 1,
2012Negotiable certificates of deposit,
government bonds (recognizedas other assets)
Trust indemnity reserve $ 150,000 150,000 150,000
Security deposits for futurestrading
35,000 35,000 35,000
Security deposits for securitybrokerage
225,000 225,000 225,000
Reserve for trust funds - - 25,000Bid for bonds 100,000 100,000 50,000
1) Reserves for trust funds are provided by deposits that the Bank placed in the Central Bank of Chinafor its trust custodian business.
2) Reserves for trust indemnity obligations are provided by deposits placed in the Central Bank ofChina for conducting a trust business.
3) Provision seizures are provided by collateral placed with the court in order to execute the Bank'sright over debtors' properties.
4) Bid for bonds are provided by deposits placed in the Central Bank of China for the Bank's bill tradingbusiness.
5) Security deposits for bond proprietary trading and underwriting are provided by deposits placed inthe OTC Securities Exchange for the Bank's government bond trading and underwriting business.
6) Security deposits for futures trading are operating bonds provided by deposits placed in the specialaccount with the financial institution designated by the Financial Supervisory Commission.
7) Security deposits for security brokerage are operating bonds by deposits placed for operatingbusiness of securities commission agency, brokerage, agency, and other relevant businesses approvedby the Competent Authority.
(9) Significant Contingent Liabilities and Unrecognized Contract Commitments
1) Commitments and contingent liabilities
December 31,2013
December 31,2012
January 1,2012
Consignment collection for others $ 8,216,760 9,176,863 10,448,433Traveler's checks held on consignment for sale 20,933 85,584 123,009Securities, consignments and goods in custody 1,341,049,361 1,642,020,829 1,374,512,602Trust assets 101,735,697 112,727,231 131,948,904
$ 1,451,022,751 1,764,010,507 1,517,032,948Other guarantees $ 7,194,171 7,066,722 9,390,534Unused lines of credit $ 3,927,407 2,177,170 1,169,610Unused letters of credit by customer $ 2,166,243 1,878,599 2,291,150
2) Operating leases
Estimated irrevocable operating lease of minimum future lease payments were as follows:
December 31,2013
December 31,2012
January 1,2012
Not later than one year $ 474,496 518,034 517,107Later than one year and not later than five years 522,501 884,127 1,420,117Later than five years - - 618Total $ 996,997 1,402,161 1,937,842
196
Annual Report
3) Significant service agreements
The Bank entered into a banc assurance agreement with PCA Life Assurance Co., Ltd. ("PCA") topromote and sell approved insurance policies in October 2007. Pursuant to the agreement, during thecontract period from October 2007 to September 2015, the Bank should establish a sales team forPCA life insurance products, maintain a customer database, and exclusively sell such life insuranceproducts underwritten by PCA through the distribution networks in Taiwan. In consideration of theexclusive distribution arrangement, PCA had paid to the Bank a facilitation fee of USD 32,000thousand. The amounts of $123,122 thousand were both recognized as fee income for the yearsended December, 2013 and 2012, and the remaining amount was recognized as otherliabilities unearned receipts.
4) Disclosures required by Article 17 of the Trust Enterprise Law on trust balance sheets, trust incomestatements, and trust assets were as follows:
Trust balance sheetDecember 31, 2013
Trust assets Trust liabilitiesBank deposits $ 14,633 Accounts payables $ 10Short-term investments 96,455,236 Tax payables 1Structured notes 3,981,298 Payables for securities under custody 1,284,526Securities under custody 1,284,526 Trust capital 100,451,160Other assets 4Total trust assets $ 101,735,697 Total trust liabilities and capital $ 101,735,697
Trust balance sheetDecember 31, 2012
Trust assets Trust liabilitiesBank deposits $ 18,069 Accounts payables $ 14Short-term investments 108,235,720 Tax payables 1Structured notes 2,565,637 Payables for securities under custody 1,907,799Securities under custody 1,907,799 Trust capital 110,819,417Other assets 6Total trust assets $ 112,727,231 Total trust liabilities and capital $ 112,727,231
Trust balance sheetJanuary 1, 2012
Trust assets Trust liabilitiesBank deposits $ 20,840 Accounts payables $ 15Short-term investments 123,343,564 Tax payables 2Structured notes 6,037,371 Payables for securities under custody 2,547,111Securities under custody 2,547,111 Trust capital 129,401,776Other assets 18Total trust assets $ 131,948,904 Total trust liabilities and capital $ 131,948,904
197
VI. Financial Highlights
Trust income statements
2013 2012Trust revenue:
Interest revenue $ 80 113Common stock cash dividends 652 799Realized gain on investments 191 52Unrealized gain on investments 952 1,992Net gain (loss) on trading of assets 17 (468)
1,892 2,488Trust expenses:
Management expenses 135 178Service charges 1 1Realized loss on investments 175 -
311 179Net income before income tax 1,581 2,309Income tax expense 5 12Net income after income tax $ 1,576 2,297
Foreign currency trust business engaged by the Offshore Banking Unit (OBU) as of December 31,2013 and 2012, and January 1, 2012 were included in the trust balance sheets and schedules ofinvestment for trust business.
(10) Significant Disaster Loss: None.
(11) Significant Subsequent Events: None.
198
Annual Report
(12) Others
ProfitabilityUnit: %
ItemsDecember 31,
2013December 31,
2012
Return on assets Before income tax 0.37 0.49After income tax 0.32 0.41
Return on equity Before income tax 6.51 8.34After income tax 5.60 7.01
Net profit ratio 16.44 18.98
Note 1: Return on assets = net income before / after tax ÷ average assets
Note 2: Return on equity = net income before / after tax ÷ average equity
Note 3: Net profit ratio = net income after tax ÷ net revenue
(13) Other Disclosures Items
1) Related information on significant transaction
(a) Lending to other parties: None.
(b) Guarantees and endorsements for other parties: None.
(c) Information regarding securities held: None.
(d) Information regarding securities for which the purchase or sale amount for the period exceededNT$300 million or 10% of the Bank's paid in capital: None.
(e) Information on the acquisition of real estate for which the purchase amount exceeded NT$300million or 10% of the Bank's paid in capital: None.
(f) Information on the disposal of real estate for which the sale amount exceeded NT$300 millionor 10% of the Bank's paid in capital: None.
(g) Information regarding discounted processing fees on transactions with related parties for whichthe amount exceeded NT$5 million: None.
(h) Information regarding receivables from related parties for which the amount exceeded NT$300million or 10% of the Bank's paid in capital:: None.
(i) Information regarding trading in derivative financial instruments: please refer to Note (6) 3), 4)and 36)
(j) Information regarding selling non performing loans
i. Summary table of NPL disposal: None.
ii Disposal of a single batch of NPL up to 1 billion and information on each transactions:None.
199
VI. Financial Highlights
(k) Information on applications for handling securitized commodities according to the Regulationon Financial Asset Securitization or the Regulation on Real Estate Investment Trusts: None.
(l) Business relationship and material transaction between the parent party and subsidiaries: Note7.
(m) Other material transaction items which were significant to people who use the information inthe financial statements to make financial decisions: None.
2) Information on long-term equity investments:
Holdings
Name of Investee's Investee'sPercentage
ofBook value
of
Gain (loss)recognized
duringNumber of
Pro formanumber
Totalinvestee location operation ownership investments the period shares of shares Shares Percentage Remark
11F., No.363,Fushing N. Rd.,SongshanDistrict, TaipeiCity 10542,Taiwan
Securitiescustodian
0.17 % 9,277 - 543 - 543 0.17 % Note 1
TaiwanCooperativeFinancialHoldings
14F., No. 85, Sec2, Nan JingDong Rd.,ZhongshanDistrict, TaipeiCity, Taiwan
Financialsecuritiesservices
0.06 % 83,328 - 5,112 - 5,112 0.06 % Note 1
Note 1: The highest shares of Fuji Enterprise Management Consulting Co., Ltd. owned by theBank are 19,716 shares for the year ended December 31, 2013. The shares of other long-term equity investments owned by the bank kept the same for the year endedDecember 31, 2013.
Note 2: Fuji Enterprise Management Corporation completed the process of winding up on April24, 2013.
3) Related information on investments in Mainland China: None.
(14) Operating Segment Financial Information
Please refer to the consolidated financial statements for the Bank for the year ended December 31, 2013.
(15)First-time Adoption of IFRSs
Please refer to the consolidated financial statements for the Bank for the year ended December 31, 2013.
201
VI. Financial Highlights
The Board of Directors
Standard Chartered Bank (Taiwan) Limited and Its Subsidiaries:
We have audited the accompanying consolidated balance sheets of Standard Chartered Bank (Taiwan) Limitedand its subsidiaries as of December 31, 2013 and 2012, and January 1, 2012, and the related consolidatedstatements of profit or loss and other comprehensive income, statements of changes in stockholders' equity, andstatements of cash flows for the year ended December 31, 2013 and 2012. These consolidated financialstatements are the responsibility of the Company's management. Our responsibility is to express an opinion onthese financial statements based on our audit.
We conducted our audit in accordance with “Regulations Governing Auditing and Certification of FinancialStatements by Certified Public Accountants” and auditing standards generally accepted in the Republic of China.Those standards require that we plan and perform the audit to obtain reasonable assurance about whether thefinancial statements are free of material misstatement. An audit includes examining, on a test basis, evidencesupporting the amounts and disclosures in the financial statements. An audit also includes assessing theaccounting principles used and significant estimates made by management, as well as evaluating the overallfinancial statement presentation. We believe that our audit provides a reasonable basis for our opinion.
In our opinion, based on our audit, the financial statements referred to the first paragraph present fairly, in allmaterial respects, the financial position of Standard Chartered Bank (Taiwan) Limited and its subsidiaries as ofDecember 31, 2013 and 2012, and January 1, 2012 and the results of its operations and its cash flows for theyear then ended in conformity with the Regulations Governing the Preparation of Financial Reports by PublicBanks and the related International Financial Reporting Standards, International Accounting Standards, andInterpretations developed by the International Financial Reporting Interpretations Committee or the StandingInterpretations Committee endorsed by the FSC.
Standard Chartered Bank (Taiwan) Limited has prepared its individual financial statements for the Bank as ofthe year ended December 31, 2013 and 2012, and January 1, 2012, on which we have expressed an standardunqualified audit opinion.
March 26, 2014
202
Annual Report
Stan
dard
Cha
rter
ed B
ank
(Tai
wan
) L
imit
ed a
nd I
ts S
ubsi
diar
ies
Bal
ance
She
ets
Dec
embe
r 31
, 201
3 an
d 20
12,
and
Janu
ary
1, 2
012
(Exp
ress
ed in
tho
usan
ds o
f N
ew T
aiw
an D
olla
rs)
Dec
embe
r 31
, 201
3D
ecem
ber
31, 2
012
Janu
ary
1, 2
012
Ass
ets
Am
ount
Am
ount
Am
ount
1100
0C
ash
and
cash
equ
ival
ent (
note
6(1
))$
29,2
74,0
994
6,69
7,77
21
11,4
69,5
352
1150
0D
ue f
rom
the
Cen
tral
Ban
k an
d ca
ll lo
ans
to b
anks
(no
tes
6(2)
and
7)
68,5
34,1
069
68,0
73,1
949
74,3
98,5
4110
1200
0Fi
nanc
ial a
sset
s at
fai
r va
lue
thro
ugh
prof
it or
loss
(no
te 6
(3))
20,4
58,8
873
29,5
44,7
104
40,8
67,6
915
1230
0D
eriv
ativ
e fi
nanc
ial a
sset
s fo
r he
dgin
gne
t (no
tes
6(4)
and
7)
172,
750
-42
8,98
3-
728,
959
-
1250
0Se
curi
ties
purc
hase
d un
der
rese
ll ag
reem
ents
(no
te 6
(5))
1,95
0,00
0-
3,40
2,03
9-
8,45
6,41
42
1300
0R
ecei
vabl
ene
t (no
tes
6(6)
, (7)
and7
)32
,531
,005
537
,536
,087
534
,101
,227
5
1320
0C
urre
nt ta
x as
sets
(no
te 6
(21)
)11
1,72
4-
115,
818
-22
4,89
0-
1350
0D
isco
unts
and
loan
sne
t (no
tes
6(4)
, (7)
and
7)36
0,76
2,60
448
350,
387,
046
4834
6,15
1,00
347
1400
0A
vail
able
-for
-sal
e fi
nanc
ial a
sset
sne
t
(not
es 6
(4),
(8)
and
7)
230,
156,
830
3022
6,36
3,33
231
211,
874,
021
28
1550
0O
ther
fin
anci
al a
sset
s (n
ote
6 (9
))15
1,24
5-
151,
409
-15
8,07
2-
1850
0Pr
oper
ty, p
lant
and
equ
ipm
ent (
note
6(1
0))
5,56
3,50
41
6,04
9,66
51
6,81
1,92
61
1900
0In
tang
ible
ass
ets
net (
note
6(1
1))
3,15
7,05
0-
3,19
3,43
51
3,21
9,21
3-
1930
0D
efer
red
tax
asse
ts (
note
6(2
1))
2,39
7,89
1-
2,63
9,98
3-
2,80
0,90
2-
1950
0O
ther
ass
ets
net (
note
s 6(
12)
and
8)3,
271,
338
-1,
602,
797
-2,
900,
582
-
Tot
al a
sset
s$
758,
493,
033
100
736,
186,
270
100
744,
162,
976
100
Dec
embe
r 31
, 201
3D
ecem
ber
31, 2
012
Janu
ary
1, 2
012
Lia
bilit
ies
and
stoc
khol
ders
' equ
ity
Am
ount
%A
mou
nt%
Am
ount
%C
urre
nt li
abili
ties
:
2100
0D
epos
its f
rom
the
cent
ral b
ank
and
bank
s (n
otes
6(1
3) a
nd 7
)$
45,9
85,6
726
9,28
3,98
32
18,3
90,3
893
2200
0Fi
nanc
ial l
iabi
litie
s at
fai
r va
lue
thro
ugh
prof
it or
loss
(no
te 6
(3))
7,53
3,98
81
8,35
7,47
11
14,8
63,3
552
2230
0D
eriv
ativ
e fi
nanc
ial l
iabi
liti
es f
or h
edgi
ngne
t (no
tes
6(4)
and
7)
3,22
7-
13,5
23-
92,4
41-
2300
0Pa
yabl
es (
note
6(1
4))
4,56
2,14
51
6,04
0,68
41
4,87
6,49
61
2310
0R
elat
ed p
artie
s pa
yabl
e(n
ote
7)7,
498,
064
16,
012,
064
14,
284,
892
1
2320
0C
urre
nt ta
x lia
bilit
ies
(not
e 6(
21))
35,3
11-
105,
362
-48
,948
-
2350
0D
epos
its a
nd r
emitt
ance
s (n
otes
6(4
), (
15)
and
7)57
6,90
2,70
976
562,
430,
032
7659
5,73
5,39
480
2400
0B
ank
note
s pa
yabl
ene
t (no
tes
6(4)
, (16
) an
d 7)
55,5
59,9
257
62,0
14,5
378
47,5
12,1
707
2550
0O
ther
fin
anci
al li
abili
ties
(not
e 6(
17))
13,1
20,0
222
34,6
90,2
365
10,0
95,7
321
2560
0Pr
ovis
ions
(not
es 6
(18)
and
(20
))1,
915,
124
-1,
981,
028
-1,
822,
557
-
2930
0D
efer
red
tax
liabi
litie
s (n
ote
6(21
))59
2,78
7-
665,
364
-58
6,80
8-
2950
0O
ther
liab
ilitie
s(no
tes
6(19
) an
d 9(
3))
2,37
8,54
7-
1,60
7,94
3-
1,47
6,66
6-
Tota
l lia
bilit
ies
716,
087,
521
9469
3,20
2,22
794
699,
785,
848
95
3110
1C
omm
on s
tock
(no
te 6
(23)
)29
,105
,720
429
,105
,720
429
,105
,720
3
3150
0C
apita
l sur
plus
(not
e 6(
23))
5,78
6,03
11
5,78
6,03
11
5,78
6,03
11
Ret
aine
d ea
rnin
gs:
3200
1L
egal
res
erve
(no
te 6
(23)
)4,
289,
836
13,
388,
832
-87
6,89
7-
3200
3Sp
ecia
l res
erve
(no
te 6
(23)
)34
7,70
6-
136,
034
-13
6,03
4-
3200
5U
napp
ropr
iate
d ea
rnin
gs (
note
6(2
3))
2,26
7,77
7-
3,58
2,70
61
7,50
9,73
71
6,90
5,31
91
7,10
7,57
21
8,52
2,66
81
3250
0O
ther
equ
ity in
tere
st (
note
6(2
3))
608,
442
-98
4,72
0-
962,
709
-
Tota
l sto
ckho
lder
s' e
quit
y42
,405
,512
642
,984
,043
644
,377
,128
5
Tot
al li
abili
ties
and
sto
ckho
lder
s' e
quit
y$
758,
493,
033
100
736,
186,
270
100
744,
162,
976
100
203
VI. Financial Highlights
Standard Chartered Bank (Taiwan) Limited and Its Subsidiaries
Statements of Profit or Loss and Other Comprehensive Income
For the years ended December 31, 2013 and 2012
(expressed in thousands of New Taiwan Dollars)
2013 2012 ChangeAmount Amount %
41000 Interest income (notes 6(26) and 7) $ 14,391,931 95 15,074,936 91 (5)
51000 Less interest expense (notes 6(26) and 7) 5,043,953 33 5,257,563 32 (4)
Net income of interest 9,347,978 62 9,817,373 59 (5)
Net non-interest income
49100 Net service fee income (notes 6(27)and 9(3)) 3,802,015 25 3,638,428 22 4
49200 Gain (loss) on financial assets or liabilities measured at fair value
through profit or loss (note 6(28)) 1,172,009 8 1,951,909 12 (40)
49300 Realizes gain (loss) on available-for-sale financial assets (note 6(29)) (1,085) - (6,451) - 83
49600 Foreign exchange gain 695,480 4 249,202 1 179
49800 Net other non-interest income (notes 6(9), (30), and 7) 94,909 1 1,030,177 6 (91)
55000 Impairment losses on assets (notes 6(9) and (31)) (4,638) - (12,832) - 64
Net revenue 15,106,668 100 16,667,806 100 (9)
58200 Bad debts expense and guarantee liability provision
Standard Chartered Bank (Taiwan) Limited and Its Subsidiaries
Statement of Cash Flows
For the years ended December 31, 2013 and 2012
(expressed in thousands of New Taiwan Dollars)
2013 2012Cash flow from (used in) operating activities
Profit before tax $ 2,845,130 3,702,592Adjustments
Adjustments to reconcile profit (loss)Depreciation expense 299,595 404,345Amortization expense 36,385 26,761Bad debt expense and guarantee liability provision 1,632,146 2,020,735Interest expense 5,043,953 5,257,563Interest income (14,391,931) (15,074,936)Net change in other provisions 11,115 49,858Gain on sale of non-performing loans - (648,300)Impairment loss on financial assets 4,638 12,832Gain on disposal of property and equipment (19,553) (232,585)
Total adjustments to reconcile profit (loss) (7,383,652) (8,183,727)Change in operating assets and liabilities
Change in operating assetsDue from the Central Bank and call loans to banks 1,617,778 (679,519)Financial assets at fair value through profit or loss 9,085,823 11,322,981Receivables 4,913,187 (3,356,405)Discounts and loans (11,968,230) (6,408,078)Available-for-sale financial assets (3,950,652) (14,376,044)Other financial assets - 6,663
Total changes in operating assets (302,094) (13,490,402)Changes in operating liabilities
Deposits from the Central Bank and banks 36,701,689 (9,106,406)Financial liabilities at fair value through profit or loss (823,483) (6,505,884)Payables 424,789 2,662,886Deposits and remittances 14,501,678 (33,243,754)Other financial liabilities (21,570,214) 24,594,504Other liabilities 770,604 131,277Total changes in operating liabilities 30,005,063 (21,467,377)
Total changes in operating assets and liabilities 29,702,969 (34,957,779)Total adjustments 22,319,317 (43,141,506)
Cash inflow (outflow) generated from operations 25,164,447 (39,438,914)Interest received 14,483,826 14,996,481Interest paid (5,461,281) (5,029,089)Income taxes paid (285,851) (210,186)
Net cash flows from (used in) operating activities 33,901,141 (29,681,708)Cash flows from investing activities
Proceeds from disposal of property, plant and equipment 471,733 565,952Acquisition of property, plant and equipment (270,088) (37,475)Decrease in securities purchased under resell agreements 1,452,039 5,054,375Sale of non-performing loans - 773,234(Increase) decrease in other assets (1,668,541) 1,297,785
Net cash flows from investing activities (14,857) 7,653,871Cash flows from (used in) financing activities
Decrease in derivative financial liabilities for hedging (235,755) (6,546)(Decrease) increase in bank notes payable (6,305,512) 14,623,612Cash dividends paid (2,690,000) (4,365,858)
Net cash flows from (used in) financing activities (9,231,267) 10,251,208Net increase (decrease) in cash and cash equivalents 24,655,017 (11,776,629)Cash and cash equivalents at beginning of period 41,390,526 53,167,155Cash and cash equivalents at end of period $ 66,045,543 41,390,526Components of cash and cash equivalents:
Cash and cash equivalents reported in the statement of financial position $ 29,274,099 6,697,772Due from the Central Bank and call loans to banks qualifying for cash and cash equivalents
under the definition of IAS 7 36,771,444 34,692,754Cash and cash equivalents at end of period $ 66,045,543 41,390,526
Annual Report
206
207
Review and Analysis of Financial Conditions, Financial Results and Risk Management
In Taiwan, Standard Chartered Bank has a
team of 10 visually impaired staff plus a guide
dog on the telesales team; they are not only
the inspiration to the Bank’s VI employment
project but also the living proof that we are
Here for the People.
208
Annual Report
I. Analysis of Financial Conditions - adopts IFRSs International Financial Reporting Standards - and Its Subsidiaries
Unit : NTD‘000
YearItem
2013 2012Increase / (Decrease) Variance
Amount %
Cash and cash equivalent, Due from the Central Bank and call loans to banks
97,808,205 74,770,966 23,037,239 30.81
Financial assets at fair value through profit or loss 20,458,887 29,544,710 (9,085,823) (30.75)
Cash flow adequacy ratio, net (207.10) (238.65) 31.55
Ratio of cash flow from operations to cashflow from investments
228,182.95 (387.80) 228,570.75
IV. Impact on the Bank’s Financial Structure and Business from Substantial Capital Expenditure in the Last Few Years
(I) Major Capital Expenditures in Recent Years
(II) Expected Benefits from Capital Expenditures:
Through branch remodeling and facilities upgrade, the Bank can provide customers with higher quality environment and services
whilst strengthen our competitiveness.
V. Reinvestment Policy for 2013, Main Reasons for Investment Gain or Loss, and the Improvement and Investment Plan for the Next Year
The primary objective of the Bank’s reinvestment plans is to generate operational synergy and strengthen cross‑sector
management as a financial institution. As of 2013, net realized gain from investee companies totaled NTD 342,809 thousand
dollars, which was primarily contributed by the Standard Chartered Life Insurance Agency Co., Ltd., Taiwan Standard Chartered
Insurance Agency Co., Ltd. and the cash dividends received from other investee companies.
Unit : NTD‘000
ProjectActual or Expected
Funding Sources
Actual or Expected
Completion Date
Total Capital Required
Actual or Expected Capital Utilization
2009 2010 2011 2012 2013
Branch Remodeling Self‑owned capital 2009 252,864 252,864
Branch Remodeling Self‑owned capital 2010 224,054 224,054
Branch Remodeling Self‑owned capital 2011 41,566 41,566
Branch Remodeling Self‑owned capital 2012 71,988 71,988
Branch Remodeling Self‑owned capital 2013 157,822 157,822
VII. Review and Analysis of Financial Conditions, Financial Results and Risk Management
216
Annual Report
VI. Risk Management
(I) Qualitative and Quantitative Information of All Risks
1. Credit Risk Management Structure and Capital Requirement(1) Credit Risk Management Structure
Description / Disclosure
Credit risk strategy, goal, policy and procedure
The management of risk lies at the heart of Standard Chartered’s business. One of the main risks we incur arises from extending
credit to customers through our trading and lending operations.
Effective risk management is fundamental to being able to generate profits consistently and sustainably and is thus a central part
of the financial and operational management of the Bank
Strategy & GoalThrough our risk management framework we manage enterprise‑wide risks, with the objective of optimizing risk‑adjusted
returns while remaining within our risk appetite.
As part of this framework, we use a set of principles that describe the risk management culture we wish to sustain:
Balancing risk and reward: risk is taken in support of the requirements of our stakeholders, in line with our strategy and
within our risk appetite;
Responsibility: it is the responsibility of all employees to ensure that risk‑taking is disciplined and focused. We take account
of our social, environmental and ethical responsibilities in taking risk to produce a return;
Accountability: risk is taken only within agreed authorities and where there is appropriate infrastructure and resource. All
risk‑taking must be transparent, controlled and reported;
Anticipation: we seek to anticipate future risks and maximize awareness of all risks; and
Competitive advantage: we seek competitive advantage through efficient and effective risk management and control.
Policies and ProceduresThe credit policies and procedures are considered and approved by the Board, which also oversees the delegation of credit
approval and loan impairment provisioning authorities. Policies and procedures that are specific to each business have been
established. These are consistent with the Group‑wide credit policies, but are more detailed and adapted to reflect the different
risk environment and portfolio characteristics.
Credit risk management organization and structure
Ultimate responsibility for the effective management of risk rests with the Bank’s Board. The Risk Committee, through its
authority delegated by the Board via the Executive Committee, is directly responsible for the management of credit risk.
The management of credit risk includes approving standards (and policies) for the measurement and management of credit
risk, approval of delegated approval authority framework and responsibilities to sub‑committees and to Risk Officers. The
Risk function is independent of the origination, trading and sales functions to ensure that the necessary balance in risk/return
decisions is not compromised. The Board and Executive Committee receive regular reports on risk management and are
authorized to investigate or seek any information relating to an activity within its term of reference.
217
Internal Audit is an independent function that reports to the Board. It provides assurance that the Bank’s standards, policies and
procedures are being complied with. The findings and recommended corrective actions from these audits are reported to all
relevant management and governance bodies.
The scope and characteristics of credit risk report and evaluation system
Risk measurement plays a central role, along with judgment and experience, in informing risk‑taking and portfolio management
decisions. It is a primary area for sustained investment and senior management attention.
Various risk measurement systems are available to the Risk function to enable them to assess and manage the credit portfolio.
These include systems to calculate probability of default ("PD"), loss given default ("LGD") and exposure at default ("EAD") on a
transaction, counterparty and portfolio basis.
A number of internal risk management reports are produced on a regular basis, providing information such as: individual
counterparty, counterparty group, portfolio exposure, credit grade migration, the status of accounts or portfolios showing signs
of weakness or financial deterioration, models performance and updates on credit markets.
The Bank regularly monitors credit exposures, portfolio performance, and external trends which may impact risk management
outcomes. Internal risk management reports are presented to risk committees, containing information on key environmental,
political and economic trends across major portfolios and countries; portfolio delinquency and loan impairment performance.
Policies for credit risk hedge and mitigation, as well as the strategy and procedure for maintainingefficiency in risk hedge and mitigation tools
Potential credit losses from any given account, customer or portfolio are mitigated using a range of tools such as collateral,
netting agreements, credit insurance, credit derivatives and other guarantees. The reliance that can be placed on these mitigates
is carefully assessed in light of potential issues such as legal certainty and enforceability, market valuation correlation and
counterparty risk of the guarantor.
Risk mitigation policies determine the eligibility of collateral types. Collateral types which are eligible for risk mitigation include:
cash; residential, commercial and industrial property; fixed assets such as ship, aircraft, plant and machinery; marketable
securities; commodities; bank guarantees and letters of credit. The Bank also enters into collateralized reverse repurchase
agreements.
Where guarantees or credit derivatives are used as Credit Risk Mitigation (“CRM”) the creditworthiness is assessed and established
using the credit approval process in addition to that of the obligor or main counterparty.
Collateral is valued in accordance with the CRM policy, which prescribes the frequency of valuation for different collateral types,
based on the level of price volatility of each type of collateral and the nature of the underlying product or risk exposure. Collateral
held against impaired loans is maintained at fair value.
Certain credit exposures, e.g. non‑recourse receivable service, are mitigated using credit default insurance.
Bilateral and multilateral netting are used to reduce settlement counterparty risk. Settlement exposures are generally netted
using bilateral netting documentation in legally approved jurisdictions, Delivery versus Payments or Payment versus Payments
systems.
VII. Review and Analysis of Financial Conditions, Financial Results and Risk Management
218
Annual Report
Method used for regulatory capital calculation
Standardized Approach
(2) Required Capital for Credit Risk under Standardized Approach
31 December 2013
Unit : NTD‘000
Exposure Type Exposure after Risk Mitigation Required Capital
Sovereign 256,739,936 11,513
Non‑central government public sector entities (PSEs) ‑ ‑
Banks (including multilateral development banks – MDBs) 103,884,341 4,079,476
Corporations (including security and insurance companies) 127,330,644 9,928,242
Retail 147,936,454 9,881,431
Residential mortgage 113,944,459 4,111,224
Equity security investment 38,945 12,462
Other assets 13,390,753 803,934
Total 763,265,531 28,828,283
219
2. Exposures and Capital Requirement under the Asset-backed Securitization Management Structure (1) Asset-backed Securitization Management Structure
Description / Disclosure
Strategy and procedure of asset securitization management
Currently, the Bank has no securitized asset.
Asset securitization management organization and structure
Not applicable.
The scope and characteristics of asset securitization risk report and evaluation system
Not applicable.
Policies for hedging or mitigating asset securitization risks as well as the strategy and procedure for maintaining efficiency in the tools of hedging and mitigating risks
Currently, the Bank has no securitized asset.
Method used for regulatory capital calculation
Not applicable.
The general qualitative disclosure requirement, including a discussion of: 1. the Bank’s objectives in relation to securitization activities, as well as the types of risks assumed
and retained with resecuritization activity;2. the nature of other risks(e.g. liquidity risk) inherent in securitized assets;3. the various roles played by the bank in the securitization process and an indication of the extent of
the bank’s involvement on each of them;4. a description of the processes in place to monitor changes in the credit and market risk of
securitization exposures;5. a description of the bank’s policy governing the use of credit risk mitigation to mitigate the risks
retained through securitization and resecuritization exposures.
Not applicable.
Summary of the bank’s accounting policies for securitization activities
Not applicable.
VII. Review and Analysis of Financial Conditions, Financial Results and Risk Management
220
Annual Report
(2) Asset Securitization : 【None】
The name of external credit assessment institution (ECAI)used for asset securitization and the exposures for which ECAI is used in the banking book
Not applicable.
An explanation of significant changes to any of the quantitative information (e.g. movement of assets between banking book and trading book)since the last reporting period
Not applicable.
3. Operational Risk Management Structure and Capital Requirement (1) Operational Risk Management Structure
Description / Disclosure
Strategy and procedure of operational risk management
Operational risk is the potential for loss arising from the failure of people, processes, or technology or the impact of external
events.
It is the Bank’s objective to minimize exposure to operational risk, subject to cost trade‑offs. Operational risk exposures are
managed through a framework of policies and procedures that drive risk identification, assessment, acceptance, control, and
monitoring.
Responsibility for the management of operational risk rests with businesses and functions as an integral component of their first
line risk management responsibility.
Operational risk management organization and structure
Governance over operational risk management is achieved through a defined structure of committees.
The Risk Committee is responsible for ensuring processes and procedures are in place for the monitoring and control of overall
risk. The Risk Committee meets regularly to review exposure and compliance reports for limit compliance and stress testing.
The Country Operational Risk Committee ("CORC"), chaired by the Chief Executive Officer, is responsible for the management of
operational risks within the Bank, and for ensuring that an appropriate and robust operational risk management framework is in
place to monitor and manage operational risk.
The Bank also receives strong support from SCB regional and group business and operational risk management functions based
outside of Taiwan.
221
The scope and characteristics of operational risk report and evaluation system
The following risk control areas fall within the scope of operational risk, including people risk, technology risk, vendor risk,
property and security management risk ("CRES"), compliance risk, legal risk, accounting & financial control risk, tax management
risk, and corporate structure risk.
The on‑going effectiveness of operational risk controls is ensured through an assurance approach that comprises three distinct
lines of responsibility. At its foundation is the responsibility that businesses and functions have to adhere to control requirements
and to periodically test adherence through control sample testing performed on controls embedded within critical processes.
Policies for operational risk hedge/mitigation, as well as the strategy and procedure formaintaining efficiency in risk hedge/mitigation tools
The operational risk management policies and procedures are integral components of the Operational Risk Framework
which builds on the broader Risk Management Framework. Operational risks are managed through an end to end process of
identification, assessment, acceptance, control and monitoring. This four step management process is performed at all levels
across the Bank and is the foundation of the management approach. Once identified risks are assessed against standard criteria
to determine their significance and the degree of risk mitigation effort required to reduce the exposure to acceptable levels. Risk
mitigation plans are overseen by the appropriate governance committee.
Method used for regulatory capital calculation
Basic Indicator Approach
(2) Required Capital for Operational Risk
31 December 2013
Year Gross Operating Profit Required Capital
2011 17,500,766
2012 16,312,187
2013 14,662,246
Total 48,475,199 2,423,760
Unit : NTD‘000
VII. Review and Analysis of Financial Conditions, Financial Results and Risk Management
222
Annual Report
4. Market Risk Management Structure and Capital Requirement (1) Market Risk Management Structure
Description / Disclosure
Strategy and procedure of market risk management
Market risk is the risk of loss resulting from changes in market prices and rates. The Bank is exposed to market risk arising
principally from customer‑driven transactions. The objective of the Bank’s market risk policies and procedures is to obtain the
best balance of risk and return while meeting customers’ requirements.
Market risk management organization and structure
Market Risk ("GMR") Taiwan implements and manages market risk, in accordance with FSC regulatory requirements, and market
risk policies and procedures which cover both banking and trading book. The market risk policies, procedures and limits are
annually reviewed by GMR Taiwan and are in line with Group Market Risk Committee guidance. The policies and procedures are
presented to the Board for approval.
Market risk limits are proposed by the business within the terms of the agreed policy. Limits are presented to the Risk Committee
for approval with its authority delegated by the Board. Limits for derivatives require approval from the Board.
GMR Taiwan monitors exposures against these limits on a daily basis. Related market risk management results are reported to the
Risk Committee at a minimum on a quarterly basis.
The Company also receives strong support from SCB regional and group business and market risk management functions based
outside of Taiwan.
The scope and characteristics of market risk report and evaluation system
The scope of market risk report covers market risk exposures in both trading book and banking book. The primary categories of
market risk for the Bank are interest rate risk and currency exchange rate risk linked to trading products in financial markets, as
the Bank has not held any positions relating to commodity price risk and equity price risk.
The Bank measures the risk of losses arising from future potential adverse movements in market rates, prices and volatilities
using a Value at Risk (“VaR”) methodology. VaR, in general, is a quantitative measure of market risk which applies historical market
conditions to estimate the potential future loss in market value that will not be exceeded in a set time period at a set statistical
confidence level.
GMR Taiwan complements the VaR measurement by stress testing of market risk exposures to highlight the potential risk that
may arise from extreme market events that are rare but plausible. Stress testing is an integral part of the market risk management
framework and considers both historical market events and forward looking scenarios. Stress testing is applied to trading and
non‑trading books respectively.
223
Policies for market risk hedge/mitigation, as well as the strategy and procedure for maintainingefficiency in risk hedge/mitigation tools
Market Risk is mitigated by the Company’s standard process as risk is measured, monitored, reported and controlled on a
portfolio basis.
Market risk policies, procedures and limits are annually reviewed by GMR Taiwan. The policies and procedures cover both trading
and non‑trading books and are presented to Board for approval.
All products used in risk mitigation must be authorized products in their own right with appropriate Product Programs.
Any product a business uses for risk mitigation must be explicitly referenced in the Market Risk limit for the business.
Method used for regulatory capital calculation
Standardized Approach / Delta‑Plus for Options
(2) Required Capital for Market Risk
31 December 2013
5. Liquidity risk includes maturity analysis of the Bank’s assets and liabilities. It also describes
the measures for liquidity management of assets and capital gap. Refer to the "Financial
Highlights"section from page 180 to page 185 for details.
Item Required Capital
Interest Rate Risk 1,465,315
Foreign Exchange Risk 72,115
Equity Position Risk 0
Commodities Risk 0
Total 1,537,430
Unit : NTD‘000
VII. Review and Analysis of Financial Conditions, Financial Results and Risk Management
224
Annual Report
(II) Impact of Changes in Domestic/Foreign Major Policies and Laws on the Bank’s Financial Structure and Business and Responsive Actions Thereof :
1. DBU RMB Business In January 2013, the Central Bank of the Republic of China (Taiwan) (“CBC”) revised “Regulations Governing Foreign Exchange
Business of Banking Enterprises” and issued various rulings to allow DBU to conduct RMB business. The Bank launched DBU
RMB business (e.g. deposits loans, trades, remittances) on 6 February 2013 and derivatives business on 8 February 2013 in
accordance with applicable laws and regulations.
2. Regulations governing plans for security measures for personal data files of non-government institutions regulated by FSC
Considering that the financial services industry (the “industry”) keeps large volumes of personal data files and its responsibility
in maintaining personal data safety is more significant than that of other industries, following the enactment of the Personal
Data Protection Act (“PDPA”) on 1 October, 2011, FSC promulgated “Regulations governing plans for security measures for
personal data files of non‑government institutions regulated by FSC” (“Regulations”) on 8 November 2013 requiring the
industry to develop and implement a personal data security maintenance plan and a process dealing with post‑termination
data so as to enhance the management and assurance on personal data protection.
The Bank has formed a task force to plan, implement, modify and execute such plan and process. We will also follow the
Regulations to submit our plan and process to the management team for approval or sign‑off as required.
3. Foreign Account Tax Compliance Act ('FATCA') To prevent U.S. tax payers from tax evasion, U.S. Government promulgated Foreign Account Tax Compliance Act (‘FATCA’)
in 2010, which laws will become in effect on 1 July 2014. Pursuant to FATCA, participating foreign financial institutions are
required to provide account information of U.S. clients to Internal Revenue Service (‘IRS’) to combat tax evasion through
offshore accounts. Under the instruction of Executive Yuan, FSC along with Ministry of Finance announced on 2 April 2013 that
a task force composed of FSC, Ministry of Finance, Ministry of Justice, and Ministry of Economic Affairs etc, has been formed
and keeps dialogue with the Ministry of Finance, U.S., with an aim to enter an inter‑government agreement.
The Bank has formed a working group, responsible for development and execution of the project, including system
enhancement, testing, refinement of account opening process and documentation, training of staff, registration with IRS and
signing of Foreign Financial Institutions (‘FFI’) Agreement, etc.
(III) Impact of Technological and Industrial Changes on the Bank’s Financial Structure and Business and Responsive Actions Thereof
The innovations on technology have helped the Bank to provide more advanced products and services to customers. However,
it also increases the challenges on customer data protection and information security. The Bank not only keeps on adopting new
technologies to uplift the overall service level, but also investing resources to strengthen the security over systems with high‑
level standards.
(IV) Impact of Changes in Corporate Image on the Bank and Responsive Actions Thereof
Brand image and reputation are the most significant intangible assets for a bank. The protection of the Bank’s reputation will take
priority over all activities including revenue generation activities at all times. The Bank has specific reputation and risk policies and
225
procedures, in particular, the local and group level mechanisms of reputation risk management: from anticipation, monitoring,
reporting, fast tracking, to supervision, that are thorough and comprehensive, as guarantees to ensure the least likelihood of the
incident of reputation risks.
While the world was affected by the global financial crisis in 2008 and 2009, the Bank still delivered strong performance because
of its footprints in Asia, Africa, and Middle East, its focus on core businesses, and its strong risk management mechanisms.
Facing the EU sovereign debt crisis and the uncertainty of global recovery from 2011 to 2013, the Bank remained prudent and
is devoted to bolstering its service quality and risk management by regular employee trainings, maintaining the Bank’s image
and protecting consumers’ rights. Such practice is closely integrated with ensuring a sustainable business, executing responsible
selling and marketing, battling financial crimes, completing banking service network, and participating in environmental
protection and community services. The Bank is committed to its brand promise — Here for good — embedded in every
employee’s daily routine, known among all stakeholders, and deemed as the best brand image among clients. The Bank’s
education efforts in risk management and money‑laundry prevention have earned significant results and recognized by the
regulator and the Government for many times.
(V) Anticipated Benefits, Potential Risks and Responsive Actions for M&A :【None】
(VI) Anticipated Benefits, Potential Risks and Responsive Actions for Expansion of Business Locations
In order to provide customers with higher quality environment and services, grow market shares, as well as to strengthen the
Bank’s competitiveness, Zhubei Branch was relocated in 2013.
We sent separate customer notifications to all Zhubei branch customers, posted announcement in branch, and added top news
in the Bank’s official website prior to relocation to minimize the inconvenience to customers. Cautious actions were taken to
properly deal with the rights and obligations of existing customers, or alternative services were provided to ensure customers’
interests are protected in the course of branch relocation.
(VII) Business Concentration Risk and Responsive Actions Thereof
To be in compliant with Article 33.3 of the Banking Act, the Bank regularly discloses and reports the credit limits for the same
legal person, the same natural person, the same concerned party and the same related entity.
In addition, the target markets and overall characteristics of the credit portfolios, including credit decentralization and levels of
tolerance, have been clearly set in the Country Portfolio Standards ("CPS") of the Bank. The CPS is established according to
the Wholesale Banking ("WB") business strategies and within acceptable risk appetite and principally includes measurable
quantitative portfolio parameters, covering concentration caps of major industry sectors, credit grade distribution, concentration
risk to single customer group, and tenor profile.
As to the management of concentration to single corporate entity and customer groups, it is aligned with the Credit Risk
Management Guidelines of Concentration to Single Corporate Entity and Customer Groups as approved by the Risk Committee.
The concentration risk limits for single corporate entity, affiliated counterparties or customer groups are established on the basis
of internal credit grades to ensure concentration risk on large exposures is properly addressed and managed.
VII. Review and Analysis of Financial Conditions, Financial Results and Risk Management
226
Annual Report
(VIII) Impact, Risks and Responsive Actions for Change of the Bank’s Ownership :【None】
(IX) Impact, Risks to the Bank and Responsive Actions Thereof due to a Major Transfer or Change in Ownership of Shares belonging to Directors, Supervisors or Major Shareholder with over 1% of Shareholding
The Bank is owned by a sole shareholder, Standard Chartered Bank ("SCB"), and all directors and supervisors are appointed
by SCB. During last year and until the date of publish of this annual report, there has been no major transfer of shares or
shareholding change of the Bank. As a result, there is no significant impact or risk against the operation of the Bank.
(X) Litigation and Non-litigation Matters :
For a corporate lending between the Bank (previously Hsinchu International Bank) and a corporate client, it was repaid in full
by the corporate guarantor. However, the corporate guarantor and another individual guarantor brought litigations against the
Bank in the Taipei District Court in June 2012, alleging the guarantees were not in existence as the original loan was flawed and
potentially void. The corporate guarantors also claimed a refund of NTD 115,437 thousand dollars. The Bank obtained favorable
judgments for both cases in the first instance. However the counterparties both appealed the cases. The above proceedings
have not concluded yet and the Bank cannot predict the outcome. Except for the above, the Bank is not involved in other material
litigations within 2013 and as of the date of the publication of the annual report.
(XI) Other Critical Risks and Responsive Actions Thereof :【None】
VII. Emergency Response Mechanism
To ensure that the Bank is capable of continuing critical business operations to reduce any potential risks of severe disruption
to business, financial and reputational damage, the Bank has instituted the "Crisis Management Team" and "Recovery Control
Center" with dedicated assignment of responsibilities to carry out Crisis Management Plan whilst facing an unexpected disaster.
Crisis Management Team (CMT) convened by Chief Executive Officer collectively formulate response strategies & actions with
Executive Management team to address critical incidents, which may bring severe impact on the business operation of the Bank.
Recovery Control Center (RCC) will base upon the decision to manage the emergency response actions to mitigate the impact on
the business operation.
All departmental Business Continuity Plan (BCP) are reviewed and updated and BCP drills are conducted periodically. IT Disaster
Recovery Plan (DRP) are planned and tested by IT to ensure that system recovery capabilities are sufficient to facilitate the
implementation of all BCPs.
The significant incidents will be notified to concerned key stakeholders based on the "Standard Chartered Bank Taiwan Limited
Rules Governing the Handling of Material Incidents". Corporate Affairs is a dedicated unit for media contact if required.
VIII. Other Important Matters :【None】
227
Special NotesVIII
Standard Charter has supported the Atayal students of the Jinping Elementary School in Hsinchu County through volunteer services.
Annual Report
228
100%
100%
Standard Chartered
Bank (Taiwan) Limited
Standard Chartered Life
Insurance Agency Co., Ltd.
Taiwan Standard Chartered
Insurance Agency Co., Ltd.
I. Information on Affiliated Enterprises
(I) Organizational Chart of Affiliated Enterprises
229
(II) Basic Information of Affiliated Enterprises
(III) Industry Covered by Affiliated Enterprises :
1. Standard Chartered Life Insurance Agency Co., Ltd. : Insurance
2. Taiwan Standard Chartered Insurance Agency Co., Ltd. : Insurance
(IV) Information on Directors and Supervisors of Affiliated Enterprises
(V) Business Overview of Affiliated Enterprises :
(VI) Consolidated Financial Statements of Affiliated Enterprises : Refer to the "Financial Highlights" section from page 201 to page 205.
Name of BusinessDate of
EstablishmentAddress Paid‑in Capital
Major Line of Business or Products
Standard Chartered Life Insurance Agency Co., Ltd.
07/09/19997F, No. 106, Zhongyang Road, Zhongzheng Village, Hsinchu City
3,000 Life insurance agent
Taiwan Standard Chartered Insurance Agency Co., Ltd.
30/09/19997F, No. 106, Zhongyang Road, Zhongzheng Village, Hsinchu City
3,000 Property insurance agent
Unit : NTD‘000
Unit : NTD‘000
Name of Business Title Name or Company RepresentativeShares Held
Number Ratio
Standard Chartered Life Insurance Agency Co., Ltd.