1 Standard Chartered PLC - Performance highlights For the year ended 31 December 2017 Standard Chartered PLC (the Group) today releases its results for the year ended 31 December 2017. All figures are presented on an underlying basis unless otherwise stated with a full reconciliation between statutory and underlying results presented on page 12 of this press release and page 211 of the 2017 Annual Report. “The transformation of the Group continued in 2017 with the significant improvement in underlying profits, a strong capital position and emerging clarity on regulatory capital requirements allowing us to resume paying dividends. We are encouraged by our start to 2018 and remain focused on realising the Group’s full potential.” Bill Winters, Group Chief Executive Financial performance for the year • Significant improvement in profitability and returns was a direct consequence of the many actions taken since 2015 o Profit before tax of $3.0bn was up 175% and up 71% excluding Principal Finance o Statutory profit before tax of $2.4bn is stated after restructuring and other items and was $2.0bn higher o RoE improved from 0.3% to 3.5%; just under half-way towards the Group's initial milestone of 8% • Operating income of $14.3bn was up 3% despite a 4% drag from Financial Markets o 13% income growth from key areas of investment (half of total), with particular strength in liability-led products o Industry-wide low volatility during 2017 impacted performance in Financial Markets o Income was 3% lower quarter-on-quarter due partly to the early achievement of a bonus in Wealth Management o Net interest income increased 5% and the net interest margin increased slightly to 1.55% • Other operating expenses of $8.6bn were well controlled rising 2% due primarily to variable pay o Over 85% of the four-year $2.9bn gross cost efficiencies target has been achieved with a year to go o Gross savings funded investment of $1.5bn (2016: $1.4bn), 50% over the 2015 level o Anticipate operating expenses excluding the UK bank levy in 2018 to be below 2015 • Regulatory costs rose 15%, with several large programmes including MiFID II and IFRS 9 being implemented o Further significant progress in implementing financial crime prevention capabilities o Continuing cooperation and ongoing discussions with US and UK authorities to resolve historical matters • After updating prior-year estimates, the UK bank levy was $220m; the estimate for 2018 is around $310m • Asset quality overall has improved with the focus on better quality origination within a more granular risk appetite o Loan impairment of $1.2bn halved as management actions resulted in improvement across all client segments • Profit from associates and joint ventures rose $185m following better performances in China and Indonesia • RWAs in the liquidation portfolio have been reduced considerably from $20bn in 2015 to $815m at the end of 2017 • Basic earnings per share increased from 3.4 cents in 2016 to 47.2 cents in 2017 Balance sheet and capital • Capital and liquidity ratios remain strong o CET1 ratio of 13.6% remains above the Group’s reiterated 12-13% target range o Liquidity coverage ratio was 146% with a prudent surplus to regulatory requirements • Strong and broad-based balance sheet growth in both customer loans and advances and customer deposits • The impact of adopting IFRS 9 and implementing final Basel III reforms is considered manageable o Adopting IFRS 9 increases credit provisions by $1.2bn and has a negligible day-one impact on the CET1 ratio o Early assessment of final Basel III reforms to be implemented in 2022 is a 10-15% increase in current RWAs Dividend • The Board has recommended resuming a dividend given improving financial performance and strong capital o Full year dividend of 11 cents per ordinary share proposed for 2017 o Intend to increase the dividend per share over time as the Group’s performance improves Outlook • New medium-term Group income growth target of 5-7% CAGR with cost increases controlled below inflation • We are encouraged by our start to 2018 with broad-based double-digit year-on-year income growth • Operating leverage and continued focus on risks is expected to deliver RoE above 8% in the medium term
Transcript
1
Standard Chartered PLC - Performance highlights
For the year ended 31 December 2017
Standard Chartered PLC (the Group) today releases its results for the year ended 31 December 2017. All figures arepresented on an underlying basis unless otherwise stated with a full reconciliation between statutory and underlyingresults presented on page 12 of this press release and page 211 of the 2017 Annual Report.
“The transformation of the Group continued in 2017 with the significant improvement in underlying profits, a strongcapital position and emerging clarity on regulatory capital requirements allowing us to resume paying dividends. Weare encouraged by our start to 2018 and remain focused on realising the Group’s full potential.”
Bill Winters, Group Chief Executive
Financial performance for the year
• Significant improvement in profitability and returns was a direct consequence of the many actions taken since 2015o Profit before tax of $3.0bn was up 175% and up 71% excluding Principal Financeo Statutory profit before tax of $2.4bn is stated after restructuring and other items and was $2.0bn highero RoE improved from 0.3% to 3.5%; just under half-way towards the Group's initial milestone of 8%
• Operating income of $14.3bn was up 3% despite a 4% drag from Financial Marketso 13% income growth from key areas of investment (half of total), with particular strength in liability-led productso Industry-wide low volatility during 2017 impacted performance in Financial Marketso Income was 3% lower quarter-on-quarter due partly to the early achievement of a bonus in Wealth Managemento Net interest income increased 5% and the net interest margin increased slightly to 1.55%
• Other operating expenses of $8.6bn were well controlled rising 2% due primarily to variable payo Over 85% of the four-year $2.9bn gross cost efficiencies target has been achieved with a year to goo Gross savings funded investment of $1.5bn (2016: $1.4bn), 50% over the 2015 levelo Anticipate operating expenses excluding the UK bank levy in 2018 to be below 2015
• Regulatory costs rose 15%, with several large programmes including MiFID II and IFRS 9 being implementedo Further significant progress in implementing financial crime prevention capabilitieso Continuing cooperation and ongoing discussions with US and UK authorities to resolve historical matters
• After updating prior-year estimates, the UK bank levy was $220m; the estimate for 2018 is around $310m• Asset quality overall has improved with the focus on better quality origination within a more granular risk appetite
o Loan impairment of $1.2bn halved as management actions resulted in improvement across all client segments• Profit from associates and joint ventures rose $185m following better performances in China and Indonesia• RWAs in the liquidation portfolio have been reduced considerably from $20bn in 2015 to $815m at the end of 2017• Basic earnings per share increased from 3.4 cents in 2016 to 47.2 cents in 2017
Balance sheet and capital
• Capital and liquidity ratios remain strongo CET1 ratio of 13.6% remains above the Group’s reiterated 12-13% target rangeo Liquidity coverage ratio was 146% with a prudent surplus to regulatory requirements
• Strong and broad-based balance sheet growth in both customer loans and advances and customer deposits• The impact of adopting IFRS 9 and implementing final Basel III reforms is considered manageable
o Adopting IFRS 9 increases credit provisions by $1.2bn and has a negligible day-one impact on the CET1 ratioo Early assessment of final Basel III reforms to be implemented in 2022 is a 10-15% increase in current RWAs
Dividend
• The Board has recommended resuming a dividend given improving financial performance and strong capitalo Full year dividend of 11 cents per ordinary share proposed for 2017o Intend to increase the dividend per share over time as the Group’s performance improves
Outlook
• New medium-term Group income growth target of 5-7% CAGR with cost increases controlled below inflation• We are encouraged by our start to 2018 with broad-based double-digit year-on-year income growth• Operating leverage and continued focus on risks is expected to deliver RoE above 8% in the medium term
2
Standard Chartered PLC - Summary of results
For the year ended 31 December 2017
2017$million
2016$million
Underlying performanceOperating income 14,289 13,808Operating expenses (10,120) (9,975)Impairment losses on loans and advances and other credit risk provisions (1,200) (2,382)Other impairment (169) (383)Profit before taxation 3,010 1,093
Return on ordinary shareholders' equity (%) 3.5 0.3Cost to income ratio (%) 70.8 72.2
Statutory performanceOperating income 14,425 14,060Operating expenses (10,417) (10,211)Impairment losses on loans and advances and other credit risk provisions (1,362) (2,791)Goodwill impairment (320) (166)Other impairment (179) (446)Profit before taxation 2,415 409Profit/(loss) attributable to parent company shareholders 1,219 (247)Profit/(loss) attributable to ordinary shareholders1 774 (478)
Return on ordinary shareholders' equity (%) 1.7 (1.1)Net interest margin (%) 1.6 1.5Cost to income ratio (%) 72.2 72.6
Balance sheet and capitalTotal assets 663,501 646,692Total equity 51,807 48,658Loans and advances to customers2 285,553 255,896Customer accounts3 411,724 378,302Total capital 58,758 57,438
Advances-to-deposits ratio (%) 69.4 67.6Common Equity Tier 1 ratio (%) 13.6 13.6Total capital (%) 21.0 21.3UK leverage ratio (%) 6.0 6.0
Information per ordinary share Cents Cents
Earnings per share – underlying 47.2 3.4– statutory 23.5 (14.5)
Ordinary dividend per share 4 11.0 -Net asset value per share 1,366.9 1,307.8Tangible net asset value per share 1,214.7 1,163.9
1 Profit/(loss) attributable to ordinary shareholders is after the deduction of dividends payable to the holders of non-cumulative redeemable preferenceshares and Additional Tier 1 securities classified as equity
2 Includes balances held at fair value through profit or loss and reverse repurchase agreements and other similar secured lending3 Includes balances held at fair value through profit or loss and repurchase agreements and other similar secured borrowing4 Represents the recommended full year dividend per share
3
Standard Chartered PLC – Table of contents
Page
Performance highlights 1
Summary of results 2
Chairman’s statement 4
Group Chief Executive’s review 6
Group Chief Financial Officer’s review 9
Client segment reviews 15
Regional reviews 21
Group Chief Risk Officer’s review 26
Supplementary financial information 31
Shareholder information 36
4
Standard Chartered PLC - Chairman’s statement
Focused on unlocking potential while strengthening culture and resilience
In my statement last year – my first as Chairman of the Group – I committed to focus my efforts on three priorities:helping the Group to unlock its true potential; improving its resilience to shocks; and ensuring excellent governanceand the highest ethical standards. This is critical to achieving sustainable, long-term growth and improving long-termvalue.
Unlocking the Group’s potential
The Group’s underlying profit before tax trebled in the last year. This is encouraging given that the extraordinary enginethat sits within the Group is not yet firing on all its cylinders, but we must improve the result further.
To increase the Group’s returns over the medium term, we need to grow income in a strong, safe and sustainablemanner, while maintaining both cost and capital discipline. We are confident that we can do this. There are clear linksbetween the global economy, international banks and trade that are fundamentally tied to global growth andprosperity. As one of the world’s top-three trade banks, the Group is ideally positioned to benefit from theopportunities that the continuing recovery in global trade will bring.
Banking plays a crucial role at the heart of the economy and in the lives of individuals. We are privileged to be presentin some of the most exciting and dynamic economies in the world, which are inhabited by two-thirds of the world’spopulation. This unique position brings with it a tremendous responsibility. Our obligation is to carry out our businessin a way which not only provides returns for our shareholders but also delivers good things for society: our clients,communities, and people. All of our extensive work in our markets to improve standards of conduct and control isaimed at helping to improve the lives of people in the communities where we work, through enabling sustainablegrowth. We complement this with our successful health and education programmes such as Seeing is Believing(seeingisbelieving.org) and Goal (sc.com/goalprogramme).
Improving our resilience
We have experienced a decade of lower economic growth, subdued world trade, low interest rates, stricter regulationand increasing competition, including from the technology sector. Recent political controversies about globalisationhave further complicated the situation.
Yet, as Bill Winters describes in his review, many indicators are now changing in a positive direction. Economicforecasts have been upgraded again, with global growth broadening and projected to improve this year and next, andworld trade continues to advance at a healthy pace. It is up to us to continue working hard to identify and seize theopportunities as they arise, becoming more competitive, embracing technological change and innovation, andcontinuing to develop attractive value propositions for our clients.
At the same time, we should be mindful of the risks around this favourable outlook. These range from the geopoliticalsituations in North Korea and the Middle East, and protectionist fears, to those stemming from the challenges ofnormalising monetary policy in an environment of elevated market valuations and high leverage. The realisation ofsome of these risks could provoke sharp market corrections, undermine the global recovery and adversely affectemerging markets that are more leveraged or exhibit weaker fundamentals. It is essential that we continue our effortsto increase the Group’s resilience to such potential shocks.
I believe the completion by international standard setters of the international regulatory capital framework for banks,known as Basel III, is a positive development for the industry overall. Although banks, as well as their investors andclients, do not yet know precisely how the rules will be applied in practice, having the framework in place is animportant step towards a more resilient banking system that supports the real economy.
Against this backdrop, the Group’s strengthening position was evident in several respects in 2017. The quality of ourbalance sheet improved significantly, loan impairment reduced to around half the level it was in 2016, and we passedwhat was considered the toughest Bank of England stress test to date. It is critical that we maintain the focus andprogress into 2018 while – as I said at this time last year – being willing to adapt and make the necessary decisions asconditions evolve.
Ensuring excellent governance
The independent, externally facilitated Board evaluation that I commissioned shortly after becoming Chairmanconcluded that the Board is operating effectively and provided useful ideas on how to maximise its leadership to theGroup. More details can be found in the Directors' report in the Annual Report.
Towards the end of the year, following the departure of Dr Kurt Campbell, Dr Ngozi Okonjo-Iweala joined us as anindependent non-executive director. Ngozi has significant geopolitical, economic, risk and development experience ata government level and in international organisations. She twice served as Finance Minister in Nigeria, Africa’s largesteconomy and one of our most significant African markets, and was part of the senior leadership of the World Bank.
5
Standard Chartered PLC - Chairman’s statement
I would like to take this opportunity to thank Kurt for his significant contributions to the Group, and welcome Ngozi tothe Board.
Towards the end of the year we also recently announced the appointment of Christine Hodgson as SeniorIndependent Director of the Group, in addition to her current role as Chair of the Remuneration Committee. Christinetakes over this role from Naguib Kheraj, who will remain as Deputy Chairman and Chair of the Audit Committee.
Embedding a culture of ethical banking
Deeply embedding a culture of ethical banking will ensure we are able to deliver for our investors, our clients, ourcolleagues and our communities. Good conduct –doing business in the right way – can, and will, be a powerfuldifferentiator for our Group.
Since I wrote to you in the 2017 Half Year Report, I have continued to travel extensively across our franchise, meetingour clients, colleagues, investors, regulators and other stakeholders. This has reinforced for me what an extraordinaryorganisation we have, with talented and dedicated colleagues and remarkably strong client relationships.
As part of our focus on brand and culture in 2017, we engaged with our colleagues around the world to identify theessence of what we stand for, who we are and how we need to behave to deliver our full potential. This led to ourinvigorated purpose statement – “Driving commerce and prosperity through our unique diversity” – and a refreshedset of valued behaviours. These are designed to support the Group’s desired culture, drive our transformation andincrease our returns and resilience.
The Board continues to oversee far-reaching changes to transform the Group’s response to financial crime. This is acritical journey, and we must remain focused on delivering this transformation to provide the foundation for a strong,sustainable business in the long term.
Dividend
In recognition of our increased confidence in the prospects for the Group, I am pleased to report that we arerecommending the resumption of dividends with an 11 cent per share distribution in respect of 2017. The Boardunderstands the importance of the ordinary dividend to shareholders and intends to increase the full year dividend pershare over time taking into account the earnings outlook, group and local regulatory capital requirements andopportunities to invest to grow the business.
Conclusion
This is an exciting time to be at Standard Chartered. I remain convinced that if we work hard, with dedication, passionand creativeness to seize the opportunities ahead of us, our future will be bright. I look forward to updating you on ourprogress in our 2018 Half Year Report.
José ViñalsGroup Chairman
27 February 2018
6
Standard Chartered PLC - Group Chief Executive’s review
A year of progress on a path that is now clear
In 2015, we set out a strategy designed to address our performance issues and reposition our business for success.We needed to secure our foundations, become lean and focused, and continually invest and innovate. Thanks to theoutstanding efforts of our 86,000 colleagues around the world, I am proud to say we are succeeding. Financialperformance in 2017 has been steady rather than spectacular but has significantly improved. The trebling ofunderlying profits, a strong capital position and emerging regulatory clarity allows us to resume paying dividends.
Of course, we have a long way to go. We are working hard to establish income growth momentum across all ourbusinesses, and our return on equity continues to fall short of our cost of capital. At the time of writing we are justunder halfway to our initial milestone of 8 per cent underlying return on equity. Our key investment areas are growingwell and we are encouraged by our start to 2018. But we are well aware that this franchise is capable of much more. Iwould like to update you on the work we have done so far, and set out how we intend to build upon our successes tocapture our full potential.
Securing our foundations
Our foundations have been secured. Our capital and liquidity positions are strong and our risk appetite is properlycalibrated, with much greater front-line ownership. Loan impairments are at less than half the levels of recent yearsand we have made substantial progress on the items we set out for restructuring. Our enhanced resilience has beenconfirmed by our performance in the most recent Bank of England stress tests, which we passed without caveat.Despite this progress, we are not complacent and remain focused on further enhancing the risk managementframework and capabilities of the Group, particularly in areas such as cyber security.
Getting lean and focused
We are ahead of our plans to remove inefficient cost from the business. This has enabled us to increase investmentsignificantly while remaining on track to hold overall expenses flat over the initial three years of our plan to the end of2018.
We are also working to instil a culture of excellence across our organisation. As José Viñals noted in his Chairman’sstatement, we recently re-set expectations for every employee of the Group, based on three new valued behaviours:Do the right thing, Never settle, and Better together. Taken together these behaviours will help us to continuouslychallenge the way we do things, make better decisions, and hold each other accountable for delivery. They will beingrained into every aspect of our business as we seek to put the client experience at the centre of every plan, everyprocess, and every product offering. They will also inform our hiring policies and how we measure individualperformance. We are building a truly client-centric organisation with no tolerance for complacency or mediocrity.
Investing and innovating
We have increased the rate of investment in our business by over 50 per cent since 2015, spending close to $1.5billion in 2017 to improve our controls and bolster our franchise capabilities. We have focused on the areas we set outin 2015: the opening of China, the digitisation of Retail Banking, the wealth management needs of the growing affluentpopulations across our markets, and the ongoing development of countries in Africa. We are beginning to see thepay-back in terms of client satisfaction and strong income momentum in these areas, which together with our highlyrelevant network offering and strong brand are the foundations for our future. We were convinced these were theareas of our competitive advantage in 2015 and we believe it even more so today.
Technology is already changing the financial services landscape, reflecting evolving client expectations. While itthreatens the status quo in some respects it will also be a source of relative advantage for us. Our presence in morethan 60 markets gives us an unparalleled opportunity to test and refine new concepts in single locations before rollingthem out across many. We are doing this in Côte d’Ivoire currently, trialling a purely digital retail banking offering. Andas one of the world’s leading trade banks we are ideally placed to drive a better client experience and higher returnsfor our shareholders by utilising new technologies. For example, we are using blockchain technology to streamlinecross-border payments as part of the first live, real-time payments corridor between Singapore and India that weinitiated in 2017. We will expand this capability to five more pairs of countries in 2018.
7
Standard Chartered PLC - Group Chief Executive’s review
Business performance
Our Corporate & Institutional Banking business has been re-positioned around our core strengths as a global networkbank. This focus enabled us to on-board over 90 mainly OECD-based multinational companies in 2017. They wereattracted by our strength in the emerging markets where they are investing. Early incremental income gains from thiscohort are encouraging.
Simon Cooper, the CEO of this business, explained at an investor seminar in November how over the coming yearswe will grow the top line further, while improving our efficiency through cost management, process improvement andupgrading technology. He also outlined initiatives to allocate capital more effectively within the business and furtherimprove its funding mix. At the same seminar the new head of our Financial Markets business Roberto Hoornwegexplained our plans to re-establish it as a leading risk manager in global markets and the leading provider in emergingmarkets.
The Retail Banking business has continued to attract more affluent clients in core commercial cities across ourfootprint and to improve our digital offering. We have successfully targeted Priority clients with improved wealth andadvice products and a more focused service offering. As a result, the proportion of income generated from thatsegment grew from 39 per cent to nearly 45 per cent in 2017, constituting most of the business’s 7 per cent incomegrowth in the year, excluding the effect of exiting Thailand and the Philippines. Over the same period the proportion ofRetail Banking clients that are digitally active rose from just under 40 per cent to around 45 per cent.
Ben Hung, who took over as CEO of Retail Banking in November, will host an investor seminar later in the first half ofthis year in which he will further explain our plans and ambitions for this business.
The ongoing transformation of our Commercial Banking business is delivering results. Enhanced frontlinemanagement and risk monitoring has translated into significantly lower loan impairment. It has returned to profitabilityand is now far better integrated with the other client segments, which will help it to generate higher quality and moresustainable income.
In Private Banking, we have continued to make significant investments in people and technology. We are encouragedby the increase in net new money driven in part by higher productivity from our new relationship managers, and in2018 the business will target further improvements in both respects.
Group outlook
We believe these business initiatives will help the Group generate income at a compound annual growth rate ofbetween 5 and 7 per cent in the medium term, with our personal banking businesses likely to grow at a relatively fasterrate than our corporate businesses, given our focus on optimising the returns from our credit portfolios. We expect toachieve this growth while tightly managing costs, which we aim to increase below the rate of inflation across theGroup. The operating leverage this creates, together with our continued focus on risks, will enable us to deliver anunderlying return on equity above 8 per cent in the medium term.
Continued focus on conduct
Group-wide awareness of our collective responsibility to our clients and the communities that we serve has tangiblyimproved. We have developed and implemented a framework defining and identifying good conduct, and I have madeit a strategic priority in 2018 for every segment and region rigorously to review, refine and strengthen our conductenvironment. While incidents cannot be entirely avoided, we have no tolerance nor appetite for breaches of laws andregulations, and are determined to ensure that our employees do the right thing.
It also remains a central part of our mission to help combat financial crime. Over the course of 2017, our work hasmade a real impact by identifying and preventing criminal activity in the financial system. We continue to innovate,putting into place more efficient and effective tools, practices and processes that should position us among theleaders in discovering and disrupting financial crime. We take our responsibility as a leading international bankseriously and continue to invest significantly in improving standards across our markets through our correspondentbanking and new NGO academies. Significantly, in 2017, the New York State Department of Financial Servicesrecognised that the Group has made “substantial progress” towards remediating past financial crime controls issuesand noted that we remain “fully committed” to finishing the job. As described in detail on page 259 in the AnnualReport, we continue to cooperate with authorities in the US and the UK in their investigations of past conduct and areengaged in ongoing discussions to resolve them. Concluding these historical matters, which could have a substantialfinancial impact, remains a focus for us.
8
Standard Chartered PLC - Group Chief Executive’s review
The external outlook
The global economic environment continues to improve. Productivity remains weak but is improving, and inflationremains low. Commodity prices have increased but are still at levels that do not threaten global growth. Geopoliticalrisks remain high but have not affected economic activity. We expect these conditions to persist for some time, and assuch expect interest rates to continue to normalise and trade volumes to increase. We expect the Middle East regionto return to growth in 2018, while many sub-Saharan Africa economies are showing signs of stabilisation andrecovery.
Conclusion
We have made encouraging progress in transforming the Group, the path ahead is clear and we are now wellpositioned to drive sustainable profit growth across our markets. We remain focused on improving our service to ourclients, generating strong returns for our investors, and contributing even more to the communities in which weoperate. This will enable us to realise the Group’s full potential.
Bill WintersGroup Chief Executive
27 February 2018
9
Standard Chartered PLC - Group Chief Financial Officer’s review
Significant improvement in the Group’s profitability
Performance summary
The significant improvement in the Group’s profitability in 2017 was a direct consequence of the many operational andfinancial actions taken since 2015 and provides a solid base off which to improve return on equity further over thecoming years.
• Statutory profit before tax of $2.4 billion is stated after restructuring and other items of $595 million and was asignificant improvement compared to the previous year. All commentary that follows is on an underlying basis unlessotherwise stated and a reconciliation between statutory and underlying profit is provided in the notes to the financialstatements in the Annual Report
• Underlying profit before tax of $3.0 billion was 175 per cent higher year-on-year and 71 per cent higher excludinglosses in 2016 in Principal Finance
• Underlying operating income of $14.3 billion was up 3 per cent year-on-year with good momentum across a range ofproducts partly offset by industry-wide low volatility that affected Financial Markets
• Underlying operating expenses of $9.9 billion excluding the UK bank levy were 3 per cent higher year-on-yearprimarily resulting from the implementation of some significant regulatory programmes and higher variable pay arisingfrom the Group’s improved financial performance
• Gross cost efficiencies were delivered ahead of plan and used to fund investments and offset inflation
• The UK bank levy of $220 million was $163 million lower after updating estimates made in previous years. The UKbank levy in 2018 is expected to be around $310 million
• Underlying impairment of loans and advances and other credit risk provisions of $1.2 billion was half the level it was in2016 reflecting management actions to improve the quality of the Group’s portfolios
• Profit from associates and joint ventures of $210 million was significantly higher than in 2016
• The Group incurred net restructuring charges of $353 million taking the total since November 2015 to $3.1 billion withthe exit of Principal Finance and the remaining exposures in the liquidation portfolio left to complete
• Other items include goodwill impairment of $320 million following an increase in the discount rate applied to theGroup’s subsidiary in Taiwan and a $78 million net gain on the disposal of equity investments
• Changes to the US tax regime caused a reduction in the Group’s deferred tax assets of $220 million. The underlyingeffective tax rate excluding the impact of these reforms and tax on other normalised items was 32.0 per cent
• The Group is well capitalised with a Common Equity Tier 1 (CET1) ratio of 13.6 per cent and is highly liquid. Customerloans and advances grew 12 per cent in the year, and liabilities 9 per cent
• The impact of adopting IFRS 9 on 1 January 2018 is an increase in credit provisions of $1.2 billion and, in line with theGroup’s previous guidance, an estimated decrease in the Group’s CET1 ratio by around 15 basis points. Undertransitional rules the day-one impact on the CET1 ratio is negligible
• Based on the 2017 balance sheet the Group’s early assessment of the impact of final Basel III reforms to beimplemented in 2022 is an increase in the Group’s risk-weighted assets (RWAs) of 10-15 per cent
• The Board has recommended resuming a dividend given improving financial performance and strong capital startingwith a full year dividend for 2017 of 11 cents per ordinary share. The intent is to increase the dividend per share overtime as the Group’s performance improves
10
Standard Chartered PLC - Group Chief Financial Officer’s review
2017$million
2016$million
Better/(worse)%
Operating income 14,289 13,808 3Other operating expenses (8,599) (8,465) (2)Regulatory costs (1,301) (1,127) (15)UK bank levy (220) (383) 43Operating expenses (10,120) (9,975) (1)
Operating profit before impairment losses and taxation 4,169 3,833 9Impairment losses on loans and advances and other credit risk provisions (1,200) (2,382) 50Other impairment (169) (383) 56Profit from associates and joint ventures 210 25 nmUnderlying profit before taxation 3,010 1,093 175Restructuring (353) (855) nmOther items (242) 171 nmStatutory profit before taxation 2,415 409 nmTaxation (1,147) (600) (91)
Profit/(loss) for the period 1,268 (191) nm
Net interest margin (%) 1.6 1.5Underlying return on equity (%) 3.5 0.3Statutory return on equity (%) 1.7 (1.1)Underlying earnings per share (cents) 47.2 3.4Statutory earnings/(loss) per share (cents) 23.5 (14.5)Dividend per share (cents) 11 –Common Equity Tier 1 (%) 13.6 13.6
Underlying incomeOperating income of $14.3 billion was up 3 per cent year-on-year. Good momentum in Transaction Banking, WealthManagement and Deposits, particularly across Greater China & North Asia, together with higher Treasury incomemore than offset the impact of industry-wide lower volatility in Financial Markets.
• Corporate & Institutional Banking income was flat year-on-year. Excluding losses incurred in 2016 in relation toPrincipal Finance, income was 3 per cent lower as the impact of low volatility in Financial Markets more than offsethigher income from Transaction Banking
• Retail Banking income was 4 per cent higher year-on-year and 7 per cent higher excluding the impact of exiting RetailBanking in Thailand and the Philippines. The Group’s focus on Priority clients resulted in a strong performance inWealth Management and Deposits. This more than offset the impact of lower margins on unsecured lending toPersonal clients
• Commercial Banking income was 3 per cent higher year-on-year with broad based growth in Transaction Banking,Financial Markets and Corporate Finance offsetting lower income from Lending
• Private Banking income was 1 per cent higher year-on-year and 6 per cent higher excluding an insurance recoverybooked in the first quarter of 2016. This followed good growth in income from investment products that now accountfor around 65 per cent of total assets under management
• Income from Central & other items (segment) was 29 per cent higher year-on-year benefiting from a lower interestexpense than in 2016. Gains in the first half from active interest rate management and a third quarter dividend from astrategic investment were largely offset by a hedge accounting adjustment in the fourth quarter
• Income from Greater China & North Asia was up 8 per cent year-on-year following a strong performance in HongKong and further improvement in Korea
• ASEAN & South Asia income was 5 per cent lower year-on-year. Excluding the impact of Retail Banking businessexits, income was 2 per cent lower with improved performances in Retail Banking and Commercial Banking offset bythe impact of low volatility in Financial Markets, particularly in Singapore which is a major Financial Markets hub for theregion
• Income from Africa & Middle East was broadly stable year-on-year and up 3 per cent on a constant currency basis
• Europe & Americas income was 4 per cent lower year-on-year. The region’s status in the Group as a hub for FinancialMarkets activity meant it was particularly impacted by industry-wide lower volatility. The region is a significantcontributor to the Group with around one-third of Corporate & Institutional Banking income originated with clients thatare based there
11
Standard Chartered PLC - Group Chief Financial Officer’s review
Underlying expensesOther operating expenses of $8.6 billion were up 2 per cent year-on-year driven primarily by higher variable pay arisingfrom the Group’s improved business performance.
Regulatory costs of $1.3 billion were 15 per cent higher year-on-year, reflecting the implementation of a number ofsignificant regulatory programmes.
The UK bank levy of $220 million included a $105 million benefit in relation to changes to estimates made in previousyears and as a result was $163 million lower year-on-year. The UK bank levy in 2018 is expected to be around $310million.
The Group had by the end of 2017 delivered over 85 per cent of its $2.9 billion three-year gross cost efficiency targetset in November 2015. This is ahead of plan and has created capacity to fund investments and offset inflation.
Underlying impairmentLoan impairment of $1.2 billion was half the level seen in 2016 benefiting from past actions taken to improve theGroup’s risk profile. The year-on-year improvement was broad-based by client segment and region. Increases in loanimpairment in the fourth quarter related to a small number of Commercial Banking clients the Group had beenmonitoring for some time and a one-off provision in Retail Banking following a change to regulation in Korea.
Other impairment was lower year-on-year following the Group’s decision to exit Principal Finance which in 2017 wasreported within restructuring and is therefore excluded from the Group’s underlying performance.
Profit from associates and joint venturesProfit from associates and joint ventures of $210 million reflected an improved performance of the Group’s jointventure in Indonesia and the continuing good performance of the Group’s associate investment in China.
Profit before taxAs a consequence of the many actions taken since 2015 underlying profit before tax of $3.0 billion was 175 per centhigher year-on-year and 71 per cent higher excluding the impact of Principal Finance losses in 2016. Statutory profitbefore tax of $2.4 billion which is stated after restructuring and other items was $2.0 billion higher.
These actions have resulted in improved operating profit across most client segments including a significant increasein Corporate & Institutional Banking and good growth in Retail Banking, while Commercial Banking returned to profit.By region, improvement across Greater China & North Asia offset the impact of lower income from the Group’sFinancial Markets hubs located in ASEAN & South Asia and Europe & Americas. The prior year performance in Central& other items (region) was impacted by Principal Finance losses.
2017$million
2016$million
Better/(worse)%
2017$million
2016$million
Better/(worse)%
Corporate & Institutional Banking 1,261 435 190 Greater China & North Asia 1,942 1,340 45Retail Banking 873 766 14 ASEAN & South Asia 492 629 (22)Commercial Banking 282 (120) nm Africa & Middle East 642 431 49Private Banking (1) 32 nm Europe & Americas 71 (148) nmCentral & other items 595 (20) nm Central & other items (137) (1,159) nmUnderlying profit before taxation 3,010 1,093 175% Underlying profit before taxation 3,010 1,093 175%
Group credit quality and liquidation portfolio
The credit quality of the Group overall has improved year-on-year with the focus on better quality origination within amore granular risk appetite driving improvement across all client segments. The Group remains watchful for emergingrisks in view of persistent challenging conditions as well as continued geopolitical uncertainty.
The Group’s client exposures are well collateralised, well diversified, and remain predominantly short tenor.
Non-performing loansGross non-performing loans (NPLs) in the ongoing business were $573 million higher year-on-year driven by increasesrelated to the downgrade in the fourth quarter of a small number of Corporate & Institutional Banking clients partlyoffset by write-offs and recoveries in Commercial Banking and lower NPLs in Retail Banking. New inflows into NPLsrelated primarily to a small number of exposures that the Group had been monitoring for some time in the oil and gassupport services sector and in India.
12
Standard Chartered PLC - Group Chief Financial Officer’s review
Credit grade 12 accountsCredit grade 12 accounts were stable year-on-year. Increases in the fourth quarter related to the downgrade of a smallnumber of Commercial Banking exposures in Africa & Middle East to reflect the continued challenging conditionsthere.
Cover ratioThe cover ratio of NPLs in the ongoing portfolio reduced from 69 per cent at 31 December 2016 to 63 per cent at 31December 2017. The cover ratio including collateral increased from 74 per cent to 79 per cent over the same period,reflecting the higher degree of collateral held against new inflows into NPLs.
Liquidation portfolioThe Group has made significant progress exiting exposures in the liquidation portfolio having reduced gross NPLs by$1.6 billion since 31 December 2016. The Group has since November 2015 reduced RWAs associated with thisportfolio from $20 billion to $815 million. The exposures are 86 per cent covered with net NPLs of $653 millionremaining to be exited.
Credit grade 12 accounts1 1,483 22 1,505 1,499 22 1,521Cover ratio (%) 63 71 65 69 64 67Cover ratio after collateral (%) 79 86 81 74 80 76
Risk-weighted assets 278,933 815 279,748 265,637 3,808 269,4451 Includes Corporate & Institutional Banking and Commercial Banking
Restructuring and other items
The Group incurred restructuring charges in 2017 of $353 million relating primarily to the ongoing reduction of theliquidation portfolio and exit of the Principal Finance business as well as redundancy costs. Restructuring chargessince November 2015 total $3.1 billion and are in line with guidance with the exit of the Principal Finance portfolio andthe remaining exposures in the liquidation portfolio left to complete.
In 2017 as part of its annual assessment the Group incurred goodwill impairment of $320 million related to an increasein the discount rate applied to its subsidiary in Taiwan.
In 2017 the Group realised a $78 million net gain on completion of the disposal of equity investments.
2017 2016
Restructuring$million
Other items$million
Restructuring$million
Other items$million
Operating income 58 78 (85) 337Operating expenses (297) – (236) –Impairment losses on loans and advances and other credit risk provisions (162) – (409) –Other impairment (10) (320) (63) (166)Profit/(loss) from associates and joint ventures 58 – (62) –
Profit before taxation (353) (242) (855) 171
13
Standard Chartered PLC - Group Chief Financial Officer’s review
Balance sheet and capital
Balance sheetNet loans and advances to customers were up 12 per cent year-on-year to $285.6 billion with strong and broad-basedgrowth across a range of products including in the fourth quarter. Customer deposits of $411.7 billion were up 9 percent year-on-year as the Group continued to focus on improving the quality and mix of its liabilities. As a result, theGroup’s customer advances to customer deposits ratio increased to 69.4 per cent compared to 67.6 per cent as at 31December 2016.
CET1 ratioThe Group is well capitalised with a CET1 ratio at the end of 2017 of 13.6 per cent. The benefit of profits after adeduction for a dividend was offset by a $10.3 billion increase in RWAs primarily relating to the application of lossgiven default (LGD) floors for certain exposures to financial institutions. A lower increase is expected in 2018 from theapplication of LGD floors for certain exposures to corporates.
IFRS 9The estimated impact of adopting IFRS 9 on 1 January 2018 is an increase in credit provisions of $1.2 billion and, inline with previous guidance, a reduction in the Group’s CET1 ratio by approximately 15 basis points. Under transitionalrules some components of IFRS 9 are phased in over five years resulting in a negligible day-one impact on the CET1ratio. More detail on the impact on loan impairment as well as the classification and measurement of financialinstruments is set out in the notes to the financial statements in the Annual Report. The Group will publish a transitionreport ahead of the first quarter 2018 interim management statement.
Final Basel III reformsIn December 2017 the Basel Committee on Banking Supervision published final details of its Basel III reforms. Firstannounced in 2010 as a response to the global financial crisis these reforms seek to restore credibility in thecalculation of RWAs and improve the comparability of banks’ capital ratios. These reforms that are expected to beimplemented in 2022 include changes to the capital calculation methodology for credit and operational risk andintroduce constraints on the estimates banks make when they use their internal models for regulatory capitalpurposes, and, in some cases, remove the use of internal models. National discretion and how these reforms might betransposed into law make it difficult to reliably estimate the impact but based on the 31 December 2017 balance sheetthe Group’s early assessment is an increase in RWAs of 10-15 per cent.
2017$million
2016$million
Increase /(decrease)
$million
Increase /(decrease)
%
Loans and advances to banks 81,325 74,669 6,656 9Loans and advances to customers 285,553 255,896 29,657 12Other assets 296,623 316,127 (19,504) (6)Total assets 663,501 646,692 16,809 3
Advances to deposits ratio (%) 69.4 67.6 – –Common equity tier 1 ratio (%) 13.6 13.6 – –Risk-weighted assets 279,748 269,445 10,303 4
14
Standard Chartered PLC - Group Chief Financial Officer’s review
Summary
We have made encouraging progress transforming the Group with good momentum in key investment areascontributing to significant improvements in both underlying and statutory profits.
Competition remains strong and certain geopolitical tensions are elevated but economic conditions are improving andemerging regulatory clarity has allowed us to resume paying dividends.
It is encouraging to see the improvement in profitability and the increased balance sheet momentum but there is still along way to go before returns are at acceptable levels. Transitioning to a higher quality income and more sustainablebusiness takes time but we are evidentially heading in the right direction.
We are investing to enhance controls and improve productivity to make us safer and simpler to do business with. Costefficiencies are funding the investments in systems and processes that will enable us to engage more confidently andeffectively with our clients.
The focus now is on ensuring that we share in the natural sectoral growth in our markets through maintaining anddeveloping ever-closer relationships with our clients, further reducing our costs of funds and realising the benefits ofour continuing technology investments.
Andy HalfordGroup Chief Financial Officer
27 February 2018
15
Standard Chartered PLC - Client segment reviews
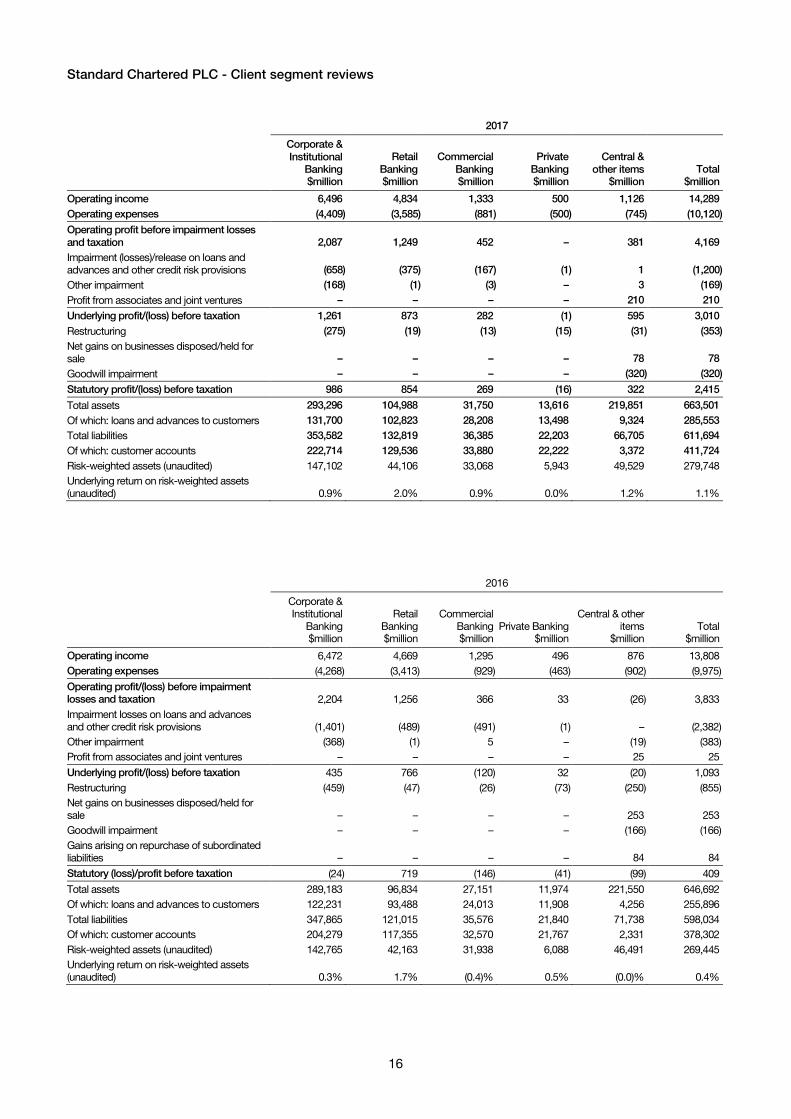
Underlying performance by client segmentThe following tables provide a breakdown of the Group’s underlying operating income by product and performance byclient segment:
CCPL and other unsecured lending – 1,556 – 1 – 1,557Deposits – 1,124 7 156 – 1,287Mortgage and Auto – 703 – 36 – 739Other Retail Products – 75 – – – 75
Treasury3 – – – – 900 900Other3 – – – 22 (24) (2)
Total underlying operating income 6,472 4,669 1,295 496 876 13,8081 The Group has established a Capital Structuring and Distribution Group to sharpen the focus on asset distribution that has resulted in some income being reclassified from Corporate Finance into
Financial Markets. 2016 has been restated2 Certain non-specialised lending exposures which were previously reported under Corporate Finance are now reflected under Lending and Portfolio Management. 2016 has been restated3 Treasury income comprises items previously reported under Asset and Liability Management and Treasury-related aspects of Other income. This reflects the reorganisation of the Group’s balance sheet,
liquidity, and capital management activities such that they are now managed within one Treasury function. 2016 has been restated
Segment overviewCorporate & Institutional Banking supports clients with their transaction banking, corporate finance, financial marketsand borrowing needs across more than 60 markets, providing solutions to over 5,300 clients in some of the world’sfastest-growing economies and most active trade corridors.
Our clients include large corporations, governments, banks and investors headquartered, operating or investing inAsia, Africa and the Middle East. Our strong and deep local presence across these markets enables us to facilitatetrade, capital and investment flows in and for our footprint, including across China’s Belt and Road Initiative.
We collaborate increasingly with other segments: introducing Commercial Banking services to our clients’ ecosystems– their networks of buyers, suppliers, customers and service providers; and with Retail Banking to offer employeebanking services to our clients.
Strategic priorities
• Deliver sustainable growth for clients by understanding their agendas, providing trusted advice, and strengtheningleadership in flow solutions
• Manage our balance sheet to grow income and returns by driving balance sheet velocity, improving funding qualityand maintaining strengthened risk controls
• Improve our efficiency, innovate and digitise to enhance the client experience
Progress
• Completed on-boarding of 91 new OECD clients, and delivered strong growth from the next generation of priorityclients
• Improved balance sheet quality, with investment-grade clients now representing 57 per cent of customer loans andadvances (2016: 52 per cent) and high quality operating account balances now comprising 48 per cent of TransactionBanking customer accounts (2016: 44 per cent)
• Launched focused workstreams to drive efficiency and innovation, and increase talent diversity
Performance highlights
• Underlying profit before taxation of $1,261 million more than doubled year-on-year primarily driven by lowerimpairment. While operating expenses were higher, business efficiency improvements created capacity for increasedinvestments
• Underlying income of $6,496 million was stable year-on-year. However, excluding Principal Finance losses, incomedeclined 3 per cent, impacted by a decline in market volatility and spreads in Financial Markets and margincompression in financing businesses. This more than offset the volume growth and margin improvement in CashManagement
• Good balance sheet momentum with loans and advances to customers up 8 per cent year-on-year and customeraccounts up 9 per cent
• The difference of $275 million between statutory and underlying profit represents restructuring costs
18
Standard Chartered PLC - Client segment reviews
Retail Banking
Segment overview
Retail Banking serves over nine million individuals and small businesses, with a focus on affluent and emerging affluentin many of the world’s fastest-growing cities. We provide digital banking services with a human touch to our clientsacross deposits, payments, financing products and Wealth Management, as well as supporting their business bankingneeds.
Retail Banking represents approximately one-third of the Group’s operating income and operating profit. We areclosely integrated with the Group’s other client segments, for example offering employee banking services toCorporate & Institutional Banking clients, and we are also an important source of high quality liquidity for the Group.
Increasing levels of wealth across Asia, Africa and the Middle East support our opportunity to sustainably grow thebusiness. We aim to improve productivity and client experience through increasing digitisation, driving cost efficienciesand simplifying our processes.
Strategic priorities
• Continue to focus on affluent and emerging affluent clients and their wealth needs in core cities and capture thesignificant rise of the middle class in our markets
• Continue to build on our client ecosystem and alliances initiatives
• Improve our clients’ experience through an enhanced end-to-end digital offering, with intuitive platforms, best-in-classproducts and service responding to the change in digital habits of clients in our markets
Progress
• Increased share of income from Priority clients to 45 per cent, up from 29 per cent in 2014, supported by adding morethan 100,000 Priority clients during 2017
• Our major strategic alliances, with partners such as Asia Miles, Shinsegae and Disney, and our Employee Bankinginitiatives, have together delivered over 50 per cent of new clients in the year
• Investment in technology is showing results, with nearly 45 per cent of clients now actively using online or mobilebanking
Performance highlights
• Underlying profit before taxation of $873 million was up 14 per cent year-on-year as income growth and lower loanimpairment offset increased expenses
• Retail Banking income in Greater China & North Asia grew 10 per cent year-on-year; income in ASEAN & South Asiagrew 4 per cent excluding the impact of business exits in Thailand and the Philippines; and income in Africa & MiddleEast was flat
• Strong momentum from Wealth Management and Deposits drove the improved income performance, more thanoffsetting continued margin compression across asset products
• Good balance sheet momentum, with both loans and advances to customers and customer accounts up 10 per centduring the year
• The difference of $19 million between statutory and underlying profit represents restructuring costs
19
Standard Chartered PLC - Client segment reviews
Commercial Banking
Segment overview
Commercial Banking serves over 40,000 local corporations and medium-sized enterprises in 26 markets across Asia,Africa and the Middle East. We aim to be our clients’ main international bank, providing a full range of internationalfinancial solutions in areas such as trade finance, cash management, financial markets and corporate finance.
Through our close linkages with Retail Banking and Private Banking, our clients can access additional services they valueincluding employee banking services and personal wealth solutions. We also collaborate with Corporate & InstitutionalBanking to service their clients’ end-to-end supply chains.
Our clients represent a large and important portion of the economies we serve and are potential future multinationalcorporates. Commercial Banking is at the heart of our shared purpose to drive commerce and prosperity through ourunique diversity.
Strategic priorities
• Drive quality sustainable growth by deepening relationships with our existing clients and attracting new clients that arealigned with our strategy, with a focus on rapidly growing and internationalising companies in our footprint
• Improve client experience, through investing in frontline training, tools and analytics
• Continue to enhance credit risk management and monitoring and maintain a high bar on operational risk
Progress
• Improved client experience materially, with client satisfaction as measured by our annual ‘client intelligence survey’having improved meaningfully year-on-year
• On-boarded over 4,500 new-to-bank clients in the year, of which 830 came from our clients’ international and domesticnetworks of buyers and suppliers
• Significantly strengthened the foundations in credit risk management through a series of actions which resulted in lowerloan impairments in 2017
Performance highlights
• Returned Commercial Banking to profitability, with an underlying profit before taxation of $282 million reflectingsignificantly lower impairment, reduced expenses and higher income
• Underlying income of $1,333 million was up 3 per cent year-on-year, driven by positive momentum across regions, withincome up 5 per cent in ASEAN & South Asia, up 2 per cent in Africa & Middle East, and up 1 per cent in Greater China &North Asia, led by Cash Management and Financial Markets products
• Strong balance sheet growth, with loans and advances to customers up 17 per cent year-on-year and customeraccounts up 4 per cent
• The difference of $13 million between statutory and underlying profit represents restructuring costs
20
Standard Chartered PLC - Client segment reviews
Private Banking
Segment overview
Private Banking offers a full suite of investment, credit and wealth planning solutions to grow and protect the wealth ofhigh net worth individuals across our footprint.
Our investment advisory capabilities and product platform are independent from research houses and productproviders, allowing us to put client interests at the centre of our business. This is coupled with an extensive networkacross Asia, Africa and the Middle East, which provides clients with relevant market insights and cross-borderinvestment and financing opportunities.
As part of our universal banking proposition, clients can also leverage our global Commercial Banking and Corporate& Institutional Banking capabilities to support their business needs. Private Banking services can be accessed from sixleading centres: Hong Kong, Singapore, London, Jersey, Dubai and India.
Strategic priorities
• Instil a culture of excellence by improving the expertise and enhancing the skills of senior relationship managementteams
• Improve client experience by enhancing our advisory proposition and reducing turnaround time of the investmentprocess
• Balance growth and controls by simplifying the business model through implementation of a rigorous controlsenhancement plan
Progress
• Strengthened relationship management teams with almost 60 new frontline hires globally. Launched Private BankingAcademy in partnership with INSEAD and Fitch to deliver an industry leading frontline training programme across keymarkets
• Enhanced our open architecture platform through digitisation, enabling real-time price discovery across equityderivatives and fixed income, and halving preparation time for investment proposals
• Sharpened our client coverage model with the completion of the country coverage initiative and continuous shift tofocus on the above $5 million assets under management client segment
Performance highlights
• Private Banking generated an underlying loss before taxation of $1 million compared to a profit of $32 million in 2016,due to higher expenses as we continued to invest significantly in the business
• Underlying income of $500 million was up 1 per cent year-on-year, impacted by the non-recurrence of an insurancerecovery. Excluding this, income improved 6 per cent driven by Wealth Management, Treasury and Funds products,and improved Deposit margins
• Assets under management increased by $10.2 billion or 18 per cent since 31 December 2016 driven by positivemarket movements and $2.2 billion of net new money
• The difference of $15 million between statutory and underlying loss represents restructuring costs
Operating profit/(loss) before impairmentlosses and taxation 1,644 1,534 1,012 362 (719) 3,833Impairment losses on loans and advancesand other credit risk provisions (424) (762) (563) (511) (122) (2,382)Other impairment (47) 3 (18) 1 (322) (383)Profit/(loss) from associates and joint ventures 167 (146) – – 4 25Underlying profit/(loss) before taxation 1,340 629 431 (148) (1,159) 1,093Restructuring (137) (443) (82) (113) (80) (855)Net gains on businesses disposed/held for sale 253 – – – – 253Goodwill impairment – – – – (166) (166)Gains arising on repurchase of subordinatedliabilities – – – – 84 84Statutory profit/(loss) before taxation 1,456 186 349 (261) (1,321) 409Net interest margins 1.3% 2.0% 3.2% 0.5% 0.0% 1.5%Total assets 239,740 143,704 56,980 195,937 10,331 646,692Of which: loans and advances to customers 110,533 73,161 28,140 44,062 – 255,896Total liabilities 210,795 126,701 38,020 181,639 40,879 598,034Of which: customer accounts 169,957 88,141 29,931 90,273 – 378,302Risk-weighted assets (unaudited) 76,665 96,673 52,849 43,487 (229) 269,445
22
Standard Chartered PLC - Regional reviews
Greater China & North Asia
Region overview
Greater China & North Asia is the Group’s largest region, representing approximately 40 per cent of the Group’sincome, and includes our clients in Hong Kong, Korea, China, Taiwan, Japan and Macau. Of these, Hong Kongremains the Group’s largest market, underpinned by a diversified franchise and deeply rooted presence.
The region is highly interconnected, with China’s economy at its core. Our regional footprint, distinctive propositionand continued investment positions us strongly to capture opportunities as they arise from the continuing opening upof China’s economy.
We are building on the region’s ongoing economic growth, the rising wealth of its population, the increasingsophistication and internationalisation of Chinese businesses and the resulting increased usage of the renminbiinternationally.
Strategic priorities
• Leverage our network strength to serve the inbound and outbound cross-border trade and investment needs of ourclients
• Capture opportunities arising from China’s opening, including renminbi, Belt and Road Initiative, onshore capitalmarkets and mainland wealth, as well as in digital capabilities
• Strengthen market position in Hong Kong, and improve Retail Banking performance in China and Korea
Progress
• Added overseas China desks across the Group’s footprint, helping to grow income and increase the number of Beltand Road Initiative projects we were involved in by over 25 per cent
• Strong progress in Retail Banking in Hong Kong, adding more than 43,300 new-to-bank Priority clients throughalliances such as Asia Miles and our enhanced digital on-boarding platform
• Both Retail Banking in China and Korea have seen a significant improvement in performance, driven by costefficiencies and focused client acquisition
Performance highlights
• Underlying profit before taxation of $1,942 million was 45 per cent higher year-on-year reflecting income growth andlower impairment
• Underlying income of $5,616 million was 8 per cent higher year-on-year, with all markets and client segmentscontributing. Both Retail Banking and Private Banking income grew 10 per cent year-on-year driven by WealthManagement, improving margins and strong balance sheet growth. Corporate & Institutional Banking income rose 9per cent year-on-year, due to Cash Management, Corporate Finance and Capital Markets. Commercial Bankingincome grew 1 per cent year-on-year, driven by Cash Management and Corporate Finance
• Strong balance sheet momentum with loans and advances to customers up 15 per cent year-on-year and customeraccounts up 10 per cent
• The difference of $35 million between statutory and underlying profit represents restructuring costs
23
Standard Chartered PLC - Regional reviews
ASEAN & South Asia
Region overview
The Group has a long-standing and deep franchise across the ASEAN & South Asia region. We are the onlyinternational bank with a presence in all 10 ASEAN countries and we also have meaningful operations in all key SouthAsian markets. Our two largest markets in the region by income are Singapore and India, where we have had adeep-rooted presence for over 150 years.
The region contributes over a quarter of the Group’s income. Within the region, Singapore is home to the majority ofour global business leadership and our technology organisation as well as SC Ventures, our innovation hub.
The strong underlying economic growth in the ASEAN & South Asia region supports our opportunity to grow andsustainably improve returns. The region is benefiting from rising trade flows including from the Belt and Road Initiative,continued strong investment and a rising middle class which is driving consumption growth and improving digitalconnectivity.
Strategic priorities
• Optimise geographic portfolio by selectively reshaping sub-scale unprofitable markets and prioritising larger or moreprofitable markets
• Shift the income mix towards ‘asset-light’ businesses such as network and flow opportunities in Corporate &Institutional Banking and Commercial Banking; and towards Wealth and Priority clients in Retail Banking
• Deploy differentiating digital capabilities in key markets to improve client experience and productivity
Progress
• Exited Retail Banking in the Philippines and Thailand in 2017, and our stake in Asia Commercial Bank in early 2018.The investments in Singapore, India and Vietnam are showing early positive impact
• The business ‘mix shift’ is starting: 6 per cent year-on-year cash liabilities growth, global subsidiaries up 13 per cent,new Priority clients grew 18 per cent, wealth assets under management up 25 per cent
• Encouraging early signs of digital adoption in key markets, with a faster pace of improving digital sales penetration
Performance highlights
• Underlying profit before taxation of $492 million declined 22 per cent year-on-year due to negative operating leverageimpacted by low volatility in Financial Markets and higher costs as we invested for future growth
• Underlying income of $3,833 million fell 5 per cent year-on-year driven by the decisions to exit Retail Banking inThailand and the Philippines, and from the impact of low volatility on Financial Markets. Retail Banking income,excluding the impact of exits, rose 4 per cent year-on-year, and Commercial Banking income was up 5 per centyear-on-year
• Client activity was positive with 13 per cent growth in loans and advances to customers and 8 per cent growth incustomer accounts since December 2016
• The difference of $142 million between statutory and underlying profit represents restructuring costs of $161 million,which are offset by gains on sale of business of $19 million
24
Standard Chartered PLC - Regional reviews
Africa & Middle East
Region overview
We have a deep-rooted heritage of over 150 years in Africa & Middle East and are present in 25 markets, of which theUAE, Nigeria, Pakistan and Kenya are the largest by income. Among international banks we have the broadestpresence across sub-Saharan Africa by number of markets.
A rich history, deep client relationships and a unique footprint in the region and across key origination centres in Asia,Europe and the Americas enable us to seamlessly support our clients. Africa & Middle East is an important part ofglobal trade and investment corridors, including those on the Belt and Road Initiative and we are well placed tofacilitate these flows. Demand for capital remains robust, with favourable demographics, urbanisation andinfrastructure investment.
While the economic challenges in Africa & Middle East were severe in 2015 and 2016, our business stabilised in 2017and we remain confident that the opportunities in the region will support long-term sustainable growth for the Group.We continue to invest selectively and drive efficiencies.
Strategic priorities
• De-risk and improve the quality of income and maintain a stable platform for sustainable growth
• Build income momentum in Corporate & Institutional Banking by providing best-in-class structuring and financingsolutions and driving origination through client initiatives
• Continue investing in market-leading digitisation initiatives in Retail Banking to protect and grow market share in coremarkets
Progress
• The UAE, a key market, has turned around and Commercial Banking in the region has stabilised
• Reinforced our strong market presence through a number of marquee deals from sovereigns, financial institutions andcorporate clients
• On track to deliver digital solutions across key countries in Africa during 2018
Performance highlights
• Underlying profit before taxation of $642 million rose 49 per cent year-on-year, driven by a reduction in loanimpairment
• Despite economic challenges in the region, underlying income of $2,764 million was up 1 per cent year-on-year drivenby Africa up 4 per cent while Middle East, North Africa and Pakistan were down 2 per cent. Strong TransactionBanking and Wealth Management performance was offset by the impact of lower volatility in Financial Markets andlower margins in Retail Products
• Loans and advances to customers were up 5 per cent year-on-year and customer accounts grew 6 per cent
• The difference of $33 million between statutory and underlying profit represents restructuring costs
25
Standard Chartered PLC - Regional reviews
Europe & Americas
Region overview
The Group supports clients in Europe & Americas through hubs in London and New York as well as a presence inseveral European and Latin American markets. We offer our clients rich network and product capabilities through ourknowledge of working in and between Asia, Africa and the Middle East. We also have a Private Banking business,focused on serving clients with linkages to our Asia, Africa and Middle East footprint markets.
The region is a major income origination engine for the Group’s Corporate & Institutional Banking business. Clientsbased in Europe & Americas generate over one-third of Corporate & Institutional Banking income, with two-thirds ofthat income booked in the Group’s other regions where the service is provided.
The region is home to the Group’s two biggest payment clearing centres and the largest trading room. Over 80 percent of the region’s income derives from Financial Markets and Transaction Banking products. Given this mix, thebusiness we do across the Group with clients based in Europe & Americas generates above average returns.
Strategic priorities
• Continue to attract new international corporate and financial institutions clients and deepen relationships with existingclients by banking them across more markets in our network
• Enhance capital efficiency, maintain strong risk oversight and further improve the quality of our funding base
• Grow our Private Banking franchise and assets under management in London and Jersey
Progress
• Good progress made in attracting new clients and broadening relationships with existing clients; 79 new multinationalcorporate clients on-boarded in the region in 2017
• Underlying returns from Corporate & Institutional Banking clients continue to improve along with the improved riskprofile
• Assets under management for Private Banking clients grew by 17 per cent in 2017
Performance highlights
• The region returned to profitability with an underlying profit for the year of $71 million, supported by a substantialreduction in loan impairment following earlier management actions. Expense growth reflects the continued investmentin people and globally driven investments in systems and product capabilities
• Underlying income of $1,601 million was 4 per cent lower year-on-year impacted by a decline in market volatility inFinancial Markets which was only partly offset by an improvement in Cash Management income. Income generatedby our clients that is booked in other markets grew by 17 per cent in 2017
• Loans and advances to customers were up 6 per cent year-on-year and customer accounts grew 9 per cent
• The difference of $25 million between statutory and underlying profit represents restructuring costs
26
Standard Chartered - Group Chief Risk Officer’s review
A refreshed approach to managing risk
2017 was a year of continued progress for the management of risk in the Group. With stronger origination discipline andtargeted growth, the Group has seen improved asset quality across our businesses. Loan impairment was lower, anddiversification across industry sectors and geographies increased as the Group continued to add new clientsselectively. Our focus on embedding a sustainable risk culture and an effective enterprise risk management approach ishelping to build a more resilient bank for the benefit of our colleagues, clients and investors.
We have made significant progress in our work to combat financial crime and have increased focus on our cyber riskmanagement capabilities. We recognise that these are continually evolving threats and we cannot stand still in our fightto protect our business and society more generally. In addition we have developed a framework to refine andstrengthen our conduct environment, and this will be a key priority in 2018. Risk is a shared responsibility of everyone inthe Group, and is an intrinsic part of every decision that we make.
An update on our key risk priorities
Risk management is a dynamic process. Market-wide and company-specific factors constantly reshape our businessenvironment. We have a number of ongoing initiatives that will further enhance the risk management framework andcapability of the Group. Here is an update of the progress against our key priorities in 2017.
• Strengthen the Group’s risk culture – We have made good progress on embedding a strong risk culture and increasedfocus on frontline ownership of risk, alongside further development of our Enterprise Risk Management Framework.This facilitates more dynamic risk identification and enables us to establish a clear linkage between strategicdecision-making and risk management, as well as identifying and managing correlations across risk types
• Manage and improve information and cyber security – High profile security breaches have been a recurring focus inthe media headlines and among regulators throughout 2017. We are placing even greater emphasis on improving ourdefences, creating stronger control frameworks, and expanding intelligence sharing efforts to keep pace with theevolving threats in cyberspace. The Group’s deepening network of external partnerships strengthen our ownintelligence efforts as well as those across the broader financial services sector. The Group is a founding member of theCyber Defence Alliance, an external organisation which facilitates information sharing with UK banks and lawenforcement; a board member of the Financial Services – Information Sharing & Analysis Center; and a member of theNational Cyber-Forensics & Training Alliance, for real-time information sharing and analysis. The Group also operates aCollective Intelligence & Command Centre to coordinate physical and cyber security responses to incidents
• Enhance the compliance management framework - We have enhanced our compliance systems and controls, andimproved the capability of our compliance resources. We have embedded ownership and responsibility for conductacross our geographic footprint, businesses and functions in a systematic and sustainable manner. We havestrengthened our efforts to promote awareness of, and confidence in the Speaking Up Programme including extendingour Speaking Up channels to the public. Further details on the Group’s Speaking Up Programme can be found in theAnnual Report
• Manage financial crime risks – We are committed to playing our part in the fight against financial crime. We continuedto enhance our controls, systems and processes in 2017 as well as continuing to educate and engage all of our peopleon financial crime risk and the human and social harm of such crimes. The financial crime landscape continues toevolve, and we recognise the need to be vigilant against new and transforming threats as well as adapting to changes inrelevant regulation and sanctions regimes. In 2017 we built a dedicated Cyber Financial Intelligence team in the US, andcontinued our Correspondent Banking Academy initiative across all of the regions in which we operate. Thisprogramme seeks to support our clients in enhancing their financial crime controls, and share international bestpractices and learning materials. In October 2017 we also held our first Financial Crime Risk Management Academy fornon-government organisations as part of our ‘De-risking through education’ initiative. Our collaborative approachenables us to continue providing services which are vital to the world economy in a safe and sound way. Moreinformation about the Group’s commitment to fighting financial crime can be found at sc.com/fightingfinancialcrime
• Improve the risk and compliance infrastructure – The Group has multiple initiatives underway to improve infrastructurefor compliance risk management, exposure management, data quality, stress testing, operational risk management andreporting. We have also worked to streamline and simplify our processes to serve clients better and drive internalefficiencies
27
Standard Chartered - Group Chief Risk Officer’s review
Our risk profile and performance in 2017
The quality of our loan book has improved in 2017, with a focus on better quality new origination driving a strongerportfolio across all business segments, although we remain watchful for any emerging risks. This is aligned to a moregranular risk appetite and enterprise-wide risk management approach. Our capital and liquidity positions remain strong,with all metrics above regulatory thresholds. The Group’s client exposures remain predominantly short tenor and ourportfolio is well diversified across various dimensions.
We have seen a significant decrease in loan impairment across all businesses, with overall loan impairment down 51per cent to $1.4 billion in the last 12 months.
Overall gross non-performing loans (NPLs) for the Group have reduced as increases in the ongoing book were morethan offset by planned reductions in the liquidation portfolio. Gross non-performing loans (NPLs) for the ongoingbusiness increased from $5.9 billion to $6.5 billion in 2017, driven by a small number of exposures in Corporate &Institutional Banking from oil and gas support services and India. The majority of these counterparties were on earlyalert for an extended period prior to transferring to NPL and do not indicate any new areas of stress for the overallportfolio.
We continue to focus on early identification of emerging risks so that we can manage any areas of weakness on aproactive basis.
The cover ratio of NPLs in the ongoing business reduced from 69 per cent to 63 per cent, and including collateralimproved to 79 per cent from 74 per cent.
Global financial markets experienced low volatility and average Group VaR was 19 per cent lower than the previousyear at $26 million (2016: $32 million). The largest operational risk loss recognised as at 31 December 2017 relates tothe Group’s $17.2 million settlement of a United States class action brought against a number of banks concerningforeign exchange benchmark rates.
Further details of the 2017 risk performance can be found in the Annual Report.
An update to our risk management approach
It is critical that our risk management approach continues to evolve and develop to meet the ever-changing risklandscape facing our business, to ensure it remains relevant and effective in generating safe and sustainableperformance and growth for the Group. In 2017 we embarked on a key initiative to build out the Enterprise RiskManagement function. This allows the Group to identify and manage risks holistically, ensuring the appropriategovernance, oversight and information is in place to run a safe, secure and well-controlled organisation.
It also strengthens the Group’s capabilities to understand, articulate and control the nature and level of risks we takewhile still effectively serving our clients.
As part of this initiative, a revised Enterprise Risk Management Framework was approved in December 2017, forimplementation in 2018. We are continuing to develop a well-defined, healthy risk culture that is understood across theGroup, as well as a clear control framework with sharper delineation of responsibilities between the three lines ofdefence. Further details on the Group’s three lines of defence model are set out in the Annual Report. We are alsoformalising the links between our strategy, risk appetite and stress testing to facilitate more dynamic risk identificationand develop management processes which clearly integrate risk considerations into strategic decision making.
As part of these changes we have made a number of amendments to our Principal Risk Types. Specifically we haveelevated Compliance, Information and Cyber security, Financial crime, and Conduct risk to Principal Risk Types. Thesewere previously incorporated within the risk sub-types under Operational risk. Principal Risk Types are risks that areinherent in our strategy and business model and have been formally defined in the Group’s Enterprise RiskManagement Framework. The framework provides a structure for the monitoring and control of these risks through theBoard-approved Risk Appetite. The Group will not compromise adherence to its Risk Appetite in order to pursuerevenue growth or higher returns. The table below shows the Group’s Principal Risk Types and how they are managed.
Further details on Principal Risks can be found in the Annual Report.
28
Standard Chartered - Group Chief Risk Officer’s review
Principal Risk Types How these are managed
Credit risk The Group manages its credit exposures following the principle of diversification acrossproducts, geographies, client segments and industry sectors
Country risk The Group manages its country cross-border exposures following the principle ofdiversification across geographies and controls business activities in line with the level ofjurisdiction risk
Market risk The Group controls its trading portfolio and activities to ensure that market risk losses(financial or reputational) do not cause material damage to the Group’s franchise
Capital and liquidityrisk
The Group maintains a strong capital position including the maintenance of managementbuffers sufficient to support its strategic aims and holds an adequate buffer of high qualityliquid assets to survive extreme but plausible liquidity stress scenarios for at least 60 dayswithout recourse to extraordinary central bank support
Operational risk The Group controls operational risks to ensure that operational losses (financial orreputational), including any related to conduct of business matters, do not cause materialdamage to the Group's franchise
Reputational risk The Group protects the franchise from material damage to its reputation by ensuring that anybusiness activity is satisfactorily assessed and managed by the appropriate level ofmanagement and governance oversight
Compliance The Group has no appetite for breaches in laws and regulations, recognising that whilstregulatory breaches or non-compliance are unwanted, they cannot be entirely avoided
Conduct The Group strives to maintain the standards in our Code of Conduct and outcomes of ourConduct Framework, by continuously demonstrating that we “Do The Right Thing” in the waywe do business
Information andcyber security
The Group seeks to avoid risk and uncertainty for our critical information assets and systemsand has a low appetite for material incidents affecting these or the wider operations andreputation of the bank
Financial crime The Group has no appetite for breaches in laws and regulations related to Financial crime,recognising that whilst incidents are unwanted, they cannot be entirely avoided
1 Pension risk is now a risk sub-type of Market risk and Strategic risk has been integrated as part of the overall Enterprise Risk Management Framework. Further details of updates to ourPrincipal Risk Types are discussed in the Principal Risks section
29
Standard Chartered - Group Chief Risk Officer’s review
Principal uncertainties
The revised Enterprise Risk Management Framework will provide a consolidated way of managing risk, and result inmore proactive conversations about strategic risk. We have continued to roll out a more granular and well-defined riskappetite which enables our business to grow in a strong and sustainable manner, but we are aware of principaluncertainties on the horizon that are not fully clear and measurable.
Here is a summary of the principal uncertainties that the Group faces, and the steps that we are taking to managethem.
Principal uncertainties1 Risktrendsince2016
How these are mitigated/next steps
Geopolitical events, in particular:increase in trade protectionism,Korean peninsula geopoliticaltensions, the Middle Eastpolitical situation andpost-Brexit implications
We continuously monitor and assess geopolitical events and, whereappropriate, manage the impact to the Group and our clients.We conduct stress tests and portfolio reviews at a Group, country andbusiness level to assess the impact of extreme but plausible geopoliticalevents.
Macroeconomic conditions, inparticular: moderation of growthin key footprint markets led byChina and sharp interest raterises and asset corrections
We have a Business Risk Horizon framework that provides a 12-to-18month forward view of the economic, business and credit conditionsacross our key markets, enabling us to take proactive action.We monitor economic trends and conduct stress tests and portfolioreviews at a Group, country and business level to assess the impact ofextreme but plausible events.
NEW We are developing an approach for assessing energy utilities clients’power generation assets against a range of physical and transition risks,under multiple climate scenarios and a range of time horizons. We areconsidering how we extend this to other sectors in 2018.We have made a public commitment to fund and facilitate $4 billiontoward clean technology between 2016 and 2020.
We have invested in improving compliance controls, including increasingthe capacity and capability of compliance resources, enhancing systemsand controls, and implementing remediation programmes (whererelevant).We are cooperating with all relevant ongoing reviews, requests forinformation and investigations and we actively manage legal proceedings,including in respect oflegacy issues.
Regulatory changes and taxreforms
We monitor regulatory initiatives across our footprint to identify anypotential impact and change to our business model.We have established specific regulatory programmes to ensure effectiveand efficient implementation of changes required by new, or changes inexisting, regulations.
New technologies anddigitisation
NEW We continuously monitor developments in the technology space affectingthe banking sector and the Group Management Team is exploring inmore depth our approach to innovation.We are engaged in a series of initiatives with the aim of building ourcapabilities to ensure we remain relevant in a position to capitalise rapidlyon technology trends.
Risk heightened in 2017 Risk remained consistent with 2016 levels1 Principal uncertainties refer to unpredictable and uncontrollable outcomes from certain events and circumstances which may have the potential to impact our business materially.2 Physical risks refer to the risk of increased extreme weather events while transition risks refer to the risk of changes to market dynamics due to governments’ response to climate change
Cyber risk now forms part of our Principal Risk Types which we control and mitigate through distinct risk typeframeworks, policies and risk appetite. Further details on Principal uncertainties, including key changes in respect of2016, can be found in the Annual Report.
30
Standard Chartered - Group Chief Risk Officer’s review
Conclusion
We continue to make strides in building a sustainable franchise in the interests of all our stakeholders. In order to drivecommerce and prosperity, our organisation must take a long-term view by putting the needs of our clients first,supported by the right culture, people and practices. Though there will be headwinds along the way, we will continuewith our mission to be an industry leader championing trust, integrity and quality.
Mark SmithGroup Chief Risk Officer
27 February 2018
31
Standard Chartered PLC – Supplementary information
Five year summary
2017$million
2016$million
2015$million
2014$million
2013$million
Operating profit before impairment losses and taxation 4,008 3,849 4,116 7,289 8,584Impairment losses on loans and advances and other creditrisk provisions (1,362) (2,791) (4,976) (2,141) (1,617)Other impairment (179) (612) (855) (1,161) (1,129)Profit/(loss) before taxation 2,415 409 (1,523) 4,235 6,064Profit/(loss) attributable to shareholders 1,219 (247) (2,194) 2,613 4,090Loans and advances to banks1 57,494 72,609 64,494 83,890 83,702Loans and advances to customers1 248,707 252,719 257,356 284,695 290,708Total assets 663,501 646,692 640,483 725,914 674,380Deposits by banks1 30,945 36,894 37,611 54,391 43,517Customer accounts1 370,509 371,855 350,633 405,353 381,066Shareholders’ equity 46,505 44,368 46,204 46,432 46,246Total capital resources2 68,983 68,181 70,364 69,685 67,238Information per ordinary shareBasic earnings/(loss) per share 23.5c (14.5)c (91.9)c 97.3c 156.5cUnderlying earnings/(loss) per share 47.2c 3.4c (6.6)c 138.9c 194.2Dividends per share 11.0c5 – 13.7c 81.9c 81.9cNet asset value per share 1,366.9c 1,307.8c 1,366.0c 1,833.9c 1,872.8cNet tangible asset value per share 1,214.7c 1,163.9c 1,244.1c 1,610.9c 1,597.6cReturn on assets3 0.2% 0.0% (0.3)% 0.4% 0.6%RatiosStatutory return on ordinary shareholders’ equity 1.7% (1.1)% (5.3)% 5.5% 9.0%Underlying return on ordinary shareholders’ equity 3.5% 0.3% (0.4)% 7.8% 11.2%Statutory cost to income ratio 72.2% 72.6% 73.1% 60.2% 54.3%Underlying cost to income ratio 70.8% 72.2% 67.8% 58.9% 54.4%Capital ratios:(CET1)/ Tier 1 capital4 13.6% 13.6% 12.6% 10.5% 10.9%Total capital4 21.0% 21.3% 19.5% 16.7% 17.0%
1 Excludes amounts held at fair value through profit or loss2 Shareholders’ funds, non-controlling interests and subordinated loan capital3 Represents profit attributable to shareholders divided by the total assets of the Group4 Unaudited5 Represents the recommended full year dividend per share for 2017
32
Standard Chartered PLC – Supplementary information
Analysis of underlying performance by key country
The following tables provide information for key countries in which the Group operates. The numbers are prepared ona management view. Refer to the notes to the financial statements in the Annual Report for details.
Standard Chartered PLC – Supplementary information
Average balance sheets and yields and volume and price variances
Average balance sheets and yieldThe following tables set out the average balances and yields for the Group’s assets and liabilities for the years ended31 December 2017 and 31 December 2016. For the purpose of these tables, average balances have been determinedon the basis of daily balances, except for certain categories, for which balances have been determined less frequently.The Group does not believe that the information presented in these tables would be significantly different had suchbalances been determined on a daily basis.
2017
Averagenon-interest
earning balance$million
Averageinterest
earning balance$million
Interest income$million
Gross yield%
AssetsCash and balances at central banks 37,194 37,539 287 0.8Gross loans and advances to banks 5,483 82,743 1,955 2.4Gross loans and advances to customers – 282,912 8,928 3.2Impairment provisions against loans and advances to banks and customers – (6,342) – –Investment securities 2,450 130,839 3,265 2.5Property, plant and equipment and intangible assets 9,916 – – –Prepayments, accrued income and other assets 85,978 – – –
Total average assets 141,021 527,691 14,435 2.7
2016
Averagenon-interest
earning balance$million
Averageinterest
earning balance$million
Interest income$million
Gross yield%
AssetsCash and balances at central banks 26,395 44,360 213 0.5Gross loans and advances to banks 4,077 77,298 1,282 1.7Gross loans and advances to customers – 267,068 8,749 3.3Impairment provisions against loans and advances to banks and customers – (6,458) – –Investment securities 2,599 126,388 2,766 2.2Property, plant and equipment and intangible assets 9,502 – – –Prepayments, accrued income and other assets 93,401 – – –
Total average assets 135,974 508,656 13,010 2.6
34
Standard Chartered PLC – Supplementary information
2017
Averagenon-interest
bearing balance$million
Averageinterest
bearing balance$million
Interest expense$million
Rate paid%
LiabilitiesDeposits by banks 6,696 41,565 891 2.1Customer accounts:Current accounts and savings deposits 36,070 165,300 1,063 0.6Time and other deposits 8,096 199,426 2,796 1.4Debt securities in issue 581 51,914 756 1.5Accruals, deferred income and other liabilities 84,881 22 – –Subordinated liabilities and other borrowed funds 841 17,205 748 4.3Non-controlling interests 73 – – –Shareholders’ funds 49,903 – – –
Total average liabilities and shareholders’ funds 187,141 475,432 6,254 1.3
Net yield 1.4
Net interest margin 1.6
2016
Averagenon-interest
bearing balance$million
Averageinterest
bearing balance$million
Interest expense$million
Rate paid%
LiabilitiesDeposits by banks 6,691 42,169 494 1.2Customer accounts:Current accounts and savings deposits 43,432 146,480 852 0.6Time and other deposits 4,859 180,001 2,335 1.3Debt securities in issue 449 61,636 700 1.1Accruals, deferred income and other liabilities 90,792 11 – –Subordinated liabilities and other borrowed funds 1,426 20,229 835 4.1Non-controlling interests 105 – – –Shareholders’ funds 48,271 – – –
Total average liabilities and shareholders’ funds 196,025 450,526 5,216 1.2
Net yield 1.4
Net interest margin 1.5
35
Standard Chartered PLC --- Supplementary information
Volume and price variances
The following table analyses the estimated change in the Group’s net interest income attributable to changes in theaverage volume of interest-earning assets and interest-bearing liabilities, and changes in their respective interest ratesfor the years presented. Volume and rate variances have been determined based on movements in average balancesand average exchange rates over the year and changes in interest rates on average interest-earning assets andaverage interest-bearing liabilities.
2017 versus 2016
(Decrease)/increasein interest due to: Net (decrease)/
increase ininterest$million
Volume$million
Rate$million
Interest earning assetsCash and unrestricted balances at central banks (52) 126 74Loans and advances to banks 129 544 673Loans and advances to customers 485 (306) 179Investment securities 112 387 499
Total interest earning assets 674 751 1,425
Interest bearing liabilitiesSubordinated liabilities and other borrowed funds (131) 44 (87)Deposits by banks (13) 410 397Customer accounts:Current accounts and savings deposits 121 90 211Time and other deposits 272 189 461Debt securities in issue (142) 198 56
Total interest bearing liabilities 107 931 1,038
2016 versus 2015
(Decrease)/increasein interest due to: Net (decrease)/
increasein interest
$millionVolume$million
Rate$million
Interest earning assetsCash and unrestricted balances at central banks (89) 64 (25)Loans and advances to banks (36) 298 262Loans and advances to customers (741) (883) (1,624)Investment securities (6) (210) (216)
Total interest earning assets (872) (731) (1,603)Interest bearing liabilitiesSubordinated liabilities and other borrowed funds (69) 339 270Deposits by banks (113) 211 98Customer accounts:Current accounts and savings deposits (82) (37) (119)Time and other deposits (28) (138) (166)Debt securities in issue (183) 110 (73)
Total interest bearing liabilities (475) 485 10
36
Standard Chartered PLC --- Shareholder information
Dividend and interest payment dates
Ordinary shares
Final
dividend
Results and dividend announced 27 February 2018Ex dividend date 8 March (UK) 7 March (HK) 2018Record date for dividend 9 March 2018Last date to elect for share dividend or to change standing instructions 19 April 2018Dividend payment date 17 May 2018
7 per cent Non-cumulative irredeemable preference shares of £1 each 1 April 2018 1 October 20188 per cent Non-cumulative irredeemable preference shares of £1 each 1 April 2018 1 October 20186.409 per cent Non-cumulative redeemable preference shares of $5 each 30 January 2018 30 July 20187.014 per cent Non-cumulative redeemable preference shares of $5 each 30 January 2018 30 July 2018
Annual General Meeting
The Annual General Meeting (AGM) details are as follows:
Date and time LocationWednesday 9 May 2018 etc. venues11.00am London time 200 Aldersgate(6.00pm Hong Kong time) St Paul’s
London EC1A 4HD
Details of the business to be transacted at the AGM are included in the Notice of AGM.
Interim results
The interim results will be announced to the London Stock Exchange, The Stock Exchange of Hong Kong Limited,BSE Limited (Bombay Stock Exchange) and the National Stock Exchange of India Limited and put on the Company’swebsite.
Country-by-country reporting
In accordance with the requirements of the Capital Requirements (country-by-country reporting) Regulations 2013, theGroup will publish additional country-by-country information in respect of the year ended 31 December 2017, on orbefore 31 December 2018. We have also published our approach to tax and tax policy.
ShareCare
ShareCare is available to shareholders on the Company’s UK register who have a UK address and bank account, andallows you to hold your Standard Chartered PLC shares in a nominee account. Your shares will be held in electronicform so you will no longer have to worry about keeping your share certificates safe. If you join ShareCare you will stillbe invited to attend the Company’s AGM and receive any dividend at the same time as everyone else. ShareCare isfree to join and there are no annual fees to pay.
37
Standard Chartered PLC --- Shareholder information
Previous dividend payments (unadjusted for the impact of the 2015/2010/2008 Rights Issues)
Dividend and financial year Payment date Dividend per ordinary shareCost of one new ordinary shareunder share dividend scheme
Interim 2006 11 October 2006 20.83c/11.14409p/HK$1.622699 £13.2360/$25.03589Final 2006 11 May 2007 50.21c/25.17397p/HK$3.926106 £14.2140/$27.42591Interim 2007 10 October 2007 23.12c/11.39043p/HK$1.794713 £15.2560/$30.17637Final 2007 16 May 2008 56.23c/28.33485p/HK$4.380092 £16.2420/$32.78447Interim 2008 9 October 2008 25.67c/13.96133p/HK$1.995046 £14.00/$26.0148Final 2008 15 May 2009 42.32c/28.4693p/HK$3.279597 £8.342/$11.7405Interim 2009 8 October 2009 21.23c/13.25177p/HK$1.645304 £13.876/$22.799Final 2009 13 May 2010 44.80c/29.54233p/HK$3.478306 £17.351/$26.252Interim 2010 5 October 2010 23.35c/14.71618p/HK$1.811274/INR0.9841241 £17.394/$27.190Final 2010 11 May 2011 46.65c/28.272513p/HK$3.623404/INR1.99751701 £15.994/$25.649Interim 2011 7 October 2011 24.75c/15.81958125p/HK$1.928909813/INR1.137971251 £14.127/$23.140Final 2011 15 May 2012 51.25c/31.63032125p/HK$3.9776083375/INR2.66670151 £15.723/$24.634Interim 2012 11 October 2012 27.23c/16.799630190p/HK$2.111362463/INR1.3498039501 £13.417/$21.041Final 2012 14 May 2013 56.77c/36.5649893p/HK$4.4048756997/INR2.9762835751 £17.40/$26.28792Interim 2013 17 October 2013 28.80c/17.8880256p/HK$2.233204992/INR1.68131 £15.362/$24.07379Final 2013 14 May 2014 57.20c/33.9211444p/HK$4.43464736/INR3.3546261 £11.949$19.815Interim 2014 20 October 2014 28.80c/17.891107200p/HK$2.2340016000/INR1.6718425601 £12.151/$20.207Final 2014 14 May 2015 57.20c/37.16485p/HK$4.43329/INR3.5140591 £9.797/$14.374Interim 2015 19 October 2015 14.40c/9.3979152p/HK$1.115985456/INR0.861393721 £8.5226/$13.34383Final 2015 No dividend declared N/A N/AInterim 2016 No dividend declared N/A N/AFinal 2016 No dividend declared N/A N/AInterim 2017 No dividend declared N/A N/A
1. The INR dividend is per Indian Depository Receipt
Donating shares to ShareGift
Shareholders who have a small number of shares often find it uneconomical to sell them. An alternative is to considerdonating them to the charity ShareGift (registered charity 1052686), which collects donations of unwanted shares untilthere are enough to sell, and uses the proceeds to support UK charities. There is no implication for Capital Gains Tax(no gain or loss) when you donate shares to charity, and UK taxpayers may be able to claim income tax relief on thevalue of their donation.
Bankers’ Automated Clearing System (BACS)
Dividends can be paid straight into your bank or building society account.
Registrars and shareholder enquiries
If you have any enquiries relating to your shareholding and you hold your shares on the UK register, please contact ourregistrar Computershare Investor Services PLC, The Pavilions, Bridgwater Road, Bristol, BS99 6ZZ or call theshareholder helpline number on 0370 702 0138.
If you hold your shares on the Hong Kong branch register and you have enquiries, please contact ComputershareHong Kong Investor Services Limited, 17M Floor, Hopewell Centre, 183 Queen’s Road East, Wan Chai, Hong Kong.
If you hold Indian Depository Receipts and you have enquiries, please contact Karvy Computershare Private Limited,Karvy Selenium Tower B, Plot 31-32, Gachibowli, Financial District, Nanakramguda, Hyderabad 500032, India.
Chinese translation
If you would like a Chinese version of the 2017 Annual Report and Accounts please contact Computershare HongKong Investor Services Limited, 17M Floor, Hopewell Centre, 183 Queen’s Road East, Wan Chai, Hong Kong.
Shareholders on the Hong Kong branch register who have asked to receive corporate communications in eitherChinese or English can change this election by contacting Computershare.
If there is a dispute between any translation and the English version of this Annual Report and Accounts, the Englishtext shall prevail.
38
Standard Chartered PLC --- Shareholder information
Taxation
Information on taxation applying to dividends paid to you if you are a shareholder in the UK, Hong Kong or the US willbe sent to you with your dividend documents.
Electronic communications
If you hold your shares on the UK register and in future you would like to receive the Annual Report and Accountselectronically rather than by post, please register online at: investorcentre.co.uk. Then click on Register and follow theinstructions. You will need to have your Shareholder or ShareCare reference number when you log on. You can findthis on your share certificate or ShareCare statement. Once registered you can also submit your proxy vote anddividend election electronically, and change your bank mandate or address information.
Forward-looking statements
This document may contain ‘forward-looking statements’ that are based on current expectations or beliefs, as well asassumptions about future events. These forward-looking statements can be identified by the fact that they do notrelate only to historical or current facts. Forward-looking statements often use words such as ‘may’, ‘could’, ‘will’,‘expect’, ‘intend’, ‘estimate’, ‘anticipate’, ‘believe’, ‘plan’, ‘seek’, ‘continue’ or other words of similar meaning. By theirvery nature, such statements are subject to known and unknown risks and uncertainties and can be affected by otherfactors that could cause actual results, and the Group’s plans and objectives, to differ materially from those expressedor implied in the forward-looking statements. Recipients should not place reliance on, and are cautioned about relyingon, any forward-looking statements. There are several factors which could cause actual results to differ materially fromthose expressed or implied in forward-looking statements. The factors that could cause actual results to differmaterially from those described in the forward-looking statements include (but are not limited to) changes in global,political, economic, business, competitive, market and regulatory forces or conditions, future exchange and interestrates, changes in tax rates, future business combinations or dispositions and other factors specific to the Group. Anyforward-looking statement contained in this document is based on past or current trends and/or activities of the Groupand should not be taken as a representation that such trends or activities will continue in the future.
No statement in this document is intended to be a profit forecast or to imply that the earnings of the Group for thecurrent year or future years will necessarily match or exceed the historical or published earnings of the Group. Eachforward-looking statement speaks only as of the date of the particular statement. Except as required by any applicablelaws or regulations, the Group expressly disclaims any obligation to revise or update any forward looking statementcontained within this document, regardless of whether those statements are affected as a result of new information,future events or otherwise.
Nothing in this document shall constitute, in any jurisdiction, an offer or solicitation to sell or purchase any securities orother financial instruments, nor shall it constitute a recommendation or advice in respect of any securities or otherfinancial instruments or any other matter.
This information will be available on the Group’s website at sc.com
Details of voting at the Company’s AGM and of proxy votes cast can be found on the Company’s website atinvestors.sc.com
If you would like to receive more information, please visit our website at investors.sc.com/shareholder or contact theshareholder helpline on 0370 702 0138.
Further information can be obtained from the Company’s registrars or from ShareGift on 020 7930 3737 or fromsharegift.org
Please register online at investorcentre.co.uk or contact our registrar for a mandate form
You can check your shareholding at computershare.com/hk/investors