National Reviewers:Rizaldi Boer, Ruandha Agung Sugardiman, Teddy Rusolono, Chairil Anwar Siregar, Maswar Bahri
International Reviewers:Michael Parsons, Robert Waterworth, Thomas Harvey, Geoff Roberts, Nikki Fitzgerald
Contributors:National Institute of Aeronautics and Space, Directorate General of Forestry Planning and Environmental Management of the Ministry of Environment and Forestry, Agricultural Research and Development Agency of the Ministry of Agriculture
Citation is permitted with acknowledgement of the source:Krisnawati, H., Imanuddin, R., Adinugroho, W.C. and Hutabarat, S. 2015. Standard Methods for Estimating Greenhouse Gas Emissions from Forests and Peatlands in Indonesia. Research, Development and Innovation Agency of the Ministry of Environment and Forestry. Bogor, Indonesia.
Published by:Research, Development and Innovation Agency of the Ministry of Environment and ForestryKampus Badan Penelitian, Pengembangan dan InovasiJl. Gunung Batu No. 5, Bogor 16610, IndonesiaTelp : +62-251 7520068Email : [email protected] | [email protected] : http://www.forda-mof.org
Support for this publication was provided by the Australian Government through a partnership with the Center for International Forestry Research (CIFOR). Support was also provided through the former Indonesia–Australia Forest Carbon Partnership (IAFCP).
Standard Methods for Estimating Greenhouse Gas Emissions from Forests and Peatlands in Indonesia (Version 2) | iii
The Ministry of Environment and Forestry is developing the Indonesian National Carbon Accounting System (INCAS) to support Indonesia’s greenhouse gas (GHG) accounting requirements for the land based sectors. The system provides a systematic and nationally consistent approach to measuring GHG emissions and removals for Indonesia’s land sector.
I am pleased to present this important publication, the second version of the INCAS Standard Methods for Estimating Greenhouse Gas Emissions from Forests and Peatlands in Indonesia. This document clearly describes the approach used to estimate GHG emissions and removals under the current phase of the INCAS framework. These build upon the first version of the INCAS Standard Methods which were applied over the REDD+ Pilot Province of Central Kalimantan and released in March 2015. This second version has now been updated and applied nationally to estimate net GHG emissions from forests and peatlands across all of Indonesia.
I am hopeful that the ongoing development and operationalization of the INCAS will further improve our GHG data and reporting capabilities. This will not only help us to meet our international requirements, including measurement, reporting and verification (MRV) system for REDD+ activities and allow us to design, implement and monitor effective interventions to reduce the net GHG emissions produced by our land use.
I congratulate the INCAS team, the Research, Development and Innovation Agency and the Directorate General of Forest Planning in the development of the INCAS. I would also like to acknowledge the valuable contribution of the National Institute for Aeronautics and Space (LAPAN). I also thank the Australian Government and the Center for International Forestry Research (CIFOR) and the former Indonesia-Australia Forest Carbon Partnership (IAFCP) for their well targeted and effective assistance.
I look forward to seeing the continued development and expansion of the INCAS to include full coverage of the Agriculture, Forestry and Other Land Use (AFOLU) sector and the operationalization of the INCAS as a functional system of the Ministry of Environment and Forestry.
Jakarta, November 2015Minister of Environment and Forestry
Dr. Ir. Siti Nurbaya, M.Sc
FOREWORD
iv | Standard Methods for Estimating Greenhouse Gas Emissions from Forests and Peatlands in Indonesia (Version 2)
TABLE OF CONTENTS
FOREWORD ........................................................................................................................ iii
LIST OF TABLES ................................................................................................................vii
LIST OF FIGURES ............................................................................................................ viii
Standard Methods for Estimating Greenhouse Gas Emissions from Forests and Peatlands in Indonesia (Version 2) | vii
LIST OF TABLES
Table 2-1. Potential data source used for defining initial condition ............................... 5
Table 2-2. Initial aboveground biomass (DBH ≥ 5 cm) for each forest type and analysis region in Indonesia ..................................................................... 11
Table 2-3. Biomass estimates of unmeasured carbon pools based on their proportion relative to aboveground biomass ................................................ 12
Table 4-1. Sources of data used in determining forest management events and regimes. ........................................................................................................ 24
Table 4-2. Possible conditions in each category used for defining management regimes or suites ................................................................................................ 25
Table 4-3. Summary of regime description ....................................................................... 28
Table 4-4. Summary of event description ......................................................................... 29
Table 6-1. Source of spatial data ......................................................................................... 38
Table 7-1. Source of spatial data used ............................................................................... 45
Table 7-2. Source of modelling input data ........................................................................ 45
Table 7-3. Emission factors for biological oxidation of peat in Indonesia.................... 46
Table 7-4. Input parameters and CO2-C, CO and CH4 emissions per ha for organic soil fire ................................................................................................... 47
Table 7-6. Modeling outputs and reporting units............................................................ 50
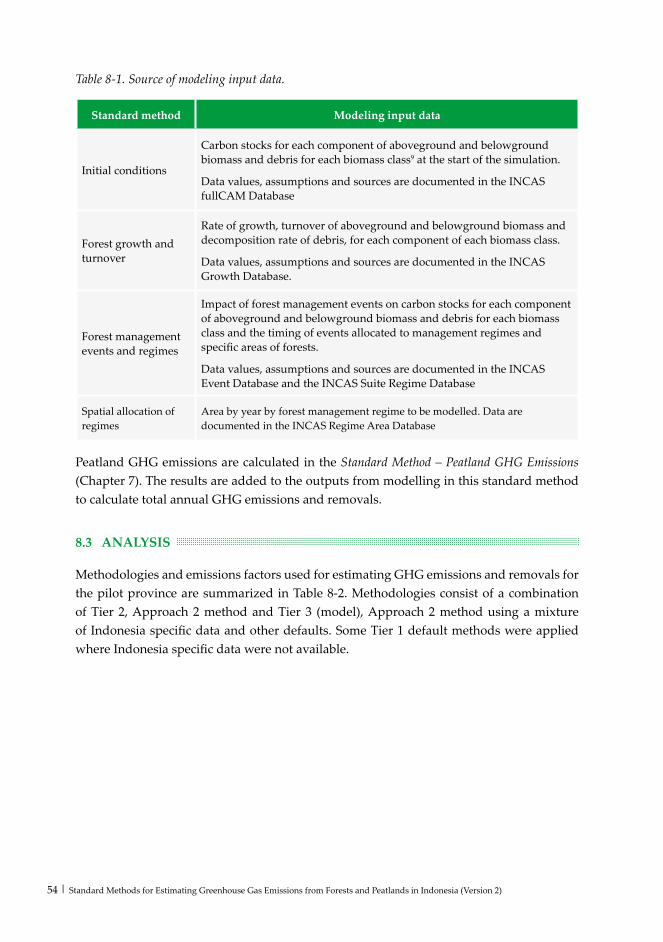
Table 8-1. Source of modeling input data ......................................................................... 54
Table 8-2. Summary of methodologies and emission factors: Land use, land-use change and forestry sector................................................................ 55
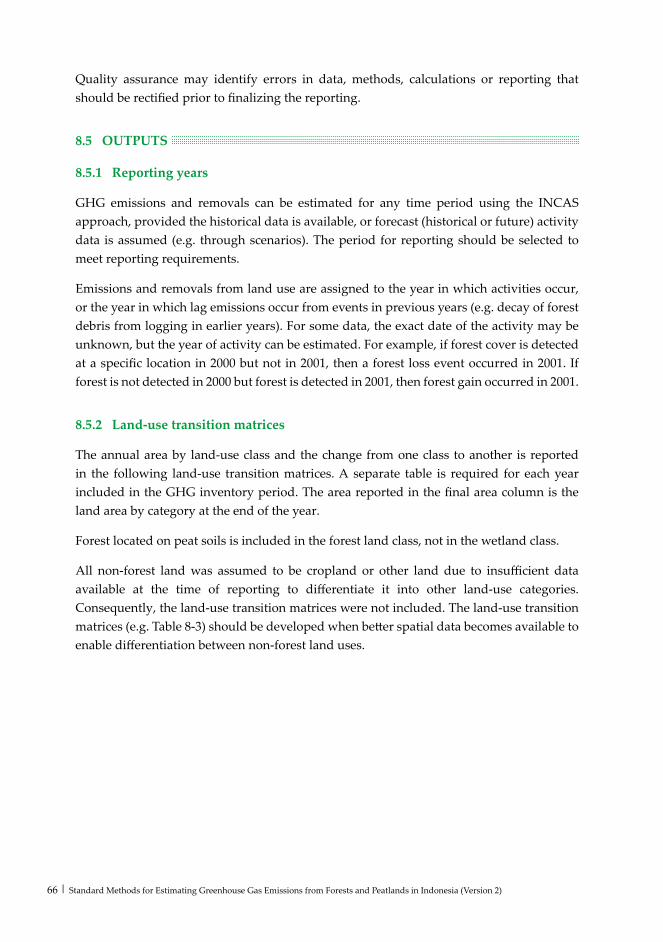
Table 8-3. Land use transition matrices............................................................................. 67
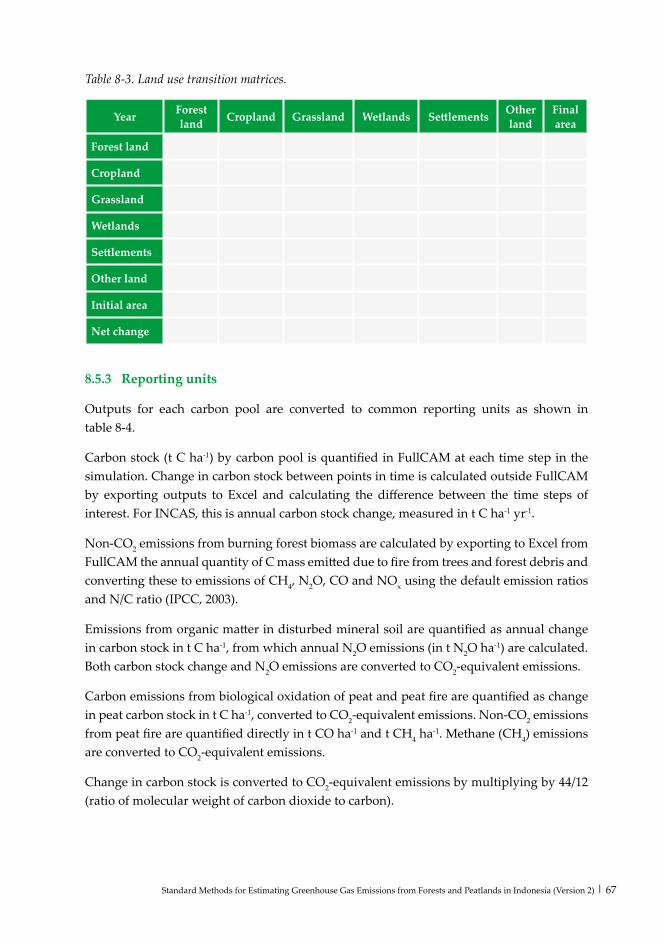
Table 8-4. Model outputs and reporting units ..........................................................68
Table 8-5. Comparison between UNFCCC reporting categories and REDD+ activities included in the national GHG inventory. ...................................... 69
viii | Standard Methods for Estimating Greenhouse Gas Emissions from Forests and Peatlands in Indonesia (Version 2)
LIST OF FIGURES
Figure 2-1. Overview approach used to quantify forest biomass in each carbon pool. ......................................................................................................... 6
Figure 3-1. Phases of growth rates ..................................................................................... 18
Figure 3-2. Example of increment curves generated from volume increment ........... 18
Figure 3-3. The example of outputs from growth analysis for secondary swamp forest after burning ............................................................................ 20
Figure 5-1. Flowchart of the steps in INCAS-LCCA processing sequence (LAPAN, 2014). ................................................................................................. 32
Figure 5-2. Example of the products of forest extent (in 2009) at national, regional and local scale. The local scale includes comparison with Landsat and high-resolution imagery (LAPAN, 2014) ............................... 35
Figure 8-1. FullCAM components and carbon flows for tree and debris pools. ......... 57
Figure 8-2. Example of the output of changes in carbon mass by carbon pool from deforestation. ........................................................................................... 60
Figure 8-3. Example of the output of changes in carbon mass by carbon pool from forest degradation................................................................................... 60
Figure 8-4. Example of the output of changes in carbon mass by carbon pool from sustainable management of forests. ..................................................... 61
Figure 8-5. Example of the output of changes in carbon mass by carbon pool from enhancement of forest carbon stocks ................................................... 61
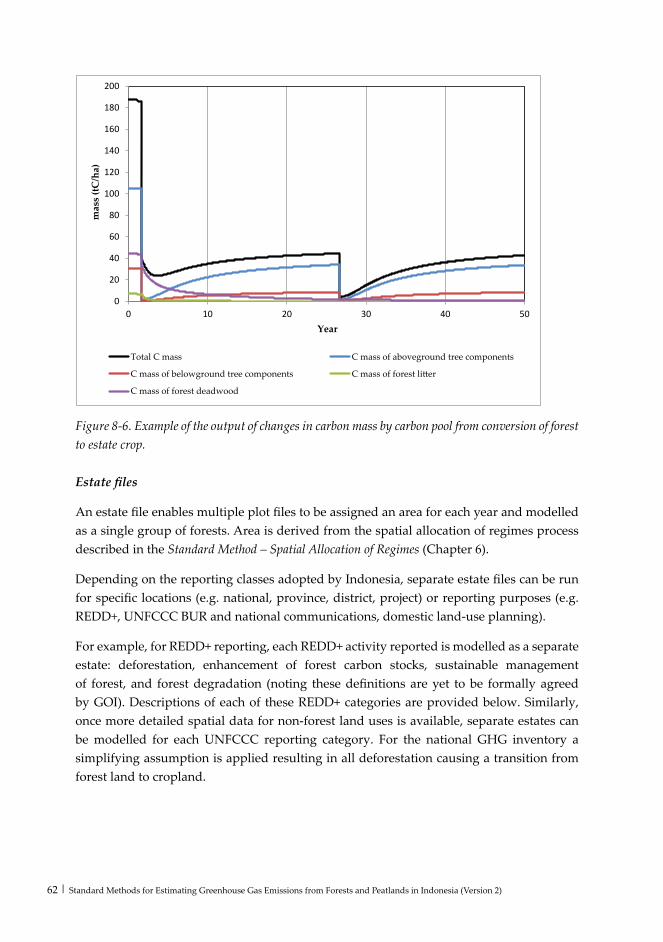
Figure 8-6. Example of the output of changes in carbon mass by carbon pool from conversion of forest to estate crop ........................................................ 62
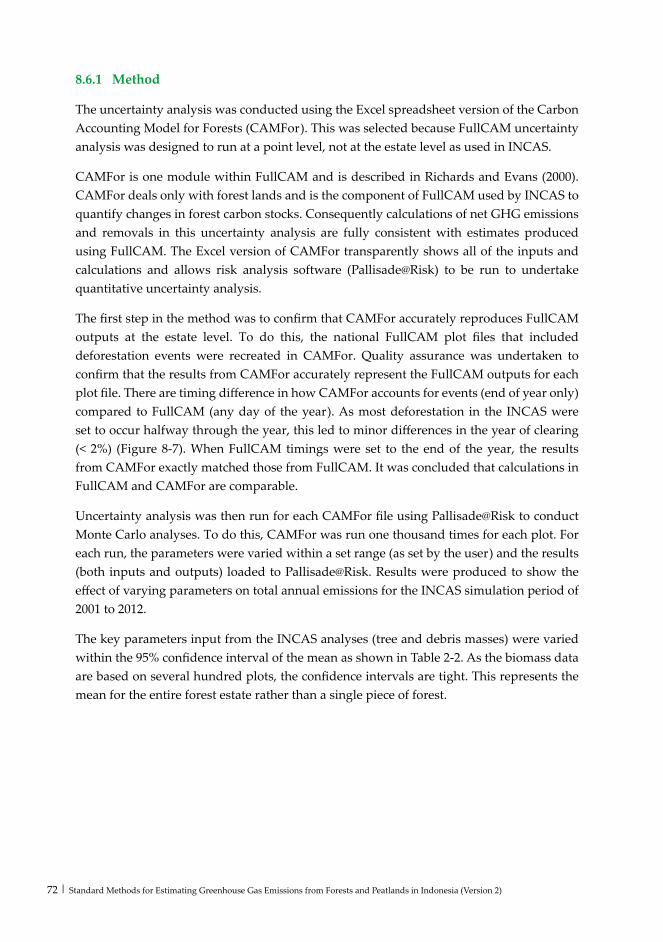
Figure 8-7. Comparison in annual emissions from deforestation events as estimated from FullCAM and CAMFor, indicating very little variation between the two tools ..................................................................... 73
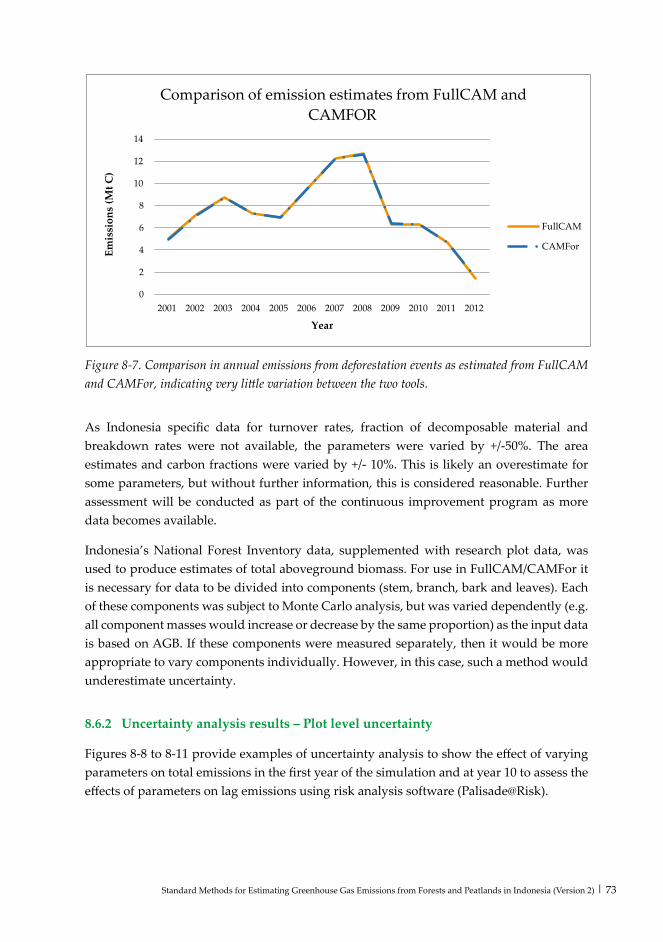
Figure 8-8. Distribution for net carbon mass emitted in secondary swamp forest due to deforestation in the first year of the simulation ................... 74
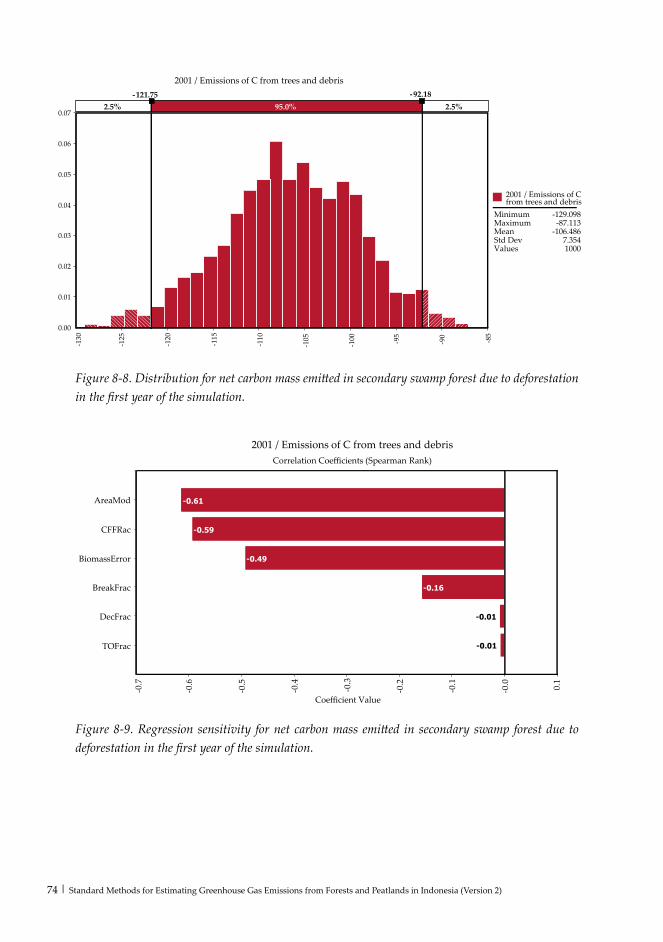
Figure 8-9. Regression sensitivity for net carbon mass emitted in secondary swamp forest due to deforestation in the first year of the simulation ...... 74
Standard Methods for Estimating Greenhouse Gas Emissions from Forests and Peatlands in Indonesia (Version 2) | ix
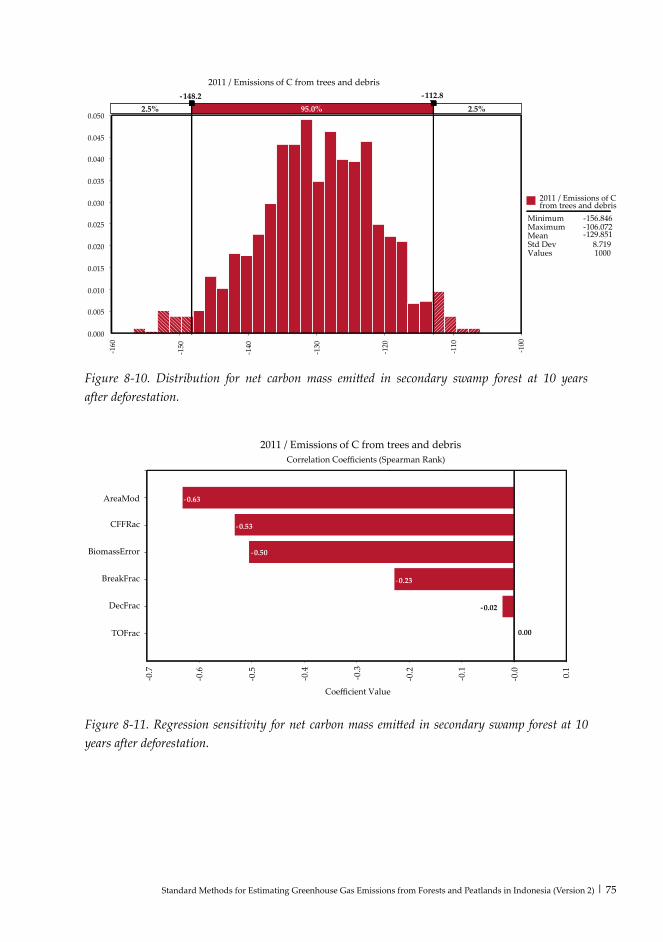
Figure 8-10. Distribution for net carbon mass emitted in secondary swamp forest at 10 years after deforestation ........................................................... 75
Figure 8-11. Regression sensitivity for net carbon mass emitted in secondary swamp forest at 10 years after deforestation ............................................. 75
Figure 8-12. National level uncertainty results for clearing and fire events associated with deforestation ....................................................................... 76
Standard Methods for Estimating Greenhouse Gas Emissions from Forests and Peatlands in Indonesia (Version 2) | 1
This document (Annex) describes in detail the standard methods developed by the Indonesian National Carbon Accounting System (INCAS) to quantify net greenhouse gas (GHG) emissions for forests and peatlands in Indonesia in a transparent, accurate, complete, consistent and comparable (TACCC) manner. The first version of the standard methods, described in Krisnawati et al. (2015a) were initially tested and refined to estimate emissions and removals from forest and peatlands in Central Kalimantan as the REDD+ pilot province, the results of which are reported in Estimation of Annual Greenhouse Gas Emissions from Forest and Peat Lands in Central Kalimantan (Krisnawati et al., 2015b). These methods were improved as the coverage of INCAS was expanded to cover all provinces in Indonesia. Improvements arose due to access to new data sources and enhanced technical expertise.
The standard methods describe the approach and methods used for data collation, data analysis, quality control, quality assurance, modelling and reporting of GHG emissions and removals. Use of the standard methods ensures consistent methods are applied for every forest land sector GHG inventory conducted, regardless of the geographic or temporal coverage. The standard methods include:
1. Standard method – initial conditions: describes the process for defining the initial conditions that are used as inputs for modelling GHG emissions and removals. This includes aboveground biomass, belowground biomass, litter and dead wood (woody debris) for each biomass class (see Chapter 2 of this Annex).
2. Standard method – forest growth and turnover: describes the process for defining rate of growth, turnover of aboveground biomass and belowground biomass and decomposition rate of debris (deadwood and litter), for each component of each biomass class, which are used as inputs for modelling GHG emissions and removals (see Chapter 3 of this Annex).
3. Standard method – forest management events and regimes: describes the process for defining forest management events and regimes and their impact on carbon stocks as inputs for modelling GHG emissions and removals (see Chapter 4 of this Annex).
INTRODUCTION
2 | Standard Methods for Estimating Greenhouse Gas Emissions from Forests and Peatlands in Indonesia (Version 2)
4. Standard method – forest cover change: the standard methods used to monitor changes in forest cover in Indonesia are described in The Remote Sensing Monitoring Program of Indonesia’s National Carbon Accounting System: Methodology and Products, Version 1 (LAPAN, 2014) (see Chapter 5 of this Annex).
5. Standard method – spatial allocation of regimes: describes how available spatial data are used to consistently allocate management regimes to areas analyzed and to derive annual area statistics for use in INCAS (see Chapter 6 of this Annex).
6. Standard method – peatland GHG emissions: describes the process for quantifying GHG emissions from biological oxidation of drained peat, direct emissions from drained organic soils and emissions from peat fire (see Chapter 7 of this Annex).
7. Standard method – data integration and reporting: describes the process used to bring together data from the other INCAS standard methods (1–6) and to estimate GHG emissions and removals from activities occurring on forest lands including deforestation, forest degradation, sustainable management of forests and enhancement of forest carbon stocks in Indonesia (see Chapter 8 of this Annex).
This second version of the standard methods describes the methods, assumptions and data inputs used to estimate GHG emissions and removals for all provinces in Indonesia as part of the inaugural national GHG inventory using the INCAS. The standard methods should be updated as new data and technology become available, ensuring the continuous improvement of INCAS.
Standard Methods for Estimating Greenhouse Gas Emissions from Forests and Peatlands in Indonesia (Version 2) | 3
2.1 PURPOSE
This standard method describes the process used by INCAS for defining the initial conditions that will be used as inputs for modelling GHG emissions and removals from activities occurring on forest lands including deforestation, forest degradation, sustainable management of forests and enhancement of forest carbon stocks in Indonesia. This includes data collation, data analysis, quality control and quality assurance.
In the modelling of GHG emissions and removals, the initial conditions should be assigned for each biomass class. Biomass class represents forests with similar initial quantities of carbon that respond in similar ways to forest management events.
There are several factors that may affect the amount of carbon stored in the biomass, such as forest type, soil type, climate and historical land use. For the purposes of carbon stock estimation, each biomass class should be categorized into a series of classes that best explain the variation in carbon stocks. This variation needs to be identified to enable detailed analysis of GHG emissions and removals. Stratification of forest into biomass classes reduces variation and uncertainty of carbon stock estimates.
Classification of biomass by forest type and condition of forests on which management activities occurred is considered to be appropriate to reduce variation and uncertainty within the forests. Potential biomass class was defined based on the type and condition of forests including natural forests (i.e. primary dryland forest, secondary dryland forest, primary swamp forest, secondary swamp forest, primary mangrove forest and secondary mangrove forest) and timber plantations. These forest categories follow the classification of forest lands included in the land cover map of the Ministry of Environment and Forestry (MoEF).
Biomass refers to all living material in the aboveground and belowground pools of forests. The aboveground biomass included aboveground trees (covering all diameter classes) and understory vegetation. This includes stems, branches, bark and leaves. The belowground biomass includes coarse and fine roots.
STANDARD METHOD –INITIAL CONDITIONS
4 | Standard Methods for Estimating Greenhouse Gas Emissions from Forests and Peatlands in Indonesia (Version 2)
Litter and coarse woody debris belong to the debris pool, but they are related to biomass classes and are included in the biomass estimation. For each biomass class, representative quantities of these pools (aboveground biomass, belowground biomass, litter and deadwood) were estimated from available data (e.g. forest inventory plots, research plots and published information). Soil organic carbon was not included in this chapter, but it is critical to consider, particularly on peat swamp forest where soils may be an ongoing source of carbon emissions following disturbance. The approach for estimating changes in soil organic carbon on peatlands is described in the Standard method – peatland GHG emissions (Chapter 7 of this Annex).
The estimates of biomass for each component of the carbon pools (aboveground and belowground biomass and debris) for each biomass class are used as the initial values at the start of the simulation of GHG emissions and removals.
2.2 DATA COLLATION
Data used for defining the initial conditions for the national GHG inventory were collated from a wide range of sources, primarily from forest inventory plots. Forest inventory data from both temporary and permanent sample plots were used to provide a sound basis for estimating biomass in each biomass class. Research data, from biomass and carbon assessment-related studies, were used to fill critical information gaps not covered in the forest inventories.
For aboveground biomass in primary dryland forest, secondary dryland forest, primary swamp forest and secondary swamp forest, data used in defining initial conditions for national GHG inventory were derived from National Forest Inventory (NFI) plots, as described in the publication of the Directorate General of Forestry Planning (2014). NFI is a national program initiated by the former Ministry of Forestry in 1989 and supported initially by the Food and Agriculture Organization of the United Nations (FAO) and the World Bank through the NFI project. To date, more than 3,900 clusters of sample plots have been developed and distributed across the country. The plots are distributed with a systematic sampling throughout the country for every 20 km x 20 km grid. Each cluster contains nine plots consisting of 1 hectare (ha) size permanent sample plot (PSP) and surrounding by eight temporary sample plots (TSP). Only PSPs data were used for this analysis. The majority of the plots were established in areas below 1000 m above sea level. All trees with a minimum diameter of 5 cm were measured for DBH and a subset of trees measured for total tree height. Trees were also classified by local species name, crown characteristics, damage and infestation. The plots are classified under a range of types or conditions including land system, altitude in 100 m class, land use, forest type, stand condition and plantation status, terrain, slope and aspect. Detailed protocols used in field sampling and system design for plot data processing for the NFI in Indonesia are described in Revilla (1992).
Standard Methods for Estimating Greenhouse Gas Emissions from Forests and Peatlands in Indonesia (Version 2) | 5
A total of 4,450 measurements of PSPs from NFI across the country were available for data processing and analysis. All individual trees in the plot were examined and plots’ information was checked for each plot to ensure correct information, as described in the quality control and quality assurance processes (Section 2.4). Each individual tree in the plots was added with information on wood density1. Of the 4,450 measurement data available from NFI PSPs, 80% was located in forested lands while the remaining data were located in shrubs or other lands. From PSPs located in the forest lands, the data validation process reduced the usable number of measurement data to 2,622 (74.1%) for further analysis. These data were grouped into seven main islands (regions) of Indonesia to account for regional differences in site conditions, i.e. Sumatra, Kalimantan, Sulawesi, Papua, Java, Bali and Nusa Tenggara, and Maluku. The values for each region were then applied to each province within the region.
Since no PSP record data were available from NFI plots for mangrove forest ecosystem type in Indonesia, additional research data from previous studies on mangrove forest ecosystem carbon assessments in Indonesia (e.g. Murdiyarso et al., 2009; 2015; Donato et al., 2011; Krisnawati et al., 2012 reported in Krisnawati et al., 2014) were included.
Data from forest inventories were used as a basis to estimate aboveground biomass of trees. Carbon pools not measured in the forest inventories (e.g. other components of aboveground biomass, roots or belowground biomass, litter and deadwood) were estimated using the relationships based on its proportion with aboveground tree biomass as described in the next section.
Table 2-1. Potential data source used for defining initial condition.
Data Description Source
National Forest Inventory (NFI) plots Aboveground biomass (DBH ≥ 5cm) Ministry of Environment and
Forestry (MoEF)
Vegetation monitoring plots
Aboveground biomass (all growth stages) Relevant projects under MoEF
Research plots on forest carbon assessments
Various (include some or all components of aboveground tree biomass, understorey vegetation, belowground biomass (roots), debris, litter)
Research activities under MoEF and other research institutions
Information available from publications
Various (used to fill information gaps) Research papers/reports
1 A compendium of wood densities for Indonesian tree species can be found in INCAS Wood Density Database which has been compiled from various sources (e.g. Oey, 1964; Abdurrochim et al., 2004; Martawidjaya et al., 2005)
6 | Standard Methods for Estimating Greenhouse Gas Emissions from Forests and Peatlands in Indonesia (Version 2)
2.3 ANALYSIS
The analysis approach described in this standard method follows the procedures for estimating forest biomass for quantifying CO2 emissions described in Krisnawati et al. (2014). The procedure consists of methods for estimating:
• aboveground biomass (AGB):
▪ AGB for trees (DBH ≥ 5cm)
▪ AGB for trees (DBH < 5cm; height > 1.5 m)
▪ AGB for understorey vegetation (height < 1.5m);
• belowground biomass (BGB) or roots;
• litter;
• deadwood (woody debris).
The overview approach used to quantify forest biomass for each carbon pool is summarized in Figure 2-1.
Figure 2-1. Overview approach used to quantify forest biomass in each carbon pool.
C stockBiomass (Carbon pool)
Tota
l bio
mas
s fo
r eac
h fo
rest
type
and
con
ditio
n
Original condition
Nat
ural
For
ests
Car
bon
= 0.
5 x
dry
biom
ass
CO 2 e=
44/
12 x
C
Understoreyvegetation(Height < 1.5 m)
Proportion toabovegroundtree biomass
•
• Aboveground treesDBH ≥ 5 cm DBH < 5 cm,Height >1.5 m
Allometricmodels(monograph on allometrics)
Belowground(roots)
•
Root to shootratio (proportionto abovegroundbiomass)
Proportion toabovegroundtree biomass
• Litters
Proportion toabovegroundtree biomass
• Woody debris
Forest type andcondition
• Primarymangrove forest
• Secondary mangrove forest
• Primary swamp forest
• Secondary swamp forest
• Primary dryland forest
• Secondary dryland forest
Standard Methods for Estimating Greenhouse Gas Emissions from Forests and Peatlands in Indonesia (Version 2) | 7
The detailed methodology applied in quantifying forest biomass in each carbon pool is described below.
2.3.1 Estimating aboveground biomass (AGB)
AGB includes all trees covering all diameter classes and understorey vegetation. Data for all individual trees in the inventory plots were used to estimate AGB for the trees with diameter at breast height (DBH) of 5cm or larger. The estimation was done as follows:
AGB for trees (DBH ≥ 5 cm)
The AGB of individual trees (DBH ≥ 5 cm) in the plots was estimated using allometric models developed for pantropical forest (Chave et al., 2005), which used DBH and wood density (WD) of the species as the key parameters. Several other allometric models were also tested, including some local allometric models as compiled in Krisnawati et al. (2012). However, the availability of local allometric models specific for six forest types were not all represented in seven main islands of Indonesia so this generalized allometric model of Chave et al. (2005) was used, instead. This model has been found to perform equally well as local models in the Indonesian tropical forests (Rutishauser et al., 2013; Manuri et al., 2014). The model is as follows:
where AGBT = AGB of measured tree (kg), ρ = wood density2, DBH = diameter at breast height (cm)
The resulting AGB is the total AGB of the tree (including stem, branches, twigs, leaves and fruit/flowers, if any) in dry weight (expressed in kilograms [kg]).
The total AGB for each plot (per hectare) was then quantified by summing AGB estimates for all trees in the plots (expressed in megagrams (Mg) or tonnes (t)):
where AGBP = AGB of plot (Mg ha-1), AGBT = AGB of measured tree (kg), AP = plot area (ha), n = number of trees per plot.
The mean AGB for each forest type in the main island was derived by averaging the AGB of all plots in each forest type:
where AGBj = mean AGB of forest type-j, AGBPi = AGB of plot-i, n= number of plots
2 A Wood density after applying a correction factor using an equation of Reyes et al. (1992): Y = 0.0134 + 0.8X to adjust with the dry weight of aboveground biomass.
8 | Standard Methods for Estimating Greenhouse Gas Emissions from Forests and Peatlands in Indonesia (Version 2)
AGB for trees (DBH < 5 cm; height > 1.5 m)
For inventory plots where the trees with DBH < 5 cm was not measured, the proportion derived from the research or vegetation monitoring plots having a complete pool of aboveground tree components was used and then the average proportion for the unmeasured component in the plots was applied.
For swamp forests, the average proportion of AGB for trees with DBH < 5 cm; height > 1.5 m to AGB for trees with DBH ≥ 5 cm (derived from vegetation monitoring plots in peat swamp forest (Graham, 2013)) was used to quantify the unmeasured component of aboveground tree biomass. The resulting proportions were 11.4% for primary swamp forest and 11.1% for secondary swamp forests, respectively.
For primary and secondary dryland forests, proportions of 0.2% for primary dryland forest and 1.1% for secondary dryland forests were adopted from a previous study conducted in dryland protection forest (Krisnawati et al., 2013).
AGB for understorey vegetation (height < 1.5 m)
All inventory plots provide only aboveground tree components. Understorey vegetation (including seedlings, shrubs, vines, herbaceous plants, etc.), which forms part of the aboveground biomass in forest ecosystems, was not included. Consequently, aboveground biomass for understorey vegetation was estimated using a proportion based on the results of previous studies on the forest ecosystem type.
For swamp forests, the average proportion applied was derived from several studies conducted by Jaya et al. (2007) and Dharmawan (2012), resulting in estimates of understorey vegetation biomass of 2.4% of aboveground tree biomass for primary swamp forest and 3.8% for secondary swamp forest. For secondary dryland forests, the proportion of 2.7% of aboveground tree biomass was derived from studies conducted by Junaedi (2007) and Hardiansyah (2011). For primary dryland forest, the proportion of 0.5% of aboveground tree biomass was adopted from a previous study in dryland protection forest (Krisnawati et al., 2013).
2.3.2 Estimating belowground biomass (roots)
The estimates of belowground biomass (roots) can be derived from an allometric model or as a proportion of aboveground biomass, expressed as a root:shoot ratio (IPCC, 2003). A default value for the root:shoot ratio of the tree biomass has been published in the Good Practice Guidance for LULUCF (Land Use, Land Use Change and Forestry) and in the REDD Sourcebook, i.e. 0.24 (0.22–0.33) (IPCC, 2003; GOFC–GOLD, 2009). However, the ratio will vary according to species, ecosystem type, soil and climatic conditions. The root:shoot ratio of 0.29 was adopted, as derived by Moser et al. (2011) in tropical dryland forests. For swamp
Standard Methods for Estimating Greenhouse Gas Emissions from Forests and Peatlands in Indonesia (Version 2) | 9
forest, an allometric model developed by Niiyama et al. (2005) was first applied to estimate belowground biomass for each plot with a complete measurement of the aboveground tree component and the average proportion of belowground biomass to aboveground biomass was obtained, resulting in a root:shoot ratio of 0.22.
2.3.3 Estimating litter
Litter consists of remaining dead plant material (fruits, leaves, flowers) on the forest floor. This pool has been reported to vary from 1.3% to 23% of aboveground tree biomass (derived from various sources as documented in Krisnawati et al., 2014). A proportion of 3.0% of AGB was used for primary dryland forest; 2.7% was used for secondary dryland forest (Brown et al., 1995; Hardiansyah, 2011); 1.6% was used for primary swamp forest; and 2.3% was used for secondary swamp forest (Jaya et al., 2007; Dharmawan, 2012).
2.3.4 Estimating woody debris
Woody debris consists of all dead woody materials including standing dead trees, fallen trees and part of trees (stems, branches, twigs) on the ground. This pool is equivalent to 10–40% of aboveground biomass (Uhl and Kauffman, 1990; Verwer and Van der Meer, 2010). The biomass contained in woody debris was estimated to be 18% of aboveground tree biomass for primary dryland forest and 33% for secondary dryland forest (derived from various sources as documented in Krisnawati et al. (2014)). For peat swamp forest, a proportion of 18.5% of AGB was used to estimate biomass in woody debris for primary swamp forest (Dharmawan, 2012) and 23.9% for secondary swamp forest (Ludang and Jaya, 2007; Dharmawan, 2012).
2.4 QUALITY CONTROL AND QUALITY ASSURANCE
As inventory plots from different sources were established for different purposes, there is no standardized protocol for data collection (e.g. sampling design, plot size, coverage of measurement data, etc.). Consequently, the data has variable quality and coverage, both spatially and temporally. However, all the inventory plots used for analysis share the following similar measurement standards: (1) located in forests with a total area inventoried of ≥ 0.1 ha; (2) all trees of ≥ 5 cm diameter at breast height (DBH) were measured for DBH; and (3) the species of measured trees were identified.
10 | Standard Methods for Estimating Greenhouse Gas Emissions from Forests and Peatlands in Indonesia (Version 2)
The quality of measurement data from inventory plots was first checked to see if there was any error in data measurement and recording. The process included: (i) checking the location of the plots such as administrative location (province, district, sub-district), geographical position (longitudinal and latitudinal coordinates), forest type, soil type by overlaying with relevant maps, (ii) checking the number of recording units (subplots) in each plot, (iii) checking measurement data through abnormality filtering of DBH, species name and condition of individual trees in the plots, (iv) checking information on the plots such as basal area, stand density, volume, aboveground biomass.
2.5 OUTPUTS AND UNCERTAINTY ANALYSIS
The quantity of biomass (stored in aboveground trees, understorey vegetation, litter, woody debris and belowground biomass) in each biomass class for each region is used as the input for initial condition for modelling GHG emissions and removals from activities occurring on forest lands, where the change in carbon stock is quantified based on the impact of specific events.
Outputs from the analysis applied in this standard method are expressed in dmt ha-1 (dry matter tonne per hectare) for each component of biomass pools (aboveground biomass consisting of stem, branch, bark and leaves and belowground biomass consisting of coarse and fine roots) and in t C ha-1 (tonne carbon per hectare) for debris pools (deadwood and litter). These outputs are in the format required for inputs for the methods described in the Standard Method – Data Integration and Reporting (Chapter 8 of this Annex).
The outputs of this analysis are summarized in Table 2-2. Statistical analysis has been conducted to determine the range of estimates (lower and upper limit) at the 95% confidence interval level.
Standard Methods for Estimating Greenhouse Gas Emissions from Forests and Peatlands in Indonesia (Version 2) | 11
Table 2-2. Initial aboveground biomass (DBH ≥ 5 cm) for each forest type and analysis region in Indonesia.
Biomass class (Forest type)
Main islandsN of plot
measurement
Mean (dmt ha-1)
95% confidence interval (dmt ha-1)
Mean Lower Upper
Primary dryland forest
INDONESIA 874 266.0 259.5 272.5
Bali and Nusa Tenggara
52 274.4 247.4 301.3
Jawa nd nd nd nd
Kalimantan 333 269.4 258.2 280.6
Maluku 14 301.4 220.3 382.5
Papua 162 239.1 227.5 250.6
Sulawesi 221 275.2 262.4 288.1
Sumatera 92 268.6 247.1 290.1
Secondary dryland forest
INDONESIA 1299 197.7 192.9 202.5
Bali and Nusa Tenggara
69 162.7 140.6 184.9
Jawa 1 170.5 na na
Kalimantan 608 203.3 196.3 210.3
Maluku 99 222.2 204.5 239.8
Papua 60 180.4 158.5 202.4
Sulawesi 197 206.5 194.3 218.7
Sumatera 265 182.2 172.1 192.4
Primary swamp forest
INDONESIA 95 192.7 174.6 210.8
Bali and Nusa Tenggara
na na na na
Jawa na na na na
Kalimantan 3 275.5 269.2 281.9
Maluku na na na na
Papua 67 178.8 160.0 197.5
Sulawesi 3 214.4 -256.4 685.2
Sumatera 22 220.8 174.7 266.9
Secondary swamp forest
INDONESIA 354 159.3 151.4 167.3
Bali and Nusa Tenggara
na na na na
Jawa na na na na
Kalimantan 166 170.5 158.6 182.5
Maluku na na na na
Papua 16 145.7 106.7 184.7
Sulawesi 12 128.3 74.5 182.1
Sumatera 160 151.4 140.2 162.6
12 | Standard Methods for Estimating Greenhouse Gas Emissions from Forests and Peatlands in Indonesia (Version 2)
Biomass class (Forest type)
Main islandsN of plot
measurement
Mean (dmt ha-1)
95% confidence interval (dmt ha-1)
Mean Lower Upper
Primary mangrove foresta Kalimantan 9 237.2 184.7 298.6
Secondary mangrove forestb Kalimantan 11 108.0 70.6 152.5
Notes:− aAGB for primary mangrove forest was estimated from studies by Murdiyarso et al. (2009); Donato et al.
(2011); and Krisnawati et al. (2014)− bAGB for secondary mangrove forest was estimated from a study by Krisnawati et al. (2012), as reported in
Krisnawati et al. (2014)− nd = no data− na = not applicable
From the values of aboveground biomass estimates (Table 2-2), the proportions of unmeasured carbon pools to aboveground biomass were then derived for each biomass class (forest type) using the proportion values defined in Section 2.3. The results of the estimates of unmeasured carbon pools based on their proportion are summarized in Table 2-3.
Table 2-3. Biomass estimates of unmeasured carbon pools based on their proportion relative to aboveground biomass.
Biomass class (Forest type)
Main islandsAGB <5cm (dmt ha-1)
AGB understorey
(dmt ha-1)
BGB(dmt ha-1)
Litter(dmt ha-1)
Woody debris
(dmt ha-1)
Primary dryland forest
INDONESIA 0.5 1.2 77.6 8.1 48.1
Bali and Nusa Tenggara
0.5 1.2 80.1 8.3 49.7
Jawa nd nd nd nd nd
Kalimantan 0.5 1.2 78.6 8.2 48.8
Maluku 0.6 1.4 88.0 9.2 54.5
Papua 0.5 1.1 69.8 7.3 43.3
Sulawesi 0.6 1.2 80.3 8.4 49.8
Sumatera 0.5 1.2 78.4 8.2 48.6
Secondary dryland forest
INDONESIA 2.2 5.5 59.5 5.5 65.9
Bali and Nusa Tenggara
1.8 4.5 49.0 4.5 54.3
Jawa 1.9 4.7 51.4 4.7 56.9
Kalimantan 2.2 5.6 61.2 5.6 67.8
Maluku 2.4 6.1 66.9 6.1 74.1
Papua 2.0 5.0 54.3 5.0 60.2
Sulawesi 2.3 5.7 62.2 5.7 68.9
Sumatera 2.0 5.0 54.9 5.0 60.8
Standard Methods for Estimating Greenhouse Gas Emissions from Forests and Peatlands in Indonesia (Version 2) | 13
Biomass class (Forest type)
Main islandsAGB <5cm (dmt ha-1)
AGB understorey
(dmt ha-1)
BGB(dmt ha-1)
Litter(dmt ha-1)
Woody debris
(dmt ha-1)
Primary swamp forest
INDONESIA 22.0 5.0 48.4 3.4 39.7
Bali and Nusa Tenggara
na na na na na
Jawa na na na na na
Kalimantan 31.5 7.2 69.1 4.9 56.8
Maluku na na na na na
Papua 20.5 4.7 44.9 3.2 36.9
Sulawesi 24.5 5.6 53.8 3.8 44.2
Sumatera 25.3 5.8 55.4 3.9 45.5
Secondary swamp forest
INDONESIA 17.7 6.8 40.4 4.1 42.3
Bali and Nusa Tenggara
na na na na na
Jawa na na na na na
Kalimantan 19.0 7.3 43.3 4.4 45.3
Maluku na na na na na
Papua 16.2 6.2 37.0 3.8 38.7
Sulawesi 14.3 5.5 32.6 3.3 34.1
Sumatera 16.9 6.4 38.4 3.9 40.2
Primary mangrove forest
Kalimantan nd nd 15.1 nd 99.7
Secondary mangrove forest
Kalimantan nd nd 14.8 nd 93.3
Notes: − nd = no data
− na = not applicable
The estimates of biomass for each component of the carbon pools (as described in Table 2-2 and 2-3) were used as the initial values at the start of the simulation of GHG emissions and removals. For the purpose of simulation, the aboveground biomass pool was broken down into stem, branch, bark and leaf components. The belowground biomass pool was broken down into fine roots and coarse roots. Litter and woody debris pools were differentiated into decomposable and resistant components. More detailed information on the values and sources are documented in the INCAS fullCAM Database (see the description of the Database in Appendix 1).
14 | Standard Methods for Estimating Greenhouse Gas Emissions from Forests and Peatlands in Indonesia (Version 2)
2.6 LIMITATIONS
The INCAS framework is designed to use the best available data, with assumptions used to fill data gaps. The limitations encountered include:
• Only forest lands were included in the initial condition during the simulation period described in this standard method. There may be some other lands present at the beginning of the simulation period that require an initial condition to be assigned.
• Only forest ecosystem types were used as a basis for classifying forest biomass.
• Aboveground biomass estimates of both primary and secondary mangrove forests were based on research plots from Kalimantan only.
• Data of the biomass components were not available for all regions.
2.7 IMPROVEMENT PLAN
Plans for improvement are outlined below:
• The lands outside forest land may need to be included in future quantification of GHG emissions and removals from the land-based sector and assigned as new/additional biomass classes (e.g. estate crops such as oil palm and rubber). These types of lands could be estimated separately.
• Factors other than forest ecosystem type that may affect the amount of biomass may need to be analyzed, e.g. soil type, elevation, rainfall, etc. Initial analysis to derive biomass class based on biophysical factors did not result in sufficiently robust relationship. This should be re-tried once more data are available.
• More inventory plots should be established in mangrove forests across Indonesia to improve biomass estimates for this forest type. Recent studies by Murdiyarso et al. (2015) should also be included in the next calculation to update the biomass estimates of mangrove forests.
• The proportion of biomass in each carbon pool for each biomass class should be updated once data or research representing the differences between regions is available.
Standard Methods for Estimating Greenhouse Gas Emissions from Forests and Peatlands in Indonesia (Version 2) | 15
3.1 PURPOSE
This standard method describes the process used by INCAS for defining the forest growth and turnover that will be used as inputs for quantifying GHG emissions and removals from activities occurring on forest lands including: deforestation, forest degradation, sustainable management of forests and enhancement of forest carbon stocks in Indonesia. This includes data collation, data analysis, quality control and quality assurance.
INCAS adopted an event-driven modelling approach (see Chapter 7, Standard Method – Data Integration and Reporting) to account for changes in forest carbon stocks, which includes processes that continuously occur (e.g. growth or production, turnover, breakdown) and events that periodically occur (e.g. harvesting, fire) which usually have an instantaneous impact on carbon flows and thus impact on biomass and carbon stocks at any point in time. Total biomass and carbon stocks at any point in time represents the result of a series of events applied to the initial biomass and carbon stocks at the initial condition before experiencing the disturbance or management events, influenced by growth (production), turnover and breakdown processes after the disturbances or management events. Impact of the disturbance or management events on forest condition from which GHG emissions and removals are derived need to be quantified to accurately estimate GHG emissions and removals.
The objective of this standard method is to describe the methodologies used for defining rate of growth, turnover of aboveground and belowground biomass and decomposition rate of debris, for each component of each biomass class.
Outputs from this standard method will be used as inputs in quantifying emissions and removals for the processes of production, turnover and breakdown for each biomass class (documented in Chapter 7, Standard Method – Data Integration and Reporting).
STANDARD METHOD –FOREST GROWTH AND TURNOVER
16 | Standard Methods for Estimating Greenhouse Gas Emissions from Forests and Peatlands in Indonesia (Version 2)
3.2 DATA COLLATION
Data used for defining forest growth were collated from various sources. This included information collated from time-series measurement data from permanent measurement plots (PMP) established in logged-over forests and other forest inventory data, such as permanent sample plots established specifically for long-term research to monitor forest growth/increment and stand dynamics as well as data and information available in published literature, including research reports.
PMP, known as Petak Ukur Permanen (PUP), is part of a national program initiated by the former Ministry of Forestry in 1995 through the Forestry Ministerial Decree No. 237/Kpts-II/1995. The objective of this decree is to request all logging concession companies in Indonesia to establish PMPs for monitoring growth and yield in their managed forest areas after logging. The Forestry Research and Development Agency (FORDA) published the guideline for plot establishment and measurement through the Directorate General Decree No. 38/KPTS/VIII-HM.3/93. The PMPs were classified into two major forest types, i.e. dryland forest and swamp forest. The plots were established in a logged-over area 1 to 3 years after logging and periodically measured/monitored. Each forest management unit (FMU) needs to establish at least 6 plots for dryland forest and 16 plots for swamp forest. Each PMP consists of an observation plot of 100 m x 100 m in size in which the DBH of all trees ≥ 10cm are measured and their species are identified. The measurement results are used to obtain information on forest growth and productivity of aboveground biomass (DBH ≥ 10cm).
Another measurement data series used is the STREK (silvicultural techniques for the regeneration of logged-over forests in East Kalimantan) plots. These plots are considered to be one of, if not the only, relatively good PSPs of dipterocarp forests in the world (Priyadi et al., 2005). The plots were established within logged-over forest in East Kalimantan by FORDA in collaboration with CIRAD-forêt and PT Inhutani I in 1989/1990. These plots were established to represent three different logging or silvicultural techniques, i.e. reduced impact logging with diameter limit 50 cm (RIL 50); RIL 60 and conventional logging. PSPs were also established in primary forest as a control. Total plot permanent area was about 48 ha and was measured periodically every 2 years up to the late 2010s. Measurements were carried out for all species with a diameter limit of 10 cm. More detailed description of these plots can be found in Bertault and Kadir (1998) and Siran (2005).
Information available in the proceedings, journals, student theses, research reports based on studies conducted in Indonesia or other neighboring countries with similar ecosystem conditions (e.g. Putz and Chan, 1986; Nguyen The et al., 1998; Inoue et al., 1999; Simbolon, 2003; Hashimoto et al., 2004; Hiratsuka, 2006; Limbong, 2009; Meunpong et al., 2010; Krisnawati et al., 2011; Saharjo, 2011; Susilowati, 2011; Yuniawati et al., 2011; Dharmawan, 2012; Purba et al., 2012) were used. In addition, stand yield tables for the main plantation species in Indonesia (Suharlan et al., 1975) were also included. These information sources
Standard Methods for Estimating Greenhouse Gas Emissions from Forests and Peatlands in Indonesia (Version 2) | 17
were used as references for the increment quantification approach in the modelling of GHG emissions and removals under INCAS to set the rate of growth, turnover of aboveground and belowground biomass and decomposition rate of debris, for each component of each biomass class.
3.3 ANALYSIS
Methodologies used in determining forest growth in this standard method consist of developing and analyzing growth and increment curves from the data and information collated from various sources as described in Section 3.2.
All data from inventory and research plots as well as information available from the literature were reviewed through a quality control process to ensure only valid data were used. For each data set, the location of the sampling site, forest conditions and the parameters that affect the results were recorded. Some of the data and information obtained from the literature (e.g. Putz and Chan, 1986; Nguyen The et al., 1998; Inoue et al., 1999; Simbolon, 2003; Hashimoto et al., 2004; Hiratsuka, 2006; Limbong, 2009; Meunpong et al., 2010; Krisnawati et al., 2011; Saharjo, 2011; Susilowati, 2011; Yuniawati et al., 2011; Dharmawan, 2012; Purba et al., 2012) were further analyzed and transformed to prepare forest growth and turnover rate data in the format required for INCAS.
Time-series data obtained from permanent sample plots established in logged-over forests in both PUPs and STREK plots were analyzed to quantify aboveground mass increment over time after logging. Calculations of aboveground biomass were carried out using the approach described in the monograph and guidelines on Allometric models for estimating tree biomass at various forest ecosystem types in Indonesia (Krisnawati et al., 2012; FORDA, 2013). Information available from stand yield tables (Suharlan et al., 1975) covering 10 main species of timber plantations (i.e. Jati, Rasamala, Damar, Pinus, Sonokeling, Mahoni, Akasia, Sengon, Balsa and Jabon) were re-analysed to produce average growth curves of various site index classes for each plantation species.
In analysing the growth, three phases of growth that occur in a stand are considered: (1) juvenile (young) phase with a fast growth rate, (2) full vigor phase with a constant growth rate and (3) senescent phase of declining growth rates. These three phases of growth will generally form a sigmoid curve (Figure 3-1).
18 | Standard Methods for Estimating Greenhouse Gas Emissions from Forests and Peatlands in Indonesia (Version 2)
Figure 3-1. Phases of growth rates
Several other regression models that form the sigmoid curve or growth curve (Weibull, root, modified exponential, logistic, logistics power, Gompertz, two-exponential association, three-exponential association), were tested to generate the corresponding growth curve and the selection was based on a combination of statistical and logical criteria. These analyses are documented in the INCAS growth database.
Two types of increment curves were considered (Figure 3-2):
• CAI (Current Annual Increment), defined as the increment over a period of 1 year at any stage in forest’s life.
• MAI (Mean Annual Increment), defined as the mean increment of the forest until a specific age.
However, for the purpose of modelling under INCAS framework, CAI data is needed when calculating annual biomass or carbon stocks (this can be generated from either biomass or volume).
Figure 3-2. Example of increment curves generated from volume increment
Standard Methods for Estimating Greenhouse Gas Emissions from Forests and Peatlands in Indonesia (Version 2) | 19
3.4 QUALITY CONTROL AND QUALITY ASSURANCE
Quality control processes were implemented to check that the methods used for data collection and analysis of data used met minimum standards for appropriateness and completeness. This included checking the quality of measurement data from inventory or monitoring plots to see if there was any error in recording and measurement. Accuracy of the data was checked further by overlaying with relevant maps to check that forest types matched with species in the record. Some information such as stand density and basal area was used for checking the quality of the data. Procedures for data quality checking were done following the procedures as described in Krisnawati et al (2014) and also applied in Chapter 2 of this Annex.
3.5 OUTPUTS AND UNCERTAINTY ANALYSIS
In terms of growth rate, the annual change in biomass carbon stocks can be estimated using the gain–loss method, which combines the annual increase in carbon stocks due to biomass growth with losses due to turnover and management events. Gain of biomass used in INCAS is characterized as plantation growth or natural growth. Plantation growth is defined as the growth of plants that are deliberately planted. Natural growth is defined as growth that occurs as a result of natural process of succession after disturbances in natural forests, e.g. fire, logging.
Assumptions, data sources and results of the analysis that generated growth curves and increment tables for each species of timber plantation and each natural forest type are documented in the INCAS Growth Database (see the description of the database in Appendix 1). This includes:
• Plantation growth
▪ Agathis (Agathis sp.)
▪ Akasia (Acacia sp.)
▪ Balsa (Ochroma bicholor)
▪ Jabon (Anthocephalus cadamba)
▪ Jati (Tectona grandis)
▪ Mahoni (Swietenia sp.)
▪ Pinus (Pinus sp.)
▪ Rasamala (Altingia excelsa)
▪ Sengon (Albizia falcataria)
▪ Sonokeling (Dalbergia latifolia)
▪ Kemiri (Aleurites moluccana)
▪ Environmental plantation (mix of species)
20 | Standard Methods for Estimating Greenhouse Gas Emissions from Forests and Peatlands in Indonesia (Version 2)
• Natural growth
▪ After burning
▪ After logging
INCAS assumes there is no net growth in primary forests, for which the biomass stocks are assumed to be at equilibrium prior to human induced disturbances (i.e. growth is equivalent to turnover and decomposition). In natural forests that have been disturbed and then left without any disturbance for a long time, natural growth may compensate for biomass loss due to the previous disturbance; they may eventually attain the same biomass stock as the initial condition of forests, even though they may have different forest structure and species composition.
Quality control procedures were used to select the best available data for inclusion in the analysis. Statistical analysis was then conducted for a selection of models to derive growth curves for plantations and natural forests following disturbance. An example of the outputs from growth analysis for secondary swamp forest after burning is presented below (Figure 3-3).
Figure 3-3. The example of outputs from growth analysis for secondary swamp forest after burning.
Standard Methods for Estimating Greenhouse Gas Emissions from Forests and Peatlands in Indonesia (Version 2) | 21
3.6 LIMITATIONS
Some limitations identified in this standard method are described below:
• Some plantation species and some conditions of natural forests have no permanent sample plots with long/periodical measurements for describing the long-term impact of management/events on growth.
• The same growth curves have been applied to all rotations in timber plantations and for each natural forest biomass class because the current approach does not differentiate between site conditions or finer scale management. Initial attempts to derive biomass classes based on site biophysical characteristics did not result in sufficiently robust relationships. This should be re-tried once more data is available.
• Turnover and debris decay rates were not available for Indonesia, hence default turnover and decay rates were adopted from tropical rain forest in Australia as an interim measure, because these forests are expected to have similar turnover and decay characteristics and detailed data is readily available.
3.7 IMPROVEMENT PLAN
Plans for improvement are outlined below:
• Data about plantation and natural forest growth could be improved by gaining access to additional existing data sets and through targeted research designed to fill knowledge gaps.
• Timber plantation growth curves could be improved by including more information about site biophysical characteristics and the impact of plantation management practices on growth, particularly site nutrition and water table management on peatlands.
• Secondary natural forest growth curves could be improved by including more information about site biophysical characteristics and the impact of management practices on subsequent growth.
• Research into turnover and decay rates in Indonesia should be undertaken to better understand the rate of turnover and decomposition under different natural forest and plantation conditions.
22 | Standard Methods for Estimating Greenhouse Gas Emissions from Forests and Peatlands in Indonesia (Version 2)
4.1 PURPOSE
This standard method describes the process used by INCAS for defining the forest management events and regimes that may occur and need to be modelled for all biomass classes to quantify GHG emissions and removals from activities occurring on forest lands including deforestation, forest degradation, sustainable management of forests and enhancement of forest carbon stocks in Indonesia. This includes data collation, data analysis, quality control and quality assurance.
For this purpose, an event-driven model (as described in Chapter 8, Standard Method – Data Integration and Reporting) is used for tracking the changes in stocks of carbon and GHG emissions associated with land use and management events. In addition, it accounts for changes in major GHGs and human-induced land-use practices. The sub-models used within the model can be integrated into various combinations to suit the available data and the required outputs. It may be used for tracking of carbon stocks and flows in different forest systems.
There are many forest management events and regimes that can occur in Indonesia. The type and condition of forest and other land uses, as well as the type of events and regimes of management activities undertaken, need to be defined to enable detailed modelling of GHG emissions and removals.
A forest management event, as defined in this standard method, represents a particular forest management action that occurs occasionally or regularly and is usually human-induced. A forest management regime describes the combination of forest management practices or events applied to a particular land use and the timing of events that occur at a location.
The purpose of this standard method is to describe the methods used in defining forest management events and regimes that will be used as inputs in the modelling and reporting of GHG emissions under INCAS framework.
STANDARD METHOD –FOREST MANAGEMENT EVENTS AND REGIMES
Standard Methods for Estimating Greenhouse Gas Emissions from Forests and Peatlands in Indonesia (Version 2) | 23
4.2 DATA COLLATION
Several sources of data and information collated from various government agencies and organizations in Indonesia were used for analysis. Spatial data were obtained from the Ministry of Environment and Forestry, Ministry of Agriculture and National Institute of Aeronautics and Space (LAPAN). In addition, some relevant data and information were collated from the regional forestry offices within the Ministry of Environment and Forestry. These included the agencies responsible for monitoring production forest utilization, watershed management, strengthening forest area and natural resource conservation as well as national parks. Information was also collated from the representatives of forest concessionaires (logging companies).
In determining the possible events and management regimes, discussions and consultations were conducted with relevant forestry stakeholders and national experts. Prior to discussions, the possible management events and regimes that may be applied in Indonesian forests were identified based on existing knowledge and experience in the field. The discussions and consultations were carried out to verify the interim analysis, identify the available data and obtain more detailed data and associated information relating to forest disturbances and management types that may affect forest biomass loss and gain.
Four main management events that lead to forest change were identified: land clearing, harvesting, burning and planting events.
a. Land clearing was defined as the conversion of forest area of either primary or secondary forests into other land uses (e.g. settlement, mining, agriculture, etc.) and the conversion of natural forest into timber plantations. This event removes all of aboveground biomass from the site and moves some live biomass to debris pools.
b. Harvesting events included both legal harvesting and illegal harvesting. A harvesting event was considered as legal if the activity was applied in managed/production forests (forest concession areas) with a harvesting permit. Several harvesting techniques that may have effects on biomass loss were identified, including clear-cutting, selective harvesting with a conventional technique and selective harvesting with reduced impact logging (RIL). Harvesting activity that occurred in forests other than production forests (e.g. protection forest, conservation area, national park) was considered as illegal harvesting. This event removes some or all of aboveground biomass from the site and moves some live biomass to the debris pools.
c. Burning (forest fire) event was categorized into moderate and heavy (intense) fires. The event releases carbon (as CO2, CO and CH4) and nitrogen (N2O and NOx) to the atmosphere and moves some carbon to the debris and soil pools.
d. Planting activity included reforestation, rehabilitation and enrichment planting programs. It creates new forests on areas not containing forest that enhance its biomass stock.
24 | Standard Methods for Estimating Greenhouse Gas Emissions from Forests and Peatlands in Indonesia (Version 2)
All of these events were identified during the period of time covered in the analysis or modeling period. The spatial data used for analysis in this standard method are summarized in Table 4-1.
Table 4-1. Sources of data used in determining forest management events and regimes.
Data Description Source
Forest extent and change
Annual forest/non-forest data derived from Landsat data and the clearing and regrowth events derived by differencing the annual forest extents
LAPAN
Forest type (part of land-cover map)
Primary and secondary dryland forest; primary and secondary swamp forest; primary and secondary mangrove forest; and timber plantations (and all other land cover classes)
MoEF
Forest functionProduction forest (production, limited production and conversion); Conservation and protection forest
MoEF
Soil type Organic (peat) and mineral soil types MoA; IPCC
Estate crops Oil palm and rubber MoEF
Forest concessionsArea and operational year of forestry concessions including harvesting system applied (RIL or conventional)
MoEF
Burnt area Burn scar analysis INCAS (MoEF)
4.3 ANALYSIS
The collated data was reviewed as part of the INCAS quality control process to assess its quality and utility for modelling GHG emissions and removals. Unique combinations of biophysical conditions, management function and forest management activities were identified and used to establish INCAS suites. A suite represents a specific combination of site and management categories including initial forest type, forest function, soil type, harvesting system, estate crop, fire, forest/non-forest transition, subsequent land category, activity and management events. The conditions (associated with each category) that were used as a basis for determining suites and management regimes are shown in Table 4-2.
Standard Methods for Estimating Greenhouse Gas Emissions from Forests and Peatlands in Indonesia (Version 2) | 25
Table 4-2. Possible conditions in each category used for defining management regimes or suites.
DeforestationDegradationSustainable management of forest (SMF)Reforestation (Enhancement of forest carbon stocks)
9. Subsequent land category
Other land usesForest landCroplandTimber plantation
10. Event 1
High intensity fireModerate fireLand clearing Illegal clear harvestingConventional selective harvestingRIL selective harvestingPlant fast growing dryland speciesPlant mangrove speciesPlant fast growing swamp speciesPlant dryland speciesPlant swamp forest species
26 | Standard Methods for Estimating Greenhouse Gas Emissions from Forests and Peatlands in Indonesia (Version 2)
The description of the suites covering management regimes and events was documented in the INCAS Suite Regime Database (see the description in Appendix 1). The final number of suites recorded after performing quality control and validation by reviewing and checking the activities was 1,152 suites. INCAS is capable of modelling many more management regimes but this requires increasingly detailed spatial and management information.
To determine forest management events and regimes, analyses were undertaken which included two main procedural steps:
1. All forest land areas were allocated to a management regime based on suite characteristics, starting in the first year of the simulation period and repeated for each year during the simulation period (i.e. 2001 to 2012).
2. Areas subject to observed change (i.e. change detected from the LAPAN forest cover change analysis) were reassigned to other regimes based on the location, timing, type of change (i.e. forest loss or forest gain) and the suite characteristics.
Management regimes were then associated with REDD+ activities (i.e. deforestation, forest degradation, sustainable management of forest and enhancement of forest carbon stocks) based on the following rules for each activity:
• Deforestation occurs when forest cover loss is observed within primary and secondary forest land cover classes and no forest cover gain is observed at the same pixel (area) in subsequent years during the simulation period (i.e. the land stays as non-forest). This represents ‘permanent loss’ of forest land.
• Forest degradation occurs when forest land cover class changed from primary forest to secondary forest, or natural forests changed to plantations but no forest cover loss was observed. Forest degradation also occurs when forest cover loss was detected in primary or secondary forest and then forest cover gain was observed at the same pixel (area) in the subsequent years during the simulation period. It can also occur where forest cover loss was not detected within primary or secondary forest land cover classes but concession data indicate harvesting with conventional selective logging technique occurring. It also occurs when forest cover loss was not detected within primary or secondary forest land cover classes but fire data indicates that burning occurred.
• Sustainable management of forest (SMF) occurs when forest cover loss was not detected within primary or secondary forest land cover classes but concession data indicate harvesting with RIL technique occurring. This can include ‘temporarily unstocked’ forest land that may regrow back to the initial forest conditions.
• Enhancement of forest carbon stocks occurs when plantation forest land cover class is observed where it did not occur in the previous year or where revegetation or forest cover gain was observed in non-forest land.
Standard Methods for Estimating Greenhouse Gas Emissions from Forests and Peatlands in Indonesia (Version 2) | 27
The impact of each management event on carbon stocks was quantified based on research and measurement data where available, or by management prescription and expert judgment where data were not available. Parameters for each management event are provided in the INCAS Events Database (the description is available in Appendix 1).
4.4 QUALITY CONTROL AND QUALITY ASSURANCE
Quality control and quality assurance processes were conducted as follows:
Quality control – Data checking and validation were conducted by the INCAS team for all data collated. This was done to ensure that data used for analysis was suitable for use and consistent with other data sets.
Quality assurance – The following quality assurance steps were undertaken by members of the INCAS team not involved in data analysis and by external advisors:
• review the methodology used to ensure no errors were introduced when combining data to produce management regimes and events;
• check and validate the suite and management regime results to ensure consistency and desired accuracy;
• review the final outputs to check that results are verifiable and comparable.
4.5 OUTPUTS
Outputs from this standard method were recorded in the INCAS Suite Regime database. A summary describing the types of regimes, events and suite characteristics are presented in Table 4-3 to Table 4-4, respectively.
28 | Standard Methods for Estimating Greenhouse Gas Emissions from Forests and Peatlands in Indonesia (Version 2)
Table 4-3. Summary of regime description.
No. Regime description
1 Conversion of primary dryland forest to other land uses (settlement, mining, etc.)
2 Conversion of primary dryland forest to agriculture
3 Conversion of secondary dryland forest to agriculture
4 Conversion of secondary dryland forest to other land uses (settlement, mining, etc.)
5 Conversion of secondary dryland forest to timber plantation
6 Conversion of primary mangrove forest to other land uses (ponds, etc.)
7 Conversion of secondary mangrove forest to other land uses (ponds, etc.)
8 Conversion of primary swamp forest to agriculture
9 Conversion of primary swamp forest to other land uses (settlement, mining, etc.)
10 Conversion of secondary swamp forest to agriculture
11 Conversion of secondary swamp forest to other land uses (settlement, mining, etc.)
12 Conversion of secondary swamp forest to timber plantation
13 Forest disturbance (fire) followed by natural regrowth
14 Forest disturbance (illegal logging) followed by natural regrowth
15 Forest management in dryland forest
16 Forest management in swamp forest
17 Planting
18 Rehabilitation/environmental planting
19 Timber plantation management
Standard Methods for Estimating Greenhouse Gas Emissions from Forests and Peatlands in Indonesia (Version 2) | 29
Table 4-4. Summary of event description.
No. Event description
1 Clear harvest Illegal
2 Dryland forest selective harvest_conventional
3 Dryland forest selective harvest_RIL
4 High intensity fire
5 Land clearing
6 Moderate fire
7 Plant dryland species
8 Plant fast growing dryland species
9 Plant fast growing swamp species
10 Plant mangrove species
11 Plant oil palm
12 Plant rubber
13 Plant swamp species
4.6 LIMITATIONS
Some identified limitations of this standard method are:
1. The analysis of management events and regimes was only conducted on forest lands (primary dryland forest, primary mangrove forest, primary swamp forest, secondary dryland forest, secondary mangrove forest, secondary swamp forest and timber plantation). Other non-forest lands may have management events and regimes that should be considered as a part of the continuous improvement plan.
2. Forest functions (consisting of production forest, limited production forest, convertible production forest, conservation forest and protection forest) were only categorized into two main functions in this standard method, i.e. production forest and conservation/protection forest. Obtaining further detail about management practices for the full range of forest functions could improve the accuracy of GHG emissions estimates.
3. Due to insufficient detail about the spatial location of silvicultural systems, it was assumed that the whole area of managed forest in each concession was managed as either conventional harvesting or RIL. In reality, management of forest concessions may use a combination of both silvicultural systems.
30 | Standard Methods for Estimating Greenhouse Gas Emissions from Forests and Peatlands in Indonesia (Version 2)
4. The condition of timber plantations in the area detected as timber plantations was analyzed without considering the real plantation ages due to a lack of data about plantation age classes. This affected the spatial allocation of timber plantation management regimes, particularly for plantations that existed at the start of the simulation period, for which a normal age class distribution was assumed. This will influence the timing of GHG removals and harvesting emissions.
5. Changes to silvicultural systems over time were not included. For example, silvicultural systems used prior to the start of the simulation period were not included. These activities may result in different forest conditions and the quantity of biomass and debris present on the site compared to the modelled management regimes. This will influence GHG removals through growth and emissions through decay of debris during the simulation period.
4.7 IMPROVEMENT PLAN
Further information about forest management regimes and their influence on biomass and debris, and carbon stocks should be obtained and analyzed to improve GHG emissions and removals estimates. This may require further research into the impact of forest management events and regimes on residual carbon stocks.
Standard Methods for Estimating Greenhouse Gas Emissions from Forests and Peatlands in Indonesia (Version 2) | 31
5.1 PURPOSE
This standard method describes the process used by INCAS remote sensing program, known as the Land Cover Change Analysis (LCCA) program, to monitor changes in forest cover in Indonesia. The LCCA is designed to provide a wall-to-wall, spatially detailed monitoring of Indonesia’s forest changes over time. The objective of the LCCA is to produce annual maps of national forest extent and change from Landsat imagery time series. The initial objective of the LCCA is to produce maps of the annual forest extent and changes for the 13-year period from 2000 to 2012, to provide inputs for carbon accounting. The system has been built based on regional analyses, i.e. Kalimantan, Sumatra, Papua, Sulawesi, Java, Nusa Tenggara and Maluku Islands, using a nationally consistent methodology.
Sources of data and methods used for analysis and generating annual forest extent and changes in Indonesia under the LCCA program are described in LAPAN (2014) The Remote Sensing Monitoring Program of Indonesia’s National Carbon Accounting System: Methodology and Products, Version 1. The following is a short summary.
5.2 DATA COLLATION
It was important to gain access to data from multiple international archives covering Indonesia. The policy requirements for national coverage, sub-hectare spatial resolution and historical and current time periods meant that Landsat was the only feasible data for the operational program. Landsat imagery was sourced from the GISTDA (Thailand), GeoScience Australia, USGS and LAPAN (Indonesia) archives.
Landsat imagery of LS-5 and LS-7 was chosen as the only feasible data source to provide monitoring information for the implementation of LCCA. LS-5 is the preferred source for most of the period due to a technical problem with the scan line corrector (‘SLC-off’) that affected LS-7 from mid-2003. Both instruments have collected regular repeat coverage every 16 days over the period, but not all overpasses were received and archived.
STANDARD METHOD –FOREST COVER CHANGE
32 | Standard Methods for Estimating Greenhouse Gas Emissions from Forests and Peatlands in Indonesia (Version 2)
The most complete archive of LS-5 imagery for western Indonesia for the period was held at Thailand’s GISTDA receiving station; Australia’s archive, held at Geoscience Australia (GA) covers far eastern Indonesia (Papua to eastern Nusa Tenggara) with LS-5 and LS-7 imagery. LAPAN’s receiving station at Parepare covers all of Indonesia, except for the very western tip of Sumatra, but only limited scenes had been archived. The main source of data for the central region was the USGS archive, which was far from complete for LS-5 as it consists of a sample of scenes selected for on-board storage and downloaded in the USA. GA coordinated the image acquisition of Landsat imagery from these international data agencies. All selected data was delivered to Indonesia for processing within the LCCA program.
Samples derived from high-resolution satellite imagery (e.g. GeoEye, Ikonos, Quickbird and WorldView2) were used as references to accurately interpret the land cover classes. Such image resolution was able to estimate tree density and tree height from shadow.
5.3 ANALYSIS
The general processing steps to produce annual forest extent and change maps are summarized in Figure 5-1.
Figure 5-1. Flowchart of the steps in INCAS-LCCA processing sequence (LAPAN, 2014).
Radiometric correction
Ortho rectification
Scene selection
Quality Assurance
Cloud masking
Mosaicing
Create forest base probability image
'Match' other years to the base
Multi-temporal processing to monitor change
Review of products
ImagePreparation
Forestextent
and changemapping
Standard Methods for Estimating Greenhouse Gas Emissions from Forests and Peatlands in Indonesia (Version 2) | 33
The major steps in the Landsat image preprocessing and subsequent forest extent mapping are described below. All stages of image processing must pass documented quality assurance checks.
Cloud cover is a major limitation to the use of optical imagery over much of Indonesia. A time series of annual Landsat mosaics with minimal cloud-affected area was created for each area from multiple scenes prior to classification. Browse images from all archives were assembled and images with minimal cloud cover were selected. For each year and path/row up to five images (typically 2–3) were acquired to provide increased cloud-free land area.
Sample high-resolution imagery was used to provide ground-truthing for the forest extent mapping from Landsat and experts from regional forestry offices provided interpretation of land cover in the forest extent mapping stages.
All satellite images were ortho-rectified to a common spatial reference (USGS GLS 2000) that was available from USGS or processed locally for images from Thailand and Australian sources and calibrated with a procedure that incorporates radiometric corrections. Terrain illumination corrections were then applied using the Shuttle Radar Topography Mission (SRTM) DEM and the C-correction method. Cloud masking using a semi-automated approach developed in the program was then applied to remove cloud and haze prior to combining individual images from each year into regional mosaics. Typically, even using multiple images, each mosaic contained areas of missing data due to persistent cloud.
Forest extent mapping for each region was carried out by classifying a chosen ‘base’ year Landsat mosaic. For training and validation, experts with local knowledge of land cover and forest types played an active role in base classification. Samples of high-resolution satellite imagery were used in stratification and analysis and in optimizing a classifier based on locally optimal indices and thresholds. The result was a base map of forest-non-forest probabilities for the chosen base year. Automated matching was then applied to all other years to produce a time series of annual forest probabilities.
The capacity to produce change maps that are accurate and consistent through the time series is critical; post-classification differencing of hard labels from individual dates is not appropriate, as it would result in unacceptable errors. A multi-temporal probabilistic framework was applied to the time series to produce the final series of classifications of forest/non-forest over the period from which change areas could be identified. As well as the time series of input forest probabilities, estimates of classification accuracies and temporal transition probabilities were required. This approach could use all of the available data to handle uncertainties in the inputs and to predict missing observations in particular years. The effect was to minimise errors arising from individual year classifications and to provide temporally consistent change information. In addition, cover was predicted in cloud-affected areas from surrounding years.
34 | Standard Methods for Estimating Greenhouse Gas Emissions from Forests and Peatlands in Indonesia (Version 2)
Finally, a process of manual inspection was applied to the cover and change products, again with the participation of local experts. This process removed errors arising from spectral overlap and labelled particular classes for the purposes of providing inputs to carbon accounting.
5.4 QUALITY CONTROL AND QUALITY ASSURANCE
As described in Figure 5-1, after each step in the image processing, the quality assurance process was conducted to check that the method has been correctly applied and the results met the required accuracy standards. If an image did not meet the standards for the step, the cause was investigated and the image was reprocessed to correct the problem and checked again. The next step was not taken until the current step had been successfully completed. The quality assurance checks also ensured consistency between data processed by different operators and at different times during the activities.
5.5 OUTPUTS AND UNCERTAINTY ANALYSIS
The key outputs produced is the forest extent maps for each year (2000, 2001, 2002, 2003,…). The products were produced in both local NUTM projection and geodetic projection. The titles in the geodetic projection were mosaiced into whole island regions. The resolution of all LCCA products in NUTM was 25 m, in geodetic it was 0.000025 degrees. An example of the products is presented in Figure 5-2 that shows the forest extent for Indonesia in 2009 and for Kalimantan as a regional example.
Standard Methods for Estimating Greenhouse Gas Emissions from Forests and Peatlands in Indonesia (Version 2) | 35
Figure 5-2. Example of the products of forest extent (in 2009) at national, regional and local scale. The local scale includes comparison with Landsat and high-resolution imagery (LAPAN, 2014).
The capacity to produce change maps that are accurate and consistent through the time series is critical. INCAS applies a multi-temporal probabilistic framework to the time series to produce a final series of classifications of forest/non-forest over the period from which change areas can be identified. As well as the time series of input forest probabilities, estimates of classification accuracies and temporal transition probabilities can be produced. The approach can use all of the available data to handle uncertainties in the inputs and to predict missing observations in particular years. The effect is to minimise errors arising from individual year classifications and to provide temporally consistent change information. In addition, cover can be predicted in cloud-affected areas from surrounding years.
36 | Standard Methods for Estimating Greenhouse Gas Emissions from Forests and Peatlands in Indonesia (Version 2)
5.6 LIMITATIONS
The initial objective of the LCCA is to produce maps of the annual forest extent and changes from 2000 to 2012. Integration of the LCCA analysis and the other spatial analyses used by INCAS was needed to improve the efficiency of both processes.
5.7 IMPROVEMENT PLAN
Satellite reception and archiving capacities in Indonesia have increased during the period of INCAS development; it is anticipated that the program will continue with the use of Landsat 8 and possibly other optical data streams. It would be valuable to extend the historic monitoring to include the period 1990 to 1999 using Landsat imagery and the current processing methods. The 1990s were years of major policy-driven land-use change in some provinces and consistent information on historic changes from this period is of wide interest. There is also a need for greater integration of the LCCA analysis and the other spatial analyses used by INCAS to improve efficiency of both processes.
Standard Methods for Estimating Greenhouse Gas Emissions from Forests and Peatlands in Indonesia (Version 2) | 37
6.1 PURPOSE
This standard method describes the process used by INCAS for defining the areas used for each management regime in modeling GHG emissions and removals from activities occurring on forest lands (including natural forests, timber plantations and selected estate crops (oil palm and rubber) on former forest land). This includes data collation, data analysis, quality control and quality assurance.
There are many factors that are critical in determining variations in emissions from different activities in Indonesia. The type and condition of forest and other land on which activities occur, as well as the type of management activities undertaken, need to be spatially identified to enable detailed modeling of GHG emissions and removals.
The best available spatial data that could inform the areas in which each activity could potentially occur was identified and sourced (see Table 6-1). These spatial data sets were created for a range of non-MRV GHG emissions related reasons. Consequently, the spatial and temporal quality was variable. This led to inconsistencies between data sets, which in turn necessitated decisions about how each data set was to be used for the purpose of carbon accounting.
The purpose of this standard method is to describe how the available spatial data can be used to consistently allocate management regimes to areas and to derive annual area statistics for use in INCAS modeling.
6.2 DATA COLLATION
Data were collated from national and provincial level government agencies and organizations involved in land management.
Spatial forest cover and forest cover change data was developed by LAPAN as part of the INCAS program.
STANDARD METHOD –SPATIAL ALLOCATION OF REGIMES
38 | Standard Methods for Estimating Greenhouse Gas Emissions from Forests and Peatlands in Indonesia (Version 2)
Spatial data
Spatial data sets used to inform the possible areas in which activities can occur are shown in Table 6-1. These data are used to create a series of ‘suites’, which describe the conditions under which a land management regime can occur. By using biophysical and management data in the identification of individual suites, it is possible to allocate areas of land use and land-use change to model the impact on GHG emissions and removals.
Table 6-1. Source of spatial data.
Data Description Source
Land cover class
Primary or secondary dryland forest, swamp forest or mangrove forest, timber plantations (and all other land cover classes)
MoEF
Forest extent and change
Annual forest /non-forest data derived from Landsat data and the forest loss and forest gain events derived by differencing the annual forest extents
National Institute of Aeronautics and Space (LAPAN)
Burnt area Annual area burnt INCAS (MoEF)
Soil type Organic (peat) MoA
Soil IPCC class Mineral soil IPCC class Digital soil map of the world (FAOI)
Forest function Production, protection, or conservation forest MoEF
Forest utilization Area of forest concessions MoEF
Estate crops Area of oil palm, rubber and other commodities of plantations MoEF
The method used to derive forest extent and change data is described in Chapter 5 (Standard Method – Forest Cover Change).
A spatial layer showing the geographic extent of each suite was created for each simulation year (i.e. annually from 2001 to 2012) using the data in Table 6-1. Each suite was allocated a unique identifier (suite code) which links the spatial data to the management regimes produced as an output of the Standard Method – Forest Management Events and Regimes (Chapter 4).
The suite code is a common attribute for all areas that will constitute the area of each regime in each year. The area of each suite will vary over time as forests transition from primary to secondary forest to non-forest conditions.
Standard Methods for Estimating Greenhouse Gas Emissions from Forests and Peatlands in Indonesia (Version 2) | 39
Management regimes
Management regimes describe the type and combination of management events applied to a particular land use and the timing of events.
Once assigned to a management regime, an area continues to be managed according to that regime, in perpetuity, until a subsequent event is observed that causes a change in the management regime.
Suites for forest and cropland assessed in this standard method were produced using the Standard Method – Forest Management Events and Regimes (Chapter 4). Management regimes for quantifying peat emissions are described in the Standard Method – Peatland GHG Emissions (Chapter 7).
All data described in this standard method were collated from existing sources held by Government of Indonesia agencies and other organizations, with the exception of the burnt area and mineral soil map from IPCC. The burnt area data was produced by the INCAS team using the approach developed by Ballhorn et al. (2014) for Central Kalimantan province.
6.3 ANALYSIS
The objective of the analysis was to calculate the area of land managed according to each management regime for every year of the simulation period. These areas form part of the inputs for the GHG emissions and removals estimation models described in the Standard Method – Data Integration and Reporting (Chapter 8).
Areas were allocated to a management regime based on suite characteristics and repeated for each year of the simulation period (i.e. 2001 to 2012). Areas subject to observed change (i.e. change detected from the LAPAN forest cover change analysis) were assigned to regimes based on the location, timing and direction of change in conjunction with the other suite characteristics.
For an area to be allocated to a forest management regime it must meet the minimum forest area definition for Indonesia of 0.25 ha (according to the Forestry Ministerial Decree No. P.14/2004). As the analysis was completed on the change (activity) data, as opposed to forest extent, the area threshold was applied to the aggregate of all years of change. This allows for accounting of annual change of areas less than 0.25 ha, while ensuring that the cleared land meets the definition of forest.
All spatial data that was related to the location and extent of a regime in the carbon account was collated, converted to shape files and projected to a consistent coordination system.
40 | Standard Methods for Estimating Greenhouse Gas Emissions from Forests and Peatlands in Indonesia (Version 2)
Each activity reported by INCAS was modelled as a separate estate – i.e. a file with the area and timing of each regime assigned by this standard method. REDD+ activities modeled in INCAS were deforestation, forest degradation, enhancement of forest carbon stocks and sustainable management of forest.
The criteria used to define each activity are presented in Table 4-5 of the Standard Method – Forest Management Events and Regimes (Chapter 4). Each regime can be determined from the unique combinations of these spatial data values and the area provided for modelling directly from the GIS outputs.
While there are a total of 1,152 different regimes requiring different areas, the deforestation and reforestation activities were identifiable directly from combinations of the source data. However, some additional processing was required to deliver appropriate areas to model SMF and forest degradation.
Sustainable management of forest (SMF): This REDD+ activity fits within the forest land remaining forest land category of UNFCCC. It occurs when forest cover loss is not observed within primary or secondary forest as shown on the land-cover map, but forest concession data indicated that a harvesting event has occurred using RIL technique. It assumes that in the SMF there will be regrowth back to initial forest conditions.
The annual forest change data is only relevant to forest management activities that result in a discernible change in the forest canopy (i.e. harvesting does not result in removal of enough trees to reduce the forest canopy to below the 30% threshold that defines a forest).
The process to allocate area to these activities relied on forest type, forest function, concession boundaries, the absence of forest change and the proportion of forest available for harvesting, as follows.
• If the forest type was mapped as dryland forest, the usual SMF practice was assumed to be to harvest 40.6% of the forests over a 30-year period. This was calculated by assuming the effective area harvested in each concession area was 70%, corrected by average annual actual timber production of 0.58.
• If the forest type was mapped as swamp forest, the usual SMF practice was assumed to be to harvest 52.2% of the forests over a 40-year period. This was calculated by assuming the effective area harvested in each concession area was 90%, corrected by average annual actual timber production of 0.58.
Forest degradation: The determination of areas to assign to forest degradation activities required the creation of unique combinations of all the forest change data.
The year of forest loss and the year of forest gain were determined for each polygon. Polygons that recorded both loss and gain were subjected to a statistical analysis.
Standard Methods for Estimating Greenhouse Gas Emissions from Forests and Peatlands in Indonesia (Version 2) | 41
If the intervening non-forest period was 3 or more years, this met the criteria of temporarily unstocked, which resulted in the polygon being assigned to a forest degradation event.
This analysis was conducted for areas of forest that were cleared and subsequently regrown and allocated to the year in which the forest was lost. (‘clearreveg’)
Conversely, polygons of multiple changes where the first event was a forest gain were identified as a degradation event beginning in the year of first forest gain. (‘revegclear’). The assumption was that the land was temporarily unstocked prior to the availability of the first year of forest extent data (2000).
Forest degradation was when:
• there was a change from primary to secondary forest on the land-cover map;
• there was a change from either primary or secondary forest to timber plantation on the land-cover map;
• forest cover loss was not observed within secondary forest as shown on the land-cover map, but forest concession data indicated that a harvesting event had occurred using the conventional technique.
6.4 QUALITY CONTROL AND QUALITY ASSURANCE
All data are assumed to be correct from the data supplier.
All data were spatially complete for all of Indonesia (province by province).
All data were combined into a single polygon data set for each year.
The resultant GIS table was then exported to Excel and each regime assigned based on the selection of the relevant attributes of each input data set.
All records that had an area less than 0.25 ha were deleted. These small polygons were visually inspected and determined to be the result of unintentional overlapping areas of differently derived spatial data. Thus, the filtering of thousands of rows of the database was used as a proxy for cleaning the input data to ensure that each combination of land-use activity and function was logical.
The other main logic filter that was undertaken as part of the statistical analysis (as a proxy for a rigorous spatial analysis filter) was to ensure that all clearing and revegetation events were separated by a length of time determined to be suitable by the description of the defined regimes.
The analysis relied on a strong understanding of statistics, spatial analysis, vegetation dynamics, forest management practices and the impact of a time series of events on the resultant carbon account.
42 | Standard Methods for Estimating Greenhouse Gas Emissions from Forests and Peatlands in Indonesia (Version 2)
6.5 OUTPUTS
Outputs from this standard method are expressed in hectares, by regime, by year and documented in INCAS Regime Area Database (see the description in Appendix 1).
A Unique Feature Identifier (FID) from the GIS data was maintained throughout this process so that the newly calculated “suite” field for each year could be joined back to the spatial data.
The QA/QC processes and decision rules around minimum areas would have the effect of reducing uncertainty of the areas where each of the input data sources is assigned to the same area of land. In the uncertainty analysis, area was varied by +/-10%.
6.6 LIMITATIONS
Due to the known confusion between forest and estate crop species in the remotely sensed regrowth data, there are likely to be some areas of forest loss and gain that contain errors.
Spatial analysis tools were not fully developed when this analysis was undertaken, which resulted in a large amount of data being processed using manual processes. The efficiency of this process should be improved to reduce potential for errors and to reduce processing time, particularly for spatial allocation of regimes across all of Indonesia.
6.7 IMPROVEMENT PLAN
All input data can be characterized as the best available.
For the continuous improvement plan, it is recommended that each of the data sets supplied for this analysis is subjected to more rigorous preprocessing and standardization.
As new versions and updates to each of the input data sets are created, the modelling team will need to have access, permission and resources to repeat this methodology to update the areas for subsequent modelling of emissions and removals.
The improvement plan associated with the generation of the modelling and reporting requirements will also lead to a repetition of this spatial allocation to match any new suites.
Activities relying on the detection of conversion from non-forest to forest land (afforestation, reforestation and revegetation) could not be determined using satellite data without additional interpretation of the outputs. For example, palm trees meet the crown cover, height and area parameters given in the national definition of “forest”, but the policy parameters require these to be identified as estate crop species.
Standard Methods for Estimating Greenhouse Gas Emissions from Forests and Peatlands in Indonesia (Version 2) | 43
The detailed spatial analysis of forest cover change from LAPAN combined with spatial data about forest types and management practices have greatly improved the identification of forest change events. This can be further improved by greater collaboration between forest cover mapping and spatial analysis processes. Development of a spatial analysis tool would improve the efficiency of the spatial allocation of regimes described in this standard method.
Results would be enhanced through a more detailed understanding of land management events prior to 2000, as this influences the estimation of forest biomass and the degree of peat degradation modelled during the period 2001 to 2012. This could be achieved by extending the annual forest cover change analysis back to 1990 and extracting more detailed information from historical land management records.
44 | Standard Methods for Estimating Greenhouse Gas Emissions from Forests and Peatlands in Indonesia (Version 2)
7.1 PURPOSE
This standard method describes the process used by INCAS for modelling GHG emissions from peatland in Indonesia. This includes data collation, data analysis, quality control, quality assurance, modelling and reporting.
For this standard method, peatland is defined as land with organic soils. This represents areas with an accumulation of partly decomposed organic matter, with ash content equal to or less than 35%, peat depth equal to or more than 50 cm and organic carbon content (by weight) of at least 12% (Wahyunto et al., 2004; Agus et al., 2011).
Peatland GHG emissions are estimated annually for the following sources and gases:
• biological oxidation of drained peat: CO2-C, CO2-e
• peat fire:3 CO2-C, CO2, CO, CH4
• direct emissions from drained organic soils: N2O, CH4
Outputs from this standard method can be expressed as tonnes for each GHG or expressed in tonnes CO2-equivalent GHG emissions. Time periods for reporting can be specified to meet reporting requirements.
7.2 DATA COLLATION
Spatial data used in this method are summarized in Table 7-1. Spatial data collation methods are described in the Standard Method – Spatial Allocation of Regimes (Chapter 6).
3 Note: Fire emission factors for N2O and NOx are not provided by IPCC at Tier 1 due to limited data for N2O and NOx emissions from organic soil fires.
STANDARD METHOD –PEATLAND GHG EMISSIONS
Standard Methods for Estimating Greenhouse Gas Emissions from Forests and Peatlands in Indonesia (Version 2) | 45
Table 7-1. Source of spatial data used.
Data Description Source
Land-cover typePrimary or secondary dryland forest, swamp forest or mangrove forest, timber plantations, estate crops, paddy field (and all other land cover classes).
MoEF
Soil type Organic (peat) and mineral soil types MoA; IPCC
Estate crops Oil palm MoEF
Burnt area Annual area burnt (spatial) INCAS (MoEF)
Forest extent and change
Annual forest/non-forest data derived from Landsat data and the forest loss and forest gain events derived by differencing the annual forest extents.
LAPAN
Input data for estimating GHG emissions from peat decomposition are shown in Table 7-2.
Table 7-2. Source of modelling input data.
Data Description Source
Emission factors Peat biological emission factors and peat fire emission factors.
IPCC (2013); Hooijer et al. (2014)
Tier 1 default emission factors
Fire emissions (CO2-C, CO and CH4), direct nitrous oxide emissions from drained organic soil, CH4 emissions from drained organic soil.
IPCC (2013)
Drained peatland area
Annual area of drained peatland by land cover condition.
INCAS Standard Method – Spatial Allocation of Regimes
Burnt area Annual area of peatland burnt in Indonesia 2001 to 2012. INCAS
Two sets of emissions factors were used for quantifying emissions of CO2, DOC and CH4 for the national GHG inventory as shown in Table 7-3.
46 | Standard Methods for Estimating Greenhouse Gas Emissions from Forests and Peatlands in Indonesia (Version 2)
Table 7-3. Emission factors for biological oxidation of peat in Indonesia.
IPCC land-use category CO2-C EF4 (t C ha-1 yr-1)
DOC EF5 (t C ha-1 yr-1)
CH4 EF (kg CH4 ha-1 yr-1)
Forest land and cleared forest land (shrubland), drained 5.3 0.82 4.9
Plantations, drained, oil palm6
Plantations, drained, unknown or long rotationsPlantations, drained, short rotations, e.g. acacia
11.015.0 20.0
0.820.82 0.82
0.04.9 4.9
Cropland, drained, paddy rice 9.4 0.82 143.5
Source: IPCC (2013)
Peat biological oxidation emission factors are from the IPCC 2013 Wetlands Supplement that provides separate emission factors for CO2, DOC and CH4. Alternative emission factors have been developed from research in Central Kalimantan, but there is conjecture amongst peat scientists about which emission factors best represent the emissions profile in Indonesia. Ongoing review of these emission factors should be undertaken as part of the INCAS continuous improvement plan to incorporate findings from continuing peat GHG emissions research.
Emission factors for peat fires were developed by the KFCP project in Central Kalimantan. Hooijer et al. (2014) consider the fire emission factors resulting from the KFCP work to be more representative of normal fire conditions in Indonesia than the emission factors presented in IPCC 2013, which they consider overestimated fire GHG emissions (due to the reliance on a small number of studies that were influenced by extreme conditions in 1997/98).
INCAS has adopted the data underpinning the fire emission factors for the KFCP project site from Page et al. (2014), but adapted the emission factors to meet international reporting requirements so that GHG emission estimates from organic soil fire were expressed in tonnes of each GHG emitted. The method used for determining country-specific emission factors for Indonesia follows the approach described in IPCC 2013, using Equation 2.8 as described in the box below.
4 See Table 2.1 in IPCC 20135 See Table 2.2 in IPCC 2013 6 The majority of plantation and cropland areas identified were oil palm. Hence, this EF was used for plantation and cropland calculations based on IPCC EFs.
Standard Methods for Estimating Greenhouse Gas Emissions from Forests and Peatlands in Indonesia (Version 2) | 47
Mass of fuel available for combustion = area (m2) * burn depth (m) * bulk density (t m–3t)
Table 7-4 shows the input values, calculated mass of fuel available for combustion and resulting emissions of CO2-C, CO and CH4 in tonnes of each gas per ha for three types of fire. Total annual emissions are calculated by multiplying the annual area burnt by the mass of emissions released for each gas.
Table 7-4. Input parameters and CO2-C, CO and CH4 emissions per ha for organic soil fire.
Peat fire EF calculation First fire Second fire Third fire and subsequent fires
Burn depth (cm) 18 11 4
Area (ha) 1 1 1
Bulk density (g cm-3) 0.121 0.121 0.121
Combustion factor 1 1 1
EF CO2-C (g kg-1) 464 464 464
EF CO (g kg-1) 210 210 210
EF CH4 (g kg-1) 21 21 21
Mass of fuel available for combustion (t dm ha-1) 217.8 133.1 48.4
CO emissions (t CO ha-1) 45.7 28.0 10.2
CH4 emissions (t CH4 ha-1) 4.6 2.8 1.0
CO2-C emissions (t C ha-1) 101.1 61.8 22.5
CO-C emissions (t C ha-1) 19.6 12.0 4.4
CH4-C emissions (t C ha-1) 3.4 2.1 0.8
Total C emissions (t C ha-1) 124.1 75.8 27.6
Source of CO2-C, CO and CH4 emission factors: Table 2.7, IPCC (2013)Source of burn depth, bulk density and combustion factor: Page et al. (2014)
Note: Emission factors for N2O and NOx are not provided by IPCC at Tier 1 level due to limited data for N2O and NOx emissions from organic soil fires.
EQUATION 2.8ANNUAL CO2 AND NON-CO2 EMISSIONS FROM ORGANIC SOIL FIRE
Lfire = A MB Cf Gef 10-3
Where:
Lfire = amount of CO2 or non-CO2 emissions, e.g. CH4 from fire, tonnesA = total area burnt annually, haMB = mass od fuel available for combustion, tonnes ha-1 (i.e. mass of dry organic spil fuel)
(default values in Table 2.6; units differ by gas spacies)Cf = combustion factor, dimensionlessGef = emission factor for each gas, g kg-1 dry matter burnt (default values in Table 2.7)
48 | Standard Methods for Estimating Greenhouse Gas Emissions from Forests and Peatlands in Indonesia (Version 2)
Nitrous oxide emissions from drained soil
Annual nitrous oxide emissions from organic soil were calculated by multiplying the annual area of drained peatland in a land-use category by Tier 1 default emission factors from IPCC 2013 (Table 7-5).
For the national pilot inventory the ‘plantation: oil palm’ emission factor was applied for all plantation and estate crops as oil palm represents the majority of plantations on peatland. The ‘forest land and cleared forest land (shrubland), drained’ emission factor was used for all land other than plantation and estate crops and rice paddy.
Table 7-5. Default nitrous oxide emission factors from organic soil.
Forest land and cleared forest land (shrubland7), drained 2.4
Plantation: oil palm 1.2
Plantation: sago palm 3.3
Cropland except rice 5.0
Rice 0.4
Grassland 5.0
7.3 ANALYSIS
The overall approach is illustrated in Figure 7-1. Total annual GHG emissions are estimated by multiplying the area affected by drainage or fire by an activity specific emission factor. Separate emission factors are used for peat biological oxidation and peat fires. Emissions in fire years are comprised of both biological oxidation and peat fire emissions.
Standard Methods for Estimating Greenhouse Gas Emissions from Forests and Peatlands in Indonesia (Version 2) | 49
Figure 7-1. Overview of INCAS peat GHG emissions estimation approach.
The approach to estimating peat GHG emissions is consistent with the approach used in INCAS for modeling GHG emissions and removals from biomass and debris. Both approaches are event-based, in which emissions are triggered by land management events.
7.4 QUALITY CONTROL AND QUALITY ASSURANCE
Quality control and quality assurance of emission factors and area input data was conducted by the authors of the reports Hooijer et al. (2014), Ballhorn et al. (2014), IPCC (2013) and the INCAS team.
Quality assurance of area and emissions calculations was conducted by INCAS technical advisors.
7.5 OUTPUTS AND UNCERTAINTY ANALYSIS
Greenhouse gas emissions from peatland are reported in their native gases and where possible as CO2-equivalent emissions, as shown in Table 7-6.
Carbon emissions from biological oxidation of peat and peat fire are quantified as change in peat carbon stock in t C ha-1, converted to CO2-equivalent emissions by multiplying by 44/12 (ratio of molecular weight of CO2 to carbon).
50 | Standard Methods for Estimating Greenhouse Gas Emissions from Forests and Peatlands in Indonesia (Version 2)
Non-CO2 emissions from peat fire are quantified directly in t CO ha-1 and t CH4 ha-1. Methane emissions are converted to CO2-equivalent emissions.
Methane (CH4) and nitrous oxide (N2O) emissions are converted to CO2-equivalent emissions by multiplying by the 100-year global warming potentials for each gas, which are 28 and 265, respectively (Myhre et al., 2013).
Table 7-6. Modeling outputs and reporting units.
Source Model output
Initial output
unit
Conversion factor Reporting unit GWP8 Common
reporting unit
Biological oxidation of drained peat
CO2-C t C ha-1 44/12 1
Peat fire
CO2-C t C ha-1 44/12 t CO2 1 t CO2-e
CH4 t CH4 ha-1 1 t CH4 28 t CO2-e
CO t CO ha-1 1 t CO NA NA
Direct emissions from drained organic soils
CH4 t CH4 ha-1 1 t CH4 28 t CO2-e
DOC t C ha-1 44/12 t CO2 1 t CO2-e
N2O t N2O ha-1 1 t N2O 265 t CO2-e
Adoption of Indonesia specific emission factors developed from research and the IPCC 2013 Wetlands Update that relied on Indonesian data for tropical soils, reduces the level of uncertainty from emission factors, although there is still conjecture amongst peat scientists about the accuracy of derived emission factors. Additional research is required to expand the type of land and management activities covered by emission factors, which would further reduce the uncertainty associated with these emission factors.
Uncertainties associated with spatial data vary considerably for different data sets. These are discussed in the Standard Method – Spatial Allocation of Regimes (Chapter 6). The INCAS program has identified key spatial data sets required for analysis. Improvement of these data sets will reduce uncertainty of GHG emission estimates.
7.6 LIMITATIONS
For the national GHG inventory, the main limitations of the peatland GHG emissions estimation approach relate to data availability and quality.
• Consistency between spatial data sets is important. Some data overlap or have inconsistent information for the same areas between data sets.
Standard Methods for Estimating Greenhouse Gas Emissions from Forests and Peatlands in Indonesia (Version 2) | 51
• Spatial extent of annual burnt area is important. Further work is needed to accurately determine areas burnt and fire intensity for historical fires.
• Methane emissions from drainage ditches are noted in IPCC 2013 as potentially significant, although insufficient information was available about drainage ditch location and size to include these in the National GHG inventory. Further work is required to provide more comprehensive data about drainage ditch location, sizes, condition and the distance from ditches that are impacted by drainage.
• Peat mapping, including peat boundaries and depth, needs to be improved.
• Land management information of peatlands, particularly land uses and intensity of management following forest clearing, were limited and should be improved.
• Data about water table depth in disturbed and managed peatland was not available for the whole of Indonesia. Further research should be undertaken to develop relationships between land management, canal management (including canal blocking) and water table depth and the resultant GHG emissions.
• Limited research indicates that peat biological emission factors for the first 5 years after clearing are significant. Further research should be undertaken to improve these estimates in terms of the quantity and timing of emissions.
7.7 IMPROVEMENT PLAN
GHG emissions from organic soil are substantially higher than net emissions from other carbon pools associated with deforestation, forest degradation, sustainable management of forest and enhancement of forest carbon stocks that are modelled using higher tier methods. This indicates that further work is needed to reduce uncertainty associated with peat GHG emission estimates. Ongoing research will help to reduce some sources of uncertainty. However, greater collaboration between custodians of data about peat and peatland management and further analysis of these data could yield earlier substantial improvements in peatland GHG emissions estimates. A detailed, prioritized, continuous improvement plan should be developed for peat activities and an overarching coordination body appointed to manage their implementation.
52 | Standard Methods for Estimating Greenhouse Gas Emissions from Forests and Peatlands in Indonesia (Version 2)
8.1 PURPOSE
This standard method describes the process used by INCAS for modelling GHG emissions and removals from activities occurring on forest lands including deforestation, forest degradation, the role of conservation, sustainable management of forests and enhancement of forest carbon stocks in Indonesia. This includes data collation, data analysis, quality control, quality assurance, modelling and reporting.
Modeling of the following carbon pools and GHG emissions uses a mass balance, event-driven approach in which changes to carbon stocks in each carbon pool and flows of carbon between pools are quantified:
• live aboveground biomass
• live belowground biomass
• debris (deadwood, litter)
• carbon emissions from fire.
From these, annual GHG emissions and removals are derived for defined periods of interest. This approach is used for natural forest, timber plantations, oil palm and rubber estate crops.
Modeling of other carbon pools and GHG emissions described in this standard method are:
• carbon emissions from mineral soil, calculated using IPCC default emission factors and activity data;
• non-CO2 emissions from fire, calculated using IPCC default N:C ratios and emission factors multiplied by carbon released from fire.
Carbon emissions and non-CO2 emissions from organic soil (peat) are modelled using the INCAS standard method for peatland GHG emissions (described in Chapter 7).
STANDARD METHOD – DATA INTEGRATION AND REPORTING
Standard Methods for Estimating Greenhouse Gas Emissions from Forests and Peatlands in Indonesia (Version 2) | 53
Input data used for modelling GHG emissions and removals are collated from the outputs of the following INCAS standard methods and other documents:
• Standard Method – Initial Conditions
• Standard Method – Growth and Turnover
• Standard Method – Forest Management Events and Regimes
• Standard Method – Spatial Allocation of Regimes
• Standard Method – Peatland GHG Emissions
• LAPAN (2014). The Remote Sensing Monitoring Program of Indonesia’s National Carbon Accounting System: Methodology and Product, Version 1 (summarized in Standard Method - Forest Cover Change).
• IPCC (2003). Good Practice Guidance for Land Use, Land Use Change and Forestry
• IPCC (2006). IPCC Guidelines for National Greenhouse Gas Inventories
• IPCC (2014). 2013 Supplement to the 2006 IPCC Guidelines for National Greenhouse Gas Inventories: Wetlands
Outputs from this standard method are expressed in tonnes of each GHG and CO2-equivalent GHG emissions and removals. Time periods for reporting can be specified to meet reporting requirements.
8.2 DATA COLLATION
Input data for modelling GHG emissions and removals are collated from a wide range of sources through a series of INCAS standard methods shown in Table 8-1. Each standard method is specifically designed to produce credible, verifiable input data to underpin Indonesia’s net GHG emissions estimates from forests.
54 | Standard Methods for Estimating Greenhouse Gas Emissions from Forests and Peatlands in Indonesia (Version 2)
Table 8-1. Source of modeling input data.
Standard method Modeling input data
Initial conditions
Carbon stocks for each component of aboveground and belowground biomass and debris for each biomass class9 at the start of the simulation.
Data values, assumptions and sources are documented in the INCAS fullCAM Database
Forest growth and turnover
Rate of growth, turnover of aboveground and belowground biomass and decomposition rate of debris, for each component of each biomass class.
Data values, assumptions and sources are documented in the INCAS Growth Database.
Forest management events and regimes
Impact of forest management events on carbon stocks for each component of aboveground and belowground biomass and debris for each biomass class and the timing of events allocated to management regimes and specific areas of forests.
Data values, assumptions and sources are documented in the INCAS Event Database and the INCAS Suite Regime Database
Spatial allocation of regimes
Area by year by forest management regime to be modelled. Data are documented in the INCAS Regime Area Database
Peatland GHG emissions are calculated in the Standard Method – Peatland GHG Emissions (Chapter 7). The results are added to the outputs from modelling in this standard method to calculate total annual GHG emissions and removals.
8.3 ANALYSIS
Methodologies and emissions factors used for estimating GHG emissions and removals for the pilot province are summarized in Table 8-2. Methodologies consist of a combination of Tier 2, Approach 2 method and Tier 3 (model), Approach 2 method using a mixture of Indonesia specific data and other defaults. Some Tier 1 default methods were applied where Indonesia specific data were not available.
Standard Methods for Estimating Greenhouse Gas Emissions from Forests and Peatlands in Indonesia (Version 2) | 55
Table 8-2. Summary of methodologies and emission factors: Land use, land-use change and forestry sector.
Greenhouse gas source and sinkCO2 CH4 N2O NOx, CO
Method applied EF Method
applied EF Method applied EF Method
applied EF
A. Forest land 1. Forest land remaining forest land
2. Land converted to forest landEnhancement of forest carbon stocks
T3T3
IE8
T1/T2
T1
T3
MM
D/CS
CS
M
T2T1
T1
DD
CS
T2T1
NE
DD
T2
T1
D
CS
B. Cropland 1. Cropland remaining cropland 2. Land converted to cropland
(deforestation)Oil palm plantationsRubber plantationsOther cropsBiomass burningEmissions from drained organic soilsPeat burningEmissions from mineral soil
NE
T3T3T1IE
T1/T2
T1T1
MMD
D/CS
CSD
T2T1
T1
DD
CS
T2T1
NET1
DD
D
T2
T1
D
CS
C. Grassland 1. Grassland remaining grassland 2. Land converted to grassland
NEIE
D. Wetlands 1. Wetlands remaining wetlands 2. Land converted to wetlands
NENE
E. Settlements 1. Settlements remaining
settlements 2. Land converted to settlements
NEIE
F. Other lands 1. Other lands remaining other
lands 2. Land converted to other lands
Mining
NE
IE
EF = emission factor, CS = country specific, D = IPCC default, M = model,9 NA = not applicable, NE = not estimated,
NO = not occurring, IE = included elsewhere,10 T1 = Tier 1, T2 = Tier 2 and T3 = Tier 3
7 Biomass burning means burning of aboveground biomass and debris on site.8 CO2 emissions from biomass burning are included in calculations for SMF, degradation and deforestation using T3 models.9 Models are used instead of single value emission factors to simulate forest dynamics such as growth, turnover and decomposition processes and the impacts of management events on carbon stocks and flows.10 All land converted from forest land to grassland, wetland, settlements and other land are included in forest land converted to cropland (other crops). Net emissions and removals are assumed to be zero after conversion, except for oil palm and rubber estate crops.
56 | Standard Methods for Estimating Greenhouse Gas Emissions from Forests and Peatlands in Indonesia (Version 2)
GHG emission estimates are prepared for any period for which activity data is available and required for reporting. For the national GHG inventory, this was 2001 to 2012. The area of change represents a change in forest area from the previous year. For example, the area reported in 2001 represents a change in forest area from 2000 to 2001.
When new activity data becomes available (e.g. a new year of forest cover change data is processed or a new forest map becomes available) the entire time series should be reprocessed. This is necessary to ensure time series consistency of data and to ensure that transitions that occur over multiple years are correctly identified (e.g. clearing followed by temporarily unstocked land followed by revegetation).
8.3.1 Forest land
Carbon emissions and removals from above- and belowground biomass, debris and fire
The interim tool adopted in this standard method for quantifying GHG emissions and removals from deforestation, forest degradation, enhancement of forest carbon stocks and the sustainable management of forest is the Full Carbon Accounting Model (FullCAM). FullCAM is a flexible integrating tool that enables Tier 2 or Tier 3 spatial or nonspatial estimates of GHG emissions for agriculture, forestry and other land uses. It has been widely peer-reviewed and subjected to UNFCCC review processes as part of other national inventories. Indonesian data can be readily entered or default assumptions used where Indonesian-specific data is not available. Full details of FullCAM design and application can be found in Richards (2001, 2005).
Figure 8-1 summarizes the components and flows of carbon simulated within FullCAM for the national GHG inventory.
Other process-based tools may become available in the future and should be evaluated for their suitability as Tier 3 methods of estimating GHG emissions and removals from forests in Indonesia.
Standard Methods for Estimating Greenhouse Gas Emissions from Forests and Peatlands in Indonesia (Version 2) | 57
Figure 8-1. FullCAM components and carbon flows for tree and debris pools.
FullCAM quantifies changes in tree components as a result of production (growth) and turnover (loss of material, e.g. leaf and branch fall, root loss). FullCAM models changes in debris pools through inputs from turnover and losses from breakdown (decomposition) using decay curves. Each component of aboveground biomass, belowground biomass and debris pools is tracked throughout the simulation period.
NaturalProcesses
Carbon stock
Aboveground biomass
Belowground
Debris
InitialConditions
Events
NaturalProcesses
Stemwood
Branches
Bark
Leaves
Coarse roots
Fine roots
Standingdeadwood
Dec.Res.
Downeddeadwood
Dec.Res.
Fine woodDec.Res.
BarkDec.Res.
LeavesDec.Res.
Dead coarseroots
Dec.Res.
Dead fineroots
Dec.Res.
Clearing/Harvest(% of pool & destination)
Fire(% of pool & destination)
Planting(% of pool and destination)
Turnover(% of pool)
Decomposition(decay rates)
Increment(yield tables)
Turnover(% of pool)
Decomposition(decay rates)
Increment(yield tables)
Atmosphere
RemovalsCO2
Atmosphere
Emissions
CO -e2
CO -e2
58 | Standard Methods for Estimating Greenhouse Gas Emissions from Forests and Peatlands in Indonesia (Version 2)
Changes in carbon stock of forest products (e.g. sawlogs, veneer logs, pulpwood) can be tracked in INCAS, but for the current national GHG inventory, these were not tracked due to insufficient data on wood product quantities and decay rates of wood products in use. However, carbon flows into the forest product pools were used to indicate whether carbon stocks impacted by forest management events stay on site (in debris pools) or leave the site (in forest product pools). Carbon entering the debris pools breaks down over time, gradually entering the soil or leaving the site as emissions to the atmosphere. Carbon entering the forest product pool is assumed to leave the site at the time of harvest as an emission to the atmosphere.
The soil model incorporated into FullCAM, RothC, had not been calibrated to quantify changes in soil organic carbon in Indonesian soils. Hence, changes to soil organic carbon in mineral soils was quantified using other methods described later in this standard method and changes in soil organic carbon in organic soils were described in the Standard Method – Peatland GHG Emissions (Chapter 7).
FullCAM is a process-based, event-driven integrating tool, meaning that changes in carbon stocks occur as a result of processes that continuously occur (e.g. production, turnover, breakdown) and events that periodically occur (e.g. harvesting, fire), usually with instantaneous impacts on carbon flows.
Processes
The main processes quantified using INCAS are:
• production – moves carbon from the atmosphere to the plant pools. Production is the combination of photosynthesis, which moves carbon from the atmosphere to plant pools and respiration, which moves a lesser amount of material in the opposite direction. The net result represents plant growth.
• turnover – moves carbon from a plant pool to a debris pool as the material dies.
• breakdown – moves carbon from the debris pool.
Data for the processes of production, turnover and breakdown are input to FullCAM for each biomass class based on data outputs from the Standard Method – Growth and Turnover (Chapter 3).
Events
Events modify the quantity of carbon in each carbon pool and the destination of moved carbon. Event types include:
• thinning – harvesting events that remove some or all of aboveground biomass from the site and move some live biomass to debris pools;
Standard Methods for Estimating Greenhouse Gas Emissions from Forests and Peatlands in Indonesia (Version 2) | 59
• planting trees – tree planting events create new forests on areas not containing forest, or where a primary forest is being replaced by a secondary forest that has different growth characteristics to the primary forest;
• forest treatment – forest treatment events (e.g. fertilizer application) change forest growth rate when the inbuilt tree yield formula is used to model production (this was not used for INCAS for the national GHG inventory);
• forest fires – fire events that release carbon (as CO2 and CH4) and nitrogen (N2O) to the atmosphere and move some carbon to the debris and soil pools.
Total carbon stock at any point in time represents the result of a series of events applied to the initial carbon stock, influenced by production, turnover and breakdown processes.
Event and forest management regime data are input to FullCAM based on data outputs from the Standard Method – Forest Management Events and Regimes (Chapter 4).
FullCAM plot files
Data are input to FullCAM plot files that are ‘run’ to produce outputs. A plot file represents a unique combination of biomass class and management regime that impacts on carbon stocks over time. A management regime consists of a series of events occurring at specified times.
Plot files can be ‘run’ individually to quantify changes in carbon stocks for a given biomass class managed according to a given management regime with outputs expressed on a per hectare basis. Alternatively, plot files can be allocated areas and combined with other plot files in an estate file to quantify changes in carbon stocks across a group of forests (an estate).
Master plot file
Individual plot files are created for every potential combination of events and biomass classes to be analysed. For the national GHG inventory, the suites, management regimes and plot files are documented in INCAS Suites Database.
For plot files containing natural primary or secondary forest, all tree and debris carbon pools are assumed to be in equilibrium prior to the first event. For secondary forests this is a simplifying assumption because it is likely that some ongoing growth would occur in the tree biomass pools and some debris from previous harvests would still be decaying. However, due to lack of data, a state of equilibrium is used as a conservative assumption.
Figure 8-2 to Figure 8-6 provide examples of the outputs of plot files for deforestation, forest degradation, sustainable management of forest and enhancement of forest carbon stocks.
60 | Standard Methods for Estimating Greenhouse Gas Emissions from Forests and Peatlands in Indonesia (Version 2)
Figure 8-2. Example of the output of changes in carbon mass by carbon pool from deforestation.
Figure 8-3. Example of the output of changes in carbon mass by carbon pool from forest degradation.
0
20
40
60
80
100
120
140
160
180
200
0 10 20 30 40 50
mas
s (tC
/ha)
Year
Total C mass C mass of aboveground tree components
C mass of belowground tree components C mass of forest litter
C mass of forest deadwood
0
50
100
150
200
250
300
0 10 20 30 40 50
mas
s (tC
/ha)
Year
Total C mass C mass of aboveground tree components
C mass of belowground tree components C mass of forest litter
C mass of forest deadwood
Standard Methods for Estimating Greenhouse Gas Emissions from Forests and Peatlands in Indonesia (Version 2) | 61
Figure 8-4. Example of the output of changes in carbon mass by carbon pool from sustainable management of forests.
Figure 8-5. Example of the output of changes in carbon mass by carbon pool from enhancement of forest carbon stocks.
0
20
40
60
80
100
120
140
160
180
200
0 10 20 30 40 50
mas
s (tC
/ha)
Year
Total C mass C mass of aboveground tree components
C mass of belowground tree components C mass of forest litter
C mass of forest deadwood
0
20
40
60
80
100
120
140
160
180
200
0 10 20 30 40 50
mas
s (tC
/ha)
Year
Total C mass C mass of aboveground tree components
C mass of belowground tree components C mass of forest litter
C mass of forest deadwood
62 | Standard Methods for Estimating Greenhouse Gas Emissions from Forests and Peatlands in Indonesia (Version 2)
Figure 8-6. Example of the output of changes in carbon mass by carbon pool from conversion of forest to estate crop.
Estate files
An estate file enables multiple plot files to be assigned an area for each year and modelled as a single group of forests. Area is derived from the spatial allocation of regimes process described in the Standard Method – Spatial Allocation of Regimes (Chapter 6).
Depending on the reporting classes adopted by Indonesia, separate estate files can be run for specific locations (e.g. national, province, district, project) or reporting purposes (e.g. REDD+, UNFCCC BUR and national communications, domestic land-use planning).
For example, for REDD+ reporting, each REDD+ activity reported is modelled as a separate estate: deforestation, enhancement of forest carbon stocks, sustainable management of forest, and forest degradation (noting these definitions are yet to be formally agreed by GOI). Descriptions of each of these REDD+ categories are provided below. Similarly, once more detailed spatial data for non-forest land uses is available, separate estates can be modelled for each UNFCCC reporting category. For the national GHG inventory a simplifying assumption is applied resulting in all deforestation causing a transition from forest land to cropland.
0
20
40
60
80
100
120
140
160
180
200
0 10 20 30 40 50
mas
s (tC
/ha)
Year
Total C mass C mass of aboveground tree components
C mass of belowground tree components C mass of forest litter
C mass of forest deadwood
Standard Methods for Estimating Greenhouse Gas Emissions from Forests and Peatlands in Indonesia (Version 2) | 63
Areas for each plot file within an estate are assigned using the Standard Method – Spatial Allocation of Regimes (described in Chapter 6). For the national GHG inventory the areas are documented in INCAS Regime Areas database.
Deforestation estate file
The deforestation estate file consists of plot files that model changes to forest carbon stocks and GHG emissions from clearing harvest and fire events resulting in deforestation. Decay of the debris pools may continue for many years after the initial events. For the national GHG inventory, subsequent cropland management events are only modelled for estate crops. All other crops are assumed to have a zero emission factor.11
More detailed cropland management events should be included in the deforestation estate file once area and emissions data become available as part of the continuous improvement plan.
Forest degradation estate file
The forest degradation estate file consists of plot files that model changes to on-site carbon stocks resulting from events that result in primary natural forests becoming secondary natural forests (e.g. through selective harvesting, human induced fire or clearing followed by natural regeneration).
8.3.2 Estate crops and other croplands
Emissions from oil palm estate crops and rubber estate crops on cropland converted from forest land within the modelling period are modelled using the process-based model described earlier. All other oil palm and rubber estate crops present at the commencement of the modelling period or subsequently established on land outside the forest land are excluded from the national GHG inventory. The approach for quantifying net emissions from these areas should be developed as part of the agriculture land-use inventory component under the continuous improvement plan.
All other areas with a land-use change from forest to non-forest are assumed to have a common emission profile (i.e. common emission factor) from the year of deforestation onwards in perpetuity.
To simplify calculations, it was assumed for these lands that all biomass increment is removed during the same year as harvested crops (i.e. there is no net change in annual biomass in non-forest areas, hence no net emissions from biomass in non-estate crop croplands). This is equivalent to applying an emission factor of 0 t C ha-1.
11 Crops other than estate crops are assumed to emit all carbon removed each year through growth due to harvesting cycles of less than one year. i.e. All carbon sequestered is emitted at the time of harvest.
64 | Standard Methods for Estimating Greenhouse Gas Emissions from Forests and Peatlands in Indonesia (Version 2)
8.3.3 Carbon emissions from mineral soil
Annual carbon emissions from disturbed mineral soil are calculated using the Tier 1 method outlined by IPCC (IPCC, 2003) in Section 3.3.2.2 for conversions from forest land to cropland and in 3.4.2.2 for conversions to grassland in order to estimate the effects of deforestation, as recommended in the Global Forest Observation Initiative Methods and Guidance Document (GFOI, 2013). The majority of deforestation events were conversion of forest land to cropland, with the remainder being conversion of forest land to other land uses. Detailed information for subsequent land uses after deforestation was not currently available. Hence, all areas of deforestation were assumed to represent forest land converted to cropland. Some deforestation areas may actually represent clearing of oil palm plantations that were misidentified in the forest cover change analysis.
Hence, calculations were based on conversion of forest land to cropland using Equation 3.3.3 in IPCC 2003.
Calculations are conducted in a simple Excel-based model based on the annual cumulative area of land converted from forest to non-forest.
A single emission factor was applied to mineral soil in all non-forest land based on the assumption that all mineral soils were soils with low activity clay (LAC) minerals (see Table 3.3.3 in IPCC 2003). This could be improved in the future through use of more detailed soilinformation.
No carbon emissions were assumed to occur on mineral soil for forest land which remained as forest land, in accordance with IPCC guidance which states:
Under Tier 1, it is assumed that when forest remains forest the carbon stock in soil organic matter does not change, regardless of changes in forest management, types and disturbance regimes … in other words that the carbon stock in mineral soil remains constant so long as the land remains forest (IPCC, 2003).
8.3.4 N2O emissions from mineral soil
Annual N2O emissions from disturbed mineral soil were calculated using the Tier 1 method outlined by IPCC (IPCC, 2003) in Section 3.3.2.3 for conversions from forest land to cropland. This used the same area data and the carbon stock change data calculated above for annual carbon emissions from disturbed mineral soil. Calculations were performed in the same simple Excel-based model described above.
Standard Methods for Estimating Greenhouse Gas Emissions from Forests and Peatlands in Indonesia (Version 2) | 65
8.3.5 Non-CO2 emissions from surface fire
Non-CO2 emissions from burning biomass in surface fires were calculated using the carbon released from fire events modeled in FullCAM multiplied by IPCC default N/C ratios and emission ratios described in Section 3.2.1.4 (IPCC, 2003) and using Equation 3.2.19.
Required emission ratios were provided in Table 3A.1.15 and the N/C ratio for the fuel burnt was approximated to be about 0.01 (IPCC, 2003). Calculations of non-CO2 emissions from burning biomass in the national GHG inventory were conducted in the simple Excel-based model.
Emissions were reported in total tonnes of CH4, CO, N2O and NOX. Methane (CH4) and N2O emissions were converted to CO2-equivalent emissions using global warming potentials of 28 and 265, respectively. As CO and NOx are secondary GHGs they were not converted to CO2 equivalent.
Non-CO2 emissions from fire in peatlands are addressed in the Standard Method – Peatland GHG Emissions (Chapter 7).
8.4 QUALITY CONTROL AND QUALITY ASSURANCE
Quality control focused on ensuring that data obtained from standard methods and other sources was in the format required for modelling and met the requirements for accuracy, consistency, comparability and completeness. This included checking that all required data input parameters were available, correct units were used, the geographic and temporal coverage for the region and time period being modelled was fully covered and data sources were clearly documented. If inconsistencies are found, these should be resolved prior to proceeding with modelling. Resolution may require revisiting the standard methods or other source documents and/or seeking clarification from the authors of source analyses.
Quality control should be undertaken by the team responsible for modelling.
Quality assurance should be conducted at each step in modelling and reporting, including:
• reviewing all steps of the modelling process to ensure they have been followed;
• ensuring that data outputs from each step are correctly calculated (by manually checking a sample of individual calculations);
• confirming that correct units are used and conversions between units have been accurately calculated;
• ensuring that the outputs are correctly transcribed from models to reports.
Quality assurance should be undertaken by an independent party not involved directly in conducting the calculations. For example, in the national GHG inventory this was undertaken by INCAS team members not directly responsible for modelling and by external technical advisors.
66 | Standard Methods for Estimating Greenhouse Gas Emissions from Forests and Peatlands in Indonesia (Version 2)
Quality assurance may identify errors in data, methods, calculations or reporting that should be rectified prior to finalizing the reporting.
8.5 OUTPUTS
8.5.1 Reporting years
GHG emissions and removals can be estimated for any time period using the INCAS approach, provided the historical data is available, or forecast (historical or future) activity data is assumed (e.g. through scenarios). The period for reporting should be selected to meet reporting requirements.
Emissions and removals from land use are assigned to the year in which activities occur, or the year in which lag emissions occur from events in previous years (e.g. decay of forest debris from logging in earlier years). For some data, the exact date of the activity may be unknown, but the year of activity can be estimated. For example, if forest cover is detected at a specific location in 2000 but not in 2001, then a forest loss event occurred in 2001. If forest is not detected in 2000 but forest is detected in 2001, then forest gain occurred in 2001.
8.5.2 Land-use transition matrices
The annual area by land-use class and the change from one class to another is reported in the following land-use transition matrices. A separate table is required for each year included in the GHG inventory period. The area reported in the final area column is the land area by category at the end of the year.
Forest located on peat soils is included in the forest land class, not in the wetland class.
All non-forest land was assumed to be cropland or other land due to insufficient data available at the time of reporting to differentiate it into other land-use categories. Consequently, the land-use transition matrices were not included. The land-use transition matrices (e.g. Table 8-3) should be developed when better spatial data becomes available to enable differentiation between non-forest land uses.
Standard Methods for Estimating Greenhouse Gas Emissions from Forests and Peatlands in Indonesia (Version 2) | 67
Table 8-3. Land use transition matrices.
Year Forest land Cropland Grassland Wetlands Settlements Other
landFinal area
Forest land
Cropland
Grassland
Wetlands
Settlements
Other land
Initial area
Net change
8.5.3 Reporting units
Outputs for each carbon pool are converted to common reporting units as shown in table 8-4.
Carbon stock (t C ha-1) by carbon pool is quantified in FullCAM at each time step in the simulation. Change in carbon stock between points in time is calculated outside FullCAM by exporting outputs to Excel and calculating the difference between the time steps of interest. For INCAS, this is annual carbon stock change, measured in t C ha-1 yr-1.
Non-CO2 emissions from burning forest biomass are calculated by exporting to Excel from FullCAM the annual quantity of C mass emitted due to fire from trees and forest debris and converting these to emissions of CH4, N2O, CO and NOx using the default emission ratios and N/C ratio (IPCC, 2003).
Emissions from organic matter in disturbed mineral soil are quantified as annual change in carbon stock in t C ha-1, from which annual N2O emissions (in t N2O ha-1) are calculated. Both carbon stock change and N2O emissions are converted to CO2-equivalent emissions.
Carbon emissions from biological oxidation of peat and peat fire are quantified as change in peat carbon stock in t C ha-1, converted to CO2-equivalent emissions. Non-CO2 emissions from peat fire are quantified directly in t CO ha-1 and t CH4 ha-1. Methane (CH4) emissions are converted to CO2-equivalent emissions.
Change in carbon stock is converted to CO2-equivalent emissions by multiplying by 44/12 (ratio of molecular weight of carbon dioxide to carbon).
68 | Standard Methods for Estimating Greenhouse Gas Emissions from Forests and Peatlands in Indonesia (Version 2)
Methane (CH4) and nitrous oxide (N2O) emissions are converted to CO2-equivalent emissions by multiplying by the 100-year global warming potential for each gas, which are 28 and 265 respectively (Myhre et al., 2013).
Table 8-4. Model outputs and reporting units.
Source Model output
Initial output unit
Conversion factor
Reporting unit GWP12
Common reporting
unitBiomass and woody debris CO2-C tonnes C ha-1 44/12 tonnes CO2 1 tonnes CO2-e
Biomass burning
CH4 tonnes CH4 ha-1 1 tonnes CH4 28 tonnes CO2-e
N2O tonnes N2O ha-1 1 tonnes N2O 265 tonnes CO2-e
CO tonnes CO ha-1 1 tonnes CO NA NA
NOx tonnes NOx ha-1 1 tonnes NOx NA NA
Mineral SoilCO2-C tonnes C ha-1 44/12 tonnes CO2 1 tonnes CO2-e
N2O tonnes N2O ha-1 1 tonnes N2O 265 tonnes CO2-e
Biological oxidation of drained peat
CO2-C tonnes C ha-1 44/12 tonnes CO2 1 tonnes CO2-e
Peat fire
CO2-C tonnes C ha-1 44/12 tonnes CO2 1 tonnes CO2-e
CH4 tonnes CH4 ha-1 1 tonnes CH4 28 tonnes CO2-e
CO tonnes CO ha-1 1 tonnes CO NA NA
Direct emissions from drained organic soils
N2O tonnes N2O ha-1 1 tonnes N2O 265 tonnes CO2-e
8.5.4 Reporting categories
Reporting categories should be defined by the Government of Indonesia and may change as domestic and international reporting commitments change.
12 GWP – 100-year Global Warming Potential from (Myhre et al. 2013). CO and NOx are secondary greenhouse gases and are not assigned GWP values.
Standard Methods for Estimating Greenhouse Gas Emissions from Forests and Peatlands in Indonesia (Version 2) | 69
Annual GHG emissions can be reported according to the UNFCCC reporting categories shown in Table 8-5 or as REDD+ categories. The correlation between REDD+ and UNFCCC categories adopted for the national GHG inventory are shown in Table 8-5.
Table 8-5. Comparison between UNFCCC reporting categories and REDD+ activities included in the national GHG inventory.
REDD+ activity UNFCCC reporting category
Sustainable management of forest
Forest land remaining forest landForest degradation
The role of conservation
Deforestation Forest land converted to cropland or grassland or wetland or settlements or other land
Enhancement of forest carbon stocks
Cropland or grassland or wetland or settlements or other land converted to forest land
REDD+
The REDD+ categories reported cover total net GHG emissions per annum from activities on land associated with forestry and forest land-use change between 2001 and 2012.
Deforestation
The deforestation account represents the sum of annual GHG emissions and removals resulting from deforestation related events on forest lands for the time period analyzed and reported. Net emissions from subsequent land uses are included where known (e.g. establishment of estate crops on cleared forest lands are included in the deforestation account). In the absence of more detailed data about subsequent land uses on non-estate crop (cropland), it was assumed that all subsequent land uses were annual crops in which annual biomass gain and loss were equivalent, resulting in annual zero net emissions in years after deforestation. Emissions from decay of forest debris arising from the deforestation event are included, resulting in emissions for many years after each deforestation event. This also included ongoing emissions from the deforestation event occurred before 2000.
Forest degradation
The forest degradation account represents the sum of annual GHG emissions and removals from events that result in primary natural forests becoming secondary natural forests (e.g. through human induced fire or clearing followed by natural regeneration) and ongoing selective harvesting using conventional technique in secondary forests.13
13 Ongoing selective harvesting using reduced impact logging (RIL) technique is included in sustainable management of forests.
70 | Standard Methods for Estimating Greenhouse Gas Emissions from Forests and Peatlands in Indonesia (Version 2)
Emissions from decay of forest debris arising from the forest degradation event are included, resulting in emissions for many years after each forest degradation event. This also included ongoing emissions from the forest degradation event occurred before 2000. Conversion of natural forest to timber plantations is also included in this category.
The role of conservation
There is no currently agreed definition for how to quantify the role of conservation. For the purpose of GHG inventory, the role of conservation could represent the sum of annual GHG emissions avoided by implementing (or enforcing) management practices in conservation or protection forests. This could include actions that avoid illegal logging or encroachment on conservation or protection forests. INCAS is designed to model the impact of such activities. However, the role of conservation was not included in the national GHG inventory due to insufficient clarity about land management activities to be modelled. Further analysis of the types of conservation activities and their impact on GHG emissions should be included in the INCAS improvement plan.
Sustainable management of forest
The sustainable management of forests account represents the sum of annual GHG emissions and removals resulting from ongoing management using RIL technique of land that was classified as secondary forest at the start of the reporting period (i.e. forest land remaining forest land).14 Results represent changes to on-site carbon stocks resulting from a series of forest management events in natural forests managed on a long-term harvesting cycle using planning and management methods that have minimal net impact on on-site carbon stocks in the long-term (i.e. emissions and removals are equivalent but separated through time). This includes harvesting operations that may result in areas of temporarily unstocked forest.15 Ongoing harvesting and replanting of timber plantations is also included in this category.
Enhancement of forest carbon stocks
The enhancement of forest carbon stocks represents the sum of annual GHG emissions and removals resulting from replanting of forest on deforested land that has been included in the national inventory (i.e. conversion of non-forest land to forest land).
14 Ongoing selective harvesting using conventional technique in secondary forests is included in forest degradation due to the higher impacts on forest carbon stocks.15 Temporarily unstocked forest is land that meets the forest definition when the forest reaches maturity, but due to a disturbance event does not contain forest at the specified point in time. The land is expected to regrow and meet the forest definition in the future.
Standard Methods for Estimating Greenhouse Gas Emissions from Forests and Peatlands in Indonesia (Version 2) | 71
8.6 UNCERTAINTY ANALYSIS
Uncertainty estimates are an important component of a national inventory. Their purpose is to help improve the accuracy of inventories over time by helping to guide decisions on methodological choice and priorities for inventory improvement. Uncertainty estimates are not used to question the validity of emissions estimates in the national inventory. These assessments are made through the review of technical assessment process. Estimating and communicating uncertainty must be both practical and scientifically defensible. For example, a practical approach recognises that producing quantitative uncertainty estimates will rely upon statistically quantified uncertainties as well as expert judgment.
Identifying the sources of uncertainty is the first step in estimating uncertainty. These sources are typically disaggregated into uncertainties related to emissions and removals (e.g. initial biomass, growth, turnover and decomposition rates) and uncertainties related to activity data (i.e. the area on which the emission has occurred). The INCAS framework has been designed to use the best available data for each input. Every effort has been made to reduce uncertainty for each input variable and modelling step through quality control and quality assurance processes.
To demonstrate a typical approach to uncertainty estimates in national inventories, a quantitative uncertainty analysis was carried out on the deforestation components of the national GHG inventory using a Monte Carlo analysis (IPCC Tier 2). The uncertainty analysis was conducted to:
• demonstrate the use of Monte Carlo methods for assessing uncertainty at the national level;
• provide an indicative uncertainty estimate for the national GHG inventory for deforestation events;
• identify the key parameters that drive emissions estimates to allow more targeted research under the continuous improvement plan.
The uncertainty analysis is based only on the statistical ranges of the data used in FullCAM. It does not deal with assumptions used in the system. Key assumptions are common across most methods and include:
• the average carbon stock of a forest type is the same as the carbon stock of the forest that is changing;
• the methods used to calculate inputs are unbiased, in particular the use of allometric models to convert basic measurements to biomass.
72 | Standard Methods for Estimating Greenhouse Gas Emissions from Forests and Peatlands in Indonesia (Version 2)
8.6.1 Method
The uncertainty analysis was conducted using the Excel spreadsheet version of the Carbon Accounting Model for Forests (CAMFor). This was selected because FullCAM uncertainty analysis was designed to run at a point level, not at the estate level as used in INCAS.
CAMFor is one module within FullCAM and is described in Richards and Evans (2000). CAMFor deals only with forest lands and is the component of FullCAM used by INCAS to quantify changes in forest carbon stocks. Consequently calculations of net GHG emissions and removals in this uncertainty analysis are fully consistent with estimates produced using FullCAM. The Excel version of CAMFor transparently shows all of the inputs and calculations and allows risk analysis software (Pallisade@Risk) to be run to undertake quantitative uncertainty analysis.
The first step in the method was to confirm that CAMFor accurately reproduces FullCAM outputs at the estate level. To do this, the national FullCAM plot files that included deforestation events were recreated in CAMFor. Quality assurance was undertaken to confirm that the results from CAMFor accurately represent the FullCAM outputs for each plot file. There are timing difference in how CAMFor accounts for events (end of year only) compared to FullCAM (any day of the year). As most deforestation in the INCAS were set to occur halfway through the year, this led to minor differences in the year of clearing (< 2%) (Figure 8-7). When FullCAM timings were set to the end of the year, the results from CAMFor exactly matched those from FullCAM. It was concluded that calculations in FullCAM and CAMFor are comparable.
Uncertainty analysis was then run for each CAMFor file using Pallisade@Risk to conduct Monte Carlo analyses. To do this, CAMFor was run one thousand times for each plot. For each run, the parameters were varied within a set range (as set by the user) and the results (both inputs and outputs) loaded to Pallisade@Risk. Results were produced to show the effect of varying parameters on total annual emissions for the INCAS simulation period of 2001 to 2012.
The key parameters input from the INCAS analyses (tree and debris masses) were varied within the 95% confidence interval of the mean as shown in Table 2-2. As the biomass data are based on several hundred plots, the confidence intervals are tight. This represents the mean for the entire forest estate rather than a single piece of forest.
Standard Methods for Estimating Greenhouse Gas Emissions from Forests and Peatlands in Indonesia (Version 2) | 73
As Indonesia specific data for turnover rates, fraction of decomposable material and breakdown rates were not available, the parameters were varied by +/-50%. The area estimates and carbon fractions were varied by +/- 10%. This is likely an overestimate for some parameters, but without further information, this is considered reasonable. Further assessment will be conducted as part of the continuous improvement program as more data becomes available.
Indonesia’s National Forest Inventory data, supplemented with research plot data, was used to produce estimates of total aboveground biomass. For use in FullCAM/CAMFor it is necessary for data to be divided into components (stem, branch, bark and leaves). Each of these components was subject to Monte Carlo analysis, but was varied dependently (e.g. all component masses would increase or decrease by the same proportion) as the input data is based on AGB. If these components were measured separately, then it would be more appropriate to vary components individually. However, in this case, such a method would underestimate uncertainty.
Figures 8-8 to 8-11 provide examples of uncertainty analysis to show the effect of varying parameters on total emissions in the first year of the simulation and at year 10 to assess the effects of parameters on lag emissions using risk analysis software (Palisade@Risk).
Figure 8-7. Comparison in annual emissions from deforestation events as estimated from FullCAM and CAMFor, indicating very little variation between the two tools.
Comparison of emission estimates from FullCAM and CAMFOR
FullCAM
CAMFor
74 | Standard Methods for Estimating Greenhouse Gas Emissions from Forests and Peatlands in Indonesia (Version 2)
Figure 8-9. Regression sensitivity for net carbon mass emitted in secondary swamp forest due to deforestation in the first year of the simulation.
-0.61
-0.59
-0.49
-0.16
-0.01
-0.01
Coefficient Value
TOFrac
DecFrac
BreakFrac
BiomassError
CFFRac
AreaMod
2001 / Emissions of C from trees and debrisCorrelation Coefficients (Spearman Rank)
-0.7
-0.6
-0.5
-0.4
-0.3
-0.2
-0.1
-0.0 0.1
Figure 8-8. Distribution for net carbon mass emitted in secondary swamp forest due to deforestation in the first year of the simulation.
2.5% 95.0% 2.5%-121.75 -92.18
0.00
0.01
0.02
0.03
0.04
0.05
0.06
0.07
2001 / Emissions of C from trees and debris
2001 / Emissions of C from trees and debris
MinimumMaximumMeanStd DevValues
-129.098-87.113
-106.4867.3541000
-130
-125
-120
-115
-110
-105
-100 -95
-90
-85
Standard Methods for Estimating Greenhouse Gas Emissions from Forests and Peatlands in Indonesia (Version 2) | 75
Figure 8-11. Regression sensitivity for net carbon mass emitted in secondary swamp forest at 10 years after deforestation.
-0.63
-0.53
-0.50
-0.23
-0.02
0.00
Coefficient Value
TOFrac
DecFrac
BreakFrac
BiomassError
CFFRac
AreaMod
2011 / Emissions of C from trees and debrisCorrelation Coefficients (Spearman Rank)
-0.7
-0.6
-0.5
-0.4
-0.3
-0.2
-0.1
-0.0 0.1
Figure 8-10. Distribution for net carbon mass emitted in secondary swamp forest at 10 years after deforestation.
2.5% 95.0% 2.5%-148.2 -112.8
0.000
0.005
0.010
0.015
0.020
0.025
0.030
0.035
0.040
0.045
0.050
2011 / Emissions of C from trees and debris
2011 / Emissions of C from trees and debris
Minimum -156.846Maximum -106.072Mean -129.851Std Dev 8.719Values 1000
-160
-150
-140
-130
-120
-110
-100
76 | Standard Methods for Estimating Greenhouse Gas Emissions from Forests and Peatlands in Indonesia (Version 2)
8.6.3 Uncertainty analysis results – National level uncertainty16
Figure 8-12 shows annual aggregated estimates of emissions and the associated uncertainty (error bars) for clearing and fire events associated with deforestation across Indonesia. This demonstrates that it is possible to aggregate uncertainty estimates to produce total national uncertainty estimates. However, while this provides an overall picture of uncertainty, this is less valuable for identifying opportunities to reduce uncertainty than using the plot level uncertainty analysis results.
16 Note: Totals differ from the deforestation results presented in the report because the uncertainty analysis only includes clearing and fire events associated with deforestation, whereas the deforestation account includes all activities on deforested land, including lag emissions from deforestation that occurred prior to the simulation period.
Figure 8-12. National level uncertainty results for clearing and fire events associated with deforestation.
8.6.4 Uncertainty analysis discussion and improvement plan
The approach for determining the uncertainty associated with an estimate must consider the individual uncertainties of inputs used in obtaining the estimate, and a process for aggregating the uncertainties. For estimating the emissions from a deforestation event, inputs are needed for mass of tree components (e.g. stem, branches etc.), carbon fraction of tree components, decomposition rates of components, biomass turnover rates, debris decomposition rates and area of each event. By using CAMFor and risk analysis software (e.g. Palisade@Risk) it was possible to account for these individual uncertainties and aggregate them into a single estimate of uncertainty. Further, it is possible to determine the contribution of input values in the overall uncertainty of plot level estimates.
The analysis conducted identified some limitations in the uncertainty analysis such as data gaps for Indonesia specific decomposition and turnover rates and better estimates of uncertainty associated with area. However, overall the analysis demonstrates that a similar approach can be undertaken to account for all events and processes reported under INCAS.
Standard Methods for Estimating Greenhouse Gas Emissions from Forests and Peatlands in Indonesia (Version 2) | 77
A Tier 2 analysis is readily amendable to estimating the significance of individual input values on overall uncertainty estimates. This contrasts with the Tier 1 analysis (aggregation), which provides an estimate of overall emission but is less amenable to estimating the significance of individual components. Through identifying the input values with the most significance on uncertainty, research can be appropriately prioritized to reduce the overall uncertainty of the inventory. This aligns with the objective of the uncertainty analysis, which is to assist in improving inventories over time, not to validate the emissions estimates. As such, the Tier 2 analysis has clear benefits over a Tier 1 analysis.
8.7 LIMITATIONS
Data limitations are described in each of the standard methods that produced inputs. The INCAS framework is designed to enable simulations to proceed using the best available data, with assumptions used to fill data gaps. When improved data becomes available, the system can be rerun for the entire time series, producing consistent inter-annual results. Examples of data limitations for the national GHG inventory are outlined below.
• Broad biomass classes had to be adopted due to data limitations preventing more detailed forest stratification;
• Not all available spatial data could be used. This limited the level of detail attainable for area data, which reduced the potential accuracy of model outputs, because activity data (i.e. area) is one of the main factors influencing GHG emission estimates;
• Spatial and temporal accuracy of burnt area data has high uncertainty;
• The lack of clear definitions for forest degradation and sustainable management of forest meant that assumptions about inclusion of activities in each activity were needed. Different assumptions would lead to different allocation to each REDD+ activity.
Analysis limitations arise due to the characteristics of Indonesian forest management systems, forest types, soil types and data availability; this means that some processes and events in Indonesia are not easily quantified using FullCAM, which was originally designed to meet specific GHG emissions reporting requirements for Australia’s national GHG inventory reporting.
• FullCAM does not permit planting events to occur if there is already a forest present. This means that enrichment planting cannot be quantified as a single event.
• FullCAM cannot model a thinning response when using yield tables (e.g. when a primary forest is selectively harvested to become a secondary forest) as required in Indonesia, due to the unavailability of data required to use the tree yield formula. This means that when quantifying emissions from a selective harvest in primary forest (resulting in a secondary forest) it is necessary to firstly clear the existing forest, then plant a new secondary forest with initial biomass equivalent to the biomass stock of a mature secondary forest.
78 | Standard Methods for Estimating Greenhouse Gas Emissions from Forests and Peatlands in Indonesia (Version 2)
• Soil models within FullCAM are not suitable for Indonesian mineral soil types.
• FullCAM does not include organic soil (peat) as a pool that can be quantified.
• Some data required by FullCAM is not available in Indonesia, requiring default values or assumptions to be adopted (e.g. debris decay rates were not available for Indonesia, hence default decay rates were adopted from tropical rain forest in Australia).
8.8 IMPROVEMENT PLAN
• Parameterization and running the analysis should be an iterative process to enable data limitations to be effectively identified and rectified. For example, an iterative process between spatial analysis and suite and regime development would provide a more efficient and comprehensive basis for spatial allocation of regimes.
• Streamlining of spatial allocation of regimes would significantly improve the efficiency of the process and enable greater use of available spatial data. Development of a spatial analysis tool should be a priority.
• Improved methods for determining burnt area spatial extent, and the timing and frequency of fires should be developed.
• Cropland management events should be included in the deforestation estate file once area and emissions data become available.
• The approach for quantifying net emissions from oil palm and rubber estate areas should be developed as part of the agriculture land-use inventory component of future GHG inventories.
• More detailed soil information should be developed.
• More comprehensive uncertainty analysis should be conducted.
Standard Methods for Estimating Greenhouse Gas Emissions from Forests and Peatlands in Indonesia (Version 2) | 79
REFERENCES
Abdurrochim, S., Mandang, Y.I. and Uhaedi, S. 2004. Indonesian Wood Atlas, 3rd edition (in Indonesian). Research and Development Center for Forest Product Technology. Bogor.
Agus, F., Hairiah, K. and Mulyani, A. 2011. Measuring Carbon Stock in Peat Soil: Practical Guidelines. Bogor: World Agroforestry Centre (ICRAF) and Indonesian Soil Research Institute. Available from http://balittanah.litbang.deptan.go.id
Ballhorn, U., Navratil, P. and Siegert. F. 2014. Generation of spatial burned area data of the Central Kalimantan Province for the Indonesian National Carbon Accounting System (INCAS), Final Report Draft, June 2014, prepared for the Indonesia-Australia Forest Carbon Partnership. IAFCP, Jakarta.
Bertault, J.G. and Kadir, K. (eds.) Silvicultural research in a lowland mixed dipterocarp forest of East Kalimantan: the contribution of STREK project. CIRAD- Forêt, Montpellier.
Brown, I.F., Martinelli, L.A., Thomas, W.W., Moreira, M.Z., Ferreira, C.A. and Victoria, R.A. 1995. Uncertainty in the biomass of Amazonian forests: An example from Rondonia, Brazil. Forest Ecology and Management 75: 175–89.
Chave, J., Kira, T., Lescure, J.P., Nelson, B.W., Ogawa, H., Puig, H., Riéra, B., Yamakura, T., Andalo, C., Brown, S., Cairns, M.A., Chambers, J.Q., Eamus, D., Fölster, H., Fromard, F. and Higuchi, N. 2005. Tree allometry and improved estimation of carbon stocks and balance in tropical forests. Oecologia 145: 87–99.
Dharmawan, I.W.S. 2012. Evaluasi Dinamika Cadangan Karbon Tetap pada Hutan Gambut Primer dan Bekas Terbakar di Hampangen dan Kalampangan, Kalimantan Tengah. Disertasi Program Pascasarjana, Institut Pertanian Bogor, Bogor.
Directorate General of Forestry Planning. 2014. Forest Resource Potency from National Forestry Inventory Plots (in Indonesian). Ministry of Environment and Forestry, Jakarta.
Donato, D.C., Kauffman, J.B., Murdiyarso, D., Kurnianto, S., Stidham, M. and Kanninen, M. 2011. Mangroves among the most carbon-rich forests in the tropics. Nature Geoscience. 4, 293-297.
80 | Standard Methods for Estimating Greenhouse Gas Emissions from Forests and Peatlands in Indonesia (Version 2)
[FORDA] Forestry Research and Development Agency. 2013. Peraturan Kepala Badan Penelitian dan Pengembangan Kehutanan Nomor: P.01/VIII-P3KR/2012: Pedoman Penggunaan Model Alometrik untuk Pendugaan Biomassa dan Stok Karbon Hutan di Indonesia.
[FORDA] Forestry Research and Development Agency. 1993. Keputusan Kepala Badan Litbang Kehutanan No. 38/KPTS/VIII-HM.3/93. Pedoman Pembuatan dan Pengukuran Petak Ukur Permanen (PUP).
[GFOI] Global Forest Observations Initiative. 2013. Integrating remote-sensing and ground-based observations for estimation of emissions and removals of greenhouse gases in forests: Methods and guidance from the Global Forest Observations Initiative. Group on Earth Observations, Geneva.
[GOFC–GOLD] Global Observation of Forest and Land Cover Dynamics. 2009. A sourcebook of methods and procedures for monitoring and reporting anthropogenic greenhouse gas emissions and removals caused by deforestation, gains and losses of carbon stocks in forests remaining forests and forestation. GOFC-GOLD Report Version COP15-1. GOFCGOLD Project Office, Natural Resources Canada, Alberta.
Graham, L. and Mahyudi, A. 2013. Vegetation monitoring methodology. Kalimantan Forests and Climate Partnership (KFCP) Technical Paper.
Hardiansyah, G. 2011. Potensi Pemanfaatan Sistem TPTII untuk Mendukung Upaya Penurunan Emisi dari Deforestasi dan Degradasi Hutan (REDD) (Studi Kasus Areal IUPHHK-PT. Sari Bumi Kusuma di Kalimantan Tengah). Disertasi Program Pascasarjana. Institut Pertanian Bogor, Bogor.
Hashimoto, T., Tange, T., Masumori, M., Yagi, H., Sasaki, S. and Kojima, K. 2004. Allometric equations for pioneer tree species and estimation of the aboveground biomass of a tropical secondary forest in East Kalimantan. Tropics 14(1): 123–30.
Hiratsuka, M., Toma, T., Diana, R., Hadriyanto, D. and Morikawa, Y. 2006. Biomass recovery of naturally regenerated vegetation after the 1998 forest fire in East Kalimantan, Indonesia. Japan Agricultural Research Quarterly (JARQ) 40(3): 277-282 (http://www.jircas.affrc.go.jp).
Hooijer, A., Page, S., Navratil, P., Vernimmen, R., Van der Vat, M., Tansey, K., Konecny, K., Siegert, F., Ballhorn U. and Mawdsley, N. 2014. Carbon emissions from drained and degraded peatland in Indonesia and emission factors for measurement, reporting and verification (MRV) of peatland greenhouse gas emissions ‒ a summary of KFCP research results for practitioners. IAFCP, Jakarta.
Standard Methods for Estimating Greenhouse Gas Emissions from Forests and Peatlands in Indonesia (Version 2) | 81
Inoue, Y., Hadiyati, O., Affendi, A., Sudarma, K.R. and Budana, I.N. 1999. Sustainable Management Models for Mangrove Forest. The Development of Sustainable Mangrove Forest Management Project, the Ministry of Forestry and Estate Crops in Indonesia and Japan International Cooperation Agency.
[IPCC] Intergovernmental Panel on Climate Change. 2013. 2013 Supplement to the 2006 IPPC guidelines for national greenhouse gas inventories: Wetlands. Methodological guidance on lands with wet and drained soils and constructed wetlands for wastewater treatment. Gyldenkaerne, S. and Lin, E. (eds). Japan: Institute for Global Environmental Strategies [IGES].
[IPCC] Intergovernmental Panel on Climate Change. 2006. IPCC guidelines for national greenhouse gas inventories. National Greenhouse Gas Inventories Programme. Eggleston, H.S., Buendia, L., Miwa, K., Ngara, T. and Tanabe, K. (eds). Japan: Institute for Global Environmental Strategies [IGES].
[IPCC] Intergovernmental Panel on Climate Change. 2003. Good practice guidance for land use, land-use change and forestry. National Greenhouse Gas Inventories Programme. Penman, J., Gytarsky, M., Hiraishi, T., Krug, T., Kruger, D., Pipatti, R., Buendia, L., Miwa, K., Ngara, T. and Tanabe, K. (eds). Japan: Institute for Global Environmental Strategies [IGES].
Jaya, A., Siregar, U.J., Daryono, H. and Suhartana, S. 2007. Biomassa hutan rawa gambut tropika pada berbagai kondisi penutupan lahan. Jurnal Penelitian Hutan dan Konservasi Alam 4: 341–52.
Junaedi, A. 2007. Dampak Pemanenan Kayu dan Perlakuan Silvikultur Tebang Pilih Tanam Jalur (TPTJ) terhadap Potensi Kandungan Karbon dalam Vegetasi di Hutan Alam Tropika (Studi Kasus di Areal IUPHHK PT Sari Bumi Kusuma, Kalimantan Tengah). Thesis Program Pascasarjana, Institut Pertanian Bogor, Bogor.
Krisnawati, H., Adinugroho, W.C., Imanuddin, R. and Hutabarat, S. 2014. Estimation of forest biomass for quantifying CO2 emissions in Central Kalimantan: A comprehensive approach in determining forest carbon emission factors. Forestry Research and Development Agency, Bogor.
Krisnawati, H., Imanuddin, R., Adinugroho, W.C. and Hutabarat, S. 2015a. Standard Methods for Estimating Greenhouse Gas Emissions from the Forestry Sector in Indonesia (version 1). Forestry Research and Development Agency, Bogor.
Krisnawati, H., Adinugroho, W.C., Imanuddin, R. and Hutabarat, S. 2015b. Estimation of Annual Greenhouse Gas Emissions from Forest and Peat Lands in Central Kalimantan. Forestry Research and Development Agency, Bogor.
82 | Standard Methods for Estimating Greenhouse Gas Emissions from Forests and Peatlands in Indonesia (Version 2)
Krisnawati, H., Adinugroho, W.C. and Imanuddin, R. 2013. Assessing dryland forest ecosystem services as potential carbon storage in West Rinjani Protection Forest, West Nusa Tenggara, Indonesia. Research report. Research and Development Center for Conservation and Rehabilitation, Bogor.
Krisnawati, H., Adinugroho, W.C. and Imanuddin, R. 2012. Monograph: Allometric models for estimating tree biomass at various forest ecosystem types in Indonesia. Forestry Research and Development Agency, Bogor.
Krisnawati, H., Kallio, M. and Kanninen, M. 2011. Acacia mangium Willd.: Ecology, silviculture and productivity. CIFOR, Bogor.
Krisnawati, H. and Keith, H. 2010. Biomass estimates for carbon accounting in Indonesia. Preliminary Report to Indonesia–Australia Forest Carbon Partnership. IAFCP, Jakarta.
[LAPAN] Lembaga Penerbangan dan Antariksa Nasional. 2014. The Remote Sensing Monitoring Program of Indonesia’s National Carbon Accounting System: Methodology and Products, Version 1. LAPAN–IAFCP, Jakarta.
Limbong, H.D.H. 2009. Potensi Karbon Tegakan Acacia crassicarpa pada Lahan Gambut Bekas Terbakar (Studi Kasus IUPHHK-HT PT. SBA Wood Industries, Sumatera Selatan). [Tesis]. Sekolah Pascasarjana, Institut Pertanian Bogor, Bogor.
Ludang, Y. and Jaya, H.P. 2007. Biomass and carbon content in tropical forest of Central Kalimantan. Journal of Applied Sciences in Environmental Sanitation 2: 7–12.
Manuri, S., Brack, C., Nugroho, N.P., Hergoualc’h, K., Novita, N., Dotzauer, H., Verchot, L., Putra, C.A.S. andWidyasari, E. 2014. Tree biomass equations for tropical peat swamp forest ecosystems in Indonesia. Forest Ecology and Management 334: 241-253.
Martawidjaya, A., Kartasujana, I., Mandang, Y.I., Parwira, S.A. and Kadir, K. 2005. Indonesian Wood Atlas, 2nd edition (revised version) (in Indonesian). Research and Development Center for Forest Product Technology. Bogor.
Meunpong, P., Wachrinrat, C., Thaiutsa, B., Kanzaki, M. and Meekaew, K. 2010. Carbon pools of indigenous and exotic trees species in a forest plantation, Prachuap Khiri Khan, Thailand. Kasetsart Journal, Natural Sciences 44: 1044–57.
[MOF] Ministry of Forestry. 2004. Peraturan Menteri Kehutanan Republik Indonesia No. P.14/Menhut-II/2004. Tata Cara Aforestasi dan Reforestasi dalam Kerangka Mekanisme Pembangunan Bersih.
[MOF] Ministry of Forestry. 1995. Keputusan Menteri Kehutanan No. 237/Kpts-II/1995. Petak Ukur Permanen untuk Pemantauan Pertumbuhan dan Riap Tegakan di Hutan Alam.
Standard Methods for Estimating Greenhouse Gas Emissions from Forests and Peatlands in Indonesia (Version 2) | 83
Moser, G., Leuschner, C., Hertel, D., Graefe, S., Soethe, N. and Lost, S. 2011. Elevation effects on the carbon budget of tropical mountain forests (S Ecuador): The role of the belowground compartment. Global Change Biology 17: 2211–26.
Murdiyarso, D., Purbopuspito, J., Kauffman, J.B., Warren, M.W., Sasmito, S.D., Manuru, S., Krisnawati, H., Taberima, S. and Kurnianto, S. 2015. The potential of Indonesian mangrove forests for global climate change mitigation. Nature Climate Change. Published online 17 July 2015. doi:10.1038/nclimate2734
Murdiyarso, D., Donato, D., Kauffmann, J.B., Kurnianto, S., Stidham, M. and Kanninen, M. 2009. Carbon storage in mangrove and peatland ecosystems: a preliminary accounts from plots in Indonesia. CIFOR Working Paper 48.
Myhre, G., Shindell D., Breon F.-M., Collins, W., Fuglestvedt, J., Huang, J., Koch, D., Lamarque, J.-F., Lee, D., Mendoza, B., Nakajima, T., Robock, A., Stephens, G., Takemura T. and Zhang, H. 2013. Anthropogenic and natural radiative forcing. In: Stocker, T.F., Qin, D., Plattner, G.-K., Tignor, M., Allen, S.K., Boschung, J., Nauels, A., Xia,Y., Bex V. and Midgley, P.M. (eds.). Climate Change 2013: The Physical Science Basis. Contribution of Working Group to the Fifth Assessment Report of the Intergovernmental Panel on Climate Change Cambridge University Press, Cambridge.
Niiyama, K., Kajimoto, T., Matsuura, Y., Yamashita, T., Kassim, A.R., Ripin, A. and Noor, N. 2005. Allometric relationship between stem diameter, tree height, leaf, stem and root biomass in Pasoh Forest Reserve. In: Okuda, T.K. (ed.). Annual report of NIES/FRIM/UPM Joint Project Tropical Ecology and Biodiversity 2005. Alles Druck Inc., Tsukuba. 22–36.
Nguyen-The, N, Favrichon, V., Sist, P., Houde, L., Bertault, J.G. and Fauvet, N. 1998. Growth and mortality pattern before and after logging. In: Bertault, J.G. and Kadir, K., (eds). Silvicultural Research in A Lowland Mixed Dipterocarp Forest of East Kalimantan. The Contribution of STREK Project. Jakarta(ID):CIRAD-Forêt-FORDA-PTInhutani I. 181–4.
Oey, D.S. 1964. Berat Jenis dari Jenis-Jenis Kayu Indonesia dan Pengertian Beratnya untuk Keperluan Praktek. Komunikasi No 13. Lembaga Penelitian Hutan.
Page, S., Tansey, K., Navratil, P., Hooijer, A. and Mawdsley, N. 2014. Measuring emissions from peat fire: Commentary on a proposed methodology for Indonesia. Draft report, prepared for the Indonesia-Australia Forest Carbon Partnership. IAFCP, Jakarta.
Purba, K.D., Rahmawaty and Riswan. 2012. Pendugaan Cadangan Karbon Aboveground Biomass (AGB) pada Tegakan Sawit (Elaeis guineensis Jacq.) di Kabupaten Langkat. Program Studi Kehutanan, Fakultas Pertanian, Universitas Sumatera Utara.
84 | Standard Methods for Estimating Greenhouse Gas Emissions from Forests and Peatlands in Indonesia (Version 2)
Putz, F.E. and Chan, H.T. 1986. Tree growth, dynamics and productivity in a mature mangrove forest in Malaysia. Forest Ecology and Management 17: 211–30.
Priyadi, H., Gunarso, P. and Kanninen, M. (eds.) 2005. Permanent sample plots: More than just forest data. Proceedings of International Workshop on Promoting Permanent Sample Plots in Asia and the Pacific Region: Bogor, Indonesia, 3–5 August 2005. Center for International Forestry Research (CIFOR), 2006.
Revilla, J.A.V. 1992. Step-by-Step Field Sampling Procedures for the NFI Project. Indonesia UTF/INS/066/ INS National Forest Inventory Working Document No. 3. Food and Agriculture Organisation of the United Nations. Jakarta.
Reyes, G., Brown, S., Chapman, J, and Lugo, A.E. 1992. Wood densities of tropical tree species. General Technical Report SO-88. USDA Forest Service, Southern Forest Experiment Station, New Orleans, Louisiana, USA.
Richards, G.P. 2005. The FullCAM carbon accounting model (version 3.0) user manual. Australian Greenhouse Office, Canberra.
Richards, G.P. 2001. National carbon accounting system technical report no. 28. The FullCAM carbon accounting model: development, calibration and implementation for the national carbon accounting system. Australian Greenhouse Office, Canberra.
Richards, G. and Evans, D. 2000. National Carbon Accounting System. Technical Report No. 26, Carbon Accounting Model for Forests (CAMFor) User Manual Version 3.35
Rutishauser, E., Noor’an, F., Laumonier, Y., Halperin, J., Rufi’ie, Hergoualc’h, K. and Verchot, L. 2013. Generic allometric models including height best estimate forest biomass and carbon stocks in Indonesia. Forest Ecology and Management 307: 219–25.
Saharjo, B.H. 2011. Carbon baseline as limiting factor in managing environmental sound activities in peatland for reducing greenhouse gas emission. Biodiversitas 12(3): 182–6.
Simbolon, H. 2003. Proses awal pemulihan hutan gambut Kalampangan - Kalimantan Tengah pasca kebakaran hutan Desember 1997 dan September 2002. Wetlands International – Indonesia Programme.
Siran, S.A. 2005. The importance of STREK plots in contributing sustainable forest management in Indonesia. In: Priyadi, P., Gunarso, P. and Kanninen, M. (eds). Permanent sample plots: More than just forest data. Proceedings of International Workshop on Promoting Permanent Sample Plots in Asia and the Pacific Region: Bogor, Indonesia, 3–5 August 2005. Bogor, Indonesia.
Suharlan, A., Sumarna, K. and Sudiono, J. 1975. Tabel Tegakan Sepuluh Jenis Kayu Industri (Yield table of ten industrial wood species). Pusat Penelitian dan Pengembangan Hutan, Bogor.
Standard Methods for Estimating Greenhouse Gas Emissions from Forests and Peatlands in Indonesia (Version 2) | 85
Susilowati, S. 2011. Pendugaan Cadangan Karbon (Carbon Stock) dan Neraca Karbon Pada Perkebunan Karet (Studi Kasus: PTPN VIII Cibungur Sukabumi, Jawa Barat). [Skripsi]. Departemen Geofisika dan Meteorologi, Institut Pertanian Bogor, Bogor.
Uhl, C. and Kauffman, J.B. 1990. Deforestation, fire susceptibility, and potential tree responses to fire in Eastern Amazon. Ecology 71: 437-449.
Verwer, C.C. and van der Meer, P.J..2010. Carbon pools in tropical peat forest – towards a reference value for forest biomass carbon in relatively undisturbed peat swamp forest in Southeast Asia. Alterra-report 2108. Alterra Wageningen UR. Wageningen.
Wahyunto, S., Ritung and Subagjo, H. 2004. Map of Peat land Distribution Area and Carbon Content in Kalimantan, 2000 – 2002. Wetlands International - Indonesia Programme & Wildlife Habitat Canada (WHC).
Yuniawati, Budiaman, A. and Elias. 2011. Estimasi Potensi Biomassa dan Massa Karbon Hutan Tanaman di Lahan Gambut (Studi Kasus di Areal HTI Kayu Serat di Pelalawan, Propinsi Riau). Jurnal Penelitian Hasil Hutan 29(4): 343–55.
86 | Standard Methods for Estimating Greenhouse Gas Emissions from Forests and Peatlands in Indonesia (Version 2)
Appendix 1. List of INCAS Database
No Name of Database Description
1 FullCAM Database
The database contains information on parameter, value, assumptions and references/source of the data used as inputs in FullCAM. It includes:
• Initial condition of trees (AGB, stem, branch, bark, leaves, coarse root, fine roots)
• Initial condition of debris (deadwood decomposable, deadwood resistant, bark litter decomposable, bark litter resistant, leaf litter decomposable, leaf litter resistant, coarse dead root decomposable, coarse dead root resistant, fine dead root decomposable, fine dead root resistant)
• Carbon % of (dry) trees (stem, branch, bark, leaves, coarse root, fine roots)
• stem density (kgdm/m3)
• Turnover % of branch, bark, leaves, coarse root, fine roots
• Resistant % of trees (stem, branch, bark, leaves, coarse root, fine roots)
• Breakdown % of debris (deadwood decomposable, deadwood resistant, bark litter decomposable, bark litter resistant, leaf litter decomposable, leaf litter resistant, coarse dead root decomposable, coarse dead root resistant, fine dead root decomposable, fine dead root resistant)
• Atmospheric % of debris breakdown (deadwood decomposable, deadwood resistant, bark litter decomposable, bark litter resistant, leaf litter decomposable, leaf litter resistant, coarse dead root decomposable, coarse dead root resistant, fine dead root decomposable, fine dead root resistant)
2 Event_FullCAM Database
The database contains information on the events modelled in each type of forest (e.g. land clearing, clearing duw to illegal harvesting, selective harvesting with conventional technique, selective harvesting with RIL tehnique, Intense fire, moderate fire, Planting). Information available on each event for each forest type includes parameters used for FullCAM, value, assumption and reference used
3 Growth Database
The database contains information on the growth from 48 species and forest condition including data and references used, process employed in model development to obtain CAI values as inputs for FullCAM
APPENDIX
Standard Methods for Estimating Greenhouse Gas Emissions from Forests and Peatlands in Indonesia (Version 2) | 87
No Name of Database Description
4 Suite_Regime Database
The database contains information on 1152 regimes (land management) at certain suite that have been generated based on a combination of F/NF Class, Initial Land Category, Initial Forest Type, Forest Function, Soil Type, Harvest system, Estate crop, Fire, F/NF Transition and Subsequent Land Category. Suite represents a specific area with a a specific regime that will be modelled in FullCAM.
5 Regime area Database
Regime area database is developed for each province (34 provinces in Indonesia). Regime area present the result of spatial allocation of the regime that will be modelled. The database contains information on regime code, parameters used to create suite, area, event timing and plot file of the regime.
6 Result Database
The database contains information on the results of emissions calculation and the area modelled at various carbon pool (aboveground biomass, belowground biomass, litter, deadwood, soil) and other sources of emissions (peat fire, peat biological oxidation) based on forest type, forest function, soil type, activity and province for easy reporting.
ISBN 978-979-8452-65-9
9 789798 452659
This publication describes in detail the standard methods of the Indonesian National Carbon Accounting System (INCAS) to quantify net greenhouse gas (GHG) emissions from forests and peatlands in Indonesia in a transparent, accurate, complete, consistent and comparable manner. The standard methods describe the approach and methods used for data collation, data analysis, quality control, quality assurance, modelling and reporting. The standard methods cover (i) Initial Conditions, (ii) Forest Growth and Turnover, (iii) Forest Management Events and Regimes, (iv) Forest Cover Change, (v) Spatial Allocation of Regimes, (vi) Peatland GHG Emissions, and (vii) Data Integration and Reporting. This second version of the standard methods includes improvements implemented in preparing the first comprehensive national GHG inventory for forests and peatlands, the results of which are reported in National Inventory of Greenhouse Gas Emissions and Removals on Indonesia’s Forests and Peatlands. This publication has been prepared and published by the Indonesian Ministry of Environment and Forestry, under the Research, Development and Innovation Agency.