National Park Service U.S. Department of the Interior Natural Resource Stewardship and Science Mussel Bed Sampling Standard Operating Procedure, v. 1.2, Southwest Alaska Inventory and Monitoring Network Natural Resource Report NPS/SWAN/NRR—2016/1175
Transcript
National Park Service U.S. Department of the Interior
Natural Resource Stewardship and Science
Mussel Bed Sampling Standard Operating Procedure, v. 1.2, Southwest Alaska Inventory and Monitoring Network Natural Resource Report NPS/SWAN/NRR—2016/1175
ON THE COVER Mussel bed, Kenai Fjords National Park. Photograph courtesy of James L. Bodkin, USGS.
Mussel Bed Sampling ─ Version 1.2 Standard Operating Procedure, v. 1.2, Southwest Alaska Inventory and Monitoring Network Natural Resource Report NPS/SWAN/NRR—2016/1175
James L. Bodkin1, Thomas A. Dean2, Heather A. Coletti3, and Brenda E. Ballachey1 1U.S. Geological Survey Alaska Science Center 4210 University Drive Anchorage, AK 99508 2Coastal Resources Associates, Inc. 5190 El Arbol Drive Carlsbad, CA 92008 3National Park Service Southwest Alaska Network 4175 Geist Road Fairbanks, AK 99709
March 2016 U.S. Department of the Interior National Park Service Natural Resource Stewardship and Science Fort Collins, Colorado
ii
The National Park Service, Natural Resource Stewardship and Science office in Fort Collins, Colorado, publishes a range of reports that address natural resource topics. These reports are of interest and applicability to a broad audience in the National Park Service and others in natural resource management, including scientists, conservation and environmental constituencies, and the public.
The Natural Resource Report Series is used to disseminate comprehensive information and analysis about natural resources and related topics concerning lands managed by the National Park Service. The series supports the advancement of science, informed decision-making, and the achievement of the National Park Service mission. The series also provides a forum for presenting more lengthy results that may not be accepted by publications with page limitations.
All manuscripts in the series receive the appropriate level of peer review to ensure that the information is scientifically credible, technically accurate, appropriately written for the intended audience, and designed and published in a professional manner.
This report received formal peer review by subject-matter experts who were not directly involved in the collection, analysis, or reporting of the data, and whose background and expertise put them on par technically and scientifically with the authors of the information.
Views, statements, findings, conclusions, recommendations, and data in this report do not necessarily reflect views and policies of the National Park Service, U.S. Department of the Interior. Mention of trade names or commercial products does not constitute endorsement or recommendation for use by the U.S. Government.
This report is available in digital format from Southwest Alaska Inventory & Monitoring Network website (http://science.nature.nps.gov/im/units/swan/), and the Natural Resource Publications Management website (http://www.nature.nps.gov/publications/nrpm/). To receive this report in a format optimized for screen readers, please email [email protected].
Please cite this publication as:
Bodkin, J. L., T. A. Dean, H. A. Coletti, and B. E. Ballachey. 2016. Mussel bed sampling: standard operating procedure, v. 1.2, Southwest Alaska Network. Natural Resource Report NPS/SWAN/NRR—2016/1175. National Park Service, Fort Collins, Colorado.
Revision History Log All edits and amendments made to this document since its inception should be recorded in the table below. Users of this protocol should promptly notify the project leader of the marine nearshore monitoring program of recommended edits or changes. The project leader will review and incorporate suggested changes as necessary, record these changes in the revision history log, and modify the date and version number on the title page of this document to reflect these changes.
Revision History Log:
Previous Version #
Revision Date Author Changes Made Reason for Change New Version #
Version 1.0 08/12/2010 Coletti Formatting; updating to reflect SWAN
To meet NRR standards NA
Version 1.0 05/29/2012 Coletti Delineation of edge of bed – clarification
Clarification 1.1
Version 1.1 June 2014-November 2015
Ballachey/Bodkin
Final revisions and inclusion of GWA mussel sites in PWS; revision of core sampling methods
Clarification and inclusion of PWS mussel sites. Revised procedure for core sample collections. Incorporate final reviews.
1.2
Version 1.2 December 2015 NPS Formatting Finalization
[Add rows as needed for each change or set of changes associated with each version.]
v
Contents Page
Revision History Log ............................................................................................................................iii
Figures and Tables ............................................................................................................................... vii
Executive Summary .............................................................................................................................. ix
Acknowledgments ................................................................................................................................. ix
1. Background and Objectives ............................................................................................................... 1
2.2. Selecting Sampling Units ........................................................................................................ 3
2.3. Recommended Frequency and Timing of Sampling ............................................................... 3
2.4. Level of Change that Can be Detected .................................................................................... 4
3. Field Season ....................................................................................................................................... 5
3.1. Overview and General Methods .............................................................................................. 5
3.1.1. Initial Site Layout and Slope Determination ................................................................... 6
3.2. 3.3 Field Season Preparation ................................................................................................. 12
3.3. 3.4 Field Season Preparation and Equipment List ................................................................ 13
3.4. 3.5 Post-collection Processing of Data ................................................................................. 13
6.2. Annual Workload and Field Schedule ................................................................................... 19
6.3. Facility and Equipment Needs ............................................................................................... 19
7. 7 Procedures for Revising the Protocol............................................................................................ 19
8. Literature Cited ................................................................................................................................ 21
Appendix A. Sample Datasheet .......................................................................................................... 23
vii
Figures and Tables Page
Figure 1. Areas for sampling mussels within the KATM, KEFJ, and PWS blocks. ............................. 1
Figure 2. A hypothetical mussel bed including one horizontal 50 m baseline transect (bold) and 10 variable length vertical transect lines that extend from the upper margin, to the lower margin of the bed (or zero tidal elevation if bed continues below MLLW) .......................... 6
Figure 3. A hypothetical single vertical transect, 10.5 m in length, sampled at 5.25 m, based on a random number between 0 and 1 of .50 ............................................................................... 9
Table 1. Quadrat dimensions and areas. .............................................................................................. 11
ix
Executive Summary Pacific blue mussels are a common and important species in shallow marine habitats throughout much of the north Pacific. They can occupy a large proportion of the intertidal zone and occur across a variety of habitats. They are filter feeding bivalve that relies on both phytoplankton and detrital kelps. They transfer their secondary production to a wide array of higher trophic level consumers that include predatory invertebrates, birds and mammals. Here we describe a procedure for annual monitoring of mussels at sites within Katmai National Park and Preserve, Kenai Fjords National Park and Prince William Sound. Sampling occurs along fixed horizontal transects that allow estimation of: 1) the size of the mussel bed, 2) the density of mussels larger than 19mm, and 3) the density of all mussels within the mussel bed. Sample design provides for the statistical expansion of mussel estimates across each region.
Acknowledgments We appreciate the support of the Department of Interior, National Park Service, Southwest Alaska Network and the US Geological Survey, Alaska Science Centers. Alan Bennet, Bill Thomas and Michael Shepard provided assistance in developing this SOP. Critical review provided by Dr. Terrie Klinger and Mandy Lindeberg improved the document significantly.
1
1. Background and Objectives 1.1. Introduction The purpose of this procedure is to assess change in dimensions of mussel beds and the density and size distribution of mussels (Mytilus trossulus, <20 mm) within those beds. These data will be used primarily as an indicator of mussel prey availability for various vertebrate predators, including sea otters (Enhydra lutris), black oystercatchers (Haematopus bachmani), sea ducks (Merginae), and sea stars (Asteroidea). Specifically, the objectives are to assess changes in (1) the size of randomly selected mussel beds, (2) the density of mussels within these beds, and (3) the size distribution of mussels within the beds. Sampling will be conducted in sheltered rocky habitats within the Katmai National Park and Preserve (KATM), Kenai Fjords National Park (KEFJ), and Prince William Sound (PWS; Figure 1).
Figure 1. Areas for sampling mussels within the KATM, KEFJ, and PWS blocks.
1.2. Rationale for Sampling Mussel Beds Pacific blue mussels (Mytilus trossolus) are a conspicuous and abundant filter-feeding marine invertebrate in the intertidal zone. Mussels are widely distributed and form relatively monotypic
2
stands of larger individuals, termed mussel beds. Although a number of factors influence the abundance and distribution of mussels such as environment, disturbance, predation, and competition, they can be a competitively dominant intertidal species (Dayton 1971). Within the nearshore food web, mussels are a source of energy to a wide array of invertebrate, avian, and mammalian predators (Knox 2000, Menge and Branch 2001) and are critically important prey for sea otters, black oystercatchers, harlequin ducks (Histrionicus histrionicus), Barrows goldeneye (Bucephala islandica), and several species of sea stars (Webster 1941, Paine 1974, Goudie and Ankney 1986, Van Blaricom 1988).
1.3. Measurable Objective Specifically, the objectives of this procedure are to assess changes in:
• size (area) of selected mussel beds;
• density of mussels within these beds; and
• size distribution of mussels, specifically including those ≥ 20 mm in length, within the beds.
3
2. Sampling Design 2.1. Rationale Changes in mussel beds will be assessed primarily by estimating the area of the bed, and mussel density and size distribution within those beds over time. Initially, sampling will be conducted annually and frequency may be modified as justified following appropriate analyses after five or more years of data collection. A stratified random sampling design will be used, with mussel sampling locations based on proximity to the stratified random sample of sites selected for the rocky intertidal algae and invertebrate sampling of sheltered rocky habitats (Dean et al. 2014).
Mussel bed size, mussel density, and mussel size distribution were selected for their importance to predators. The rocky intertidal algae and invertebrate standard operating procedure (SOP; Dean 2011) addresses monitoring the percent cover (abundance) of mussels over time. This mussel specific SOP, however, addresses components of mussel ecology that could not be discerned solely with percent cover data. Specifically, we will estimate the area of beds or assemblages of mussels, mussel density within those beds, and size distributions of all mussels, and specifically mussels ≥ 20 mm, a size typically consumed by vertebrate predators. The techniques used in this SOP are similar to those used in other large-scale monitoring programs and associated research activities (Engle 2008, Blanchette and Gaines 2007) and will provide data that are comparable both within and beyond the geographical scope of the Southwest Alaska Network (SWAN) and Gulf Watch Alaska Nearshore monitoring programs. In addition, using established size-to-biomass conversions (Oftedal et al. 2008) for mussels, data from this SOP can be used to model aspects of nearshore ecosystem energetics (Dean et al. 2002).
2.2. Selecting Sampling Units A total of 25 sites have been established for sampling in the Gulf of Alaska (Figure 1). These include five sites each at KATM and KEFJ and 15 sites in PWS (five sites each in western (intensive), and northern, and eastern areas (extensive). Sites were selected as those mussel beds with a minimum dimension of 50 m in shoreline length, and closest to the sheltered rocky sampling sites that were selected in KATM, KEFJ, and PWS.
Mussel beds are defined as shorelines with mussels occurring over a minimum distance (parallel to the water’s margin) of more than 50 m length (optimally 100 m, see below) and with approximate densities of large mussels (≥20 mm in total length) of 50 to >100 per square meter.
2.3. Recommended Frequency and Timing of Sampling Visits will be made annually to each intensive site for at least the first five years. Sampling frequency may be revised following a five-year sensitivity and power analysis and will be less frequent at extensive sites.1
1 Extensive mussel sites at northern and eastern PWS were dropped from repeated sampling in 2016.
4
2.4. Level of Change that Can be Detected It is the goal of the sampling to detect a 50% change in the area of the mussel bed and a 20% change in density of larger mussels (≥ 20 mm). The level of change that can be detected in small mussels (< 20 mm, derived from cores) will require analysis of initial data. Trends over time at each site as well as time by location interactions will be examined (see Nearshore Protocol Narrative, Dean et al. 2014). At present, there is insufficient information on the extent of variation between sites and times to conduct appropriate power analyses.
5
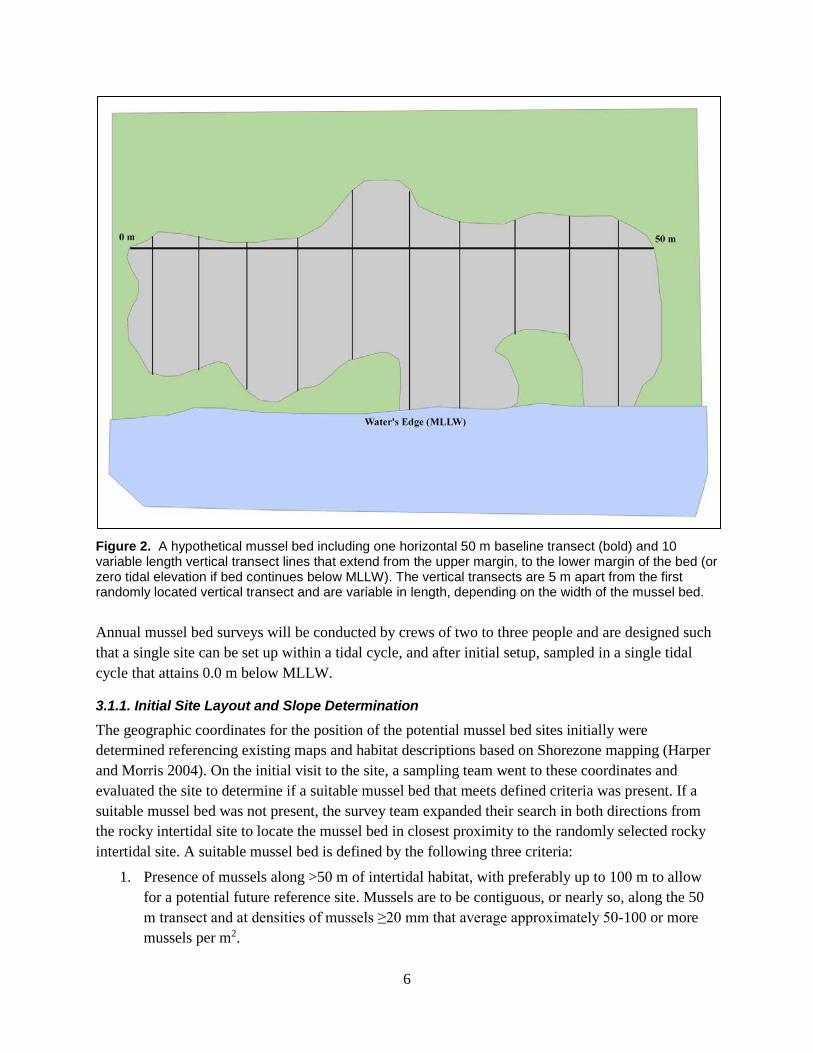
3. Field Season 3.1. Overview and General Methods Sampling sites (mussel beds) are defined as 50 m stretches of coastline with contiguous or nearly contiguous mussels. We identified 100 m of contiguous mussel bed as a selection criterion to provide for a potential future reference site, adjacent to the portion of the bed sampled. In some cases, mussel beds between 50 m and 100 m sufficed for site establishment. We began the process of identifying mussel beds in proximity to rocky intertidal sites at KATM in 2008 and in later years in other regions. Mussel sampling sites are established at the mussel beds closest to randomly selected sheltered rocky sites (see Nearshore Protocol Narrative, Dean et al. 2014). Sampling of mussel beds includes estimation of the area of bed within the 50 m defining horizontal transect, the average density of all mussels (based on core samples), the average density of larger (greater than or equal to 20 mm) mussels (based on quadrat sampling), and the size distribution of all mussels and mussels >20 mm. Sampling is conducted within quadrats and cores randomly placed along vertical transects evenly distributed along the 50 m horizontal transect that defines the sampling space within each selected mussel bed (Figure 2). The positions of ten evenly spaced vertical transects that intersect the 50 m horizontal transect will be determined annually with a random start point between the zero and 4.75 m mark on the horizontal transect. Subsequent vertical transects are spaced at 5 m intervals from the first vertical transect. Sampling locations of mussels along each vertical transect will be computed by multiplying the length of the vertical transect by a random number between 0.00 and 1.0 (a different random number is used for each vertical transect). The systematic placement of subsampling units will ensure relative equal distribution of sampling effort within the site. The location of the site and the horizontal transect will be fixed through GPS coordinates and stainless steel eyebolts (and at some sites, steel posts) attached into the substrate.
6
Figure 2. A hypothetical mussel bed including one horizontal 50 m baseline transect (bold) and 10 variable length vertical transect lines that extend from the upper margin, to the lower margin of the bed (or zero tidal elevation if bed continues below MLLW). The vertical transects are 5 m apart from the first randomly located vertical transect and are variable in length, depending on the width of the mussel bed.
Annual mussel bed surveys will be conducted by crews of two to three people and are designed such that a single site can be set up within a tidal cycle, and after initial setup, sampled in a single tidal cycle that attains 0.0 m below MLLW.
3.1.1. Initial Site Layout and Slope Determination
The geographic coordinates for the position of the potential mussel bed sites initially were determined referencing existing maps and habitat descriptions based on Shorezone mapping (Harper and Morris 2004). On the initial visit to the site, a sampling team went to these coordinates and evaluated the site to determine if a suitable mussel bed that meets defined criteria was present. If a suitable mussel bed was not present, the survey team expanded their search in both directions from the rocky intertidal site to locate the mussel bed in closest proximity to the randomly selected rocky intertidal site. A suitable mussel bed is defined by the following three criteria:
1. Presence of mussels along >50 m of intertidal habitat, with preferably up to 100 m to allow for a potential future reference site. Mussels are to be contiguous, or nearly so, along the 50 m transect and at densities of mussels ≥20 mm that average approximately 50-100 or more mussels per m2.
7
2. Terrain suitable for sampling, based primarily on slope (vertical rock faces extending into deep water were not suitable).
3. Suitable habitat that includes consolidated rock and unconsolidated sediments from boulder to cobble. Finer sediments may be present, but not predominant.
When a suitable bed was located, a permanent marker was placed at or near the upper vertical margin of the mussel bed, at or near the left (shore-facing) edge of the mussel bed. A second permanent marker was established 50 m (following the contour of the beach and mussels and generally parallel to the water’s edge) to the right (while facing the left edge marker looking shoreward). The left edge marker is a stainless steel tag affixed to the substrate using stainless steel screws and anchors and identifying the site name and number. The coordinates, in decimal degrees, of the beginning and end marker positions were recorded. The 50 m tape extended along the shoreline parallel to the water’s edge from the left edge marker to the right edge marker defines the permanent baseline (horizontal transect) for sampling (Figure 2). Permanent eyebolts were placed along the length of the 50 m baseline tape, at a frequency sufficient to replicate the placement of the permanent baseline for subsequent sampling. Site photos that include the location of the baseline tape and prominent physical features were taken subsequent to establishment of the 50 m baseline. Additional permanent markers (rebar posts, cable ties on eye bolts) were installed at some sites to facilitate relocation of the baseline transect. When cable ties were used, the eye bolts located at the beginning and end (0 and 50 m) of the horizontal transect were marked with a double cable tie.
Following initial set-up, the slope profile at the site was determined as follows:
At the start (zero or left end when facing shoreward) and at 5 intervals along the baseline tape (at 0, 12.5, 25, 37.5, and 50 m on the horizontal tape), the elevation of the horizontal transect relative to tidal elevation was determined with a stadia rod and sight level. This was done when the tidal elevation was at 0 MLLW. Using the stadia rod placed at the water’s edge and a sight level, the elevation and distance of the horizontal transect above MLLW, and the slope of the mussel site, were determined and recorded.
Dimensions of the Mussel Bed Once the 50 m baseline transect is tape is stretched, the sampling team will determine the position of placement for 10 vertical transects that intersect the horizontal baseline using a prepared spreadsheet (Figure 2, Appendix A). The initial vertical transect will be based on a random number between 0.00 and 4.75. Nine subsequent vertical transects will be established at 5 m intervals from the initial random location (Figure 2).
For the vertical transects, a surveyor’s tape is placed vertically along the width of the bed, perpendicular to the 50 m baseline transect. Care should be taken to lay the line as linear and perpendicular as possible without consideration of the presence or absence of mussels below the tape. A 0.25 m2 or larger quadrat is used to establish and maintain perpendicularity to the 50 m line. The length of the vertical transects will vary with the size and shape of the bed. In some cases, based on complex shorelines, it will be evident that adjacent vertical transects could cross one another if strict adherence to maintaining a perpendicular orientation from the baseline were followed. In these cases
8
one should strive to maximize parallelism and minimize convergence of adjacent vertical transects. There is no minimum transect length and transects should not overlap.
The length of each vertical transect from the upper end (referred to as zero) to the lower end of the bed (or zero tidal elevation if bed continues below MLLW) should be recorded on a data sheet. In some cases, mussels will be present above the horizontal baseline, and the vertical transect should begin at the uppermost mussels that fall beneath the transect tape, and the distance from the upper end of the vertical transect to the horizontal baseline should be recorded (Appendix A). When mussels begin below the horizontal baseline, the distance from the baseline to the first mussels below the vertical transect tape is recorded. If the distance below the horizontal transect to the first mussel beneath the tape is >1.0 m, the length for this vertical transect will be zero, but if mussels occur below this level, this needs to be recorded (see note, below). The vertical transect measurements will be used to estimate the size, or area of the mussel bed. The prepared data sheet includes a line for each vertical transect on which the measurements should be recorded, with a 0 indicating the start of the transect (may be above, at, or below the horizontal baseline), H the point at which the vertical crosses the horizontal, and E the lower end of the vertical transect.
Defining the Presence of Mussels The upper and lower limits of the mussel bed are defined by the presence of mussels immediately beneath each of the vertical transect tapes. The bed is considered to be contiguous along the vertical transect tape when mussels of any size are detected immediately beneath the width of the tape (approximately 12 mm) without a gap of more than 1 m. The bed is considered discontinuous when mussels are not observed along a distance of 1 m or more from the last mussel(s) detected. If the bed is discontinuous, the total length of the vertical transect should only incorporate the area that is continuous.
To determine placement of the quadrat, each of the vertical transect lengths will then be multiplied by an independent random number between 0.00 and 1.00, to two significant digits (random numbers are predetermined and included on the prepared data sheets). The resulting number will identify the location along the vertical transect where the quadrat will be placed, for sampling of mussel density and size. A quadrat may extend beyond the vertical dimension of the transect when the random number approaches 1.0.
Note: Although the vertical transect length will only incorporate the portion of the mussel bed that is considered to be continuous (defined as mussels beneath the tape with no more than a 1 m “gap” between mussels), it is still necessary to record on the data sheet whether or not there are additional mussels beyond the end of the vertical transect, i.e., past the 1 m gap. If there are mussels beyond the end, the distance (in cm) that those mussels extend should be recorded, using the same criterion, i.e., the distance to the furthest mussel that is located beneath the vertical transect tape (or zero tidal elevation if bed continues below MLLW). It is not necessary to record gaps in this extended section of the vertical transect. This extended measurement should be shown on the line drawing (on the data sheet) for each of the vertical transects.
9
Sampling Along the Vertical Transect Mussel sampling along each vertical transect includes (1) a core sample(s) to estimate the density and size distribution of all mussels, and (2) a quadrat of variable size, to estimate the density and size distribution of mussels ≥20 mm in length. The location of sampling along each vertical transect is determined by multiplying the total length of the transect, as described above, by a random number between 0.0 and 1.0. This random number is different for each vertical transect and is indicated on the prepared data sheet each year. For example, if vertical transect #1 has a length of 10.50 m and the random number is 0.50, then the origin of the mussel sampling is at the 5.25 m mark along the tape (Figure 3). If the length of the vertical transect is determined to be 0, based on a lack of mussels beneath the tape within one meter of the intersection with the horizontal transect, then the quadrat for that transect should be placed with the upper left corner at the intersection of the horizontal baseline and the vertical transect, and mussels sampled from that quadrat (see below for determining quadrat size). A random number near 1.0 may result in a quadrat extending below the vertical transect length.
Figure 3. A hypothetical single vertical transect, 10.5 m in length, sampled at 5.25 m, based on a random number between 0 and 1 of .50. The 51 mm diameter core pipe is centered along the left margin of the tape at the 5.25 m mark. The smallest quadrat that will yield approximately 20 mussels ≥20 mm in length, is placed at the right margin of the 5.25 m mark on the same vertical transect.
Two sampling methods are used to estimate mussel density and sizes, a core(s) and a quadrat. One or more small cores are designed to provide an unbiased estimate of the density of mussels of all sizes. The core tool is a 120 mm length of 51 mm (2 inch) inside diameter ABS or similar pipe. At the left margin of the vertical transect tape (looking from the water shoreward), at a distance corresponding to the vertical transect length multiplied by a random number between one and zero, to the nearest mm, the core pipe is placed with the margin of the core pipe abutting the left margin of the transect
10
line, at the upper corner of the quadrant for that vertical transect (Figure 3). Within this primary core, all mussels will be removed and placed in a container, labeled as a core, with the vertical transect number from which it was collected. A mussel is defined as within the core area if the tip of the proximal end of the mussel lies within the area circumscribed by the core. A thin putty knife can be used to slide under the core pipe and mussels to ensure that all mussels are collected. Larger mussels may be removed by hand to avoid compromising the ability to collect and measure all mussels. Mussels from the initial core sample are placed in a zip lock bag labeled with “core” and the number of the vertical transect.
The target for cores is to collect at least 20 mussels ≥2 mm in association with each quadrat. If this target is not acquired in the primary core, additional cores are taken. Additional cores are taken every 12.5 cm, moving horizontally to the right (i.e., the first additional core is taken just above the quadrat, just to the left of the 12.5 cm string). Once the target number of 20 mussels ≥2 mm is reached, core sampling is finished, and the number of additional cores (i.e., in excess of the primary core) is recorded on the data sheet. Note that if the target number of mussels is not acquired in eight additional cores, no more cores are taken; i.e., the maximum number of cores is nine (one primary and eight additional) per quadrat. Mussels collected from additional cores are bagged separately from the primary core, in a single zip-lock bag labeled “additional core” with the vertical transect number (all additional core samples are placed in the same bag). See below for processing of core samples.
The total number of mussels in the core(s) is used to calculate density of all mussels by dividing the number of mussels by the area of the cores (20.27 cm2 for each core). Due to the relatively small area sampled by the core(s), this method may provide a relatively imprecise estimate of density and sizes of mussels larger than 20 mm.
The quadrat sample is used to collect large mussels, defined as those equal to or greater than 20 mm in length. They are sampled in a quadrat whose upper left corner is placed adjacent to the core sample at the same random location along the vertical transect, but on the opposite (right) side of the vertical transect tape (Figure 3). Because mussel density can be highly variable, a variable area quadrat frame is used. The intent is to sample a quadrat with approximately 20 mussels ≥20 mm in length. This method will provide a total sample of approximately 200 mussels from a given bed to estimate the size distribution of larger mussels and provide 10 density estimates to provide an overall estimate of the density of larger mussels in the bed.
Sampling begins by evaluating the relative abundance of larger mussels near the randomly selected sampling location. If large mussels are abundant, a small quadrat should be selected, as small as 6.25 cm x 6.25 cm. If approximately 20 or more mussels ≥20 mm are present in this area, then all mussels ≥20 mm within the 6.252 cm quadrat must be collected. If this smallest quadrat provides fewer than 10-15 large mussels, then this quadrat size can be doubled, simply by flipping the quadrat once to the right, looking from the water shoreward. If approximately 20 mussels greater than 20 mm are present, then all mussels greater than 20 mm within the 6.25 cm x 12.5 cm quadrat must be collected. If this 6.25 x 12.5 cm quadrat provides fewer than 10-15 large mussels, then this quadrat size can be doubled again, by flipping the quadrat twice, once toward the water and once again back toward the tape. This results in a quadrat 12.5 x 12.5 cm. This process is repeated, next with a 25 x 25 cm
11
quadrat, following the same procedures, up to a maximum 1 m x 1 m quadrat. At this point all mussels ≥20 mm are collected in a container (zip lock bag) marked with vertical transect number, site and date. It is important to remember that sampling of large mussels must occur in a square or rectangular quadrat and that the quadrat size must double at each increment as necessary to obtain a sample of approximately 20 mussels ≥20mm. Only nine possible quadrat dimensions can be used (Table 1). It is critical to ensure that the size of the sampling quadrat is written on the data sheet at the time of collecting the sample, using cm x cm to denote size. It is also critical to ensure that all mussels ≥20 mm are collected from the quadrat. A small scraping or pry tool can be marked at 20 mm to aid in identifying suitably large mussels. If a mussel cannot be accessed for removal, it may be measured in situ and its length recorded and later added to the database. It is not required to turn over large rocks to look for mussels underneath.
Table 1. Quadrat dimensions and areas.
Quadrat Dimensions (cm) Quadrat Dimensions (fraction of m) Quadrat Area (cm2) Quadrat Area (m2)
6.25* 6.25 1/16 x 1/16 m 39.0625 0.003906 6.25 * 12.5 1/16 x 1/8 m 78.125 0.007813 12.5* 12.5 1/8 x 1/8 m 156.25 0.015625 12.5* 25 1/8 x 1/4 m 312.5 0.03125 25 * 25 1/4x 1/4m 625 0.0625 25 * 50 1/4 x 1/2 m 1250 0.125 50 * 50 1/2 x 1/2 m 2500 0.25 50 * 100 1/2 x 1.0 m 5000 0.5 100*100 1.0 x 1.0 m 10000 1
The processes described above for obtaining core and quadrat samples should be repeated for each of the 10 vertical transects that define the width (from the shoreward to the ocean side) of the mussel bed.
Following data and sample collection, mussels collected from each quadrat are counted and measured and the data entered into the mussel sampling spreadsheet. Each mussel measuring ≥20 mm (mussels ≥ 19.51 mm are rounded up to 20mm) in the sample of large mussels is measured to the nearest mm and recorded in the mussel data spreadsheet. To accommodate growth measurements, all mussels ≥20 mm are to be retained. A separate zip lock bag should be used for mussels associated with each quadrat, and labeled following sample labeling protocols, including the quadrat number and an indication that these mussels are for growth measurements. Each quadrat sample bag from within a mussel site can be placed into a larger, labeled zip lock bag and frozen. The mussels from core samples (up to total of nine cores, in one bag if only one core was collected, or in two bags if more than one core was collected) should be counted, and those ≥2 mm length should be measured. If this is not feasible in the field, then the samples should be frozen for later processing. Mussels from cores do not need to be retained after counts and measurements are taken.
12
Site Photos At each site, at least three sets of photographs are to be taken: (1) from the start and end points of the horizontal transect looking along it toward the opposing end; (2) from a predetermined point taken at a location which provides a good perspective of the mussel bed and which has identifying markers, e.g., large rocks, as in subsequent years, the objective is to repeat the photo(s) taken in the initialyear; and (3) four repeatable 1/4m2 quadrat photos will be taken at the 10, 20, 30 and 40 m marks along the horizontal transect. The horizontal transect photo quadrat will be placed with the upper edge along the tape with the left corner of the quadrat at the 10, 20, 30, and 40 m marks. Meter marks on the tape should be visible in quadrat photos and each photo should include site name, date, and transect type meter mark. The crew can also take additional photos if they feel more photo-documentation is warranted, particularly if the horizontal transect photos do not represent the mussel bed being sampled. These photos should be downloaded to the mussel database and labeled in accordance with photo file name protocols established for the overall nearshore GWA project.
3.2. Field Season Preparation In preparation for data collection the following equipment and supplies should be compiled and tested for operation:
Initial site set up
• GPS with site location entered
• Hammer drill with ¼ inch masonry bit
• Site tags with identification information
• Anchor eye bolts, ¼ inch, 2-3 inches in length with internally threated anchors
• Cable ties
• Ratchet wrench with ¼ inch driver
• Stadia rod and sight level (for initial site set up)
• Four 50 m tapes
• Data sheet for site marker and bolt map
Site sampling
• GPS with site location entered
• Hammer drill with ¼ inch bit, anchor bolts, internally threaded anchors, and cable ties for sitemaintenance
• Ratchet wrench with ¼ inch driver
• Four 50 m tapes
• Data sheet – Appendix A, with unique random vertical transect locations entered for eachyear
13
• Calculator for multiplying transect length by random number
• Calipers
• Quadrat frames with grid (0.125 x 0.125 and 0.25 x 0.25 m with vertical line bisecting)
• Tools for collecting mussels (small pry bar, putty knife…)
• Small ruler
• Bags for collection
• Marking pen
• Digital camera
• Safety equipment (hand-held radios, bear protection/deterrent as needed, fire starter…)
3.3. Field Season Preparation and Equipment ListPrior to each field season, the following tasks are to be performed:
• Review the master field schedule and prepare a list of tasks to be performed and set the fieldschedule
• Review personnel requirements, train personnel as needed, and make personnel assignments
• Arrange for vessel charters
• Prepare an itinerary and emergency contact list
• Arrange for travel of personnel to the departure site
• Prepare smaller boats (inflatable and/or other skiffs) for use
• Review sampling procedures
• Gather equipment and supplies (see above)
• Ensure that electronics have fresh batteries and are in good working condition
3.4. Post-collection Processing of Data After each field day, the following tasks are to be completed:
• Field personnel review data sheets and edit as necessary to improve legibility and resolve anydiscrepancies
• Make identifications (if possible) of any taxa for which field identifications were in questionand revise taxa names and codes on data sheets accordingly
• Enter data from data sheets into computer files and verify the data entry
• Count and record the number of mussels from each core sampled that day and enter into corespreadsheet. Measure and record the sizes of the mussels from the core sample (those ≥2mm); if too many to count and/or measure in field, freeze sample for later processing
• Count and measure mussels ≥20 mm sampled from each quadrat, record quadrat size andenter into large mussel size and density spreadsheet
• Make a backup copy (cd or other removable media) of all data collected
14
• Check and replace or charge batteries in electronic equipment (including radios) as needed
• Provide a summary of activities and observations for the day including any problems,suggestions for modifications in procedures, and unusual occurrences or observations
• Prepare field sheets and equipment for the following day’s use
• Download files from digital cameras or other electronic devices. Store these and provideadditional documentation as needed
After each field trip or cruise, the following are to be completed:
• Catalogue and prepare to ship samples as required for related studies, as prescribed.
• Produce a summary of the cruise based on summaries of daily activities and observations
After each field season, the following are to be done:
• Clean and check all electronic equipment and field gear for needed repair and storeappropriately
• Make repairs or obtain replacements for damaged or lost equipment or supplies.
• Ship samples to appropriate laboratories for analyses of contaminants and potentially growthin mussels, as needed
• Ship any data recording devices recovered to the manufacturer for servicing, as needed
• Produce a field season summary report based on daily and cruise reports. This should becompleted within one month of completion of the field season
3.5. End-of-season Procedures At the end of each field season all equipment should be cleaned and serviced and batteries removed for storage. Optics and other equipment should be assessed for repair or replacement needs. Skiff and engines should be winterized and prepared for seasonal storage.
After each field season, the following are to be done:
• Clean and check all mechanical, optical, and electronic equipment and field gear for neededrepair and store appropriately
• Make repairs or obtain replacements for damaged or lost equipment or supplies
• Produce a field season summary report based on daily and cruise reports
15
4. Data Handling, Analysis and Reporting4.1. Metadata Procedures See Nearshore Protocol Narrative (Dean et al. 2014).
4.2. Overview of Database Design [This mussel bed database is currently under development.]
4.3. Data Entry, Verification, and Editing Data are currently entered from field datasheets into Microsoft Excel. Data from cores (counts and measurements if feasible), and large mussel numbers and sizes, vertical transect dimensions and quadrat sizes are entered in the field or as soon as possible upon returning from the field. Raw data files are backed-up and the project manager verifies that data within the Excel spreadsheets matches the hardcopy data sheet recorded by the observer. The project manager edits data to correct discrepancies.
4.4. Routine Data Summaries and Statistical Analyses Analyses to be performed and data summaries to be produced are as follows:
Upon completion of the initial site visit:
• Plot out the mussel bed dimensions and calculate area of mussel bed in m2
• Calculate densities of mussels from individual cores and calculate mean and se of musseldensity
• Calculate densities of mussels ≥20 mm from each quadrat and calculate mean and se of largemussel density
• Catalog site photos
Annually:
• Provide a master list of all sites visited, dates of sampling, photos taken and samplingconducted
• Produce a list of all samples that were collected for further analyses (e.g. mussels fordetermination of growth) and the current status of those samples and analyses
• Produce derived variables including bed dimensions (m2), and mean and variance in densityand size class distribution per subsampling unit (quadrat and core) and site (combined fromtransects, quadrats and cores)
• Compare and contrast present year data with prior years
4.5. Report Format Annual reports should include the summary tables for metrics described in section 4.4 above. Reports should include plots of means of each metric of interest vs. time and vs. location. A process for determining what additional analyses may be appropriate for inclusion in comprehensive reports and suggested formats for these, are presented in the Nearshore Protocol Narrative (Dean et al. 2014).
16
Reports will conform to specific guidelines set by the NPS Natural Resource Publications Management website (http://www.nature.nps.gov/publications/NRPM/index.cfm). Reports will include maps, graphs, figures, and other visuals to facilitate comprehension of findings.
4.6. Methods for Trend Analyses Procedures for long-term trend analyses are presented in the Nearshore Protocol Narrative (Dean et al. 2014).
4.7. Reporting Schedule Summary reports should be produced annually. Reports that are more comprehensive should be produced after the first five years of sampling and every five years thereafter.
5. Personnel Requirements and Training5.1. Roles and Responsibilities The roles and responsibilities of personnel are described as responsibilities regarding the overall project, particular cruises, or particular field sampling teams at a given site. A single person may fill several of these roles. For example, a project leader may also serve as a cruise leader and field team leader or field assistant. The roles of these persons are as follows:
Project Leader – Organizes the overall schedule, takes part in field sampling, oversees all activities, and is responsible for preparation of reports.
Trip Leader – Organizes daily schedules, makes personnel assignments, makes sure all daily and cruise reports are completed, takes part in sampling, and oversees that all data collected on a given cruise are reviewed and entered.
Field Team Leader – Is responsible for onsite activities on a daily basis and for the review and entry of all data collected by that crew.
Field Assistant - Assists in site layout, data collection, and data entry at a site.
5.2. Qualifications The following are qualification for each of the roles and responsibilities described above.
Project Leader – Five or more years experience in similar projects with a background and experience in project management, nearshore marine ecological field studies, data analysis, and report preparation.
Trip Leader – Experience in nearshore marine ecological field studies and leading field teams. Expertise in sampling and taxonomy of marine invertebrates.
Field Team Leader – Expertise in sampling and taxonomy of marine invertebrates.
Field Assistant – Competent boat handler and field crew member with ability to identify common marine invertebrates. Prior experience in the specific mussel bed sites to be sampled is desirable.
5.3. Training Procedures All personnel are to be trained and demonstrate proficiency in small boat handling, algal and invertebrate taxonomy, and the specific procedures for sampling outlined here. All field team members should be accompanied by personnel that have carried out sampling under this procedure in the past and must demonstrate proficiency by independently conducting site set up and duplicating counts of mussels by an experienced sampler. All personnel must be current with applicable safety training.
19
6. Operational Requirements and Workloads 6.1. Personnel Requirements A minimum of two crew members are required to conduct mussel surveys in each region.
6.2. Annual Workload and Field Schedule Field surveys are to be conducted in the summer of each year (see Nearshore Protocol Narrative, Dean et al. 2014). It is anticipated that field sampling of mussel sites will require a crew of two persons working approximately three hours per day for five to six days per region (KATM, KEFJ, PWS). Crews used for field sampling will share duties with those persons conducting surveys including sea otter diet, summer bird and mammal surveys, and oystercatcher surveys. Approximately 1.5 months per year will be required for each of three staff (principal investigator, data analyst, and field assistant) in order to prepare for the field season, collect data and samples, prepare specimens for analysis, conduct analyses, and report the results.
6.3. Facility and Equipment Needs A vessel that accommodates at least six field crew members will be required to sample most sites. The vessel will be equipped with skiffs for accessing the beach. Two GPS units and safety equipment noted above are required per each field crew.
7. 7 Procedures for Revising the Protocol All edits and amendments made to this SOP should be recorded in the revision history log table at the beginning of this document. Users of this protocol should promptly notify the project leader of the marine nearshore monitoring program of recommended edits or changes. The project leader will review and incorporate suggested changes as necessary, record these changes in the revision history log, and modify the date and version number on the title page of this document to reflect these changes.
It is anticipated that following at least five years of annual data collection it will be important to evaluate, in terms of power and sensitivity, the ability of the sampling design to detect change in the data derived from mussel bed sampling. Following such analyses it may be appropriate to consider revising sampling design or data collection protocols.
21
8. Literature Cited Blanchette, C. A. and S. D. Gaines. 2007. Distribution, size, and recruitment of the mussel, Mytilus
californianus, across a major oceanographic and biogeographic boundary at Point Conception, California, USA. Journal of Experimental Marine Biology and Ecology 340:268-279.
Dayton, P. K. 1971. Competition, disturbance and community organization: the provision and subsequent utilization of space in a rocky intertidal community. Ecological Monographs 41:351-89.
Dean, T. A., J. L. Bodkin, A. K. Fukuyama, S. C. Jewett, D. H. Monson, C. E. O’Clair, and G. R. Van Blaricom. 2002. Food limitation and the recovery of sea otters in Prince William Sound. Marine Ecology Progress Series 241:255-270.
Dean, T. A. 2011. SOP for Sampling of Intertidal Invertebrates and Algae on Sheltered Rocky Shores – Version 4.7 Southwest Alaska Inventory and Monitoring Network Natural Resource Report NPS/SWAN/NRR—2011/397 106 pp.
Dean, T. A., J. L. Bodkin, and H. A. Coletti. 2014. Protocol Narrative for Nearshore Marine Ecosystem Monitoring in the Gulf of Alaska. Version 1.1 Natural Resource Report NPS/SWAN/NRR—2014/756 94pp.
Engle, J. 2008. Unified Monitoring Protocols for the Multi-Agency Rocky Intertidal Network. Prepared under MMS Cooperative Agreement No. 14-35-0001-30761. U.S. Department of the Interior, Minerals Management Service, Pacific OCS Region, Camarillo, California. 84 pp.
Goudie, R. I. and C. D. Ankney. 1986. Patterns of habitat use by sea ducks wintering in southeastern Newfoundland. Ecology 67:1475-1482.
Harper, J.R., and M.C. Morris. 2004. ShoreZone mapping protocol for the Gulf of Alaska (ver 1.0) CORI Project: 02-33 EVOS Project: 030641. Exxon Valdez Trustee Council, Anchorage, AK. Knox, G. A. 2000. The Ecology of Seashores. CRC Press LLC
Menge, B. A. and G. M. Branch. 2001. Rocky intertidal communities. Pages 211-254, in Marine Community Ecology. Sinauer Associates, Sunderland, Massachusetts.
Oftedal, O., K. Ralls, M. T. Tinker, and A. Green. 2008. Nutritional constraints on the southern sea otter in the Monterey Bay National Marine Sanctuary, and a comparison to sea otter populations at San Nicolas Island, California and Glacier Bay, Alaska. Final Report to the Monterey Bay National Marine Sanctuary and the Marine Mammal Commission. 263 pp.
Paine, R. T. 1974. Intertidal community structure: experimental studies on the relationship between a dominant competitor and its principal predator. Oecologica 15:93-120.
22
Van Blaricom., G. R. 1988. Effects of foraging by sea otters on mussel-dominated intertidal communities. Pages 48-91 in G.R. VanBlaricom and J.A. Estes, eds. The Community Ecology of Sea Otters. Springer Verlag, Berlin, Germany.
Webster, J. D. 1941. Feeding habitats of the black oystercatcher. The Condor 43:175-180.
Appendix A. Sample Datasheet (blank datasheet to describe quadrat locations and mussel bed)
Mussel Bed Sampling 2015 Date data entered & by whom: ____________________ Date data backed up & by whom: __________________
Site ID: ____________ Site Name: _______________
Date: ______________ Start & End times: _______________ Observers: _______________
Random proportion (2014) .65 .46 .28 .34 .67 .83 .76 .59 .24 .01 Sampling position
(vertical length X prop) Point along vert. where it
crosses horizontal (m) Size of sampling quad
(cm x cm)
Core taken? (Yes or No)
Drawing of TX lengths: For each vertical, show “0”: top of vertical “H”: vertical crosses horizontal “E”: end of vertical And distances in between! Also indicate if mussels are present below “E” (beyond a 1 m gap) and if so, the approximate linear extent to the last mussel, ignoring gaps. Other notes & map on back
24
Initial Site Layout and Sampling Dimensions
Site no./name__________________________ Lat_____________Long___________
Boundaries of bed (distances along vertical transect at each of 10 locations)
Transect No. 1 2 3 4 5 6 7 8 9 10
Start (m)
Transects Intersect (m)
End (m)
The Department of the Interior protects and manages the nation’s natural resources and cultural heritage; provides scientific and other information about those resources; and honors its special responsibilities to American Indians, Alaska Natives, and affiliated Island Communities. NPS 953/132109, March 2016
National Park Service U.S. Department of the Interior
Natural Resource Stewardship and Science 1201 Oakridge Drive, Suite 150 Fort Collins, CO 80525 www.nature.nps.gov