Page 1
Page 1 of 41
UCD IMPROVE Standard Operating Procedure #201
Sampler Maintenance by Site Operators
Interagency Monitoring of Protected Visual Environments
Air Quality Research Center
University of California, Davis
Version 3.2
Updated By: Joshua Grant Date: 12/11/2017
Approved By: Yongjing Zhao Date: 12/18/2017
Page 2
Page 2 of 41
IMPROVE SOP #201: SAMPLER MAINTENANCE BY SITE OPERATORS TABLE OF CONTENTS
1. INTRODUCTION 5
1.1 IMPROVE NETWORK 5 1.2 IMPROVE AEROSOL SAMPLER OVERVIEW 5
2. IMPROVE AEROSOL SAMPLING 6
2.1 SAMPLER SHELTERS 6 2.2 OPERATOR QUALIFICATIONS 6 2.3 INTERFERENCES 7 2.4 SAMPLING SUPPLIES 7
2.4.1 Collocated “X” Module Sampling 10 2.4.2 Special Studies 10
2.5 SCHEDULES 11 2.5.1 Sampling Schedule 11 2.5.2 Sample Change Schedule 11 2.5.3 Maintenance Schedule 11
3. VERSION II IMPROVE AEROSOL SAMPLER 11
3.1 SAMPLER CONTROLLER 12 3.1.1 AUTO MODE: Current Status Screens 15 3.1.2 Menu Mode 16
3.2 PM2.5 SAMPLING MODULES 17 FIGURE 3-13. FLOW DIAGRAM FOR THE IMPROVE PM2.5 MODULE. 18
3.2.1 PM2.5 Module Inlet and Cyclone 18 3.2.2 Critical Orifice Flow Control 18 3.2.3 PM2.5 Module Flow Rate Measurement 19 3.2.4 PM2.5 Module Filter Cassettes and Cartridges 20
3.3 PM10 SAMPLING MODULE 20 3.3.1 PM10 Module Inlet and Cyclone 21 3.3.2 PM10 Module Flow Rate Measurement 21 3.3.3 PM10 Module Filter Cassettes and Cartridges 22
4. SAMPLER INSTALLATION 22
5. TUESDAY SAMPLE CHANGES 23
5.1 PREPARATION 23 5.2 SAMPLE CHANGE PROCEDURES 24
6. TROUBLESHOOTING GUIDE 31
6.1 COMMON SAMPLER PROBLEMS 31 6.2 SAMPLER CONFIGURATION 33
APPENDIX I: ELEVATION FACTORS 36
APPENDIX II: MODULE DOOR QUICK REFERENCE SHEETS 37
Page 3
Page 3 of 41
LIST OF FIGURES
Figure 1-1. Photo of the IMPROVE aerosol sampling modules inside a shelter. ..........................6
Figure 2-1. Picture of a blue box showing the three filter bags. .....................................................8
Figure 2-2. Picture of the contents of one re-sealable bag − supplies for one week of sampling. .8
Figure 2-3. Sample cartridge for the 2B module (yellow sticker) with four cassettes. Only three
of the cassettes contain sample filters (indicated by the three labels). ....................................9
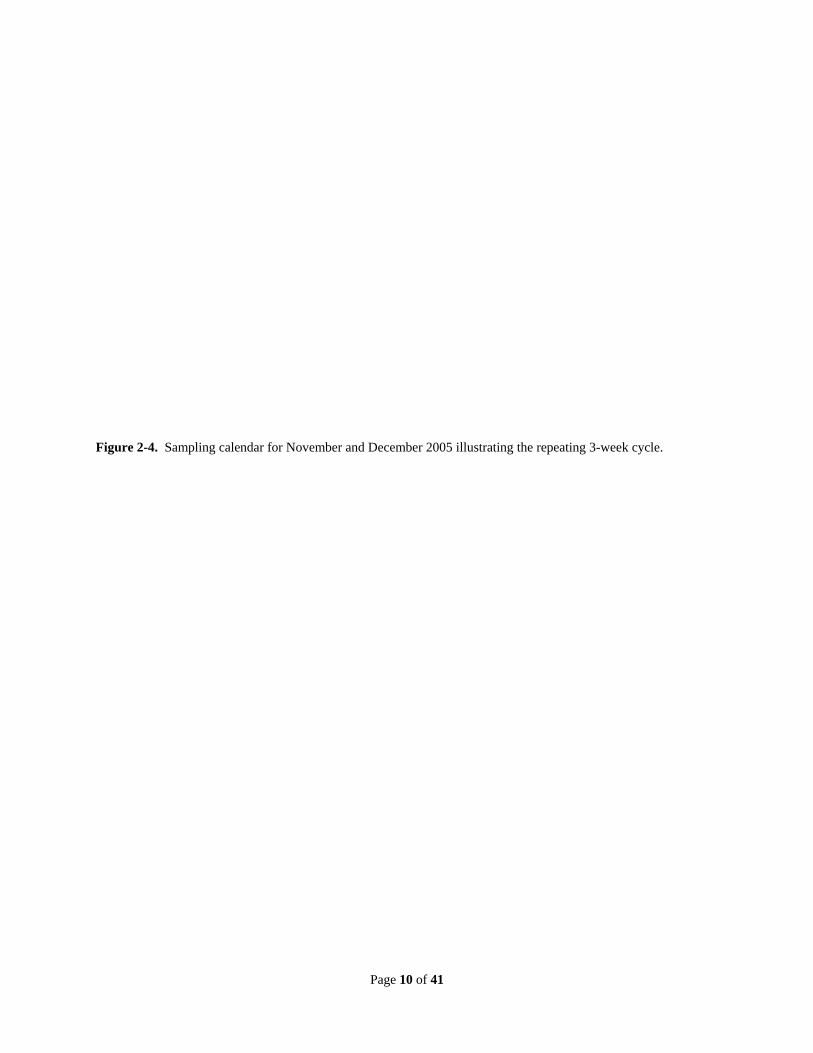
Figure 2-4. Sampling calendar for November and December 2005 illustrating the repeating 3-
week cycle. .............................................................................................................................10
Figure 3-1. Standard IMPROVE aerosol sampler configuration. .................................................12
Figure 3-2. Controller module ......................................................................................................13
Figure 3-3. Controller terminal .....................................................................................................14
Figure 3-4. Current status, filter on ...............................................................................................15
Figure 3-5. Current status, recording sensors ...............................................................................15
Figure 3-6. Current status, idle screen ..........................................................................................15
Figure 3-7. Current status, sampling complete .............................................................................15
Figure 3-8. Main menu screen. .....................................................................................................16
Figure 3-10. Change date and time screen. ...................................................................................17
Figure 3-9. Change date and time screen. .....................................................................................16
Figure 3-11. Invalid date error screen. ..........................................................................................17
Figure 3-12. PM2.5 module from the Version II IMPROVE aerosol sampler. ............................17
Figure 3-13. Flow Diagram For The Improve Pm2.5 Module. .....................................................18
Figure 3-14. PM10 module from the Version II IMPROVE sampler. ...........................................21
Figure 5-1. Field logsheet for sample cartridges with three cassettes (i.e., three sampling
days). ......................................................................................................................................23
Figure 5-2. Photos illustrating the removal of position 3 cassette (note black o-ring on
removable cassette) from the cartridge. .................................................................................24
Figure 5-3. Continue screen. .........................................................................................................25
Figure 5-4. Select initials screen. ..................................................................................................25
Figure 5-5. Current temperature screen. .......................................................................................25
Figure 5-6. Flow rate readings screen. ..........................................................................................26
Figure 5-7. Continue screen. .........................................................................................................26
Figure 5-8. Exchange cartridges screen. ......................................................................................26
Figure 5-9. Non-sampling Tuesday sample change. .....................................................................27
Figure 5-10. PM2.5 cassette orientation. Figure 5-11. PM10 cassette orientation. .....................27
Figure 5-12. Active sampling Tuesday sample change. ...............................................................28
Figure 5-13. Replace flash card screen .........................................................................................29
Figure 5-14. No memory card warning .........................................................................................29
Figure 5-15. Clean filter readings screen. .....................................................................................29
Figure 5-16. Low flow through cyclone warning. ........................................................................30
Figure 5-17. Cartridge upside down warning. ..............................................................................30
Figure 5-18. Final filter readings screen. ......................................................................................30
Figure 5-19. Current status, idle screen ........................................................................................31
Figure 5-20. Current status, filter on .............................................................................................31
Page 4
Page 4 of 41
LIST OF TABLES
Table 2-1. Types of cartridges for 1-in-3 day sampling. ...............................................................9
Table AI-1. Elevation factors for a range of elevations. The elevations are listed in units of both
meters (m) and feet (ft) above mean sea level. The pressure in units of millimeters of
mercury is also listed for each elevation. ...............................................................................36
Page 5
Page 5 of 41
1. INTRODUCTION
1.1 IMPROVE Network
IMPROVE (Interagency Monitoring of Protected Visual Environments) is a cooperative program
of the National Park Service, National Forest Service, Bureau of Land Management, Fish and
Wildlife Service, Environmental Protection Agency, and state and tribal organizations.
IMPROVE was established in 1985 to aid the creation of Federal and State implementation plans
for the protection of visibility in Class I areas (156 national parks and wilderness areas) as
stipulated in the 1977 amendments to the Clean Air Act.
The first IMPROVE samplers were deployed in 1988 at twenty sites. The number of sites has
increased significantly over the years. For a current list of sites please visit:
http://views.cira.colostate.edu/fed/DataWizard/Default.aspx
Click on the “Sites” tab to see the site list. A map of the network is available here:
http://views.cira.colostate.edu/fed/SiteBrowser/Default.aspx?sskeyse=10001&smmkeys=57
Zoom out on the map to see sites beyond the Continental United States in Alaska, Hawaii, Virgin
Islands, Canada, and South Korea. Click on any site to see photos and information about that
site.
Every IMPROVE site employs an aerosol sampler to collect particulate matter samples below
2.5 m (pm2.5) and below 10 m (pm10). The version i improve aerosol sampler was used in the
network from 1988 to 2000. In 2000, the version ii improve aerosol sampler was introduced, and
the sampling protocol changed from twice a week to every third day. The sampling schedule
was changed to be consistent with the EPA-designated schedule for the speciation trends
network (STN), which operates in urban areas.
1.2 IMPROVE Aerosol Sampler Overview
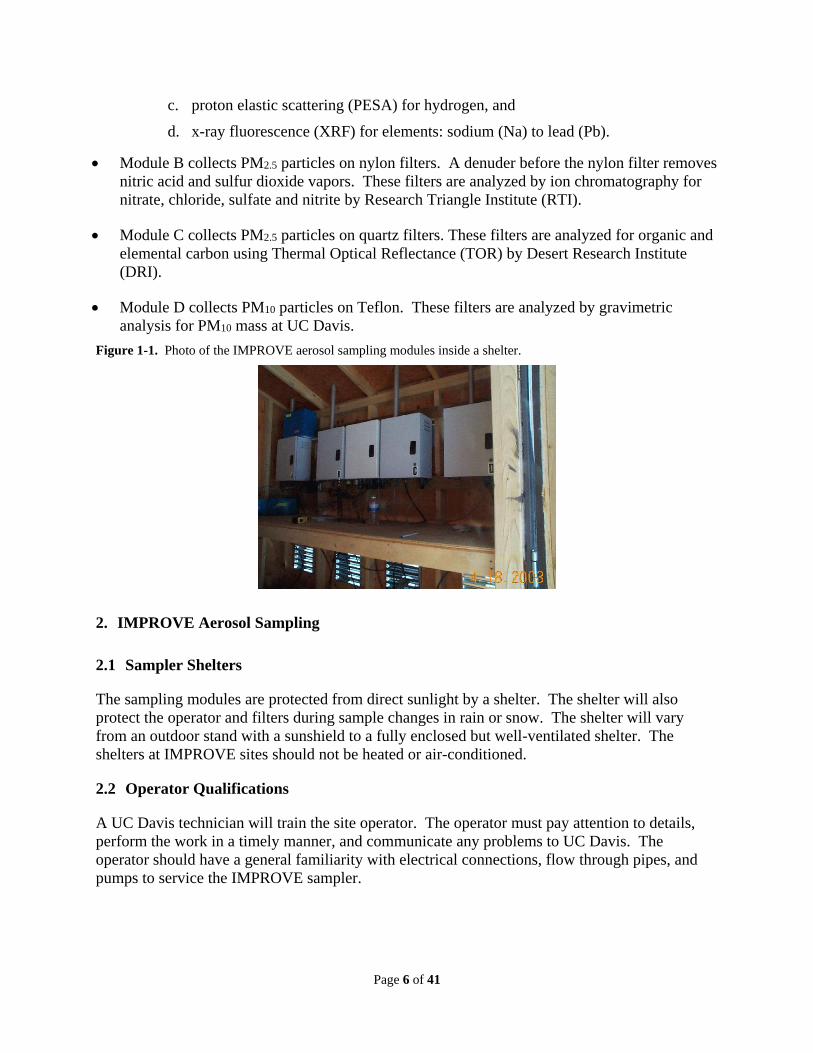
A picture of an IMPROVE aerosol sampler is shown in Figure 1-1. The sampler consists of four
modules used to collect aerosol samples, labeled A, B, C, and D. The third white box from the
left, in the center of the picture is the controller. The controller contains the microcontroller with
programmed schedule, the keypad, and other electronic equipment required to operate the
sampler. Note that the four sampling modules have inlet pipes protruding from the top of them,
while the controller does not. During a sampling period, each of the four modules collects a
filter sample simultaneously. The four modules are used to collect four different types of
samples.
Module A collects PM2.5 particles on Teflon filters. These filters are analyzed by four
methods at UC Davis:
a. gravimetric analysis for PM2.5 mass,
b. hybrid-integrating plate and sphere (HIPS) for optical absorption,
Page 6
Page 6 of 41
c. proton elastic scattering (PESA) for hydrogen, and
d. x-ray fluorescence (XRF) for elements: sodium (Na) to lead (Pb).
Module B collects PM2.5 particles on nylon filters. A denuder before the nylon filter removes
nitric acid and sulfur dioxide vapors. These filters are analyzed by ion chromatography for
nitrate, chloride, sulfate and nitrite by Research Triangle Institute (RTI).
Module C collects PM2.5 particles on quartz filters. These filters are analyzed for organic and
elemental carbon using Thermal Optical Reflectance (TOR) by Desert Research Institute
(DRI).
Module D collects PM10 particles on Teflon. These filters are analyzed by gravimetric
analysis for PM10 mass at UC Davis.
Figure 1-1. Photo of the IMPROVE aerosol sampling modules inside a shelter.
2. IMPROVE Aerosol Sampling
2.1 Sampler Shelters
The sampling modules are protected from direct sunlight by a shelter. The shelter will also
protect the operator and filters during sample changes in rain or snow. The shelter will vary
from an outdoor stand with a sunshield to a fully enclosed but well-ventilated shelter. The
shelters at IMPROVE sites should not be heated or air-conditioned.
2.2 Operator Qualifications
A UC Davis technician will train the site operator. The operator must pay attention to details,
perform the work in a timely manner, and communicate any problems to UC Davis. The
operator should have a general familiarity with electrical connections, flow through pipes, and
pumps to service the IMPROVE sampler.
Page 7
Page 7 of 41
2.3 Interferences
The IMPROVE network is designed to measure regional air quality. Therefore, the sites are
located in remote areas. The sites should not be heavily influenced by local sources. If a new
activity begins close to the site (if you can see or smell emissions when you are at the site),
please inform UC Davis of the possible interference at once. Examples of activities that might
influence the air quality samples are
Fires
Road or building construction
Gas or diesel powered generator
Increased traffic
Mining operations or timber harvesting
The IMPROVE siting criteria are detailed in IMPROVE SOP 126 Site Selection.
The quality of the samples is dependent upon careful handling of the samples. Careless handling
of the samples can lead to contamination.
Do not leave the samples sitting out in the open air for longer than a few minutes.
Do not touch the surfaces of the filters.
Be careful not to drop the samples.
Ship the used samples back to UC Davis as soon as possible.
Protect the samples from water contamination when changing samples in the rain or
snow.
Store the samples at room temperature (i.e., do not leave the samples in a hot car, or in
the sun).
2.4 Sampling Supplies
The laboratory at UC Davis prepares the sample cartridges for the IMPROVE sites. Every three
weeks, UC Davis sends a “Blue Box” containing the necessary sampling supplies to each site
(Figure 2-1). Usually, there will be two Blue Boxes at a site, one box in current use and the
second box ready for the next period or ready to be shipped back to UC Davis. Inside each Blue
Box are three re-sealable bags and a CompactFlash card for storing the electronic sampling data.
Each bag contains the supplies for one week (Figure 2-2): four sample cartridges, one for each of
the four modules, and the corresponding logsheet. The cassettes are color-coded for each
module: red for module 1A, yellow for module 2B, green for module 3C, and blue for module
4D. A sampler which has a fifth module will use orange for module 5X. All cassettes are capped
to protect the filters, and the red caps must be removed before the cassettes are installed in the
modules. Each re-sealable bag is labeled with the date that the cartridges inside the bag are to be
installed. The Blue Box will be labeled with the three sample install dates.
Page 8
Page 8 of 41
The Blue Box should be received 5 calendar days before the first sample-change day. If the
appropriate box is not present before the change date, the operator should contact the UCD
laboratory (530-752-1123). Once all the filter samples in a Blue Box have been used, the Blue
Box should be shipped back to UCD by UPS, or FedEx, or USPS services. UC Davis provides
shipping label to most site for returning the Blue Box.
Figure 2-1. Picture of a blue box showing the three filter bags.
Figure 2-2. Picture of the contents of one re-sealable bag − supplies for one week of sampling.
The filter samples are loaded into cassettes to form an airtight seal around each filter, and the
cassettes are loaded into cartridges to allow sequential samples to be collected without operator
intervention. Figure 2-3 is a picture of a sample cartridge and four cassettes. Each cartridge
contains three or four cassettes but only two or three of the cassettes contain sample filters
because only two or three samples are collected in any given week. Error! Reference source n
ot found. lists the three cartridge configurations used for routine sampling. The unused cassettes
contain pieces of paper or blank filters (blank filters do not require any special procedures of the
operator).
Page 9
Page 9 of 41
Figure 2-4 shows a sampling calendar for September and October, 2015 to illustrate the 3-week
repeating cycle.
Figure 2-3. Sample cartridge for the 2B module (yellow sticker) with four cassettes. Only three of the cassettes
contain sample filters (indicated by the three labels).
Table 2-1. Types of cartridges for 1-in-3 day sampling.
Cartridge Type Cassette 1 Cassette 2 Cassette 3 Cassette 4
Type 1 Thursday Sunday Unused or field blank Unused
Type 2 Wednesday Saturday Tuesday Unused
Type 3 Friday Monday Empty hole Unused
Cassette 1
Cassette 2 Cassette 3
Cassette 4
Page 10
Page 10 of 41
Figure 2-4. Sampling calendar for November and December 2005 illustrating the repeating 3-week cycle.
Page 11
Page 11 of 41
September 2015 Cartridge
Type KEY
Tue Wed Thu Fri Sat Sun Mon Sample change day
1 2 3 4 5 6 7 1
8 9 10 11 12 13 14 2 Sample collection day
15 16 17 18 19 20 21 3
22 23 24 25 26 27 28 1 Sample change and
29 30 2 collection day
October 2015
Tue Wed Thu Fri Sat Sun Mon
1 2 3 4 5 2 continued
6 7 8 9 10 11 12 3
13 14 15 16 17 18 19 1
20 21 22 23 24 25 26 2
27 28 29 30 31 3
2.4.1 Collocated “X” Module Sampling
Collocated (or duplicate) sampling is performed at a small number of sites. At these sites,
five sampling modules are operated. The fifth module is a duplicate of one of the other
four modules and is labeled as the “5X” module.
2.4.2 Special Studies
At times, special aerosol studies will be performed at some of the sites. These studies may
require additional sampling equipment and supplies. The individual site operators will be
contacted before any special studies are initiated at their sites.
Page 12
Page 12 of 41
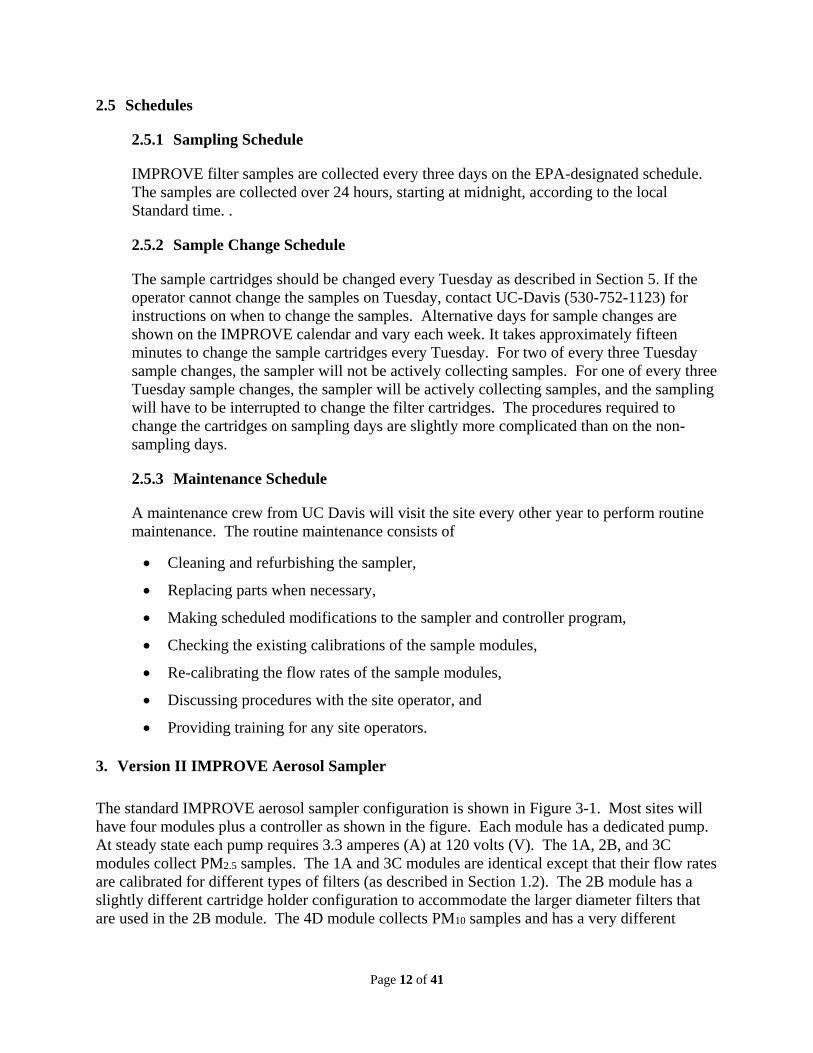
2.5 Schedules
2.5.1 Sampling Schedule
IMPROVE filter samples are collected every three days on the EPA-designated schedule.
The samples are collected over 24 hours, starting at midnight, according to the local
Standard time. .
2.5.2 Sample Change Schedule
The sample cartridges should be changed every Tuesday as described in Section 5. If the
operator cannot change the samples on Tuesday, contact UC-Davis (530-752-1123) for
instructions on when to change the samples. Alternative days for sample changes are
shown on the IMPROVE calendar and vary each week. It takes approximately fifteen
minutes to change the sample cartridges every Tuesday. For two of every three Tuesday
sample changes, the sampler will not be actively collecting samples. For one of every three
Tuesday sample changes, the sampler will be actively collecting samples, and the sampling
will have to be interrupted to change the filter cartridges. The procedures required to
change the cartridges on sampling days are slightly more complicated than on the non-
sampling days.
2.5.3 Maintenance Schedule
A maintenance crew from UC Davis will visit the site every other year to perform routine
maintenance. The routine maintenance consists of
Cleaning and refurbishing the sampler,
Replacing parts when necessary,
Making scheduled modifications to the sampler and controller program,
Checking the existing calibrations of the sample modules,
Re-calibrating the flow rates of the sample modules,
Discussing procedures with the site operator, and
Providing training for any site operators.
3. Version II IMPROVE Aerosol Sampler
The standard IMPROVE aerosol sampler configuration is shown in Figure 3-1. Most sites will
have four modules plus a controller as shown in the figure. Each module has a dedicated pump.
At steady state each pump requires 3.3 amperes (A) at 120 volts (V). The 1A, 2B, and 3C
modules collect PM2.5 samples. The 1A and 3C modules are identical except that their flow rates
are calibrated for different types of filters (as described in Section 1.2). The 2B module has a
slightly different cartridge holder configuration to accommodate the larger diameter filters that
are used in the 2B module. The 4D module collects PM10 samples and has a very different
Page 13
Page 13 of 41
configuration to accommodate a PM10 cyclone; the most noticeable operational difference is that
the sample cartridges must be installed upside down compared to the other modules.
Selected sites will have a fifth module used to perform sampling for quality assurance purposes.
The fifth module will be a duplicate of one of the other modules and will be referred to as a 5X
module.
Figure 3-1. Standard IMPROVE aerosol sampler configuration.
3.1 Sampler Controller
The sampler controller is used to control the sample collection and acquire data during sampling.
The Version II controller consists of a TERN 20 MHz microcontroller, 12 bit analog to digital
converter, a Two Technologies terminal with LCD screen, and a twenty-button keypad, plus
appropriate electronic components. The controller is shown in
Figure 3-2. The lower portion of the figure shows the connectors on the bottom of the controller.
The keypad and display terminal can be removed from the controller to be closer to the sampler
modules; this is useful when the sampler is calibrated but not recommended during the weekly
sample change. The controller can currently accommodate up to five filter sampling modules.
Module A PM 2.5 Teflon
Module C PM 2.5 quartz
Module B PM 2.5 nylon
denuder
Module D PM 10
Teflon
Controller
Page 14
Page 14 of 41
Figure 3-2. Controller module
The controller performs the following functions.
Provides a status of current sampler operations to the site operator.
Provides an interface for recording initial and final measurements of the filters during sample
changes to the site operator.
Provides options for selecting sampling protocols and filter types. This is normally
performed by an UC Davis technician at the time of installation.
Keeps the current date and time.
Switches the filter solenoids and pump relays on and off.
Records pressure transducers measurements. A standard configuration has 7 transducers.
Measurement is done once a minute and averages are recorded on the flash card every 15
minutes. The averages are also recorded whenever there is a power outage or the operator
starts the sample change.
Records ambient temperature measurements. This is on the same schedule as that of the
pressure transducers.
Records the solenoid valve number that is open.
Page 15
Page 15 of 41
Download all the measurements to the removable CompactFlash card.
The control program is written and compiled at UC Davis in C/C++ on a personal computer.
The program is uploaded to an EPROM, which is inserted into the microcontroller. More
detailed instructions will be provided to the site operator/s if a software upgrade is ever
necessary.
Fifteen-minute average temperature and pressure transducer measurements are stored on a
removable CompactFlash card. The CompactFlash card is replaced every three weeks. The used
card is sent back to UC Davis, and the data are uploaded to a database. The CompactFlash card
has the capacity to store much more than three weeks of sampling data if necessary.
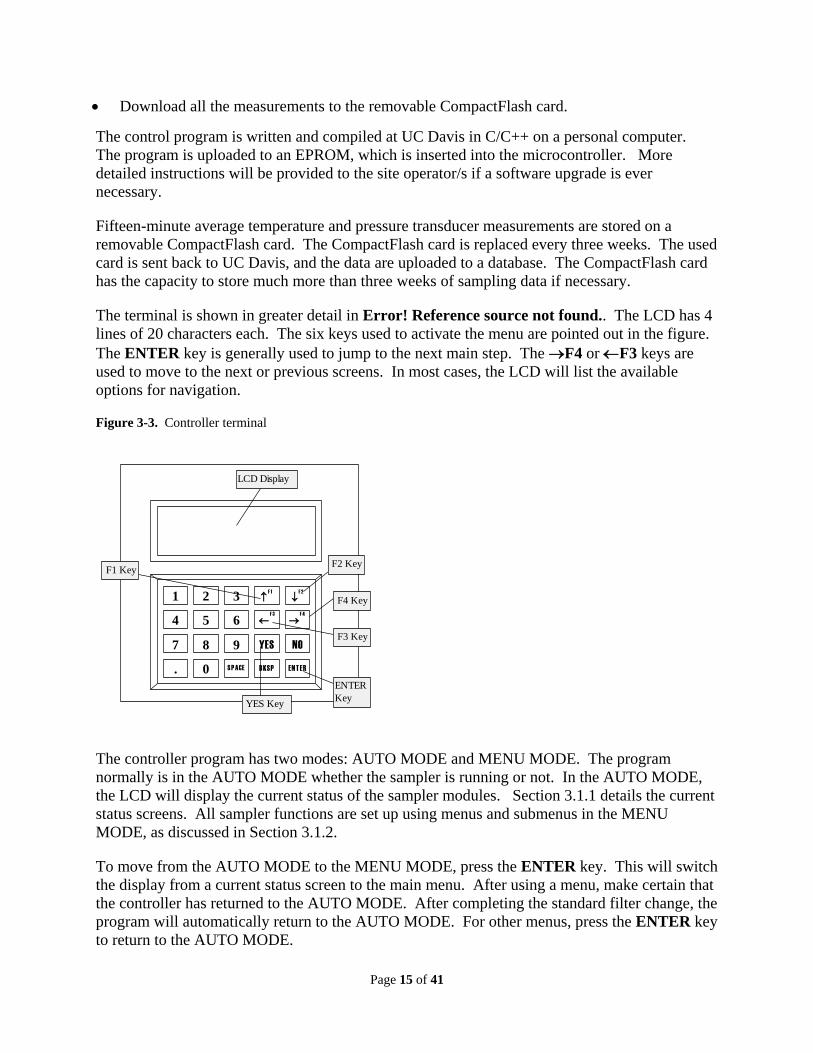
The terminal is shown in greater detail in Error! Reference source not found.. The LCD has 4
lines of 20 characters each. The six keys used to activate the menu are pointed out in the figure.
The ENTER key is generally used to jump to the next main step. The F4 or F3 keys are
used to move to the next or previous screens. In most cases, the LCD will list the available
options for navigation.
Figure 3-3. Controller terminal
7
3 F 2
F 1
2
4 F 3
6 5
.
8
F 4
0
NO YES 9
1
EN T ER BKSP S PACE
F4 Key
F2 Key
F3 Key
F1 Key
LCD Display
ENTER
Key YES Key
The controller program has two modes: AUTO MODE and MENU MODE. The program
normally is in the AUTO MODE whether the sampler is running or not. In the AUTO MODE,
the LCD will display the current status of the sampler modules. Section 3.1.1 details the current
status screens. All sampler functions are set up using menus and submenus in the MENU
MODE, as discussed in Section 3.1.2.
To move from the AUTO MODE to the MENU MODE, press the ENTER key. This will switch
the display from a current status screen to the main menu. After using a menu, make certain that
the controller has returned to the AUTO MODE. After completing the standard filter change, the
program will automatically return to the AUTO MODE. For other menus, press the ENTER key
to return to the AUTO MODE.
Page 16
Page 16 of 41
3.1.1 AUTO MODE: Current Status Screens
When the sampler is in AUTO MODE, the current status of the sampler is displayed. The
display shows whether the sampler is collecting, idling, or waiting for samples. In the
figures below, several example displays are shown.
In the first example, Figure 3-4, the first line displays the current date and time. For this
example, the date is January 2nd, 2000. The time is 4 pm or 16:00. After the time, the day
of the week is listed, in this case Saturday. The second line indicates that the 2nd filter in
each module is sampling and that the current temperature reading is 25° C. The third line
is the header for the elapsed times that are displayed in the fourth line in minutes. In this
example, Filter 1 sampled for 1440 minutes (24 hours), Filter 2 for 960 minutes (16 hours)
and Filter 3 and 4 have not sampled.
Figure 3-5 is the same as Figure 3-4, except that it is displaying that the sampler is
currently recording sensors. At this time, the sampler is recording the flowrate,
temperature, and other parameters and will not accept any keystrokes from the keypad.
This screen will only appear momentarily.
Figure 3-6 shows that the sampler is idle. It is not a sampling day. The date displayed is
June 4th, 2003. It is 8am. The day of the week is Tuesday.
The status screen in Figure 3-7 indicates that the sampler has collected all the samples for
the week and will remain idle until the operator changes the cartridges and collects the
exposed and clean filter readings. The date is November 1st, 2000 at 10am, standard time.
Figure 3-4. Current status, filter on.
Figure 3-5. Current status, recording sensors.
Figure 3-6. Current status, idle screen.
Figure 3-7. Current status, sampling complete
01/02/00 04:00p SAT
Fil 2 ON, Temp= 25C
Fil1|Fil2|Fil3|Fil4
1440| 960| 0| 0
01/02/00 04:00p SAT
Fil 2 ON, Temp= 25C
Fil1|Fil2|Fil3|Fil4
Recording sensors
06/04/03 08:00 TUE
A B C D
OFF OFF OFF OFF
11/01/00 10:00 SAT
SAMPLING COMPLETED
WILL CONTINUE AFTER
FILTER CHANGE
Page 17
Page 17 of 41
3.1.2 Menu Mode
The MENU MODE has a main menu and several sub-menus. The main menu can be
accessed by pushing the ENTER key while the sampler is displaying the current status.
When the ENTER button is pushed the display in Figure 3-8. Main menu screen will
appear, with four available options.
Figure 3-8. Main menu screen.
F1 - Pressing the F1 key will bring up the Filter readings menu. Press F1 when you need
to take the readings of the exposed and clean cassettes on a sample change day. This
will be described in detail in Section 5.2.
F2 - Pressing the F2 key will bring up the menu to change the current date and time. This
option is described below.
F3 - Pressing the F3 key will bring up the advanced menu, which allows the user to
change the sampler protocols. This menu should not be accessed unless authorized by
UC Davis personnel. This menu is described below.
ENTER - Pressing the ENTER key will return the sampler to AUTO MODE and display the
current status screen.
Change Date and Time
To change the current date and/or time, press the F2 key in the main menu. Figure 3-9
shows the menu for changing the Greenwich Mean Time (GMT). By pressing the F1 and
F2 keys the operator can adjust the value up or down. Pressing the F3 key changes the
value’s sign.
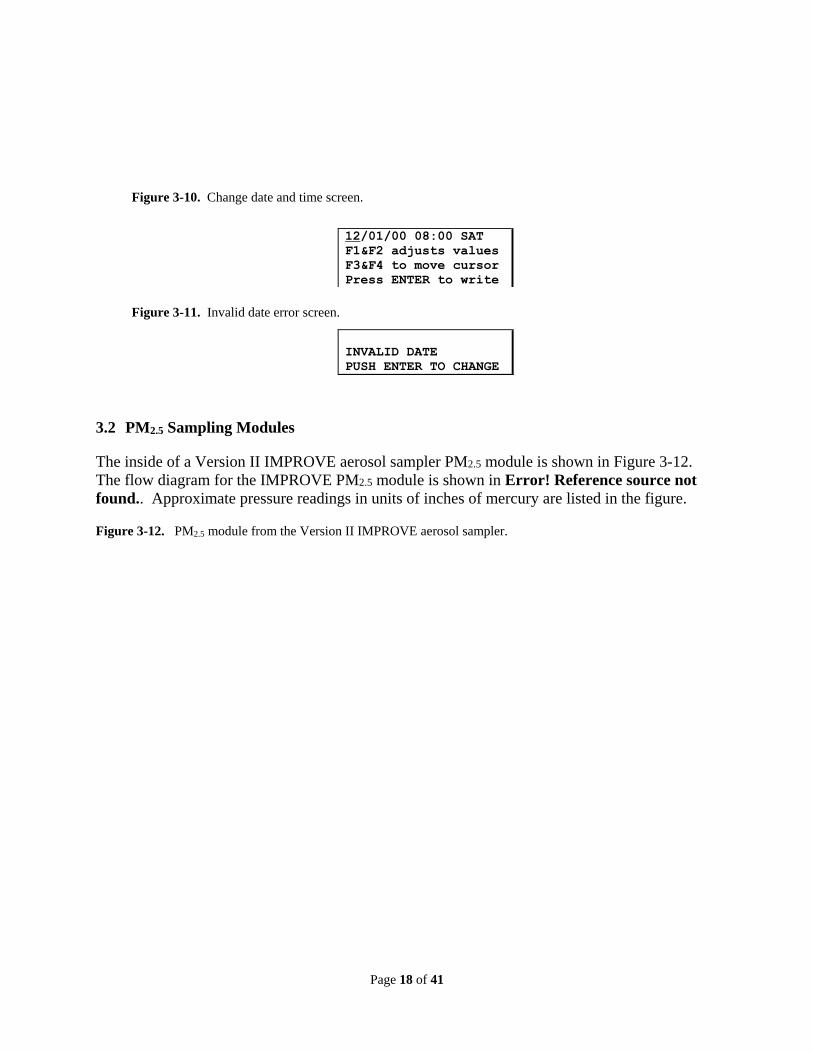
Figure 3-10. shows the menu for changing the date and time. By pressing the F3 and
F4 keys, the operator can move the cursor to change the month, day, year, hour or
minute. The day of the week will automatic change based on the month, day, and year.
If you enter an invalid date, the screen shown in Figure 3-11 will appear. An invalid date is
one that does not exist in the month (e.g., 2/30 or 9/31).
Figure 3-9. Change date and time screen.
F1=Filter Readings
F2=Change Date&Time
F3=Advanced Menu
ENTER=AUTO MODE
Enter GMT time zone
Offset, then press
enter. F3: +/-
-8:00 hours
Page 18
Page 18 of 41
Figure 3-10. Change date and time screen.
Figure 3-11. Invalid date error screen.
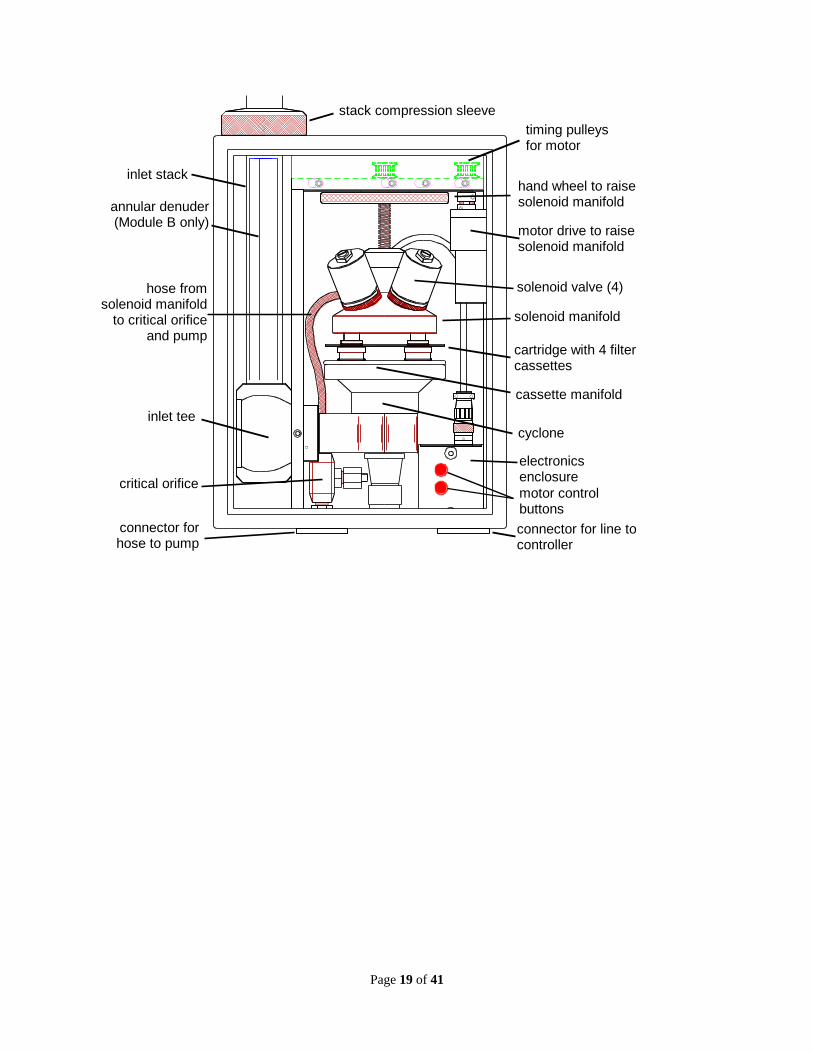
3.2 PM2.5 Sampling Modules
The inside of a Version II IMPROVE aerosol sampler PM2.5 module is shown in Figure 3-12.
The flow diagram for the IMPROVE PM2.5 module is shown in Error! Reference source not
found.. Approximate pressure readings in units of inches of mercury are listed in the figure.
Figure 3-12. PM2.5 module from the Version II IMPROVE aerosol sampler.
12/01/00 08:00 SAT
F1&F2 adjusts values
F3&F4 to move cursor
Press ENTER to write
INVALID DATE
PUSH ENTER TO CHANGE
Page 19
Page 19 of 41
stack compression sleeve
timing pulleys for motor
hand wheel to raise solenoid manifold
solenoid manifold
solenoid valve (4)
inlet stack
motor drive to raise solenoid manifold
inlet tee
hose from solenoid manifold
to critical orifice and pump
cyclone
cartridge with 4 filter cassettes
electronics enclosure
cassette manifold
connector for line to controller
connector for hose to pump
critical orifice
annular denuder (Module B only)
motor control buttons
Page 20
Page 20 of 41
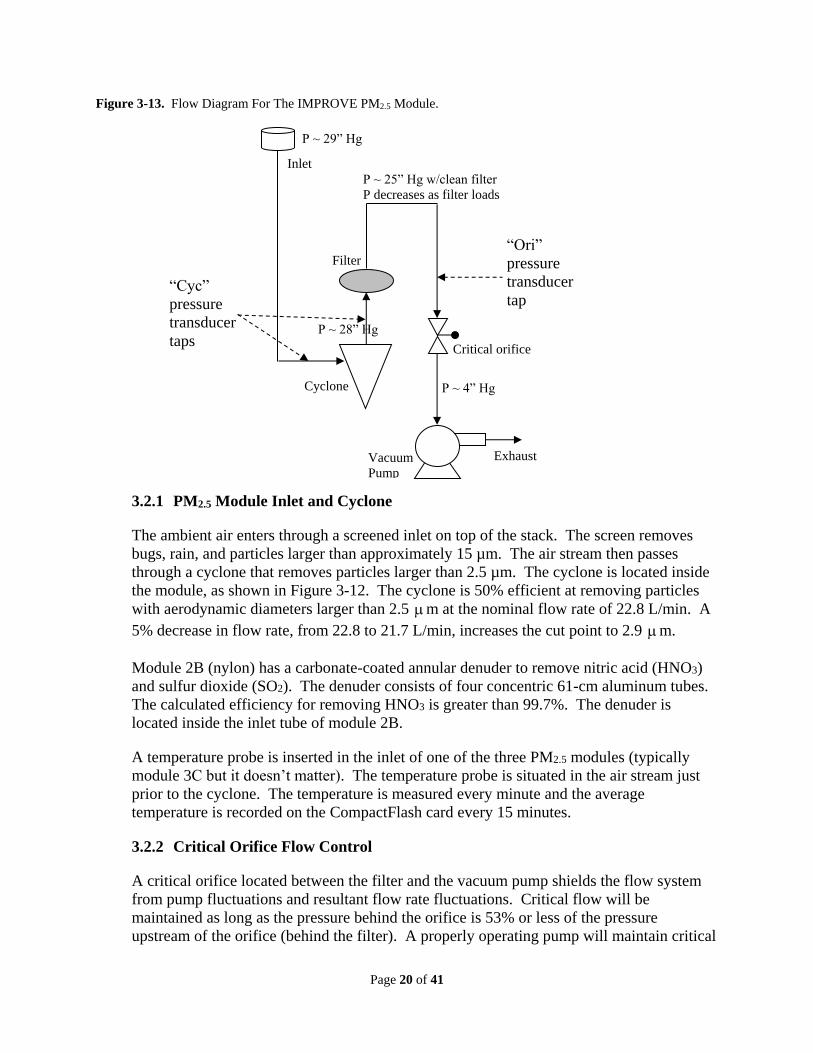
Figure 3-13. Flow Diagram For The IMPROVE PM2.5 Module.
3.2.1 PM2.5 Module Inlet and Cyclone
The ambient air enters through a screened inlet on top of the stack. The screen removes
bugs, rain, and particles larger than approximately 15 µm. The air stream then passes
through a cyclone that removes particles larger than 2.5 µm. The cyclone is located inside
the module, as shown in Figure 3-12. The cyclone is 50% efficient at removing particles
with aerodynamic diameters larger than 2.5 m at the nominal flow rate of 22.8 L/min. A
5% decrease in flow rate, from 22.8 to 21.7 L/min, increases the cut point to 2.9 m.
Module 2B (nylon) has a carbonate-coated annular denuder to remove nitric acid (HNO3)
and sulfur dioxide (SO2). The denuder consists of four concentric 61-cm aluminum tubes.
The calculated efficiency for removing HNO3 is greater than 99.7%. The denuder is
located inside the inlet tube of module 2B.
A temperature probe is inserted in the inlet of one of the three PM2.5 modules (typically
module 3C but it doesn’t matter). The temperature probe is situated in the air stream just
prior to the cyclone. The temperature is measured every minute and the average
temperature is recorded on the CompactFlash card every 15 minutes.
3.2.2 Critical Orifice Flow Control
A critical orifice located between the filter and the vacuum pump shields the flow system
from pump fluctuations and resultant flow rate fluctuations. Critical flow will be
maintained as long as the pressure behind the orifice is 53% or less of the pressure
upstream of the orifice (behind the filter). A properly operating pump will maintain critical
“Cyc”
pressure
transducer
taps
Exhaust
Critical orifice
Cyclone
Filter
Inlet
Vacuum
Pump
P ~ 4” Hg
P ~ 29” Hg
P ~ 28” Hg
P ~ 25” Hg w/clean filter
P decreases as filter loads
“Ori”
pressure
transducer
tap
Page 21
Page 21 of 41
flow under most conditions. Critical flow will be lost when a pump begins to fail or, more
commonly, when the filter loading is heavy (i.e., the air is very polluted). Heavy filter
loadings cause large pressure drops across the filter which result in the pressure in front of
the critical orifice being too low to maintain critical flow.
A needle valve serves as the critical orifice in the Version II IMPROVE PM2.5 aerosol
samplers. The valve is adjusted by an authorized technician during each annual
maintenance visit to achieve the desired nominal flowrate. A machined 0.062” ruby orifice
serves as the critical orifice in the version II IMPROVE PM10 aerosol samplers, with the
needle valve serving to fine tune the flow rate.
A constant volumetric flow rate of 22.8 L/min must be maintained to keep a 2.5 µm cut
point. Two factors can cause the flow rate to vary from the nominal: a change in pressure
drop across the filter or a change in ambient temperature. Each of these factors varies
throughout the course of every sampling period, the pressure drop due to gradual loading of
the filter with particles and the temperature due to natural variability. Although flow rates
vary by less than 1 L/min during a typical 24-hour period due to temperature fluctuations,
they sometimes vary more, especially when a filter begins to clog. The critical orifice does
not protect against these flow variations; its only purpose is to dampen pump fluctuations.
3.2.3 PM2.5 Module Flow Rate Measurement
The sample flow rate is monitored using pressure transducers. The controller will read and
record the transducer measurements every minute and record the averages every 15
minutes. The transducer measurements are calibrated for flow rate using an orifice flow
check device that has been calibrated to a primary flow standard at UC Davis. Duplicate
flow measurements are made in the PM2.5 modules.
The first flow rate measurement is the primary measurement used for the air quality data
and is referred to as the “CYC” measurement. The “CYC” flow rate is related to the
pressure drop of air as it passes through the cyclone. The two pressure transducers used to
measure the pressure drop are placed in the inlet tee and immediately after the cyclone.
The cyclone approximates a venturi-type meter. The flow rate equation is expressed in
terms of parameters determined during the flow rate calibration at the site. The equation
also includes a pressure function based on the elevation of the site, F(elev), and a
temperature function based on the average ambient temperature during sample collection.
The elevation factor is 1.00 for sites near sea level and increases to 1.20 at 10,000 feet, as
listed in Appendix I: Elevation factors. The temperature function is equal to 1.00 at 20C
and varies from 0.95 at -9°C (17F) to 1.05 at 50C (122°F). The equation for flow rate
based on the first set of transducers is
293
273T)elev(FM10Q ba
m
,
where
Qm = actual volumetric flow rate (L/min) from the “CYC” reading,
Page 22
Page 22 of 41
M = “CYC” reading on the controller screen,
F(elev) = the pressure function based on the elevation of the site (see Appendix III),
T = average ambient temperature during sampling (°C), and
a and b = empirical calibration constants normalized to 20°C and sea level pressure.
The second flow rate is referred to as the “ORI” measurement. The “ORI” flow rate is
related to the air pressure immediately before the critical orifice. The equation for flow
rate based on the second transducer is
293
273T)elev(FV*dcQv
,
where
Qv = actual volumetric flow rate (L/min) from the “ORI” reading,
V = “ORI” reading on the controller screen,
F(elev) = the pressure function based on the elevation of the site,
T = average ambient temperature during sampling (°C), and
c and d = empirical calibration constants normalized to 20°C and sea level pressure.
3.2.4 PM2.5 Module Filter Cassettes and Cartridges
The filter cassettes and cartridges are manufactured specifically for the IMPROVE
sampler. They are made of acetal homopolymer with stainless steel screens. The two
halves of the cassette snap together and are sealed with an o-ring. A special tool is required
to separate and assemble the two halves. This process is only done at the UC Davis central
laboratory when the filters are unloaded and reloaded. The individual cassettes are always
installed in cartridges, with four cassettes per cartridge. Most cassettes are secured in the
cartridges by a snap ring and cannot be removed easily. Some cassettes are to be moved
from one cartridge and to a second cartridge in the field; these cassettes are held in by an o-
ring and can be removed and inserted relatively easily. Each cartridge has a center hole
and a small alignment hole. When the cartridge is placed on the cyclone manifold,
alignment pins on the manifold prevent the cartridge from being rotated a quarter or half
turn. Each cassette is labeled with the site, module, and the sample collection date. When
the cartridges are loaded into the PM2.5 modules, the labels on the cartridges will always be
oriented downward.
3.3 PM10 Sampling Module
A Version II PM10 module is shown in Figure 3-14. Note that the PM10 module manifold is
oriented in the opposite direction as the PM2.5 module manifold.
Page 23
Page 23 of 41
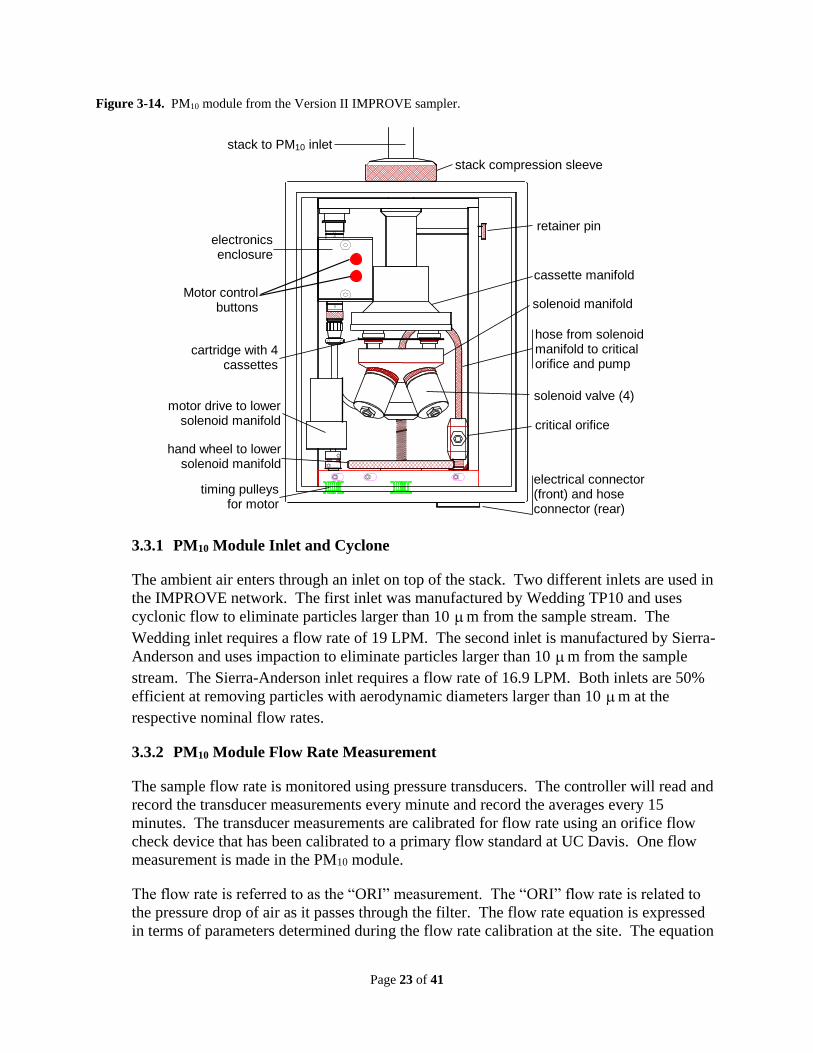
Figure 3-14. PM10 module from the Version II IMPROVE sampler.
stack compression sleeve
stack to PM10 inlet
electronics enclosure
motor drive to lower solenoid manifold
retainer pin
cassette manifold
cartridge with 4 cassettes
solenoid valve (4)
hose from solenoid manifold to critical orifice and pump
solenoid manifold
critical orifice
electrical connector (front) and hose connector (rear)
hand wheel to lower solenoid manifold
timing pulleys for motor
Motor control buttons
3.3.1 PM10 Module Inlet and Cyclone
The ambient air enters through an inlet on top of the stack. Two different inlets are used in
the IMPROVE network. The first inlet was manufactured by Wedding TP10 and uses
cyclonic flow to eliminate particles larger than 10 m from the sample stream. The
Wedding inlet requires a flow rate of 19 LPM. The second inlet is manufactured by Sierra-
Anderson and uses impaction to eliminate particles larger than 10 m from the sample
stream. The Sierra-Anderson inlet requires a flow rate of 16.9 LPM. Both inlets are 50%
efficient at removing particles with aerodynamic diameters larger than 10 m at the
respective nominal flow rates.
3.3.2 PM10 Module Flow Rate Measurement
The sample flow rate is monitored using pressure transducers. The controller will read and
record the transducer measurements every minute and record the averages every 15
minutes. The transducer measurements are calibrated for flow rate using an orifice flow
check device that has been calibrated to a primary flow standard at UC Davis. One flow
measurement is made in the PM10 module.
The flow rate is referred to as the “ORI” measurement. The “ORI” flow rate is related to
the pressure drop of air as it passes through the filter. The flow rate equation is expressed
in terms of parameters determined during the flow rate calibration at the site. The equation
Page 24
Page 24 of 41
also includes a pressure function based on the elevation of the site, F(elev), and a
temperature function based on the average ambient temperature during sample collection,
as described in Section 3.2.3. The equation for flow rate based on the second set of
transducers is
293
273T)elev(FV*dcQv
,
where
Qv = actual volumetric flow rate (L/min) from the “ORI” reading,
V = “ORI” reading on the controller screen,
F(elev) = the pressure function based on the elevation of the site (see Appendix III),
T = average ambient temperature during sampling (°C), and
c and d = empirical calibration constants normalized to 20°C and sea level pressure.
3.3.3 PM10 Module Filter Cassettes and Cartridges
The same cassettes and cartridges are used in the PM10 module as the PM2.5 modules,
which were described in Section 3.2.4. The only difference is that they are inserted upside
down compared to those for the PM2.5. For the PM10 module (4D), the labels and blue dot
on the cartridge will be facing down when they are installed in the sampler.
4. SAMPLER INSTALLATION
Prior to the installation of an IMPROVE sampler, the local support agency must establish power
and erect a shelter at the site to prepare for installation of the sampler. UC Davis will provide the
power requirements and shelter dimensions. UC Davis will ship the sampler to the site. A field
technician from UC Davis will install the sampler. The installation consists of
Placing the controller and filter modules on a wall of the shelter and cutting holes in the
ceiling for the inlets,
Installing the module inlets,
Connecting the cables between the controller, filter modules, and pumps,
Connecting the vacuum hoses between the modules and the pumps,
Selecting the sampling parameters,
Calibrating the flow rates of the sample modules,
Attaching the sample changing instructions to the inside of the controller door,
Training the site operators, and
Installing the initial set of sample cartridges with the site operators.
Page 25
Page 25 of 41
5. TUESDAY SAMPLE CHANGES
The sample cartridges should be changed every Tuesday. Alternative days for sample changes
are shown on the IMPROVE calendar and vary each week. It takes approximately fifteen
minutes to change the sample cartridges every Tuesday. Care must be taken during the change
to protect the samples from contamination by rain or snow.
5.1 Preparation
The Blue Box should be received 5 calendar days before the first sample-change day. If the
appropriate box is not present the Thursday before the sample-change date, the operator should
contact the UCD laboratory (530-752-1123).
Before going to the site, the operator must check the dates on the Blue Box(es). The operator
needs the Blue Box(es) with the bags for both the current install date and the previous install
date. For example, if the first date on the new Blue Box is today’s date, the operator should
bring both this Blue Box and the previous Blue Box. The used samples are returned to the
previous Blue Box, and the new samples are installed from the new Blue Box.
Figure 5-1. Field logsheet for sample cartridges with three cassettes (i.e., three sampling days).
Page 26
Page 26 of 41
Two of the three logsheets in every Blue Box will have three sampling days listed, while one of
the three logsheets will only have two sampling days listed.
5.2 Sample Change Procedures
The basic steps in the sample change procedures are: 1) collect the final (exposed) flow rate
readings for each used cassette; 2) remove the exposed cartridges; 3) install the clean cartridges;
4) collect the initial flow rate readings for each new cassette. This procedure must be repeated
for all four sampling modules: 1A, 2B, 3C, and 4D.
For two of every three Tuesday sample changes, the modules will not be actively collecting
samples. For one of every three Tuesday sample changes, the modules will be actively
collecting samples, and the sampling will have to be interrupted to change the filter cartridges.
The procedures required to change the cartridges on sampling days are slightly more complicated
than on the non-sampling days.
On the active sampling days, the operator will have to transfer the cassettes in position 3, which
are in the midst of sampling, from the old to the new cartridges. This transfer must be done for
each of the four modules because all four modules are sampling simultaneously. The position 3
cassettes have a black O-ring around them and are the only ones that can be removed without a
special tool. Figure 5-2 shows the removal of the position 3 cassette from a cartridge. This
cassette must be loaded into the open hole in position 3 of the new cartridge. After the cassette is
transferred to the new cartridge, the new cartridge is installed in the sampler. After the initial
readings are taken, the sampler will resume collection on the filters in position 3. If the roof does
not provide adequate protection from the elements, you should remove all four of the exposed
cartridges, move to a protected location, switch the position 3 cassettes from the old cartridges to
the new, and then return to the sampler to install the new cartridges.
Figure 5-2. Photos illustrating the removal of position 3 cassette (note black o-ring on removable cassette) from the
cartridge.
1) 2)
3)
Page 27
Page 27 of 41
The sample change procedures are detailed below. The procedures listed under the letter “a” are
for non-active sampling days, and the procedures listed under the letter “b” are for active
sampling days. There will be a series of informational screens with the upper lines showing
“One moment please” throughout this procedure when the pumps are being turned on or when
the readings are being recorded on the flash card. The display will automatically switch to the
next screen after several seconds.
1. Open the controller module door.
2. Fill in your initials, the date, and the time on the logsheet (Figure 5-1).
3. Make sure that the date and time on the controller module are correct. If they are off by more
than 5 minutes, note the problem on the logsheet and refer to Section 3.1.2 to enter the
correct date and time. If this is a sampling day, wait until the following week to correct the
time.
4. Also, note any unusual activities that occurred during sampling days on the logsheet (e.g.,
fires, road paving, power outage, etc.)
5. Initiate the sample change sequence by pressing the ENTER key followed by the F1 key to
collect the final filter readings. Press the YES key to continue with the filter readings
(Error! Reference source not found.).
6. Press the number corresponding to your initials.Enter your initials using keys F1/↓F2 to
toggle value and ←F3/ →F4 or press ENTER to exit. (
7. Figure 5-4).
8. Record the temperature measurement, “Temp=” (25C in Figure 5-5), in the blank labeled
“CurTemp” on the top right of the logsheet.
9. Hit Enter.
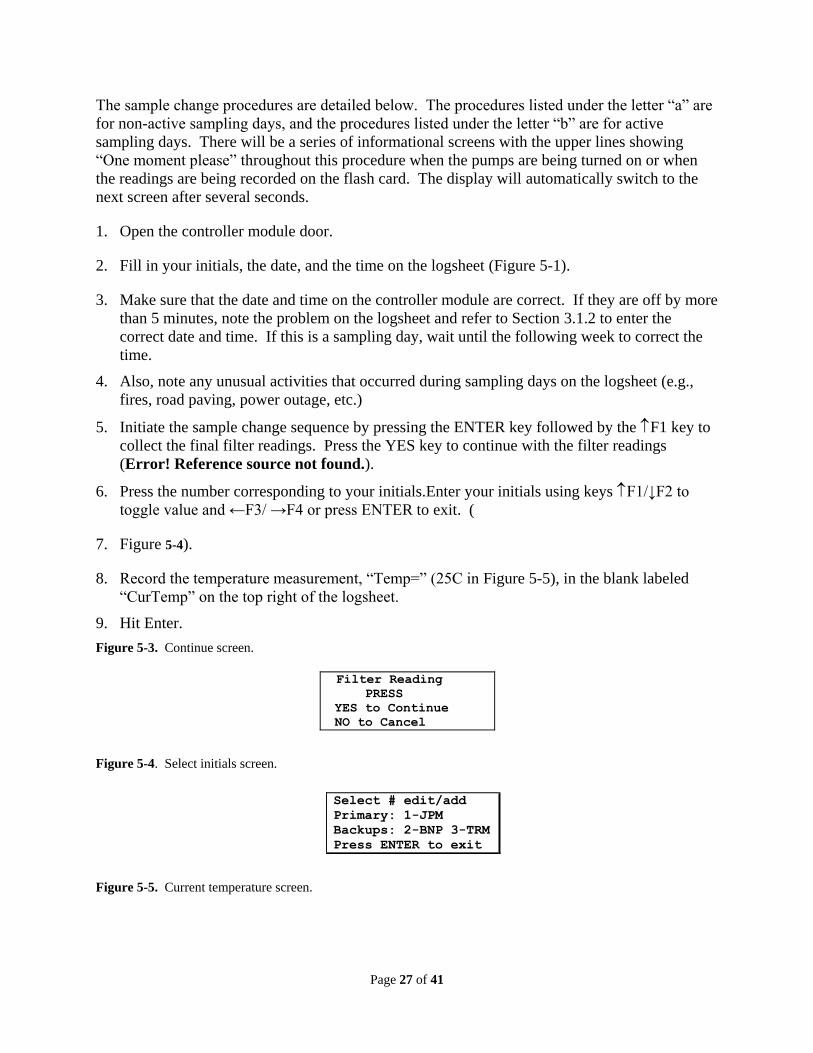
Figure 5-3. Continue screen.
Figure 5-4. Select initials screen.
Figure 5-5. Current temperature screen.
Filter Reading PRESS
YES to Continue
NO to Cancel
Select # edit/add
Primary: 1-JPM
Backups: 2-BNP 3-TRM
Press ENTER to exit
Page 28
Page 28 of 41
10. Record the Final Readings (Ori, Cyc, and ET) for each used cassette. Figure 5-6 shows the
pressure readings (Ori & Cyc) and elapsed time (ET) for the first cassette (FIL 1) in Module
A.
11. Press the F4 key to go to the next filter (and the F3 key to move to the previous
cassette). A standard sampler will have 8 or 12 filters (2 or 3 per module).
12. When all the Final Readings are collected, check that all blank fields on the log sheet are
filled in.
13. Note any problems or mistakes made during the sample change procedures (e.g., dropped
cartridge or cassette, touched filter with finger, etc.).
14. Also note any unusual events that occurred near the site (e.g., fires, construction, painting,
power outages, lightening strikes, fireworks, high traffic, etc.).
15. If all the readings are acceptable, press the F4 key (Figure 5-7). To redo the readings,
press the F3 key.
16. Put the completed logsheet in its original re-sealable bag (i.e., the re-sealable bag and the top
of the logsheet should be labeled with the same date).
17. Get out the new bag of filters labeled with the “USE WEEK” date displayed on the
controller. Figure 5-8 shows that the bag label for the week is 2/11/03.
18. Hit ENTER when you have the appropriate bag of filters.
Figure 5-6. Flow rate readings screen.
Figure 5-7. Continue screen.
Figure 5-8. Exchange cartridges screen.
USED WEEK:02/04/2003
Logsheet Temp=25C
02/11/03 10:17am TUE
Hit ENTER when ready
Mod1(A)
Cass Ori Cyc ET
(FIL1) 13 25 1440
F3-Bkwd F4-Fwd
F3-GO BACK to take
EXPOSED readings
F4-Continue with
CLEAN readings
USE WEEK:02/11/2003
Logsheet Entry T=95V
02/11/03 10:17am TUE
Hit ENTER when ready
Page 29
Page 29 of 41
19. Start with module 1A, which is color-coded red.
If this is not a sampling Tuesday, the sampler should not be running when you arrive at
the site.
a1. Figure 5-9 shows the screen that will be displayed on a non-sampling Tuesday.
b1. Remove the cartridge of used cassettes from the module by raising the sampling manifold
using the red motor control button and pulling out the cartridge.
c1. Put the red caps on the cassettes and return the used cartridge to its original re-sealable
bag.
d1. Remove the red caps from the new cassettes, and install the new cartridge in the module
align the new cartridge in the lower manifold with the pins through the holes in the
cartridge.
e1. Lower the manifold using the red motor control button (stop pressing the red button when
the motor starts to strain).
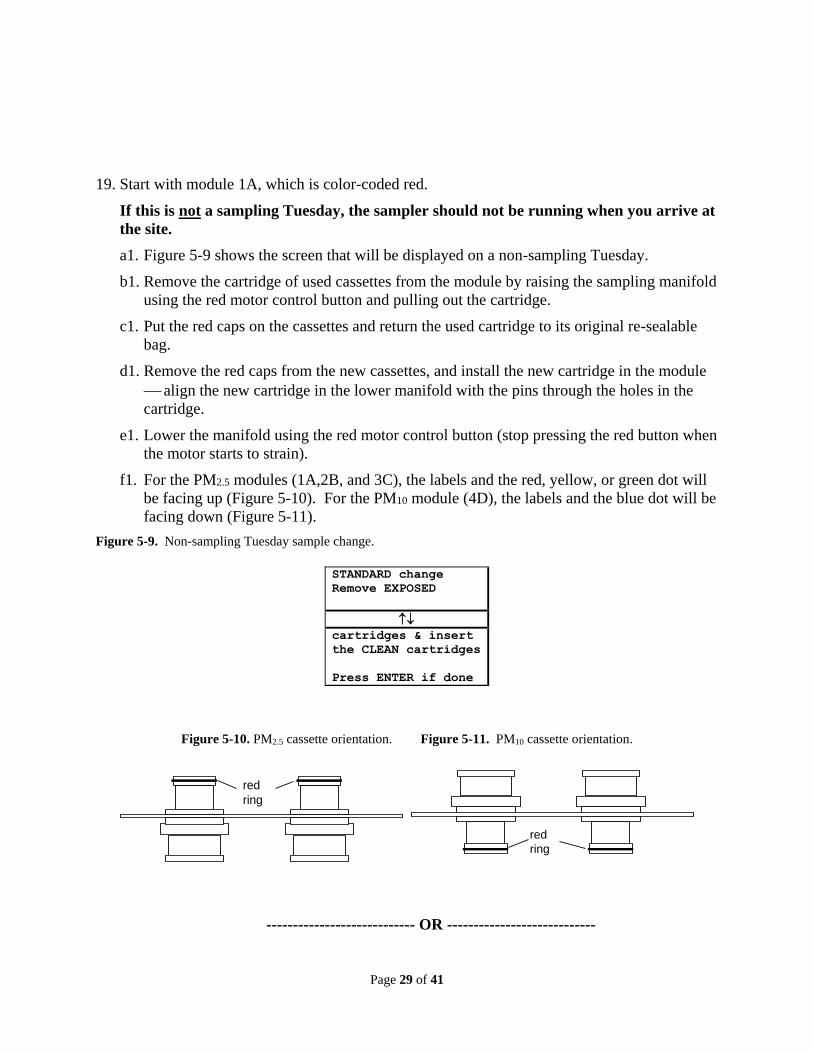
f1. For the PM2.5 modules (1A,2B, and 3C), the labels and the red, yellow, or green dot will
be facing up (Figure 5-10). For the PM10 module (4D), the labels and the blue dot will be
facing down (Figure 5-11).
Figure 5-9. Non-sampling Tuesday sample change.
Figure 5-10. PM2.5 cassette orientation. Figure 5-11. PM10 cassette orientation.
---------------------------- OR ----------------------------
STANDARD change
Remove EXPOSED
cartridges & insert
the CLEAN cartridges
Press ENTER if done
red
ring
red
ring
Page 30
Page 30 of 41
If this is a sampling Tuesday, the sampler should be running when you arrive at the
site.
a2. Figure 5-12 shows the screen that will be displayed on a sampling Tuesday.
b2. The old cartridge will have a black O-ring around the cassette in position 3, and the new
cartridge have an empty space in position 3.
c2. Remove the used cartridge from the sampler by raising the sampling manifold using the
red motor control button and pulling out the cartridge.
d2. Move the position 3 cassette of the used cartridge to the empty position in the new
cartridge. (Do not move the cassette label from the old cartridge to the new cartridge.)
e2. Install the new cartridge in the module align the new cartridge in the lower manifold
with the pins through the holes in the cartridge, and lower the manifold using the red
motor control button.
f2. Put the red caps on the used cassettes, and return the cartridge to its original re-sealable
bag.
g2. For the PM2.5 modules (1A,2B, and 3C), the stickers and the red, yellow, or green dot
will be oriented upwards. For the PM10 module (4D), the labels and the blue dot will be
facing down.
Figure 5-12. Active sampling Tuesday sample change.
20. Repeat Step 18 for modules 2B (yellow), 3C (green), and 4D (blue), making sure to install
the appropriately colored cartridge in each module.
21. Press the ENTER key when all the new cartridges are installed.
22. If today’s bag is the first in a new Blue Box, the controller will prompt the operator to change
the flash card (Figure 5-13). Otherwise, skip to step 22.
a. Remove the flash card from the controller by grasping it and pulling it out of the
controller.
b. Place the flashcard in the small ziploc bag in the old Blue Box.
NON-STANDARD change
Remove EXPOSED
cartridges and move
CASSETTE with BLACK
O-RING to the CLEAN
cartridges & insert
the CLEAN cartridges
Press ENTER if done
Page 31
Page 31 of 41
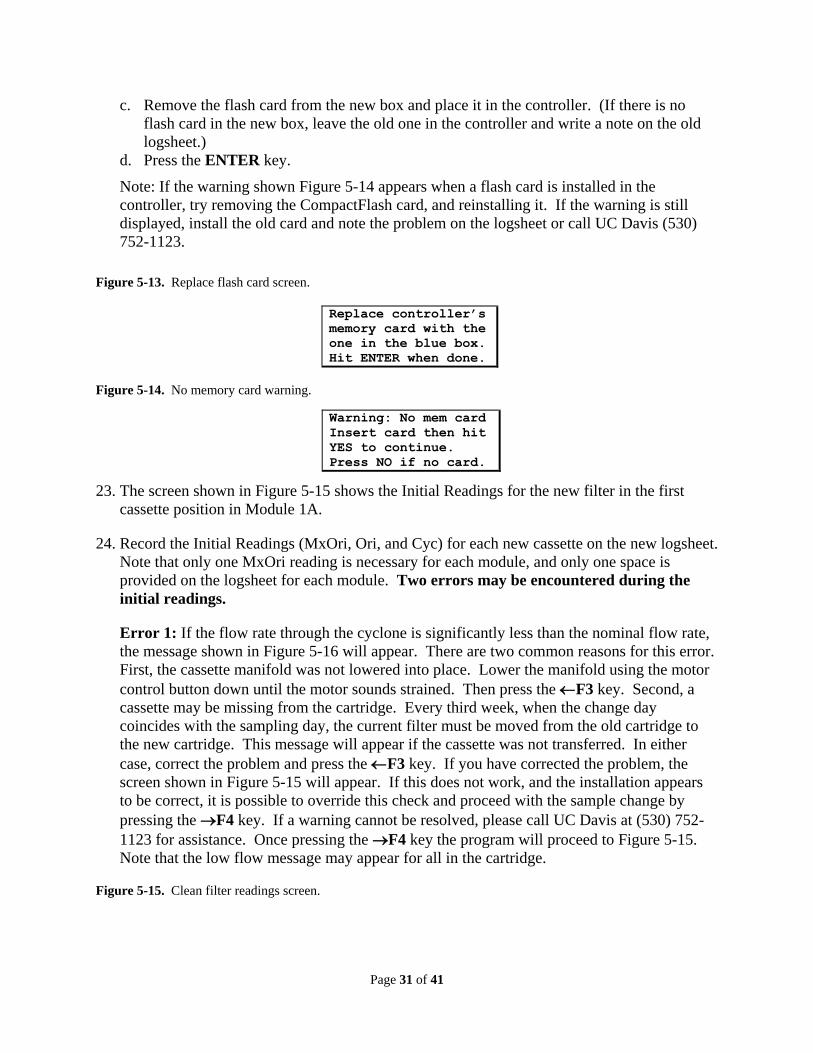
c. Remove the flash card from the new box and place it in the controller. (If there is no
flash card in the new box, leave the old one in the controller and write a note on the old
logsheet.)
d. Press the ENTER key.
Note: If the warning shown Figure 5-14 appears when a flash card is installed in the
controller, try removing the CompactFlash card, and reinstalling it. If the warning is still
displayed, install the old card and note the problem on the logsheet or call UC Davis (530)
752-1123.
Figure 5-13. Replace flash card screen.
Figure 5-14. No memory card warning.
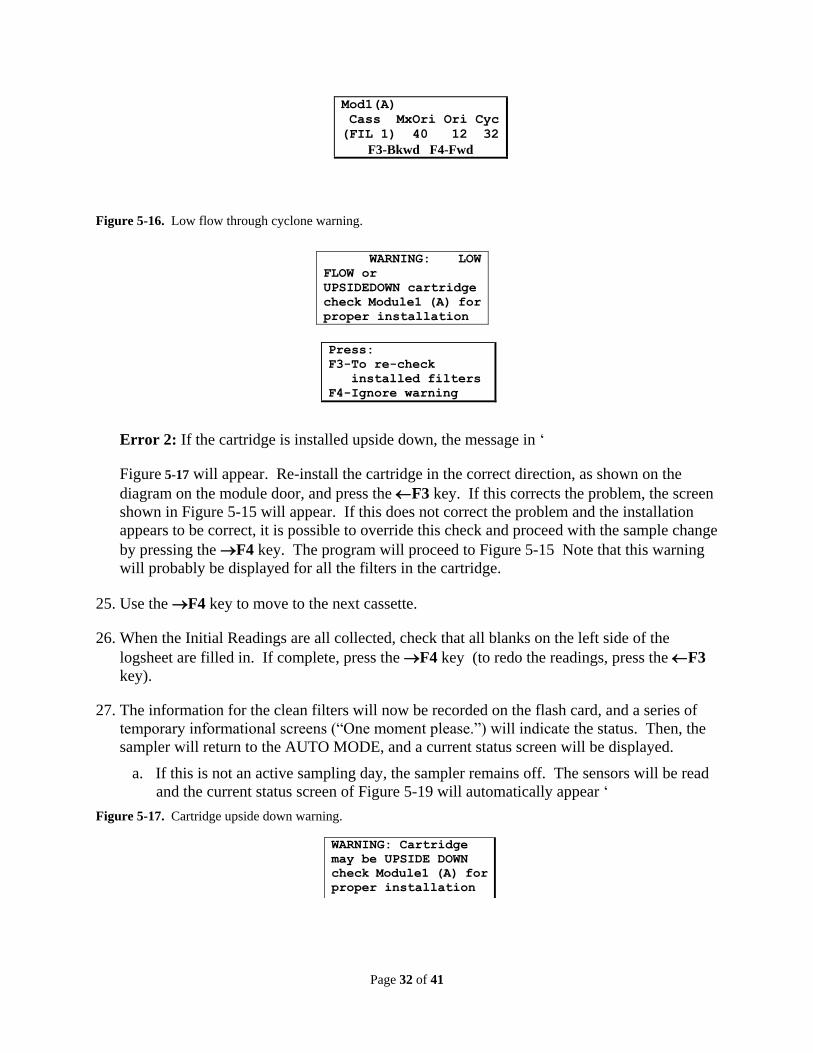
23. The screen shown in Figure 5-15 shows the Initial Readings for the new filter in the first
cassette position in Module 1A.
24. Record the Initial Readings (MxOri, Ori, and Cyc) for each new cassette on the new logsheet.
Note that only one MxOri reading is necessary for each module, and only one space is
provided on the logsheet for each module. Two errors may be encountered during the
initial readings.
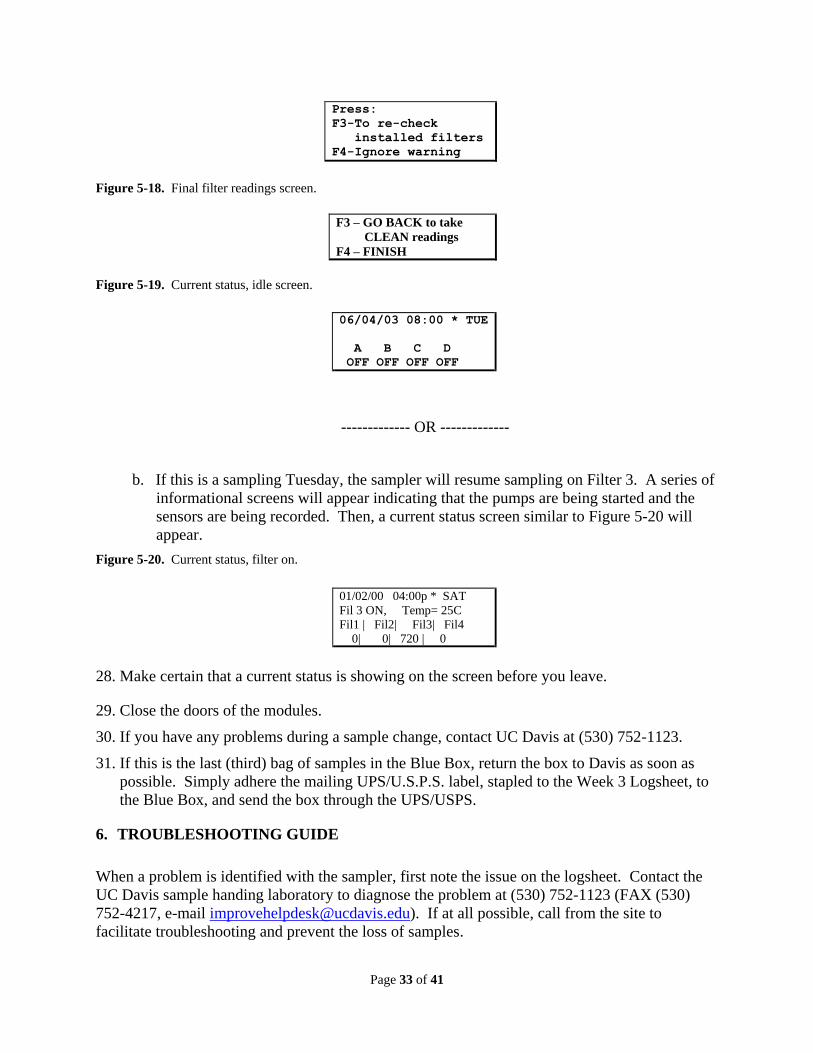
Error 1: If the flow rate through the cyclone is significantly less than the nominal flow rate,
the message shown in Figure 5-16 will appear. There are two common reasons for this error.
First, the cassette manifold was not lowered into place. Lower the manifold using the motor
control button down until the motor sounds strained. Then press the F3 key. Second, a
cassette may be missing from the cartridge. Every third week, when the change day
coincides with the sampling day, the current filter must be moved from the old cartridge to
the new cartridge. This message will appear if the cassette was not transferred. In either
case, correct the problem and press the F3 key. If you have corrected the problem, the
screen shown in Figure 5-15 will appear. If this does not work, and the installation appears
to be correct, it is possible to override this check and proceed with the sample change by
pressing the F4 key. If a warning cannot be resolved, please call UC Davis at (530) 752-
1123 for assistance. Once pressing the F4 key the program will proceed to Figure 5-15.
Note that the low flow message may appear for all in the cartridge.
Figure 5-15. Clean filter readings screen.
Replace controller’s
memory card with the
one in the blue box.
Hit ENTER when done.
Warning: No mem card
Insert card then hit
YES to continue.
Press NO if no card.
Page 32
Page 32 of 41
Figure 5-16. Low flow through cyclone warning.
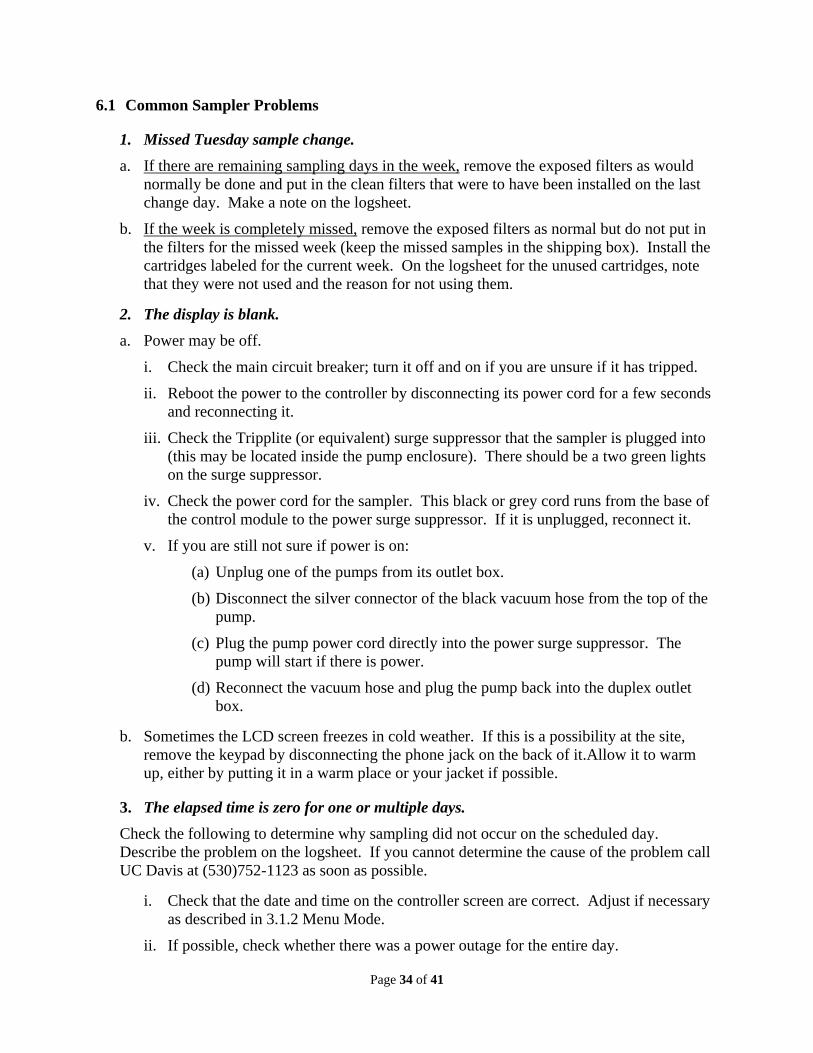
Error 2: If the cartridge is installed upside down, the message in ‘
Figure 5-17 will appear. Re-install the cartridge in the correct direction, as shown on the
diagram on the module door, and press the F3 key. If this corrects the problem, the screen
shown in Figure 5-15 will appear. If this does not correct the problem and the installation
appears to be correct, it is possible to override this check and proceed with the sample change
by pressing the F4 key. The program will proceed to Figure 5-15 Note that this warning
will probably be displayed for all the filters in the cartridge.
25. Use the F4 key to move to the next cassette.
26. When the Initial Readings are all collected, check that all blanks on the left side of the
logsheet are filled in. If complete, press the F4 key (to redo the readings, press the F3
key).
27. The information for the clean filters will now be recorded on the flash card, and a series of
temporary informational screens (“One moment please.”) will indicate the status. Then, the
sampler will return to the AUTO MODE, and a current status screen will be displayed.
a. If this is not an active sampling day, the sampler remains off. The sensors will be read
and the current status screen of Figure 5-19 will automatically appear ‘
Figure 5-17. Cartridge upside down warning.
Mod1(A)
Cass MxOri Ori Cyc
(FIL 1) 40 12 32
F3-Bkwd F4-Fwd
WARNING: LOW
FLOW or
UPSIDEDOWN cartridge
check Module1 (A) for
proper installation
Press:
F3-To re-check
installed filters
F4-Ignore warning
WARNING: Cartridge
may be UPSIDE DOWN
check Module1 (A) for
proper installation
Page 33
Page 33 of 41
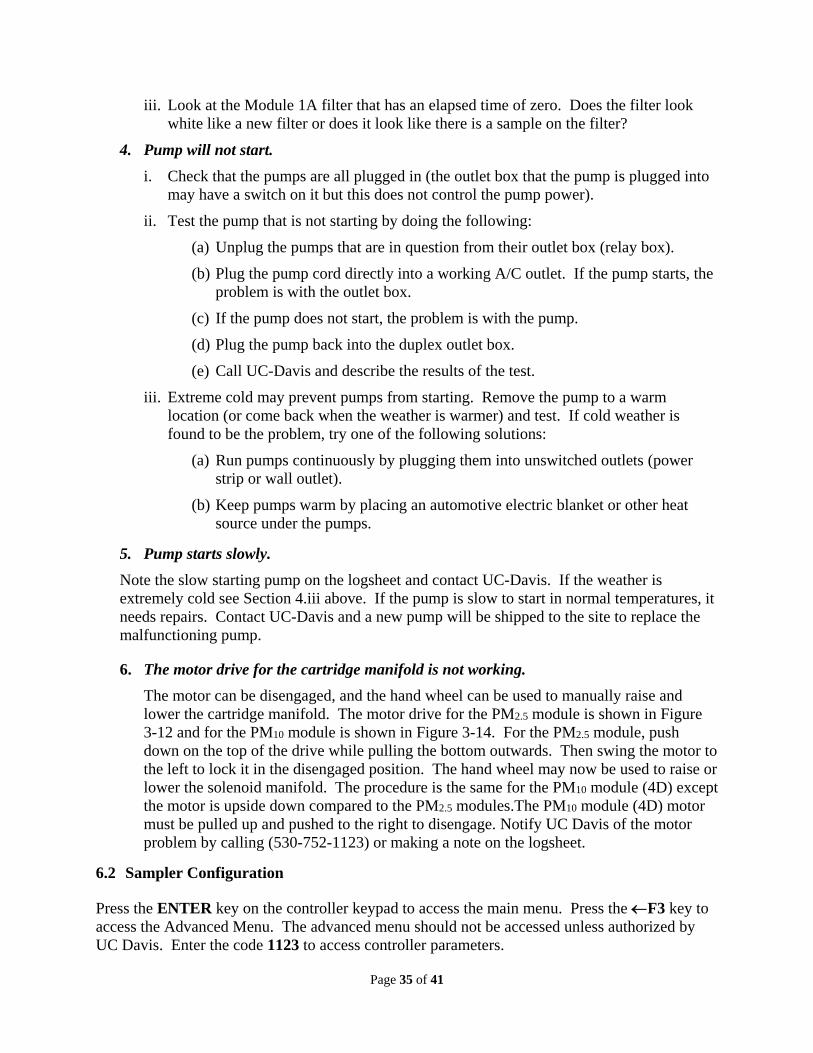
Figure 5-18. Final filter readings screen.
Figure 5-19. Current status, idle screen.
------------- OR -------------
b. If this is a sampling Tuesday, the sampler will resume sampling on Filter 3. A series of
informational screens will appear indicating that the pumps are being started and the
sensors are being recorded. Then, a current status screen similar to Figure 5-20 will
appear.
Figure 5-20. Current status, filter on.
28. Make certain that a current status is showing on the screen before you leave.
29. Close the doors of the modules.
30. If you have any problems during a sample change, contact UC Davis at (530) 752-1123.
31. If this is the last (third) bag of samples in the Blue Box, return the box to Davis as soon as
possible. Simply adhere the mailing UPS/U.S.P.S. label, stapled to the Week 3 Logsheet, to
the Blue Box, and send the box through the UPS/USPS.
6. TROUBLESHOOTING GUIDE
When a problem is identified with the sampler, first note the issue on the logsheet. Contact the
UC Davis sample handing laboratory to diagnose the problem at (530) 752-1123 (FAX (530)
752-4217, e-mail [email protected] ). If at all possible, call from the site to
facilitate troubleshooting and prevent the loss of samples.
Press:
F3-To re-check
installed filters
F4-Ignore warning
F3 – GO BACK to take
CLEAN readings
F4 – FINISH
06/04/03 08:00 * TUE
A B C D
OFF OFF OFF OFF
01/02/00 04:00p * SAT
Fil 3 ON, Temp= 25C
Fil1 | Fil2| Fil3| Fil4
0| 0| 720 | 0
Page 34
Page 34 of 41
6.1 Common Sampler Problems
1. Missed Tuesday sample change.
a. If there are remaining sampling days in the week, remove the exposed filters as would
normally be done and put in the clean filters that were to have been installed on the last
change day. Make a note on the logsheet.
b. If the week is completely missed, remove the exposed filters as normal but do not put in
the filters for the missed week (keep the missed samples in the shipping box). Install the
cartridges labeled for the current week. On the logsheet for the unused cartridges, note
that they were not used and the reason for not using them.
2. The display is blank.
a. Power may be off.
i. Check the main circuit breaker; turn it off and on if you are unsure if it has tripped.
ii. Reboot the power to the controller by disconnecting its power cord for a few seconds
and reconnecting it.
iii. Check the Tripplite (or equivalent) surge suppressor that the sampler is plugged into
(this may be located inside the pump enclosure). There should be a two green lights
on the surge suppressor.
iv. Check the power cord for the sampler. This black or grey cord runs from the base of
the control module to the power surge suppressor. If it is unplugged, reconnect it.
v. If you are still not sure if power is on:
(a) Unplug one of the pumps from its outlet box.
(b) Disconnect the silver connector of the black vacuum hose from the top of the
pump.
(c) Plug the pump power cord directly into the power surge suppressor. The
pump will start if there is power.
(d) Reconnect the vacuum hose and plug the pump back into the duplex outlet
box.
b. Sometimes the LCD screen freezes in cold weather. If this is a possibility at the site,
remove the keypad by disconnecting the phone jack on the back of it.Allow it to warm
up, either by putting it in a warm place or your jacket if possible.
3. The elapsed time is zero for one or multiple days.
Check the following to determine why sampling did not occur on the scheduled day.
Describe the problem on the logsheet. If you cannot determine the cause of the problem call
UC Davis at (530)752-1123 as soon as possible.
i. Check that the date and time on the controller screen are correct. Adjust if necessary
as described in 3.1.2 Menu Mode.
ii. If possible, check whether there was a power outage for the entire day.
Page 35
Page 35 of 41
iii. Look at the Module 1A filter that has an elapsed time of zero. Does the filter look
white like a new filter or does it look like there is a sample on the filter?
4. Pump will not start.
i. Check that the pumps are all plugged in (the outlet box that the pump is plugged into
may have a switch on it but this does not control the pump power).
ii. Test the pump that is not starting by doing the following:
(a) Unplug the pumps that are in question from their outlet box (relay box).
(b) Plug the pump cord directly into a working A/C outlet. If the pump starts, the
problem is with the outlet box.
(c) If the pump does not start, the problem is with the pump.
(d) Plug the pump back into the duplex outlet box.
(e) Call UC-Davis and describe the results of the test.
iii. Extreme cold may prevent pumps from starting. Remove the pump to a warm
location (or come back when the weather is warmer) and test. If cold weather is
found to be the problem, try one of the following solutions:
(a) Run pumps continuously by plugging them into unswitched outlets (power
strip or wall outlet).
(b) Keep pumps warm by placing an automotive electric blanket or other heat
source under the pumps.
5. Pump starts slowly.
Note the slow starting pump on the logsheet and contact UC-Davis. If the weather is
extremely cold see Section 4.iii above. If the pump is slow to start in normal temperatures, it
needs repairs. Contact UC-Davis and a new pump will be shipped to the site to replace the
malfunctioning pump.
6. The motor drive for the cartridge manifold is not working.
The motor can be disengaged, and the hand wheel can be used to manually raise and
lower the cartridge manifold. The motor drive for the PM2.5 module is shown in Figure
3-12 and for the PM10 module is shown in Figure 3-14. For the PM2.5 module, push
down on the top of the drive while pulling the bottom outwards. Then swing the motor to
the left to lock it in the disengaged position. The hand wheel may now be used to raise or
lower the solenoid manifold. The procedure is the same for the PM10 module (4D) except
the motor is upside down compared to the PM2.5 modules.The PM10 module (4D) motor
must be pulled up and pushed to the right to disengage. Notify UC Davis of the motor
problem by calling (530-752-1123) or making a note on the logsheet.
6.2 Sampler Configuration
Press the ENTER key on the controller keypad to access the main menu. Press the F3 key to
access the Advanced Menu. The advanced menu should not be accessed unless authorized by
UC Davis. Enter the code 1123 to access controller parameters.
Page 36
Page 36 of 41
Once accessed, the operator will be able perform calibrations on the sampler by pressing the F1
key. Pressing the F2 key will allow the operator to check and change, if necessary, the sampler
configuration including the Serial Number, time average, sample change day, and module type.
Old UCCODE #: Check that the proper 4-digit site code is displayed on this screen. Enter the
4-digit site code assigned by UCD.
Module types: This screen is used to specify the number and type of modules operating at the
site. If the current information is correct, press ENTER to save. Otherwise, enter the correct
information and press ENTER to save.
X Module Type: This screen is used to select what particle size the X module (if present) will
select for.
Time average: Enter the time interval, which the data will be reported to the serial flash card.
Typically the value will be 15 minutes.
Change day: This is the day that the sample changes are performed. This will always be set to
Tuesday unless otherwise specified by UCD.
Authorized use only
Please enter code:
****
F1=Calib
F2=Site Config.
F3=Operator Initials
ENTER = Main Menu
Old UCCODE: 1138
F1&F2 = Toggle Value
F3&F4 = Move Cursor
Press ENTER to save
PORT/MOD Select
PORT: 1 2 3 4 5
MOD: A B C D X
Press ENTER to save
X Module Type
CURRENT X MOD=PM 2.5
F1=PM 2.5 F2=PM 10
PRESS F1orF2 SELECT
CFLSH AVG (min): 15
F1&F2 = Toggle Value
F3&F4 = Move Cursor
Press ENTER to save
Page 37
Page 37 of 41
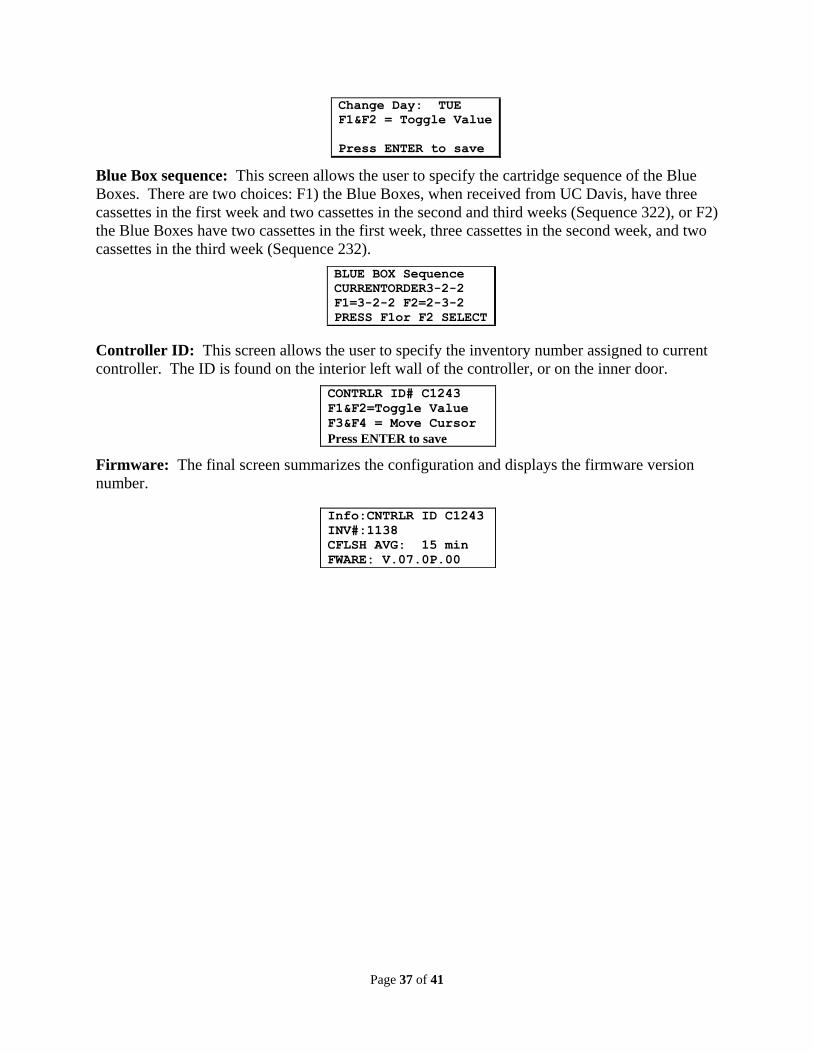
Blue Box sequence: This screen allows the user to specify the cartridge sequence of the Blue
Boxes. There are two choices: F1) the Blue Boxes, when received from UC Davis, have three
cassettes in the first week and two cassettes in the second and third weeks (Sequence 322), or F2)
the Blue Boxes have two cassettes in the first week, three cassettes in the second week, and two
cassettes in the third week (Sequence 232).
Controller ID: This screen allows the user to specify the inventory number assigned to current
controller. The ID is found on the interior left wall of the controller, or on the inner door.
Firmware: The final screen summarizes the configuration and displays the firmware version
number.
Change Day: TUE
F1&F2 = Toggle Value
Press ENTER to save
BLUE BOX Sequence
CURRENTORDER3-2-2
F1=3-2-2 F2=2-3-2
PRESS F1or F2 SELECT
CONTRLR ID# C1243
F1&F2=Toggle Value
F3&F4 = Move Cursor
Press ENTER to save
Info:CNTRLR ID C1243
INV#:1138
CFLSH AVG: 15 min
FWARE: V.07.0P.00
Page 38
Page 38 of 41
APPENDIX I: ELEVATION FACTORS
Table AI-1. Elevation factors for a range of elevations. The elevations are listed in units of both meters (m) and feet
(ft) above mean sea level. The pressure in units of millimeters of mercury is also listed for each elevation.
Elevation F(elev)
P Elevation F(elev)
P Elevation F(elev)
P
(m) (ft) (mmHg) (m) (ft) (mmHg) (m) (ft) (mmHg)
0 0 1.000 29.90 1200 3,936 1.075 25.88 2400 7,872 1.158 22.32
50 164 1.003 29.72 1250 4,100 1.078 25.73 2450 8,036 1.161 22.18
100 328 1.006 29.55 1300 4,264 1.081 25.57 2500 8,200 1.165 22.04
150 492 1.009 29.37 1350 4,428 1.085 25.41 2550 8,364 1.168 21.90
200 656 1.012 29.20 1400 4,592 1.088 25.26 2600 8,528 1.172 21.76
250 820 1.015 29.02 1450 4,756 1.091 25.10 2650 8,692 1.176 21.63
300 984 1.018 28.85 1500 4,920 1.095 24.95 2700 8,856 1.180 21.49
350 1,148 1.021 28.68 1550 5,084 1.098 24.80 2750 9,020 1.183 21.35
400 1,312 1.024 28.51 1600 5,248 1.101 24.65 2800 9,184 1.187 21.22
450 1,476 1.027 28.34 1650 5,412 1.105 24.49 2850 9,348 1.191 21.09
500 1,640 1.030 28.17 1700 5,576 1.108 24.34 2900 9,512 1.195 20.95
550 1,804 1.033 28.00 1750 5,740 1.112 24.19 2950 9,676 1.198 20.82
600 1,968 1.036 27.83 1800 5,904 1.115 24.05 3000 9,840 1.202 20.69
650 2,132 1.040 27.67 1850 6,068 1.119 23.90 3050 10,004 1.206 20.56
700 2,296 1.043 27.50 1900 6,232 1.122 23.75 3100 10,168 1.210 20.43
750 2,460 1.046 27.34 1950 6,396 1.126 23.60 3150 10,332 1.214 20.30
800 2,624 1.049 27.17 2000 6,560 1.129 23.46 3200 10,496 1.218 20.17
850 2,788 1.052 27.01 2050 6,724 1.133 23.31 3250 10,660 1.221 20.04
900 2,952 1.055 26.84 2100 6,888 1.136 23.17 3300 10,824 1.225 19.91
950 3,116 1.059 26.68 2150 7,052 1.140 23.02 3350 10,988 1.229 19.79
1000 3,280 1.062 26.52 2200 7,216 1.143 22.88 3400 11,152 1.233 19.66
1050 3,444 1.065 26.36 2250 7,380 1.147 22.74 3450 11,316 1.237 19.53
1100 3,608 1.068 26.20 2300 7,544 1.150 22.60 3500 11,480 1.241 19.41
1150 3,772 1.072 26.04 2350 7,708 1.154 22.46 3550 11,644 1.245 19.28
1200 3,936 1.075 25.88 2400 7,872 1.158 22.32 3600 11,808 1.249 19.16
Page 39
Page 39 of 41
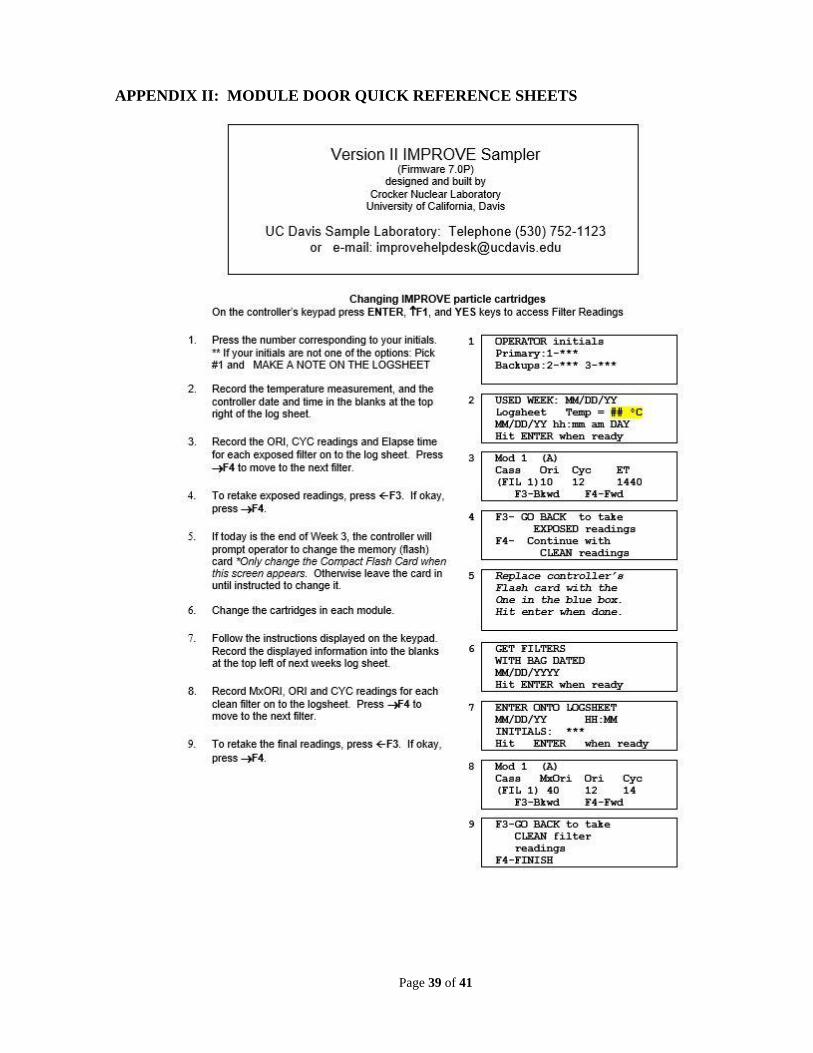
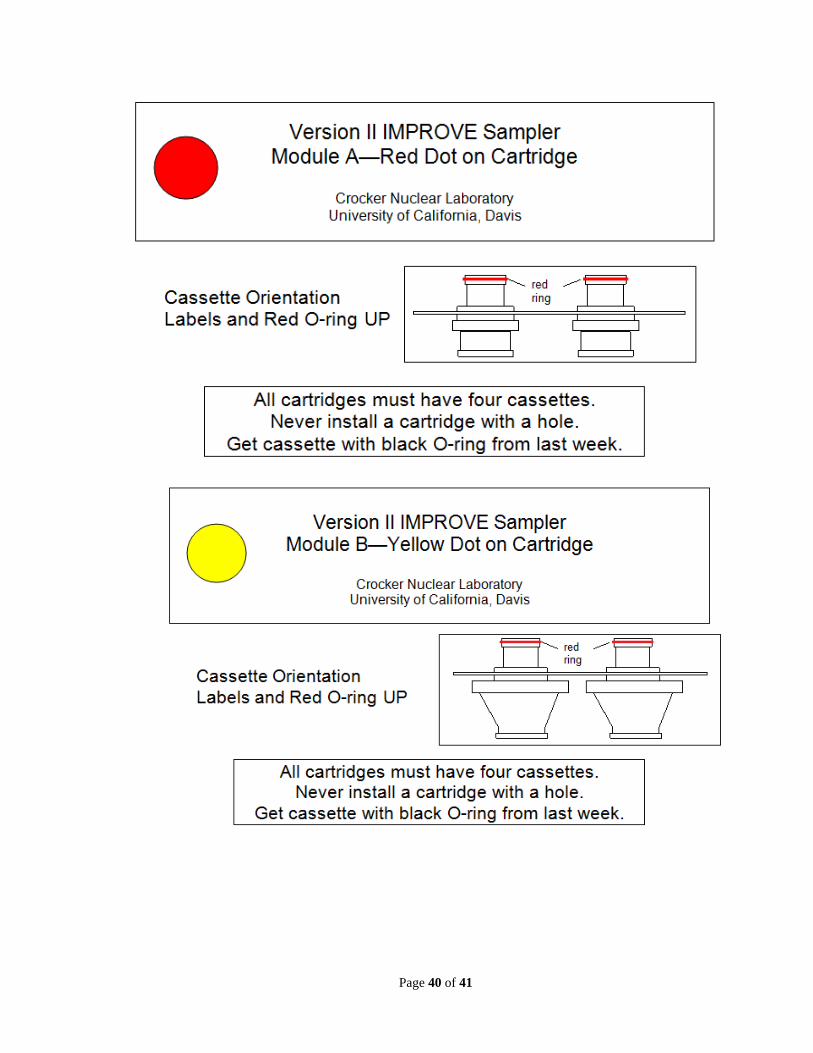
APPENDIX II: MODULE DOOR QUICK REFERENCE SHEETS