Standard Problem Exercise No. 3 Model 1: Tendon Behavior Model April 13-14, 2011 Herman Graves Lili Akin Robert Dameron, PE Patrick Chang, PE Sandia National Laboratories is a multi-program laboratory managed and operated by Sandia Corporation, a wholly owned subsidiary of Lockheed Martin Corporation, for the U.S. Department of Energy’s National Nuclear Security Administration under contract DE-AC04-94AL85000.
Transcript
Standard Problem Exercise No. 3
Model 1: Tendon Behavior Model
April 13-14, 2011
Herman Graves
Lili Akin
Robert Dameron, PE
Patrick Chang, PE
Sandia National Laboratories is a multi-program laboratory managed and operated by Sandia Corporation,
a wholly owned subsidiary of Lockheed Martin Corporation, for the U.S. Department of Energy’s
National Nuclear Security Administration under contract DE-AC04-94AL85000.
Standard Problem Exercise No. 3 Summary
• SPE No. 3 examines PCCV local effects and,
ultimately, developing pressure versus leakage
relationships
• First phase analysis focuses on:
2
- Effects of containment dilation on prestressing
force
- Slippage of prestressing and effects of force
- Steel-concrete interface
- Fracture mechanics behavior
- Scatter in data of prestressed concrete
properties
Model 1: Tendon Behavior Model
• Modeling assumptions, initial conditions, and
analysis results are presented for
1) Pressure only analysis
2) Pressure + temperature (saturated steam
condition) analysis
3
Model Geometry and Initial Conditions
4
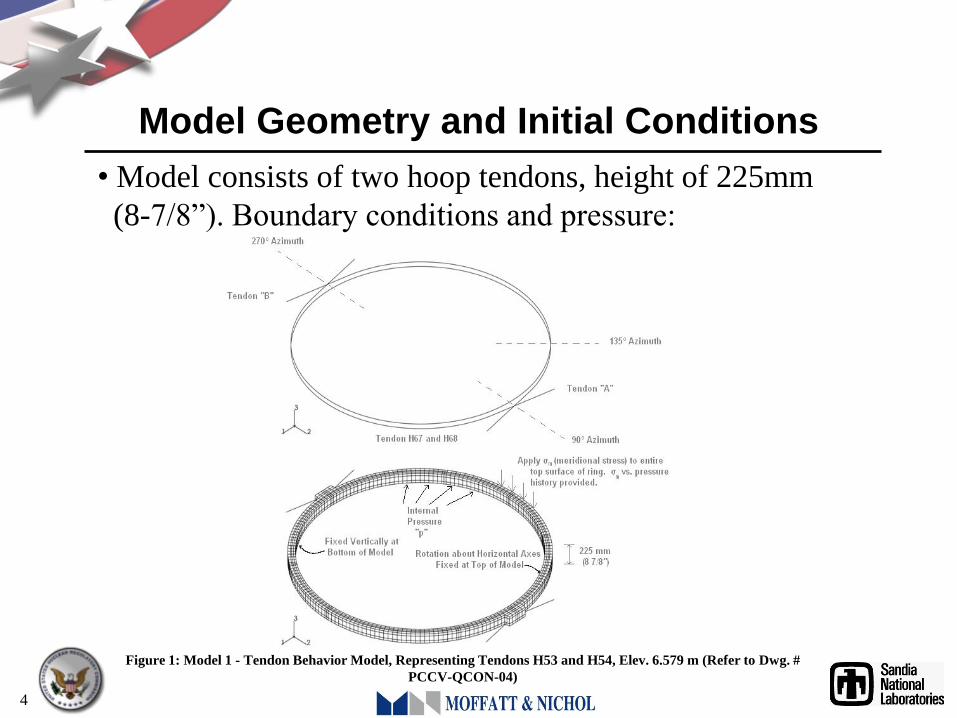
Figure 1: Model 1 - Tendon Behavior Model, Representing Tendons H53 and H54, Elev. 6.579 m (Refer to Dwg. #
PCCV-QCON-04)
• Model consists of two hoop tendons, height of 225mm
(8-7/8”). Boundary conditions and pressure:
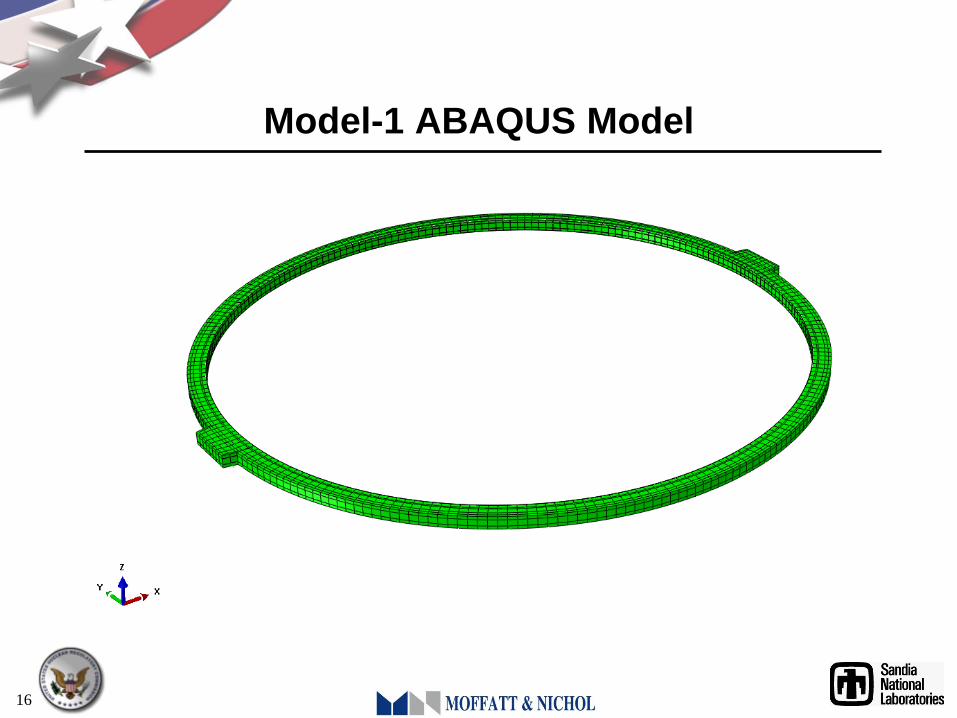
Model Geometry and Initial Conditions
• ABAQUS Standard FE program was used
• Model includes concrete, tendons, rebar (hoop
and shear reinforcement), and liner
• Concrete modeled with 8-node 3D solid elements;
Rebar modeled with embedded subelements;
Tendons with 2-node truss elements; Liner with
4-node shell elements, perfectly bonded to
concrete
5
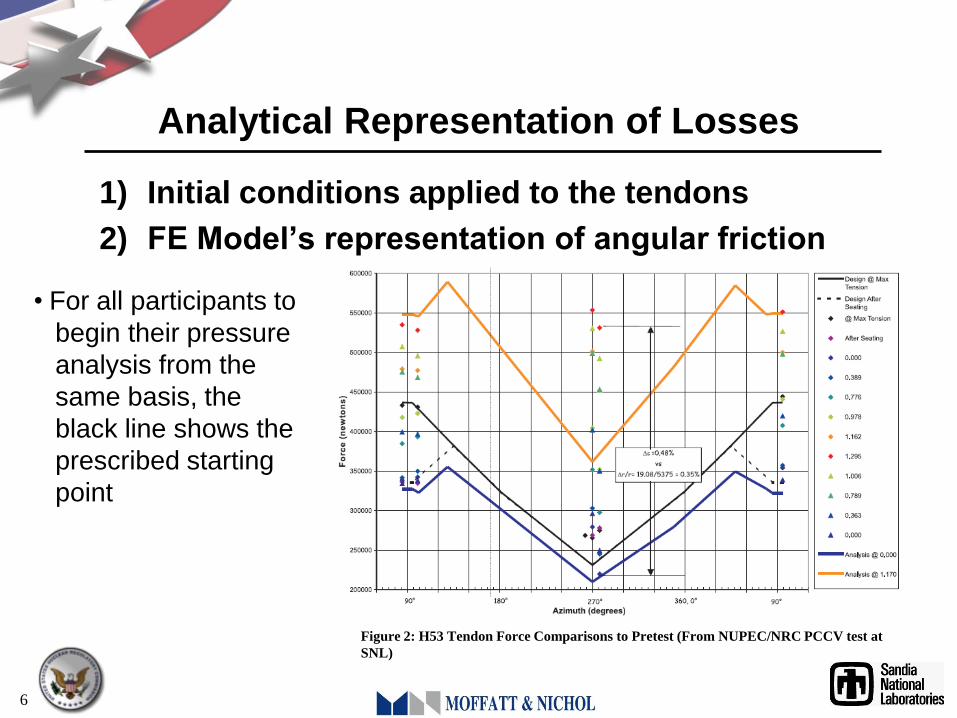
Analytical Representation of Losses
1) Initial conditions applied to the tendons
2) FE Model‟s representation of angular friction
6
Figure 2: H53 Tendon Force Comparisons to Pretest (From NUPEC/NRC PCCV test at
SNL)
• For all participants to
begin their pressure
analysis from the
same basis, the
black line shows the
prescribed starting
point
Meridional Stress vs. Internal Pressure
• Relationship between the meridional stress, σm
and the internal pressure, p at level 6.579m is
prescribed by:
σm from dead load, prestress, internal pressure
= 7.02 – p*8.27MPa
(p in MPA, (+) compression, (-) tension)
(Equation developed by SPE Participant, Scanscot)
7
Additional Information About Tendon
Friction and Seating Losses
8
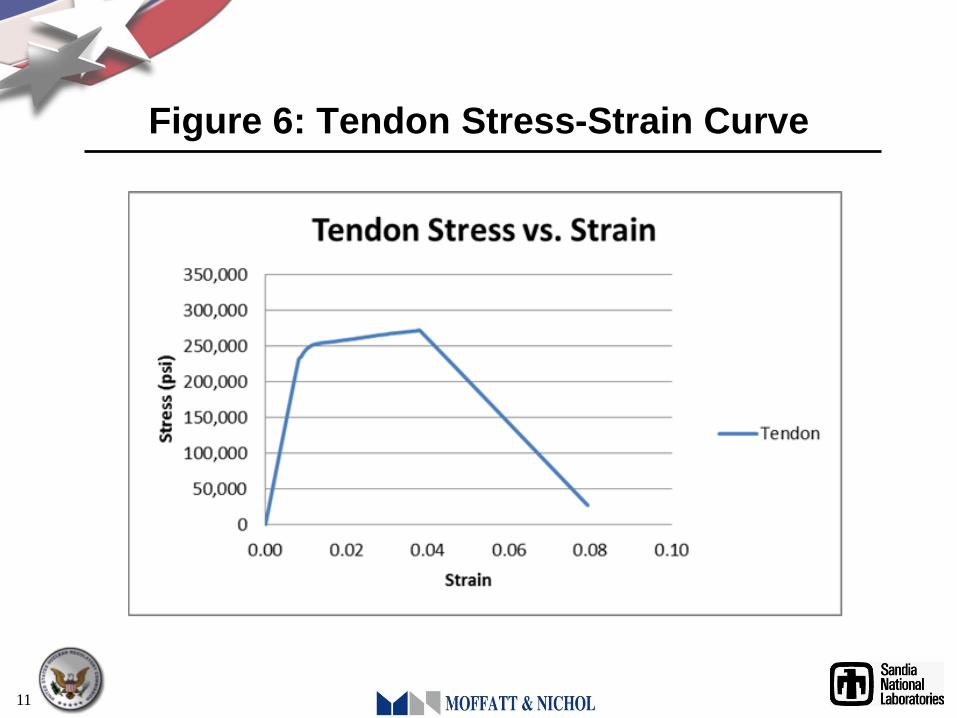
Material Modeling
• Tendon, rebar, and concrete material stress-strain
assumptions were implemented as tabulated in Appendix 1
of NUREG/CR-6810.
• Concrete simulated using ABAQUS concrete “Damaged
Plasticity”, smeared-cracking in tension (where cracking
occurs at element integration points) and a compressive
plasticity theory.
• Steel simulated using ABAQUS Standard Plasticity where
the stress-strain inputs consist of effective stress (Mises)
and effective strain. Inputs taken directly from SPE