+ All Categories
Home > Documents > Standard Test Methods for Determining Hardenability of … · Standard Test Methods for Determining...

Standard Test Methods for Determining Hardenability of … · Standard Test Methods for Determining...

Date post: 06-Apr-2018
Category:
Upload: dangcong
View: 237 times
Download: 2 times
Share this document with a friend
24
Designation: A 255 – 02 Standard Test Methods for Determining Hardenability of Steel 1 This standard is issued under the fixed designation A 255; the number immediately following the designation indicates the year of original adoption or, in the case of revision, the year of last revision. A number in parentheses indicates the year of last reapproval. A superscript epsilon (e) indicates an editorial change since the last revision or reapproval. This standard has been approved for use by agencies of the Department of Defense. 1. Scope* 1.1 These test methods cover the identification and descrip- tion of test methods for determining the hardenability of steels. The two test methods include the quantitative end-quench or Jominy Test and a method for calculating the hardenability of steel from the chemical composition based on the original work by M. A. Grossman. 1.2 The selection of the test method to be used for deter- mining the hardenability of a given steel shall be agreed upon between the supplier and user. The Certified Material Test Report shall state the method of hardenability determination. 1.3 The calculation method described in these test methods is applicable only to the range of chemical compositions that follow: Element Range, % Carbon 0.10–0.70 Manganese 0.50–1.65 Silicon 0.15–0.60 Chromium 1.35 max Nickel 1.50 max Molybdenum 0.55 max 1.4 Hardenability is a measure of the depth to which steel will harden when quenched from its austenitizing temperature (Table 1). It is measured quantitatively, usually by noting the extent or depth of hardening of a standard size and shape of test specimen in a standardized quench. In the end-quench test the depth of hardening is the distance along the specimen from the quenched end which correlates to a given hardness level. 1.5 The values stated in inch-pound units are to be regarded as the standard. The values given in parentheses are for information only. 1.6 This standard does not purport to address all of the safety concerns, if any, associated with its use. It is the responsibility of the user of this standard to establish appro- priate safety and health practices and determine the applica- bility of regulatory limitations prior to use. 2. Referenced Documents 2.1 ASTM Standards: E 18 Test Methods for Rockwell Hardness and Rockwell Superficial Hardness of Metallic Materials 2 E 112 Test Methods for Determining the Average Grain Size 2 END-QUENCH OR JOMINY TEST 3. Description 3.1 This test method covers the procedure for determining the hardenability of steel by the end-quench or Jominy test. The test consists of water quenching one end of a cylindrical test specimen 1.0 in. in diameter and measuring the hardening response as a function of the distance from the quenched end. 4. Apparatus 4.1 Support for Test Specimen—A fixture for supporting the test specimen vertically so that the lower end of the specimen is a distance of 0.5 in. (12.7 mm) above the orifice of the water-quenching device. A satisfactory type of support for the standard 1.0-in. (25.4-mm) specimen is shown in Fig. 1. NOTE 1—A suitable support for other sizes and shapes of specimens is shown in Fig. X1.1. 4.2 Water-Quenching Device—A water-quenching device of suitable capacity to provide a vertical stream of water that can be controlled to a height of 2.5 in. (63.5 mm) when passing through an orifice 0.5 in. (12.7 mm) in diameter. A tank of sufficient capacity to maintain the water temperature require- ments of 6.3 with a small pump and control valves will be found satisfactory. The water-supply line shall also be provided with a quick opening valve. 5. Test Specimens 5.1 Wrought Specimens—End-quench specimens shall be prepared from rolled or forged stock and shall represent the full cross section of the product. If negotiated between the supplier and the user, the end-quench specimen may be prepared from a given location in a forged or rolled product or from a 1 These test methods are under the jurisdiction of ASTM Committee A01 on Steel, Stainless Steel, and Related Alloys and are the direct responsibility of Subcommittee A01.15 on Bars. Current edition approved March 10, 2002. Published May 2002. Originally published as A 255–42. Last previous edition A 255–99. 2 Annual Book of ASTM Standards, Vol 03.01. 1 *A Summary of Changes section appears at the end of this standard. Copyright © ASTM International, 100 Barr Harbor Drive, PO Box C700, West Conshohocken, PA 19428-2959, United States.
Transcript

Designation: A 255 – 02

Standard Test Methods forDetermining Hardenability of Steel 1

This standard is issued under the fixed designation A 255; the number immediately following the designation indicates the year oforiginal adoption or, in the case of revision, the year of last revision. A number in parentheses indicates the year of last reapproval. Asuperscript epsilon (e) indicates an editorial change since the last revision or reapproval.

This standard has been approved for use by agencies of the Department of Defense.

1. Scope*

1.1 These test methods cover the identification and descrip-tion of test methods for determining the hardenability of steels.The two test methods include the quantitative end-quench orJominy Test and a method for calculating the hardenability ofsteel from the chemical composition based on the original workby M. A. Grossman.

1.2 The selection of the test method to be used for deter-mining the hardenability of a given steel shall be agreed uponbetween the supplier and user. The Certified Material TestReport shall state the method of hardenability determination.

1.3 The calculation method described in these test methodsis applicable only to the range of chemical compositions thatfollow:

Element Range, %

Carbon 0.10–0.70Manganese 0.50–1.65Silicon 0.15–0.60Chromium 1.35 maxNickel 1.50 maxMolybdenum 0.55 max

1.4 Hardenability is a measure of the depth to which steelwill harden when quenched from its austenitizing temperature(Table 1). It is measured quantitatively, usually by noting theextent or depth of hardening of a standard size and shape of testspecimen in a standardized quench. In the end-quench test thedepth of hardening is the distance along the specimen from thequenched end which correlates to a given hardness level.

1.5 The values stated in inch-pound units are to be regardedas the standard. The values given in parentheses are forinformation only.

1.6 This standard does not purport to address all of thesafety concerns, if any, associated with its use. It is theresponsibility of the user of this standard to establish appro-priate safety and health practices and determine the applica-bility of regulatory limitations prior to use.

2. Referenced Documents

2.1 ASTM Standards:E 18 Test Methods for Rockwell Hardness and Rockwell

Superficial Hardness of Metallic Materials2

E 112 Test Methods for Determining the Average GrainSize2

END-QUENCH OR JOMINY TEST

3. Description

3.1 This test method covers the procedure for determiningthe hardenability of steel by the end-quench or Jominy test. Thetest consists of water quenching one end of a cylindrical testspecimen 1.0 in. in diameter and measuring the hardeningresponse as a function of the distance from the quenched end.

4. Apparatus

4.1 Support for Test Specimen—A fixture for supporting thetest specimen vertically so that the lower end of the specimenis a distance of 0.5 in. (12.7 mm) above the orifice of thewater-quenching device. A satisfactory type of support for thestandard 1.0-in. (25.4-mm) specimen is shown in Fig. 1.

NOTE 1—A suitable support for other sizes and shapes of specimens isshown in Fig. X1.1.

4.2 Water-Quenching Device—A water-quenching deviceof suitable capacity to provide a vertical stream of water thatcan be controlled to a height of 2.5 in. (63.5 mm) when passingthrough an orifice 0.5 in. (12.7 mm) in diameter. A tank ofsufficient capacity to maintain the water temperature require-ments of 6.3 with a small pump and control valves will befound satisfactory. The water-supply line shall also be providedwith a quick opening valve.

5. Test Specimens

5.1 Wrought Specimens—End-quench specimens shall beprepared from rolled or forged stock and shall represent the fullcross section of the product. If negotiated between the supplierand the user, the end-quench specimen may be prepared froma given location in a forged or rolled product or from a

1 These test methods are under the jurisdiction of ASTM Committee A01 onSteel, Stainless Steel, and Related Alloys and are the direct responsibility ofSubcommittee A01.15 on Bars.

Current edition approved March 10, 2002. Published May 2002. Originallypublished as A 255–42. Last previous edition A 255–99. 2 Annual Book of ASTM Standards, Vol 03.01.

1

*A Summary of Changes section appears at the end of this standard.

Copyright © ASTM International, 100 Barr Harbor Drive, PO Box C700, West Conshohocken, PA 19428-2959, United States.

continuous cast billet. The test specimen shall be 1.0 in. (25.4mm) in diameter by 4.0 in. (101.6 mm) in length, with meansfor hanging it in a vertical position for end quenching.Dimensions of the preferred specimen and of an optionalspecimen (Note 2) are given in Fig. 2 and Fig. 3. The specimenshall be machined from a bar previously normalized inaccordance with 6.1 and of such size as to permit the removalof all decarburization in machining to 1.0 in. round. The end ofthe specimen to be water cooled shall have a reasonablysmooth finish, preferably produced by grinding. Normalizingmay be waived by agreement between the supplier and theuser. The previous thermal history of the specimen tested shallalways be recorded.

5.2 Cast Specimens—A separately cast end-quench speci-men may be used for non-boron steels. Cast specimens are notsuitable for boron steel grades due to erratic results. A graphiteor metal mold may be used to form an overlength specimen 1.0in. (25.4 mm) in diameter which shall be cut to the standardspecimen size. The mold may also be used to form a 1.25-in.(31.8-mm) diameter specimen which shall be machined to thefinal specimen size. Cast tests need not be normalized.

NOTE 2—Other sizes and shapes of test specimens are described inAppendix X1.

6. Procedure

6.1 Normalizing—The wrought product from which thespecimen is to be prepared shall be normalized to ensure properhardening characteristics. The sample shall be held at thetemperature listed in Table 1 for 1 h and cooled in air.Tempering of the normalized sample to improve machinabilityis permitted.

6.2 Heating—Place the specimen in a furnace that is at thespecified austenitizing temperature (Table 1) and hold at thistemperature for 30 min. In production testing slightly longertimes up to 35 min may be used without appreciably affectingresults. It is important to heat the specimen in such anatmosphere that practically no scaling and a minimum ofdecarburization takes place. This may be accomplished byheating the specimen in a vertical position in a container withan easily removable cover containing a layer of cast-iron chipswith the bottom face of the specimen resting on the chips.

6.2.1 Other methods consist of placing the specimen in anappropriately sized hole in a graphite block or placing thespecimen in an upright tube attached to a flat base, both of aheat-resistant metal, with the collar projecting for a tong hold.Place a disk of graphite or carbon, or a layer of carbonaceousmaterial such as charcoal, in the bottom of the tube to preventscaling.

6.2.2 For a particular fixture and furnace, determine the timerequired to heat the specimen to the austenitizing temperatureby inserting a thermocouple into a hole drilled axially in the topof the specimen. Repeat this procedure periodically, for ex-ample once a month, for each combination of fixture andfurnace.

6.3 Quenching—Adjust the water-quenching device so thatthe stream of water rises to a free height of 2.5 in. (63.5 mm)above the 0.5-in. (12.7-mm) orifice, without the specimen inposition. The support for the specimen shall be dry at thebeginning of each test. Then place the heated specimen in thesupport so that its bottom face is 0.5 in. above the orifice, andturn on the water by means of the quick-opening valve. Thetime between removal of the specimen from the furnace andthe beginning of the quench should not be more than 5 s. Directthe stream of water, at a temperature of 40 to 85°F (5 to 30°C),against the bottom face of the specimen for not less than 10min. Maintain a condition of still air around the specimenduring cooling. If the specimen is not cold when removed fromthe fixture, immediately quench it in water.

6.4 Hardness Measurement—Two flats 180° apart shall beground to a minimum depth of 0.015 in. (0.38 mm) along theentire length of the bar and Rockwell C hardness measure-ments made along the length of the bar. Shallower grounddepths can affect reproducibility of results, and correlation withcooling rates in quenched bars.

6.4.1 The preparation of the two flats must be carried outwith considerable care. They should be mutually parallel andthe grinding done in such a manner that no change of thequenched structure takes place. Very light cuts with watercooling and a coarse, soft-grinding wheel are recommended toavoid heating the specimen. In order to detect tempering due togrinding, the flat may be etched with one of the followingetchant solutions:

NOTE 3—5 % nitric acid (concentrated) and 95 % water by volume.

NOTE 4—50 % hydrochloric acid (concentrated) and 50 % water byvolume.

Wash the sample in hot water. Etch in solution No. 1 untilblack. Wash in hot water. Immerse in solution No. 2 for 3 s andwash in hot water. Dry in air blast.

6.4.1.1 The presence of lighter or darker areas indicates thathardness and structure have been altered in grinding. If suchchanges caused by grinding are indicated, new flats may beprepared.

6.4.2 When hardness tests are made, the test specimen restson one of its flats on an anvil firmly attached to the hardnessmachine. It is important that no vertical movement be allowedwhen the major load is applied. The anvil must be constructedto move the test specimen past the penetrator in accurate stepsof 1⁄16 in. (1.5 mm). Resting the specimen in a V-block is notpermitted.

TABLE 1 Normalizing and Austenitizing Temperatures A

Steel Series Ordered CarbonContent, max, %

NormalizingTemperature, °F

(°C)

AustenitizingTemperature, °F

(°C)

1000, 1300, 1500,3100, 4000, 4100

0.25 and under 1700 (925) 1700 (925)

4300, 4400, 4500,4600, 4700, 5000,5100, 6100,B 8100,8600, 8700, 8800,9400, 9700, 9800

0.26 to 0.36, incl 1650 (900) 1600 (870)

0.37 and over 1600 (870) 1550 (845)2300, 2500, 3300,

4800, 93000.25 and under 1700 (925) 1550 (845)

0.26 to 0.36, incl 1650 (900) 1500 (815)0.37 and over 1600 (870) 1475 (800)

9200 0.50 and over 1650 (900) 1600 (870)A A variation of 610°F (6°C) from the temperatures in this table is permissible.B Normalizing and austenitizing temperatures are 50°F (30°C) higher for the

6100 series.

A 255 – 02

2

6.4.2.1 The Rockwell tester should periodically be checkedagainst standard test blocks. It is recommended that a test blockbe interposed between the specimen and the indenter to checkthe seating of the indenter and the specimen simultaneously.For general statements regarding the use of test blocks andsurface conditions, reference should be made to 4.7 and 5.2,respectively, of Test Methods E 18.

6.4.3 Exercise care in registering the point of the indenter inrelationship to the quenched end of the specimen as well asproviding for accurate spacing between indentations. A low-power measuring microscope is suitable for use in determiningthe distance from the quenched end to the center of the firstimpression and in checking the distance from center to centerof the succeeding impressions. It has been found that with

FIG. 1 Test Specimen in Support for Water Quenching

FIG. 2 Preferred Test Specimen

FIG. 3 Optional Test Specimen

A 255 – 02

3

reasonable operating care and a well-built fixture, it is practicalto locate the center of the first impression 0.06256 0.004 in.(1.5 6 0.10 mm) from the quenched end. The variationsbetween spacings should be even smaller. Obviously, it is moreimportant to position the indenter accurately when testinglow-hardenability steels than when testing high-hardenabilitysteels. The positioning of the indenter should be checked withsufficient frequency to provide assurance that accuracy require-ments are being met. In cases of lack of reproducibility or ofdifferences between laboratories, indenter spacing should bemeasured immediately.

6.4.4 Readings shall be taken in steps of1⁄16 in. (1.6 mm)for the first 16 sixteenths (25.4 mm), then 18, 20, 22, 24, 28,and 32 sixteenths of an inch. Values below 20 HRC are notrecorded because such values are not accurate. When a flat onwhich readings have been made is used as a base, the burrsaround the indentation shall be removed by grinding unless afixture is used which has been relieved to accommodate theirregularities due to the indentations.

6.4.4.1 Hardness readings should preferably be made ontwo flats 180° apart. Testing on two flats will assist in thedetection of errors in specimen preparation and hardness

measurement. If the two probes on opposite sides differ bymore than 4 HRC points at any one position, the test should berepeated on new flats, 90° from the first two flats. If the retestalso has greater than 4 HRC points spread, a new specimenshould be tested.

6.4.4.2 For reporting purposes, hardness readings should berecorded to the nearest integer, with 0.5 HRC values roundedto the next higher integer.

7. Plotting Test Results

7.1 Test results should be plotted on a standard hardenabil-ity chart prepared for this purpose, in which the ordinatesrepresent HRC values and the abscissae represent the distancefrom the quenched end of the specimen at which the hardnessdeterminations were made. When hardness readings are takenon two or more flats, the values at the same distance should beaveraged and that value used for plotting. A facsimile of the

FIG. 4 Facsimile of Standard ASTM Hardenability Chart, Showing Typical Hardenability Curves[Chart Size: 8 1⁄2 by 11 in. (216 by 279 mm)]

A 255 – 02

4

standard ASTM hardenability chart3 on which typical harden-ability curves have been plotted is shown in Fig. 4.

8. Index of Hardenability

8.1 The hardenability of a steel can be designated by aspecific HRC hardness value or HRC hardness value range ata given Jominy (“J”) distance. Examples of this method are J4⁄16 in. (6.4 mm) = 47 HRC min, J7⁄16 in. (11.1 mm) = 50HRC max, and J5⁄16 in. (7.9 mm) = 38–49 HRC.

9. Report

9.1 Report the following information that may be recordedon the ASTM hardenability chart:

9.1.1 Previous thermal history of the specimen tested, in-cluding the temperature of normalizing and austenitizing,

9.1.2 Chemical Composition,9.1.3 ASTM grain size (McQuaid-Ehn) as determined by

Test Methods E 112, unless otherwise indicated, and9.1.4 A prominent notation on the standard hardenability

chart if any of the test specimens listed in Appendix X1 areused.

CALCULATION OF HARDENABILITY

10. Introduction

10.1 This method of Jominy Hardenability calculation fromthe chemical ideal diameter (DI) on a steel is based on theoriginal work of M. A. Grossman and provides increasedaccuracy by refinement of the carbon multiplying factors andthe correlation of a boron factor (B.F.) with carbon and alloycontent. These refinements were based on analysis of thou-sands of heats of boron and non-boron 1500, 4100, 5000, and8600 series steels encompassing a range of compositions asfollows and a range of DI as contained in Tables 2-5. Theaccuracy of this test method and the techniques used to developit have been documented. For comparison of this test method toothers, or for steel compositions outside the mentioned grades,the user should refer to other articles concerned with calculat-ing hardenability.Element Range, %Carbon 0.10–0.70Manganese 0.50–1.65Silicon 0.15–0.60Chromium 1.35 maxNickel 1.50 maxMolybdenum 0.55 max

10.2 Tables 2-18 are to be used to calculate hardenabilityfrom the chemical ideal diameter for the grades shown in 10.1.Hardenability results are to be reported for the first 10 sixteenth(16 mm), the 12, 14, 16, 18, 20, 24, 28, and 32 sixteenths of aninch.

NOTE 5—The reporting of hardenability using the calculated methoddiffers from the procedure as shown in 6.4.4

10.3 DI Calculation for Non-Boron Steels—This calcula-tion relies on a series of hardenability factors (Table 6) for eachalloying element in the composition which, when multipliedtogether, gives a DI value. (For simplicity, only multiplyingfactors for DI in inch–pound units are given. For DI inmillimetres, use the metric value table.) The effects of phos-phorous and sulfur are not considered since they tend to cancelone another. A No. 7 austenitic grain size is assumed since moststeels with hardenability control arc melted to a fine-grainpractice where experience has demonstrated that a high per-centage of heats conform to this grain size. An example DIcalculation is given as follows for an SAE 4118 modified steel:Element % Multiplying FactorCarbon 0.22 0.119Manganese 0.80 3.667Silicon 0.18 1.126Nickel 0.10 1.036Chromium 0.43 1.929Molybdenum 0.25 1.750Copper 0.10 1.040

where:DI = 0.1193 3.6673 1.1263 1.0363 1.9293 1.753

1.043 = 1.79 in.10.4 DI Calculation for Boron Steels—With an effective

steel making process, the boron factor (signifying the contri-bution for boron to increased hardenability) is an inversefunction of the carbon and alloy content. The higher the carbonor alloy content, or both, the lower the boron factor.

10.4.1 The actual boron factor is expressed by the followingrelationship:

B.F. 5measured DI~from Jominy data and carbon content!calculated DI~from composition excluding boron! (1)

10.4.2 An example of actual boron factor determination isgiven as follows for an SAE 15B30 modified steel:

Composition, % C Mn Si Ni Cr Mo B

Calculated DI(boron ex-

cluded)0.29 1.25 0.20 0.13 0.07 0.03 0.0015 1.24 in.

End-Quench Test Results, in.“J” Position (1⁄8 in.) 1 2 3 4 5 6 7Hardness, HRC 50 50 49 48 47 45 41

“J” Position (1⁄8 in.) 8 9 10 12 14 16Hardness, HRC 38 33 28 25 22 20

10.4.3 Using Table 7, determine the nearest location on theend-quench curve where hardness corresponding to 50% mar-tensite occurs for the actual carbon content. For the exampleheat with 0.29 carbon, this hardness is 37 HRC occurring at a“J” distance of8⁄16 in. from the quenched end (interpolationrequired).

10.4.4 From Table 8 (in.), a “J” distance of8⁄16 in. equatesto a measured DI of 2.97 in. (interpolation required).

Boron factor52.97 in.1.24 in.5 2.4 boron factor (2)

10.4.5 Calculation of DI with Boron (DIB):10.4.5.1 Calculate the DI without boron. For the example in

10.4.4, this DI is 1.24 in.10.4.5.2 Calculate the alloy factor (the product of all the

multiplying factors from Table 6 excluding carbon). For theexample in 10.4.4:

3 Standard ASTM Hardenability Charts (81⁄2 by 11 in. pads of 50 charts) areavailable from ASTM International Headquarters, 100 Barr Harbor Drive, P.O. BoxC700, W. Conshohocken, PA 19428. Request Adjunct ADJA0255.

A 255 – 02

5

Alloy factor 5Calculated DI~without boron!

Carbon multiplying factor 51.24 in.0.157 in.5 8 (3)

10.4.5.3 Determine the boron multiplying factor from Table10. For this example with 0.29% carbon and an alloy factor of8, the boron multiplying factor is 2.36 (interpolation required).

10.4.6 Calculate the DI with boron as follows:

where:DIB = DI (without boron)3 boron factorDIB = 1.24 in.3 2.36DIB = 2.93 in.

10.5 Hardenability Curves from Composition—With a pre-determined DI (DIB for boron steel), the end-quench harden-ability curve can be computed by the following procedure:

10.5.1 The initial hardness (IH) at the J =1⁄16 in. position isa function of carbon content and independent of hardenabilityand is selected from Table 7. For the example non-boron SAE4118 modified heat containing 0.22 % carbon, the initialhardness is 45 HRC.

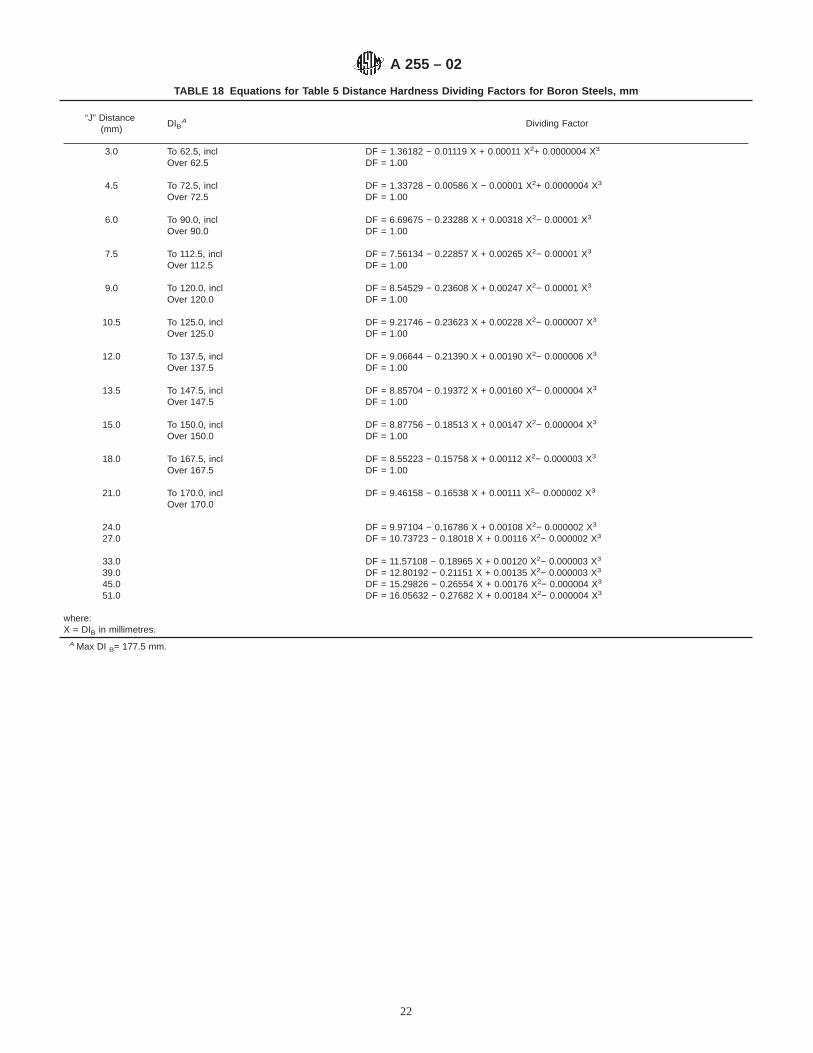
10.5.2 The hardness at other positions along the end-quenchspecimen (termed distance hardness) is determined by dividingthe initial hardness by the appropriate factor from Table 2 (in.)or Table 3 (mm) for non-boron steels or from Table 4 (in.) orTable 5 (mm) for boron steels.

10.6 For the example non-boron heat with an IH = 45 HRCand a calculated DI of 1.79 in., the hardness at the respectiveend-quench positions can be calculated by dividing 45 by theappropriate dividing factor listed in Table 2 (in.) for non-boronsteels. (For simplicity, the DI should be rounded to the nearest0.1 in.).

10.7 Equations for Tables 2-10—Equations representing aleast squares polynomial fit of the data contained in Tables2-10 are listed in Tables 7-6. The use of these equations to plotcurves may result in random inflection points due to thecharacteristics of polynomial equations. These inflections willbe minor, however, and should be disregarded.

11. Keywords11.1 end-quench hardenability; hardenability

A 255 – 02

6

TABLE 2 Distance Hardness Dividing Factors for Non-Boron Steels, in.

A 255 – 02

7

TABLE 3 Distance Hardness Dividing Factors for Non-Boron Steels, mm

A 255 – 02

8

TABLE 4 Distance Hardness Dividing Factors for Boron Steels, in.

A 255 – 02

9

TABLE 5 Distance Hardness Dividing Factors for Boron Steels, mm

A 255 – 02

10

TABLE 6 Multiplying Factors, in.

% Alloy

Carbon-Grain

Size7

Mn Si Ni Cr Mo Cu V

0.01 0.005 1.033 1.007 1.004 1.022 1.03 1.00 1.020.02 0.011 1.067 1.014 1.007 1.043 1.06 1.01 1.030.03 0.016 1.100 1.021 1.011 1.065 1.09 1.01 1.050.04 0.021 1.133 1.028 1.015 1.086 1.12 1.02 1.070.05 0.026 1.167 1.035 1.018 1.108 1.15 1.02 1.09

0.06 0.032 1.200 1.042 1.022 1.130 1.18 1.02 1.110.07 0.038 1.233 1.049 1.026 1.151 1.21 1.03 1.120.08 0.043 1.267 1.056 1.029 1.173 1.24 1.03 1.140.09 0.049 1.300 1.063 1.033 1.194 1.27 1.03 1.160.10 0.054 1.333 1.070 1.036 1.216 1.30 1.04 1.17

0.11 0.059 1.367 1.077 1.040 1.238 1.33 1.04 1.190.12 0.065 1.400 1.084 1.044 1.259 1.36 1.05 1.210.13 0.070 1.433 1.091 1.047 1.281 1.39 1.05 1.220.14 0.076 1.467 1.098 1.051 1.302 1.42 1.05 1.240.15 0.081 1.500 1.105 1.055 1.324 1.45 1.06 1.26

0.16 0.086 1.533 1.112 1.058 1.346 1.48 1.06 1.280.17 0.092 1.567 1.119 1.062 1.367 1.51 1.06 1.290.18 0.097 1.600 1.126 1.066 1.389 1.54 1.07 1.310.19 0.103 1.633 1.133 1.069 1.410 1.57 1.07 1.330.20 0.108 1.667 1.140 1.073 1.432 1.60 1.07 1.35

0.21 0.113 1.700 1.147 1.077 1.454 1.63 1.08 . . .0.22 0.119 1.733 1.154 1.080 1.475 1.66 1.08 . . .0.23 0.124 1.767 1.161 1.084 1.497 1.69 1.09 . . .0.24 0.130 1.800 1.168 1.088 1.518 1.72 1.09 . . .

0.25 0.135 1.833 1.175 1.091 1.540 1.75 1.09 . . .0.26 0.140 1.867 1.182 1.095 1.562 1.78 1.10 . . .0.27 0.146 1.900 1.189 1.098 1.583 1.81 1.10 . . .0.28 0.151 1.933 1.196 1.102 1.605 1.84 1.10 . . .

0.29 0.157 1.967 1.203 1.106 1.626 1.87 1.11 . . .0.30 0.162 2.000 1.210 1.109 1.648 1.90 1.11 . . .0.31 0.167 2.033 1.217 1.113 1.670 1.93 1.11 . . .0.32 0.173 2.067 1.224 1.117 1.691 1.96 1.12 . . .0.33 0.178 2.100 1.231 1.120 1.713 1.99 1.12 . . .

0.34 0.184 2.133 1.238 1.124 1.734 2.02 1.12 . . .0.35 0.189 2.167 1.245 1.128 1.756 2.05 1.13 . . .0.36 0.194 2.200 1.252 1.131 1.776 2.08 1.13 . . .0.37 0.200 2.233 1.259 1.135 1.799 2.11 1.14 . . .0.38 0.205 2.267 1.266 1.139 1.821 2.14 1.14 . . .

0.39 0.211 2.300 1.273 1.142 1.842 2.17 1.14 . . .0.40 0.213 2.333 1.280 1.146 1.864 2.20 1.15 . . .0.41 0.216 2.367 1.287 1.150 1.886 2.23 1.15 . . .0.42 0.218 2.400 1.294 1.153 1.907 2.26 1.15 . . .0.43 0.221 2.433 1.301 1.157 1.929 2.29 1.16 . . .

0.44 0.223 2.467 1.308 1.160 1.950 2.32 1.16 . . .0.45 0.226 2.500 1.315 1.164 1.972 2.35 1.16 . . .0.46 0.228 2.533 1.322 1.168 1.994 2.38 1.17 . . .0.47 0.230 2.567 1.329 1.171 2.015 2.41 1.17 . . .0.48 0.233 2.600 1.336 1.175 2.037 2.44 1.18 . . .

0.49 0.235 2.633 1.343 1.179 2.058 2.47 1.18 . . .0.50 0.238 2.667 1.350 1.182 2.080 2.50 1.18 . . .0.51 0.242 2.700 1.357 1.186 2.102 2.53 1.19 . . .0.52 0.244 2.733 1.364 1.190 2.123 2.56 1.19 . . .0.53 0.246 2.767 1.371 1.193 2.145 2.59 1.19 . . .0.54 0.249 2.800 1.378 1.197 2.166 2.62 1.20 . . .0.55 0.251 2.833 1.385 1.201 2.188 2.65 1.20 . . .0.56 0.253 2.867 1.392 1.204 2.210 . . . . . . . . .0.57 0.256 2.900 1.399 1.208 2.231 . . . . . . . . .0.58 0.258 2.933 1.406 1.212 2.253 . . . . . . . . .

0.59 0.260 2.967 1.413 1.215 2.274 . . . . . . . . .

A 255 – 02

11

TABLE 6 Continued

% Alloy

Carbon-Grain

Size7

Mn Si Ni Cr Mo Cu V

0.60 0.262 3.000 1.420 1.219 2.296 . . . . . . . . .0.61 0.264 3.033 1.427 1.222 2.318 . . . . . . . . .0.62 0.267 3.067 1.434 1.226 2.339 . . . . . . . . .0.63 0.269 3.100 1.441 1.230 2.361 . . . . . . . . .0.64 0.271 3.133 1.448 1.233 2.382 . . . . . . . . .0.65 0.273 3.167 1.455 1.237 2.404 . . . . . . . . .0.66 0.275 3.200 1.462 1.241 2.426 . . . . . . . . .0.67 0.277 3.233 1.469 1.244 2.447 . . . . . . . . .0.68 0.279 3.267 1.476 1.248 2.469 . . . . . . . . .

0.69 0.281 3.300 1.483 1.252 2.490 . . . . . . . . .0.70 0.283 3.333 1.490 1.256 2.512 . . . . . . . . .0.71 0.285 3.367 1.497 1.259 2.534 . . . . . . . . .0.72 0.287 3.400 1.504 1.262 2.555 . . . . . . . . .0.73 0.289 3.433 1.511 1.266 2.577 . . . . . . . . .

0.74 0.291 3.467 1.518 1.270 2.596 . . . . . . . . .0.75 0.293 3.500 1.525 1.273 2.620 . . . . . . . . .0.76 0.295 3.533 1.532 1.276 2.642 . . . . . . . . .0.77 0.297 3.567 1.539 1.280 2.663 . . . . . . . . .0.78 0.299 3.600 1.546 1.284 2.685 . . . . . . . . .

0.79 0.301 3.633 1.553 1.287 2.706 . . . . . . . . .0.80 0.303 3.667 1.560 1.291 2.728 . . . . . . . . .0.81 0.305 3.700 1.567 1.294 2.750 . . . . . . . . .0.82 0.307 3.733 1.574 1.298 2.771 . . . . . . . . .0.83 0.309 3.767 1.581 1.301 2.793 . . . . . . . . .

0.84 0.310 3.800 1.588 1.306 2.814 . . . . . . . . .0.85 0.312 3.833 1.595 1.309 2.836 . . . . . . . . .0.86 0.314 3.867 1.602 1.313 2.858 . . . . . . . . .0.87 0.316 3.900 1.609 1.317 2.879 . . . . . . . . .0.88 0.318 3.933 1.616 1.320 2.900 . . . . . . . . .

0.89 0.319 3.967 1.623 1.324 2.922 . . . . . . . . .0.90 0.321 4.000 1.630 1.327 2.944 . . . . . . . . .0.91 . . . 4.033 1.637 1.331 2.966 . . . . . . . . .0.92 . . . 4.067 1.644 1.334 2.987 . . . . . . . . .0.93 . . . 4.100 1.651 1.338 3.009 . . . . . . . . .

0.94 . . . 4.133 1.658 1.343 3.030 . . . . . . . . .0.95 . . . 4.167 1.665 1.345 3.052 . . . . . . . . .0.96 . . . 4.200 1.672 1.349 3.074 . . . . . . . . .0.97 . . . 4.233 1.679 1.352 3.095 . . . . . . . . .0.98 . . . 4.267 1.686 1.356 3.117 . . . . . . . . .

0.99 . . . 4.300 1.693 1.360 3.138 . . . . . . . . .1.00 . . . 4.333 1.700 1.364 3.160 . . . . . . . . .1.01 . . . 4.367 1.707 1.367 3.182 . . . . . . . . .1.02 . . . 4.400 1.714 1.370 3.203 . . . . . . . . .1.03 . . . 4.433 1.721 1.375 3.225 . . . . . . . . .1.04 . . . 4.467 1.728 1.378 3.246 . . . . . . . . .

1.05 . . . 4.500 1.735 1.382 3.268 . . . . . . . . .1.06 . . . 4.533 1.742 1.386 3.290 . . . . . . . . .1.07 . . . 4.567 1.749 1.389 3.311 . . . . . . . . .1.08 . . . 4.600 1.756 1.393 3.333 . . . . . . . . .1.09 . . . 4.633 1.763 1.396 3.354 . . . . . . . . .

1.10 . . . 4.667 1.770 1.400 3.376 . . . . . . . . .1.11 . . . 4.700 1.777 1.403 3.398 . . . . . . . . .1.12 . . . 4.733 1.784 1.406 3.419 . . . . . . . . .1.13 . . . 4.767 1.791 1.411 3.441 . . . . . . . . .1.14 . . . 4.800 1.798 1.414 3.462 . . . . . . . . .

1.15 . . . 4.833 1.805 1.418 3.484 . . . . . . . . .1.16 . . . 4.867 1.812 1.422 3.506 . . . . . . . . .1.17 . . . 4.900 1.819 1.426 3.527 . . . . . . . . .1.18 . . . 4.933 1.826 1.429 3.549 . . . . . . . . .1.19 . . . 4.967 1.833 1.433 3.570 . . . . . . . . .

A 255 – 02

12

TABLE 6 Continued

% Alloy

Carbon-Grain

Size7

Mn Si Ni Cr Mo Cu V

1.20 . . . 5.000 1.840 1.437 3.592 . . . . . . . . .1.21 . . . 5.051 1.847 1.440 3.614 . . . . . . . . .1.22 . . . 5.102 1.854 1.444 3.635 . . . . . . . . .1.23 . . . 5.153 1.861 1.447 3.657 . . . . . . . . .1.24 . . . 5.204 1.868 1.450 3.678 . . . . . . . . .1.25 . . . 5.255 1.875 1.454 3.700 . . . . . . . . .1.26 . . . 5.306 1.882 1.458 3.722 . . . . . . . . .1.27 . . . 5.357 1.889 1.461 3.743 . . . . . . . . .1.28 . . . 5.408 1.896 1.465 3.765 . . . . . . . . .1.29 . . . 5.459 1.903 1.470 3.786 . . . . . . . . .

1.30 . . . 5.510 1.910 1.473 3.808 . . . . . . . . .1.31 . . . 5.561 1.917 1.476 3.830 . . . . . . . . .1.32 . . . 5.612 1.924 1.481 3.851 . . . . . . . . .1.33 . . . 5.663 1.931 1.484 3.873 . . . . . . . . .1.34 . . . 5.714 1.938 1.487 3.894 . . . . . . . . .

1.35 . . . 5.765 1.945 1.491 3.916 . . . . . . . . .1.36 . . . 5.816 1.952 1.495 3.938 . . . . . . . . .1.37 . . . 5.867 1.959 1.498 3.959 . . . . . . . . .1.38 . . . 5.918 1.966 1.501 3.981 . . . . . . . . .1.39 . . . 5.969 1.973 1.506 4.002 . . . . . . . . .

1.40 . . . 6.020 1.980 1.509 4.024 . . . . . . . . .1.41 . . . 6.071 1.987 1.512 4.046 . . . . . . . . .1.42 . . . 6.122 1.994 1.517 4.067 . . . . . . . . .1.43 . . . 6.173 2.001 1.520 4.089 . . . . . . . . .1.44 . . . 6.224 2.008 1.523 4.110 . . . . . . . . .

1.45 . . . 6.275 2.015 1.527 4.132 . . . . . . . . .1.46 . . . 6.326 2.022 1.531 4.154 . . . . . . . . .1.47 . . . 6.377 2.029 1.535 4.175 . . . . . . . . .1.48 . . . 6.428 2.036 1.538 4.197 . . . . . . . . .1.49 . . . 6.479 2.043 1.541 4.217 . . . . . . . . .1.50 . . . 6.530 2.050 1.545 4.239 . . . . . .

1.51 . . . 6.581 2.057 1.556 4.262 . . . . . . . . .1.52 . . . 6.632 2.064 1.561 4.283 . . . . . . . . .1.53 . . . 6.683 2.071 1.565 4.305 . . . . . . . . .1.54 . . . 6.734 2.078 1.569 4.326 . . . . . . . . .1.55 . . . 6.785 2.085 1.574 4.348 . . . . . . . . .

1.56 . . . 6.836 2.092 1.578 4.369 . . . . . . . . .1.57 . . . 6.887 2.099 1.582 4.391 . . . . . . . . .1.58 . . . 6.938 2.106 1.586 4.413 . . . . . . . . .1.59 . . . 6.989 2.113 1.591 4.434 . . . . . . . . .1.60 . . . 7.040 2.120 1.595 4.456 . . . . . . . . .

1.61 . . . 7.091 2.127 1.600 4.478 . . . . . . . . .1.62 . . . 7.142 2.134 1.604 4.499 . . . . . . . . .1.63 . . . 7.193 2.141 1.609 4.521 . . . . . . . . .1.64 . . . 7.224 2.148 1.613 4.542 . . . . . . . . .1.65 . . . 7.295 2.155 1.618 4.564 . . . . . . . . .1.66 . . . 7.346 2.162 1.622 4.586 . . . . . . . . .1.67 . . . 7.397 2.169 1.627 4.607 . . . . . . . . .1.68 . . . 7.448 2.176 1.631 4.629 . . . . . . . . .1.69 . . . 7.499 2.183 1.636 4.650 . . . . . . . . .1.70 . . . 7.550 2.190 1.640 4.672 . . . . . . . . .

1.71 . . . 7.601 2.197 1.644 4.694 . . . . . . . . .1.72 . . . 7.652 2.204 1.648 4.715 . . . . . . . . .1.73 . . . 7.703 2.211 1.652 4.737 . . . . . . . . .1.74 . . . 7.754 2.218 1.656 4.759 . . . . . . . . .1.75 . . . 7.805 2.225 1.660 4.780 . . . . . . . . .

1.76 . . . 7.856 2.232 1.664 . . . . . . . . . . . .1.77 . . . 7.907 2.239 1.668 . . . . . . . . . . . .1.78 . . . 7.958 2.246 1.672 . . . . . . . . . . . .1.79 . . . 8.009 2.253 1.676 . . . . . . . . . . . .

A 255 – 02

13

TABLE 6 Continued

% Alloy

Carbon-Grain

Size7

Mn Si Ni Cr Mo Cu V

1.80 . . . 8.060 2.260 1.680 . . . . . . . . . . . .

1.81 . . . 8.111 2.267 1.687 . . . . . . . . . . . .1.82 . . . 8.162 2.274 1.694 . . . . . . . . . . . .1.83 . . . 8.213 2.281 1.701 . . . . . . . . . . . .1.84 . . . 8.264 2.288 1.708 . . . . . . . . . . . .1.85 . . . 8.315 2.295 1.715 . . . . . . . . . . . .

1.86 . . . 8.366 2.302 1.722 . . . . . . . . . . . .1.87 . . . 8.417 2.309 1.729 . . . . . . . . . . . .1.88 . . . 8.468 2.316 1.736 . . . . . . . . . . . .1.89 . . . 8.519 2.323 1.743 . . . . . . . . . . . .1.90 . . . 8.570 2.330 1.750 . . . . . . . . . . . .

1.91 . . . 8.671 2.337 1.753 . . . . . . . . . . . .1.92 . . . 8.672 2.344 1.756 . . . . . . . . . . . .1.93 . . . 8.723 2.351 1.759 . . . . . . . . . . . .1.94 . . . 8.774 2.358 1.761 . . . . . . . . . . . .1.95 . . . 8.825 2.364 1.765 . . . . . . . . . . . .

1.96 . . . . . . 2.372 1.767 . . . . . . . . . . . .1.97 . . . . . . 2.379 1.770 . . . . . . . . . . . .1.98 . . . . . . 2.386 1.773 . . . . . . . . . . . .1.99 . . . . . . 2.393 1.776 . . . . . . . . . . . .2.00 . . . . . . 2.400 1.779 . . . . . . . . . . . .

TABLE 7 Carbon Content, Initial Hardness, 50 % Martensite Hardness

%CarbonContent

Hardness − HRC

%CarbonContent

Hardness – HRC

% CarbonContent

Hardness – HRC

Initial100 %

Martensite50 %

Martensite

Initial100 %

Martensite50 %

MartensiteInitial 100 %Martensite

50 %Martensite

0.10 38 26 0.30 50 37 0.50 61 470.11 39 27 0.31 51 38 0.51 61 470.12 40 27 0.32 51 38 0.52 62 480.13 40 28 0.33 52 39 0.53 62 480.14 41 28 0.34 53 40 0.54 63 48

0.15 41 29 0.35 53 40 0.55 63 490.16 42 30 0.36 54 41 0.56 63 490.17 42 30 0.37 55 41 0.57 64 500.18 43 31 0.38 55 42 0.58 64 500.19 44 31 0.39 56 42 0.59 64 51

0.20 44 32 0.40 56 43 0.60 64 510.21 45 32 0.41 57 43 0.61 64 510.22 45 33 0.42 57 43 0.62 65 510.23 46 34 0.43 58 44 0.63 65 520.24 46 34 0.44 58 44 0.64 65 52

0.25 47 35 0.45 59 45 0.65 65 520.26 48 35 0.46 59 45 0.66 65 520.27 49 36 0.47 59 45 0.67 65 530.28 49 36 0.48 59 46 0.68 65 530.29 50 37 0.49 60 46 0.69 65 53

A 255 – 02

14

TABLE 8 Jominy Distance for 50 % Martensite versus DI (in.)

“J” 1⁄16

in.DI, in.

“J” 1⁄16

in.DI, in.

“J” 1⁄16 in.DI, in.

0.5 0.27 11.5 3.74 22.5 5.461.0 0.50 12.0 3.83 23.0 5.511.5 0.73 12.5 3.94 23.5 5.572.0 0.95 13.0 4.04 24.0 5.632.5 1.16 13.5 4.13 24.5 5.693.0 1.37 14.0 4.22 25.0 5.743.5 1.57 14.5 4.32 25.5 5.804.0 1.75 15.0 4.40 26.0 5.864.5 1.93 15.5 4.48 26.5 5.915.0 2.12 16.0 4.57 27.0 5.965.5 2.29 16.5 4.64 27.5 6.026.0 2.45 17.0 4.72 28.0 6.066.5 2.58 17.5 4.80 28.5 6.127.0 2.72 18.0 4.87 29.0 6.167.5 2.86 18.5 4.94 29.5 6.208.0 2.97 19.0 5.02 30.0 6.258.5 3.07 19.5 5.08 30.5 6.299.0 3.20 20.0 5.15 31.0 6.339.5 3.32 20.5 5.22 31.5 6.3710.0 3.43 21.0 5.28 32.0 6.4210.5 3.54 21.5 5.3311.0 3.64 22.0 5.39

TABLE 9 Jominy Distance for 50 % Martensite versus DI (mm)

“J” mm DI, mm “J” mm DI, mm“J”mm DI, mm

1.0 8.4 18.0 94.2 35.0 137.12.0 15.7 19.0 97.1 36.0 139.13.0 22.9 20.0 100.6 37.0 140.94.0 29.7 21.0 103.7 38.0 142.85.0 36.3 22.0 106.5 39.0 144.76.0 42.9 23.0 109.7 40.0 146.47.0 48.2 24.0 112.2 41.0 148.38.0 54.2 25.0 114.9 42.0 150.19.0 59.5 26.0 117.4 43.0 151.7

10.0 64.2 27.0 119.9 44.0 153.411.0 68.6 28.0 122.4 45.0 154.112.0 72.1 29.0 124.7 46.0 156.513.0 76.4 30.0 127.1 47.0 157.814.0 80.1 31.0 129.0 48.0 159.215.0 84.0 32.0 131.4 49.0 160.516.0 87.6 33.0 133.5 50.0 161.817.0 90.1 34.0 135.2

A 255 – 02

15

TABLE 10 Boron Factors versus % Carbon and Alloy Factor A

%Carbon 5 7 9 11 13 15 18 22 26

0.10 6.18 5.38 5.09 4.61 4.28 4.14 3.72 3.68 3.550.11 5.76 5.07 4.77 4.35 4.05 3.88 3.54 3.48 3.350.12 5.38 4.78 4.48 4.10 3.84 3.65 3.37 3.30 3.180.13 5.04 4.52 4.22 3.88 3.64 3.44 3.21 3.14 3.030.14 4.72 4.28 3.98 3.68 3.47 3.26 3.07 2.99 2.88

0.15 4.44 4.06 3.77 3.50 3.31 3.09 2.94 2.86 2.760.16 4.19 3.86 3.57 3.34 3.16 2.94 2.82 2.74 2.640.17 3.96 3.68 3.40 3.19 3.03 2.81 2.71 2.63 2.540.18 3.75 3.51 3.24 3.05 2.91 2.70 2.61 2.53 2.440.19 3.57 3.36 3.10 2.93 2.80 2.59 2.52 2.44 2.36

0.20 3.40 3.22 2.98 2.82 2.70 2.50 2.43 2.35 2.280.21 3.25 3.09 2.86 2.72 2.60 2.42 2.35 2.28 2.200.22 3.12 2.98 2.76 2.63 2.52 2.34 2.28 2.20 2.130.23 3.00 2.88 2.61 2.55 2.44 2.27 2.21 2.14 2.070.24 2.90 2.78 2.59 2.47 2.37 2.21 2.15 2.07 2.01

0.25 2.81 2.70 2.52 2.40 2.30 2.15 2.09 2.01 1.950.26 2.73 2.62 2.45 2.34 2.24 2.10 2.03 1.96 1.890.27 2.66 2.55 2.39 2.28 2.18 2.05 1.98 1.91 1.840.28 2.60 2.49 2.34 2.23 2.13 2.00 1.93 1.86 1.790.29 2.54 2.43 2.29 2.18 2.08 1.96 1.88 1.81 1.74

0.30 2.49 2.38 2.24 2.14 2.04 1.92 1.83 1.76 1.700.31 2.44 2.33 2.20 2.10 1.99 1.88 1.79 1.72 1.650.32 2.40 2.28 2.16 2.06 1.95 1.84 1.74 1.68 1.610.33 2.36 2.24 2.12 2.02 1.91 1.80 1.70 1.64 1.570.34 2.32 2.20 2.09 1.98 1.87 1.76 1.66 1.60 1.53

0.35 2.29 2.17 2.05 1.95 1.84 1.72 1.63 1.56 1.490.36 2.26 2.13 2.02 1.92 1.80 1.69 1.59 1.52 1.450.37 2.23 2.10 1.99 1.89 1.77 1.65 1.55 1.49 1.420.38 2.20 2.07 1.96 1.85 1.74 1.62 1.52 1.46 1.380.39 2.18 2.04 1.93 1.82 1.70 1.58 1.49 1.42 1.350.40 2.15 2.01 1.90 1.79 1.67 1.55 1.46 1.39 1.320.41 2.12 1.98 1.87 1.76 1.64 1.52 1.43 1.36 1.290.42 2.09 1.96 1.84 1.73 1.62 1.49 1.40 1.34 1.260.43 2.06 1.93 1.82 1.70 1.58 1.46 1.37 1.31 1.230.44 2.04 1.90 1.78 1.68 1.56 1.43 1.35 1.28 1.21

0.45 2.01 1.87 1.75 1.65 1.53 1.40 1.32 1.25 1.190.46 1.98 1.85 1.72 1.62 1.51 1.38 1.30 1.23 1.170.47 1.94 1.82 1.69 1.59 1.48 1.36 1.28 1.21 1.150.48 1.91 1.80 1.67 1.57 1.46 1.34 1.26 1.19 1.130.49 1.89 1.77 1.64 1.54 1.43 1.32 1.24 1.17 1.100.50 1.87 1.75 1.61 1.51 1.41 1.30 1.22 1.15 1.080.51 1.83 1.72 1.58 1.48 1.39 1.27 1.20 1.12 1.060.52 1.80 1.70 1.56 1.46 1.37 1.26 1.18 1.10 1.040.53 1.77 1.67 1.53 1.44 1.34 1.24 1.16 1.07 1.02

0.54 1.74 1.65 1.51 1.42 1.32 1.23 1.14 1.05 1.00

0.55 1.71 1.62 1.48 1.39 1.30 1.21 1.12 1.02 1.00

0.56 1.68 1.60 1.46 1.37 1.28 1.20 1.10 1.00 1.000.57 1.65 1.57 1.44 1.35 1.26 1.18 1.07 1.00 1.000.58 1.62 1.55 1.42 1.33 1.24 1.17 1.05 1.00 1.000.59 1.60 1.52 1.40 1.31 1.22 1.14 1.02 1.00 1.00

0.60 1.57 1.50 1.38 1.29 1.20 1.12 1.00 1.00 1.000.61 1.54 1.48 1.36 1.27 1.18 1.09 1.00 1.00 1.000.62 1.51 1.46 1.34 1.25 1.16 1.06 1.00 1.00 1.000.63 1.49 1.43 1.32 1.23 1.13 1.03 1.00 1.00 1.00

0.64 1.47 1.41 1.30 1.21 1.11 1.00 1.00 1.00 1.00

0.65 1.45 1.39 1.29 1.19 1.08 1.00 1.00 1.00 1.000.66 1.42 1.37 1.28 1.17 1.05 1.00 1.00 1.00 1.000.67 1.40 1.35 1.26 1.15 1.02 1.00 1.00 1.00 1.00

0.68 1.38 1.33 1.24 1.14 1.00 1.00 1.00 1.00 1.000.69 1.36 1.31 1.22 1.12 1.00 1.00 1.00 1.00 1.00

0.70 1.35 1.28 1.20 1.10 1.00 1.00 1.00 1.00 1.00

A 255 – 02

16

TABLE 10 Continued

%Carbon 5 7 9 11 13 15 18 22 26

0.71 1.33 1.26 1.18 1.07 1.00 1.00 1.00 1.00 1.000.72 1.32 1.25 1.16 1.05 1.00 1.00 1.00 1.00 1.000.73 1.30 1.22 1.14 1.02 1.00 1.00 1.00 1.00 1.00

0.74 1.29 1.20 1.12 1.00 1.00 1.00 1.00 1.00 1.00

0.75 1.27 1.17 1.08 1.00 1.00 1.00 1.00 1.00 1.000.76 1.26 1.15 1.05 1.00 1.00 1.00 1.00 1.00 1.000.77 1.24 1.12 1.02 1.00 1.00 1.00 1.00 1.00 1.00

0.78 1.22 1.10 1.00 1.00 1.00 1.00 1.00 1.00 1.000.79 1.20 1.07 1.00 1.00 1.00 1.00 1.00 1.00 1.00

0.80 1.18 1.05 1.00 1.00 1.00 1.00 1.00 1.00 1.000.81 1.15 1.02 1.00 1.00 1.00 1.00 1.00 1.00 1.00

0.82 1.12 1.00 1.00 1.00 1.00 1.00 1.00 1.00 1.000.83 1.08 1.00 1.00 1.00 1.00 1.00 1.00 1.00 1.000.84 1.04 1.00 1.00 1.00 1.00 1.00 1.00 1.00 1.00

0.85 1.02 1.00 1.00 1.00 1.00 1.00 1.00 1.00 1.00

0.86 1.00 1.00 1.00 1.00 1.00 1.00 1.00 1.00 1.00

A Alloy factor is the product of all the multiplying factors (Table 5) excluding that for carbon.

TABLE 11 Equations for Table 6 Multiplying Factors

Carbon/Grain Size 7

Up to 0.39 %, incl MF = 0.54 ( %C)Over 0.39 to 0.55 %, incl = 0.171 + 0.001 ( %C) + 0.265 ( %C)2

Over 0.55 to 0.65 %, incl = 0.115 + 0.268 ( %C) − 0.038 ( %C)2

Over 0.65 to 0.75 %, incl = 0.143 + 0.2 ( %C)Over 0.75 to 0.90 %, incl = 0.062 + 0.409 ( %C) − 0.135 ( %C)2

Manganese

Up to 1.20 %, inclOver 1.20 to 1.95 %, incl

= 3.3333 ( %Mn) + 1.00= 5.10 ( %Mn) − 1.12

Silicon to 2.00 %, incl = 1.00 + 0.7 ( %Si)Nickel to 2.00 %, incl = 1.00 + 0.363 ( %Ni)Chromium to 1.75 %, incl = 1.00 + 2.16 ( %Cr)Molybdenum to 0.55 %, incl = 1.00 + 3.00 ( %Mo)Copper to 0.55 %, incl = 1.00 + 0.365 ( %Cu)Vanadium to 0.20 %, incl = 1.00 + 1.73 ( %V)

A 255 – 02

17

TABLE 12 Equations For Table 7 Carbon Content, Initial Hardness, 50 % Martensite Hardness

Initial Hardness, H = 35.395 + 6.990x + 312.330x2− 821.744x3+1015.479x4− 538.346x5

50 % Martensite Hardness, H = 22.974 + 6.214x + 356.364x2− 1091.488x3+1464.880x4− 750.441x5

where:H = Hardness in HRCx = % Carbon

TABLE 13 Equations For Table 8 and Table 9 Jominy Distance for 50 % Martensite versus DI

DI (in.) = 0.14 + 0.443x − 0.01294x2+ 0.000166x3

DI (mm) = 0.35 + 8.262x − 0.231x2+ 0.00405x3− 0.000029x4

where:x = J Position in 1⁄16 in. or mm

TABLE 14 Equations for Table 10 Boron Factor versus % Carbon and Alloy Factor

Alloy Factor Boron Factor

5 to 0.85 % C, incl B.F. = 13.03059 − 99.60059 X + 374.8548 X2− 707.3472 X3+ 649.0012 X4− 231.1499 X5

Over 0.85 % C B.F. = 1.00

7 to 0.81 % C, incl B.F. = 10.29157 − 69.64546 X + 245.7061 X2− 445.3980 X3+ 398.8044 X4− 140.6225 X5

Over 0.81 % C B.F. = 1.00

9 to 0.77 % C, incl B.F. = 10.45573 − 79.18534 X + 311.9332 X2− 630.5490 X3+ 627.6022 X4− 244.4064 X5

Over 0.77 % C B.F. = 1.00

11 to 0.73 % C, incl B.F. = 9.005326 − 64.37669 X + 249.6933 X2− 506.0601 X3+ 509.4772 X4− 201.9323 X5

Over 0.73 % C B.F. = 1.00

13 to 0.67 % C, incl B.F. = 8.054231 − 55.10171 X + 213.6752 X2− 447.8863 X3+ 477.8413 X4− 204.4974 X5

Over 0.67 % C B.F. = 1.00

15 to 0.63 % C, incl B.F. = 9.001263 − 76.47680 X + 355.8714 X2− 872.9646 X3+ 1067.359 X4− 512.7757 X5

Over 0.63 % C B.F. = 1.00

18 to 0.59 % C, incl B.F. = 6.849017 − 46.78647 X + 196.6635 X2− 471.3978 X3+ 587.8504 X4− 295.0410 X5

Over 0.59 % C B.F. = 1.00

22 to 0.55 % C, incl B.F. = 7.217034 − 54.73529 X + 248.9901 X2− 632.7765 X3+ 826.1873 X4− 431.7227 X5

Over 0.55 % C B.F. = 1.00

26 to 0.53 % C, incl B.F. = 7.162633 − 57.52117 X + 279.6173 X2− 756.9353 X3+ 1042.628 X4− 568.5680 X5

Over 0.53 % C B.F. = 1.00

where:X = % carbon

A 255 – 02

18

TABLE 15 Equations for Table 2 Distance Hardness Dividing Factors for Non-Boron Steels, in.

“J” Distance(1⁄16 in.)

DIA Dividing Factor

2 To 2.1, incl DF = 4.68961 − 11.00832 X + 13.83314 X2− 8.80283 X3+ 2.78698 X4− 0.34880 X5

Over 2.1 DF = 1.00

3 To 3.1, incl DF = 2.34904 − 0.28254 X − 1.42995 X2+ 1.16697 X3− 0.33813 X4+ 0.03403 X5

Over 3.1 DF = 1.00

4 To 4.1, incl DF = 5.66795 − 6.14648 X + 3.52874 X2− 1.06026 X3+ 0.16301 X4− 0.01015 X5

Over 4.1 DF = 1.00

5 To 4.4, incl DF = 4.53651 − 2.92609 X + 1.00411 X2− 0.17129 X3+ 0.01369 X4− 0.00038 X5

Over 4.4 DF = 1.00

6 To 5.0, incl DF = 4.39436 − 2.16072 X + 0.56027 X2− 0.08145 X3+ 0.00840 X4− 0.00053 X5

Over 5.0 DF = 1.00

7 To 5.3, incl DF = 4.20866 − 1.54405 X + 0.08294 X2+ 0.08613 X3− 0.01963 X4+ 0.00127 X5

Over 5.3 DF = 1.00

8 To 5.6, incl DF = 4.44473 − 1.79085 X + 0.24617 X2+ 0.03378 X3− 0.01189 X4+ 0.00084 X5

Over 5.6 DF = 1.00

9 To 5.8, incl DF = 4.95421 − 2.43521 X + 0.62983 X2− 0.07914 X3+ 0.00399 X4− 0.00001 X5

Over 5.8 DF = 1.00

10 To 6.1, incl DF = 5.31610 − 2.80977 X + 0.84183 X2− 0.141781 X3+ 0.01301 X4− 0.00051 X5

Over 6.1 DF = 1.00

12 To 6.6, incl DF = 5.63649 − 2.89264 X + 0.90309 X2− 0.17297 X3+ 0.01881 X4− 0.00086 X5

Over 6.6 DF = 1.00

14 DF = 5.83176 − 2.99646 X + 0.94088 X2− 0.17734 X3+ 0.01839 X4− 0.00079 X5

16 DF = 6.06952 − 3.15198 X + 0.99297 X2− 0.18010 X3+ 0.01720 X4− 0.00066 X5

18 DF = 7.26492 − 4.50566 X + 1.61688 X2− 0.31738 X3+ 0.03146 X4− 0.00122 X5

20 DF = 7.68728 − 4.90380 X + 1.81034 X2− 0.36593 X3+ 0.03739 X4− 0.00150 X5

24 DF = 9.19586 − 6.71331 X + 2.77208 X2− 0.61510 X3+ 0.06814 X4− 0.00295 X5

28 DF = 9.27904 − 6.21461 X + 2.33158 X2− 0.46972 X3+ 0.04727 X4− 0.00186 X5

32 DF = 8.62857 − 5.16125 X + 1.81214 X2− 0.35489 X3+ 0.03569 X4− 0.00143 X5

where:X = DI in inches.

A Max DI = 7.0 in.

A 255 – 02

19

TABLE 16 Equations for Table 3 Distance Hardness Dividing Factors for Non-Boron Steels, mm

“J” Distance(mm)

DIA Dividing Factor

3.0 To 52.5, incl DF = 1.65890 − 0.03528 X + 0.00068 X2− 0.000005 X3

Over 52.5 DF = 1.00

4.5 To 77.5, incl DF = 2.76123 − 0.07974 X + 0.00125 X2− 0.000007 X3

Over 77.5 DF = 1.00

6.0 To 105.0, incl DF = 3.67224 − 0.09306 X + 0.00112 X2− 0.000004 X3

Over 105.0 DF = 1.00

7.5 To 112.5, incl DF = 3.99220 − 0.08654 X + 0.00089 X2− 0.000003 X3

Over 112.5 DF = 1.00

9.0 To 127.5, incl DF = 4.16084 − 0.07800 X + 0.00068 X2− 0.000002 X3

Over 127.5 DF = 1.00

10.5 To 130.5, incl DF = 4.30625 − 0.07467 X + 0.00059 X2− 0.000002 X3

Over 130.5 DF = 1.00

12.0 To 140.0, incl DF = 4.40247 − 0.07494 X + 0.00059 X2− 0.000002 X3

Over 140.0 DF = 1.00

13.5 To 147.5, incl DF = 4.52840 − 0.07460 X + 0.00057 X2− 0.000002 X3

Over 147.5 DF = 1.00

15.0 To 152.5, incl DF = 4.70933 − 0.07692 X + 0.00058 X2− 0.000002 X3

Over 152.5 DF = 1.00

18.0 To 167.5, incl DF = 4.94914 − 0.07514 X + 0.0052 X2− 0.000001 X3

Over 167.5 DF = 1.00

21.0 DF = 4.93379 − 0.06875 X + 0.00043 X2− 0.000001 X3

24.0 DF = 5.03364 − 0.06858 X + 0.00043 X2− 0.000001 X3

27.0 DF = 5.06910 − 0.06638 X + 0.00040 X2− 0.000001 X3

33.0 DF = 5.44818 − 0.07078 X + 0.00042 X2− 0.000001 X3

39.0 DF = 5.57362 − 0.06879 X + 0.00039 X2− 0.000001 X3

45.0 DF = 6.00347 − 0.07652 X + 0.00044 X2− 0.000001 X3

51.0 DF = 6.37885 − 0.08241 X + 0.00047 X2− 0.000001 X3

where:X = DI in millimetres.

A Max DI = 177.5 mm.

A 255 – 02

20

TABLE 17 Equations for Table 4 Distance Hardness Dividing Factors for Boron Steels, in.

“J” Distance(1⁄16 in.)

DIA Dividing Factor

2 To 2.5, incl DF = 22.97570 − 54.60177 X + 54.29984 X2− 26.85746 X3+ 6.59130 X4− 0.64165 X5

Over 2.5 DF = 1.00

3 To 2.9, incl DF = 13.25591 − 28.28828 X + 26.35541 X2− 12.23150 X3+ 2.81374 X4− 0.25263 X5

Over 2.9 DF = 1.00

4 To 3.5, incl DF = 28.50611 − 46.70430 X + 31.90431 X2− 10.91263 X3+ 1.86570 X4− 0.12747 X5

Over 3.5 DF = 1.00

5 To 4.4, incl DF = 24.56368 − 33.70604 X + 19.34623 X2− 5.52132 X3+ 0.78088 X4− 0.04375 X5

Over 4.4 DF = 1.00

6 To 4.9, incl DF = 5.32872 + 1.00334 X − 3.67571 X2+ 1.70752 X3− 0.31024 X4+ 0.02018 X5

Over 4.9 DF = 1.00

7 To 5.2, incl DF = 5.34598 + 0.98810 X − 3.15067 X2+ 1.33727 X3− 0.22285 X4+ 0.01332 X5

Over 5.2 DF = 1.00

8 To 5.6, incl DF = 2.61397 + 4.69073 X − 4.71553 X2+ 1.58031 X3− 0.22844 X4+ 0.01219 X5

Over 5.6 DF = 1.00

9 To 5.8, incl DF = 3.80939 + 2.96448 X − 3.58847 X2+ 1.22906 X3− 0.17730 X4+ 0.00938 X5

Over 5.8 DF = 1.00

10 To 6.1, incl DF = 11.75138 − 8.15904 X + 2.57305 X2− 0.42384 X3+ 0.03679 X4− 0.00136 X5

Over 6.1 DF = 1.00

12 To 6.6, incl DF = 10.94580 − 6.42904 X + 1.72900 X2− 0.24187 X3+ 0.01769 X4− 0.00055 X5

Over 6.6 DF = 1.00

14 To 6.9, incl DF = 14.86832 − 10.16374 X + 3.32700 X2− 0.59480 X3+ 0.05639 X4− 0.00221 X5

Over 6.9 DF = 1.00

16 DF = 14.10267 − 7.94906 X + 1.93841 X2− 0.22357 X3+ 0.01084 X4− 0.00010 X5

18 DF = 11.29531 − 4.46248 X + 0.41286 X2+ 0.09097 X3− 0.02034 X4+ 0.00110 X5

20 DF = 7.14752 + 0.35500 X − 1.61359 X2+ 0.49403 X3− 0.05879 X4+ 0.00251 X5

24 DF = 12.3738 − 4.50690 X + 0.29009 X2+ 0.12299 X3− 0.02325 X4+ 0.00117 X5

28 DF = 27.50991 − 20.45946 X + 6.97580 X2− 1.25184 X3+ 0.11543 X4− 0.00433 X5

32 DF = 43.35623 − 35.34260 X + 12.58238 X2− 2.29821 X3+ 0.21196 X4− 0.00785 X5

where:X = DIB in inches.

A Max DI B= 7.0 in.

A 255 – 02

21

TABLE 18 Equations for Table 5 Distance Hardness Dividing Factors for Boron Steels, mm

“J” Distance(mm)

DIBA Dividing Factor

3.0 To 62.5, incl DF = 1.36182 − 0.01119 X + 0.00011 X2+ 0.0000004 X3

Over 62.5 DF = 1.00

4.5 To 72.5, incl DF = 1.33728 − 0.00586 X − 0.00001 X2+ 0.0000004 X3

Over 72.5 DF = 1.00

6.0 To 90.0, incl DF = 6.69675 − 0.23288 X + 0.00318 X2− 0.00001 X3

Over 90.0 DF = 1.00

7.5 To 112.5, incl DF = 7.56134 − 0.22857 X + 0.00265 X2− 0.00001 X3

Over 112.5 DF = 1.00

9.0 To 120.0, incl DF = 8.54529 − 0.23608 X + 0.00247 X2− 0.00001 X3

Over 120.0 DF = 1.00

10.5 To 125.0, incl DF = 9.21746 − 0.23623 X + 0.00228 X2− 0.000007 X3

Over 125.0 DF = 1.00

12.0 To 137.5, incl DF = 9.06644 − 0.21390 X + 0.00190 X2− 0.000006 X3

Over 137.5 DF = 1.00

13.5 To 147.5, incl DF = 8.85704 − 0.19372 X + 0.00160 X2− 0.000004 X3

Over 147.5 DF = 1.00

15.0 To 150.0, incl DF = 8.87756 − 0.18513 X + 0.00147 X2− 0.000004 X3

Over 150.0 DF = 1.00

18.0 To 167.5, incl DF = 8.55223 − 0.15758 X + 0.00112 X2− 0.000003 X3

Over 167.5 DF = 1.00

21.0 To 170.0, incl DF = 9.46158 − 0.16538 X + 0.00111 X2− 0.000002 X3

Over 170.0

24.0 DF = 9.97104 − 0.16786 X + 0.00108 X2− 0.000002 X3

27.0 DF = 10.73723 − 0.18018 X + 0.00116 X2− 0.000002 X3

33.0 DF = 11.57108 − 0.18965 X + 0.00120 X2− 0.000003 X3

39.0 DF = 12.80192 − 0.21151 X + 0.00135 X2− 0.000003 X3

45.0 DF = 15.29826 − 0.26554 X + 0.00176 X2− 0.000004 X3

51.0 DF = 16.05632 − 0.27682 X + 0.00184 X2− 0.000004 X3

where:X = DIB in millimetres.

A Max DI B= 177.5 mm.

A 255 – 02

22

APPENDIX

(Nonmandatory Information)

X1. SPECIMENS FOR SPECIAL APPLICATIONS

X1.1 Scope

X1.1.1 The end-quench or Jominy hardenability test may beapplied with some modification when the test specimensavailable are smaller in size than those shown in Fig. 2 and Fig.3 or when shallow hardening steel is to be tested.

X1.2 Subsize Specimens

X1.2.1 Dimensions of Specimens and Quenching Fixtures—For determining the hardenability of steel received in bars lessthan 1.0 in. (25.4 mm) in diameter, the test specimen may be0.75, 0.50, or 0.25 in. (19.0, 12.7, or 6.4 mm) in diameter by3.0 or 4.0 in. (76.2 or 10.1.6 mm) in length. Fig. X1.1, in whicha 0.25-in. (6.4-mm) specimen is shown in position, shows asuitable support for the smaller size specimens. These smallerspecimens shall be tested in accordance with 5 of the methodexcept that modifications are required in the water streams forquenching. The orifice size and distance of the specimen fromthe orifice for testing these smaller specimens shall conform tothe following requirements specified in Table X1.1.

X1.2.2 Correlation with Standard End-QuenchSpecimens—Due to the greater air-cooling effect on testspecimens less than 1.0 in. (25.4 mm) in diameter, andespecially in specimens smaller than 0.75 in. (19.0 mm) indiameter, the cooling rates at various distances from thequenched end will not be the same as in the standard 1.0-in.round specimen. Hardenability curves obtained from tests onthese smaller specimens therefore are not comparable withcurves obtained from tests on the standard 1.0-in. roundspecimens. If the standard hardenability curve is needed, thenthe insert test specimen shown in Fig. X1.2 shall be used andtested as described in X1.4.

X1.3 Shallow-Hardening Steels

X1.3.1 The 1.0-in. (25.4-mm) diameter standard hardenabil-ity specimen may be used to determine the hardenability ofshallow-hardening steels, other than the carbon tool steels, bya modification in the hardness survey. The procedure inpreparing the specimen prior to hardness measurements isdescribed in Sections 4, 5, and 6. An anvil providing a meansof very accurately measuring the distance from the quenchedend is essential.

X1.3.2 Hardness values are obtained from1⁄16 to 8⁄16 in. (1.6to 12.7 mm) from the quenched end in intervals of1⁄32 in. (0.8mm). Beyond8⁄16 in., hardness values are obtained at10⁄16 ,12⁄16 , 14⁄16 , and16⁄16 in. (15.9, 19.1, 22.2 and 25.4 mm) from thequenched end. For readings to8⁄16 in. from the quenched end,two hardness traverses are made, both with readings1⁄16 in.apart; one starting at1⁄16 in. and being completed at8⁄16 in.from the quenched end, and the other starting at3⁄32 in. (2.4mm) and being completed at15⁄32 in. (11.9 mm) from thequenched end.

X1.3.3 Only two flats 180° apart need be ground if themechanical fixture has a grooved bed that will accommodatethe indentations of the flat surveyed first. The second hardnesstraverse is made after turning the bar over. If the fixture doesnot have such a grooved bed, two pairs of flats should beground, the flats of each pair being 180° apart. The twohardness surveys are made on adjacent flats.

X1.3.4 For plotting test results, the standard form forplotting hardenability curves (Fig. 4) should be used. Distancesfor the odd number1⁄32 in. (0.8 mm) should be measured withcare.

FIG. X1.1 Support for Smaller-Size Specimens, Showing 0.25-in.(6.4-mm) Specimen in Position

TABLE X1.1 Orifice Sizes for Testing Small-Size Specimens

Diameter of TestSpecimen, in.

(mm)

Orifice Size, in.(mm)

Distance fromOrifice to

Quenched End ofSpecimen, in.

(mm)

Free Height ofWater Column, in.

(mm)

0.75 (19.0) 0.50 (12.7) 0.50 (12.7) 2.5 (63.5)0.50 (12.7) 0.25 (6.4) 0.375 (9.5) 4.0 (102)0.25 (6.4) 0.125 (3.2) 0.25 (6.4) 8.0 (203)

FIG. X1.2 Drilled Bar Specimen for Steel Available Only in SmallSizes

A 255 – 02

23

X1.4 Subsize Specimen as Insert in Standard End-Quench Test

X1.4.1 A specimen available only in a small size may beprepared as an insert in an axially drilled standard size testwhich serves as a sheath (Fig. X1.2). About 0.2 g of Woodsmetal4 shall be placed in the bottom of the test sheath (Fig.

X1.2). The small test specimen inserted in the sheath, and thesheath warmed to a temperature above the melting point of theWoods metal. After the Woods metal is molten, screw the studin place so that the specimen is forced firmly against thebottom of the hole. Then heat the assembly and quench inaccordance with 6.2 and 6.3. The sheath shall preferably bemade from a plain low-carbon steel. After the quench, warmthe assembly in boiling water to melt the Woods metal andremove the specimen. Then make Rockwell hardness measure-ments on the C scale on the specimen as prescribed in 6.3.

REFERENCES

(1) Grossman, M. A.,Hardenability Calculated from Chemical Compo-sition, AIME Transactions, Vol 150, 1942, pp. 227–259.

(2) Banerji, S. K., and Morral, J. E.,Boron in Steel, AIME, Warrentown,Pa, 1980, pp. 106–126.

(3) Siebert, C. A., Doane, D. V., and Breen, D. H., The Hardenability ofSteels, ASM, Metals Park, OH, 1977, p. 64 ff.

(4) Just, E., New Formulas for Calculating Hardenability Curves,Metals Progress, November 1969, pp. 87–88.

(5) Doane, D. V., and Kirkaldy, J. S., eds.,Hardenability Concepts withApplications to Steel, The Metallurgical Society of AIME, Warrendale,PA, 1978.

(6) Hewitt, W., Hardenability—Its Prediction from Chemical Composi-tion, Heat Treatment of Metals, Vol 8, 1981, pp. 33–38.

(7) Tartaglia, J. M., and Eldis, G. T.,Core Hardenability Calculationsfor Carburizing Steels, Vol 15A, No. 6, Metallurgical Transactions,June 1984, pp. 1173–1183.

(8) Jatczak, C. F.,Determining Hardenability from Composition.MetalProgress, Vol 100, No. 3, September 1971, p. 60.

(9) Kramer, I. R., Siegel, S., and Brooks, J.,Factors for the Calculationof Hardenability.AIME Transactions, Vol 163, 1946, p. 670.

(10) Crafts, W., and Lamont, Y.,The Effects of Some Hardenability,AIME Transactions, Vol 158, 1944, p. 162.

SUMMARY OF CHANGES

Committee A01 has identified the location of selected changes to these test methods since the last issue,A 255 - 99, that may impact the use of these test methods.

(1) New section 10.2 added. (2) Previous section 10.2 renumbered as 10.3.

ASTM International takes no position respecting the validity of any patent rights asserted in connection with any item mentionedin this standard. Users of this standard are expressly advised that determination of the validity of any such patent rights, and the riskof infringement of such rights, are entirely their own responsibility.

This standard is subject to revision at any time by the responsible technical committee and must be reviewed every five years andif not revised, either reapproved or withdrawn. Your comments are invited either for revision of this standard or for additional standardsand should be addressed to ASTM International Headquarters. Your comments will receive careful consideration at a meeting of theresponsible technical committee, which you may attend. If you feel that your comments have not received a fair hearing you shouldmake your views known to the ASTM Committee on Standards, at the address shown below.

This standard is copyrighted by ASTM International, 100 Barr Harbor Drive, PO Box C700, West Conshohocken, PA 19428-2959,United States. Individual reprints (single or multiple copies) of this standard may be obtained by contacting ASTM at the aboveaddress or at 610-832-9585 (phone), 610-832-9555 (fax), or [email protected] (e-mail); or through the ASTM website(www.astm.org).

4 The composition of Woods metal is 50 % bismuth, 25 % lead, and 25 % tin, andthe melting point is 200°F (93°C).

A 255 – 02

24


Recommended