Page 1
INTERNATIONAL
FEDERATION OF
SURVEYORS
INTERNATIONAL
HYDROGRAPHIC
ORGANIZATION
INTERNATIONAL
CARTOGRAPHIC
ASSOCIATION
STANDARDS OF COMPETENCE
FOR CATEGORY "B"
NAUTICAL CARTOGRAPHERS
Publication S-8B
First Edition
Version 1.0.0 - Month 2017
Published by:
The International Hydrographic Organization ©
4b, quai Antoine 1er
B.P. 445
Monaco, MC 98011 Cedex
MONACO
[email protected]
www.iho.int
Comments arising from the experience gained in the application of the guidance are welcome. They
should be addressed to the Chair of the International Board for Standards of Competence of
Hydrographic Surveyors and Nautical Cartographers at the above address. This document is
published periodically. Please check with IHO for the latest edition, including current
amendments.
Page 2
2
© Copyright International Hydrographic Organization 2017
This work is copyright. Apart from any use permitted in accordance with the Berne Convention for the Protection of Literary and Artistic Works (1886), and except in the
circumstances described below, no part may be translated, reproduced by any process, adapted, communicated or commercially exploited without prior written
permission from the International Hydrographic Organization (IHO). Copyright in
some of the material in this publication may be owned by another party and permission for the translation and/or reproduction of that material must be obtained
from the owner.
This document or partial material from this document may be translated, reproduced or distributed for general information, on no more than a cost recovery basis. Copies
may not be sold or distributed for profit or gain without prior written agreement of the IHO and any other copyright holders.
In the event that this document or partial material from this document is reproduced,
translated or distributed under the terms described above, the following statements are to be included:
“Material from IHO publication [reference to extract: Title, Edition] is reproduced with the permission of the International Hydrographic Organization (IHO) (Permission No ……./…) acting for the International Hydrographic Organization (IHO), which does not accept responsibility for the correctness of the material as reproduced: in case of doubt, the IHO’s authentic text shall prevail. The incorporation of material sourced from IHO shall not be construed as constituting an endorsement by IHO of this product.”
“This [document/publication] is a translation of IHO [document/publication] [name]. The IHO has not checked this translation and therefore takes no responsibility for its accuracy. In case of doubt the source version of [name] in [language] should be consulted.”
The IHO Logo or other identifiers shall not be used in any derived product without
prior written permission from the IHO.
Page 3
3
1. INTRODUCTION
All components of the hydrographic surveying and nautical cartography professions face
challenges as to how best to ensure the continuation of high standards and how best to
ensure the continuation of best practices based on minimum standards of competence
world-wide. In order to achieve these objectives, three international organizations (FIG,
IHO and ICA) have developed Standards of competence that institutions, or professional
bodies, may adopt for their educational/training programmes and competency schemes.
Standards indicate the minimum competences necessary for hydrographic surveyors
and/or nautical cartographers. Standards recognize two levels of competence. Category
"A" programmes introduce competences from the underlying principles level. Category
"B" programmes introduce the competences from a practical level appropriately
underpinned by the relevant theoretical content.
The intention is that a Category "A" individual with appropriate experience would be a
senior professional in their chosen field (government, industry, and academia). Category
"B" individuals with appropriate experience would be technical professionals leading and
delivering products and services to meet specifications and outcomes.
The Standards are structured to enable the student to acquire incrementally the knowledge
required in order to be a competent cartographer at the Category "B" level. More
specifically, the sequence of the subjects is designed so that any new subject builds upon
the content and the knowledge of the preceding subjects.
The theoretical subjects are complemented with the Comprehensive Cartographic Project
(CCP) that includes all those items required to enable the student to compile and compose
efficiently a modern nautical chart, ENCs and special purpose charts according to
internationally adopted specifications.
Successful completion of the theoretical subjects and the CCP will enable the student to
attain the appropriate Category "B" level of competence in nautical cartography.
2. DEFINITIONS
2.1 Subjects, topics and elements
The S-8B standard contains the following list of Basic subjects and Essential subjects:
B1: Mathematics, Statistics, Theory of Errors ............................................................... 7
B2: Information and Communication Technology ........................................................ 8
B3: Earth Sciences ......................................................................................................... 9
E1: General Geodesy .................................................................................................... 10
E2: General Cartography .............................................................................................. 10
E3: Hydrography and Nautical Products ...................................................................... 13
E4: Data for Nautical and Special Purpose Charting ................................................... 14
Page 4
4
E5: Photogrammetry and Remote Sensing ................................................................... 15
E6: Geospatial Information and Processing ................................................................. 16
E7: Nautical Cartography ............................................................................................. 18
E8: Legal aspects (Relating to nautical cartography) ................................................... 22
E9: Special Purpose Charting ....................................................................................... 23
E10: Map/Chart Reproduction ..................................................................................... 24
CCP - COMPREHENSIVE CARTOGRAPHIC PROJECT ....................................... 26
Topics and Elements:
Each Basic subject or Essential subject comprises a list of topics which are
denoted by Bx.y or Ex.y;
Some of the topics contain elements which are denoted by Bx.y<c> or
Ex.y<c>.
For example, the subject E7 “Nautical Cartography” contains the topic E7.1 “The
Nautical Chart” that has the element E7.1a “Evolution of nautical charts”.
2.2 Learning outcomes and list of content
It is important to understand that each topic and/or element is associated with:
Οne or more intended learning outcomes that a student should be able to
achieve on completion of the programme. All learning outcomes should be
assessed. This may be done through one of, or a combination of, the following:
examination, assessed exercise or presentation, laboratory report, or final
project work.
Α content list. This list is associated with one or more learning outcomes and
describes the theoretical knowledge or practical/technical context which the
course syllabi should address in order to meet a particular learning outcome.
3. PROGRAMME PREPARATION AND SUBMISSION
The preparation of a programme submission to the IBSC should be in accordance with the
document entitled GUIDELINES FOR THE IMPLEMENTATION OF THE
STANDARDS OF COMPETENCE FOR HYDROGRAPHIC SURVEYORS AND
NAUTICAL CARTOGRAPHERS. This document is available from the IHO website:
www.iho.int → Standards & Publications.
The cross reference table is a mandatory requirement for a programme submission and
MUST be completed. A template is specified and is available from the IHO website:
www.iho.int
Page 5
5
LIST OF ACRONYMS AND INITIALISMS USED IN THIS DOCUMENT
1D One-dimensional
2D Two-dimensional
3D Three-dimensional
AIS Automatic Identification System
B Basic (level of knowledge)
B/W Black and White
CATZOC CAtegory of Zones Of Confidence
CIE International Commission on Illumination
CCP Comprehensive Cartographic Project
CPU Central Processing Unit
DBMS DataBase Management System
DEM Digital Elevation Model
DIGEST Digital Geographic Exchange Standard
DXF Digital Exchange Format
ECDIS Electronic Chart Display and Information System
ECS Electronic Chart System
ENC Electronic Navigation Chart
EROS Earth Resources Observation and Science
ETRS89 European Terrestrial Reference System 1989
FIG International Federation of Surveyors
GeoTIFF Geographic Tag Image File Format
GIS Geographical Information System
GML Geographical Markup Language
GNSS Global Navigation Satellite System
GPS Global Positioning System
GRS80 Geodetic Reference System (1980)
GUI Graphical User Interface
HLS Hue, lightness/luminance, saturation
I Intermediate (level of knowledge)
IALA International Association of Lighthouse Authorities
IBSC International Board on Standards of Competence for Hydrographic
Surveyors and Nautical Cartographers
ICA International Cartographic Association
IHO International Hydrographic Organization
IMCA International Marine Contractors Association
IMO International Maritime Organization
INT International
IOGP International Oil & Gas Producers
ISO International Standards Organization
ITRF International Terrestrial Reference Frame
JPEG Joint Photographic Experts Group
LAN Local Area Network
LiDAR Light Detection And Ranging
MatLab Mathematics Laboratory software
OGC Open Geospatial Consortium
P Practicals (fieldwork and/or laboratories)
QA Quality Assurance
Page 6
6
QC Quality Control
RADAR RAdio Detection And Ranging
RAM Random Access Memory
RENC Regional ENC Coordinating Centre
RGB Red, Green, Blue
RHC Regional Hydrographic Commissions
RIP Raster Image Processing
RMSE Root Mean Square Error
S-4 IHO Publication S-4 Regulations for International (INT) Charts and Chart
Specifications of the IHO
S-11 IHO Publication S-11 INTernational Chart Web Catalog
S-52 IHO Publication S-52 Specifications for Chart Content and Display Aspects
of ECDIS
S-57 IHO Publication S-57 IHO Transfer Standard for Digital Hydrographic
Data
S-58 IHO Publication S-58 ENC Validation Checks
S-65 IHO Publication S-65 ENCs: Production, Maintenance and Distribution
Guidance
S-99 IHO Publication S-99 Operational Procedures for the Organization and
Management of the S-100 Geospatial Information Registry
S-100 IHO Publication S-100 IHO Universal Hydrographic Data Model
S-101 IHO Publication S-101 ENC Product Specification
S-102 IHO Publication S-102 Bathymetric Surface Product Specification
SDI Spatial Data Infrastructure
SDTS Spatial Data Transfer Standard
SENC System Electronic Navigation Chart
SG Self-guided exercises (or student’s personal independent work)
SOLAS Safety of Life at Sea
SVG Scalable Vector Graphics
T Theoretical (theory through lectures)
TIN Triangulated Irregular Network
UKOOA UK Offshore Operators Association
UNCLOS United Nations Convention on the Law of the Sea
UTM Universal Transverse Mercator
WEND Worldwide Electronic Navigational Chart Database
WGS84 World Geodetic System (1984)
WWW World Wide Web
XML Extensible Markup Language
ZOC Zones of Confidence
Page 7
7
S-8B STANDARDS
CONTENT
AND
INTENDED LEARNING OUTCOMES
1. BASIC SUBJECTS
B1: Mathematics, Statistics, Theory of Errors
Topic/Element Content Learning outcomes
B1.1 Co-
ordinate
geometry
(I)
(i) Co-ordinate systems
(ii) Linear and quadratic functions
(iii) Functions in plane geometry
for lines and planes.
Describe and use co-ordinate systems.
Describe and use equations for lines and
planes.
Calculate distances between points, the
intersection between lines and planes and
the distance from a point to a plane.
B1.2 Systems
and units of
measurement
(I)
(i) Systems and units of
measurement.
Describe the International System,
Imperial and other systems of
measurement in common use.
Classify fundamental and derived units.
B1.3 Linear
Algebra
(B)
(i) Vector and affine spaces,
vector and inner products,
norms
(ii) Linear equations, determinants
(iii) Analytical geometry, line and
plane equations
(iv) Linear operators, matrix
representation, composition,
inverse, transpose
(v) Translations, rotations,
coordinate transformations.
Describe and apply 2D transformations
involved in mapping.
Solve linear equations using matrix
methods.
B1.4
Trigonometry
(B)
(i) Basic trigonometry
(ii) Sphere, great circle, rhumb
lines, sphere angles, spherical
triangles and spherical excess.
Apply plane and spherical trigonometry to
cartography problems.
B1.5 Errors and
Statistics
(B)
(i) Sources of error and their
classification
(ii) Random variables, mean,
variance, standard deviation
(iii) Covariance and correlation
(iv) Estimation of mean, variance,
co-variance
(v) Normal distribution.
Describe and classify possible sources of
error as a result of utilization of a chart
(i.e. measurement, digitization).
Define a random variable and estimate its
mean, variance, co-variance and standard
deviation.
B1.6 Least
squares
(B)
(i) Least squares procedure
(ii) Definition and use of Root
Mean Square Error (RMSE)
Perform a least square calculation and
interpret results.
Page 8
8
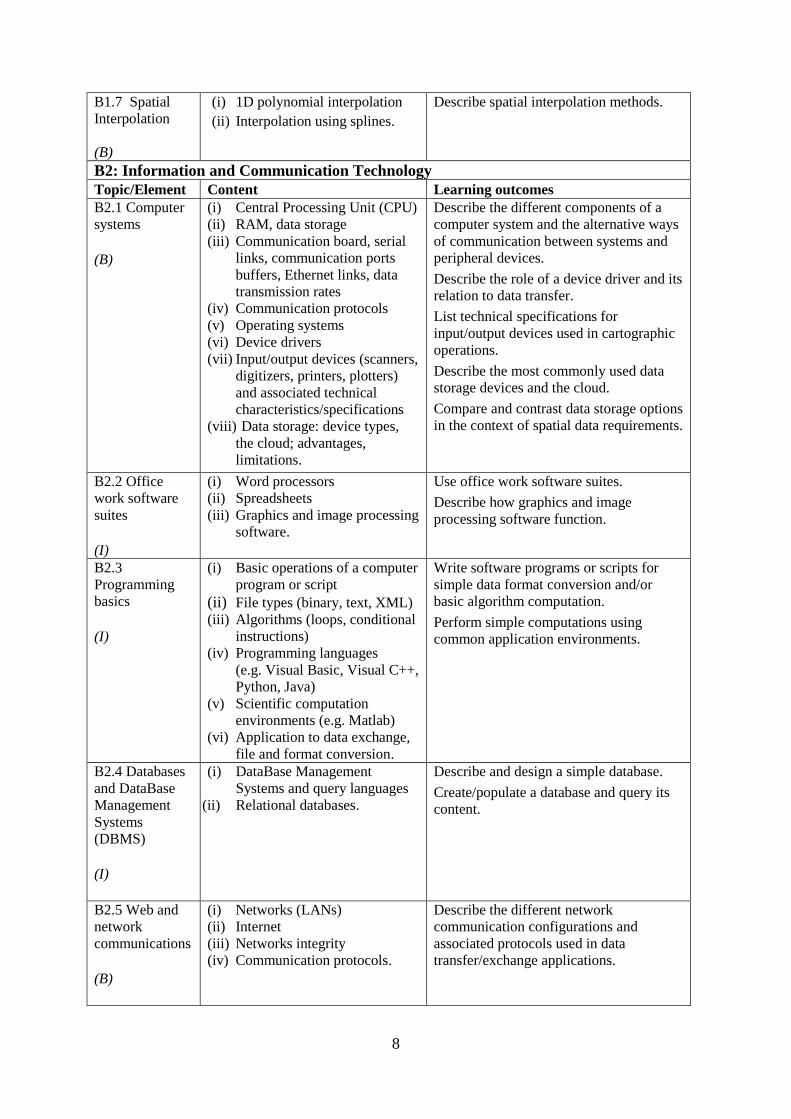
B1.7 Spatial
Interpolation
(B)
(i) 1D polynomial interpolation
(ii) Interpolation using splines.
Describe spatial interpolation methods.
B2: Information and Communication Technology
Topic/Element Content Learning outcomes
B2.1 Computer
systems (B)
(i) Central Processing Unit (CPU)
(ii) RAM, data storage
(iii) Communication board, serial
links, communication ports
buffers, Ethernet links, data
transmission rates
(iv) Communication protocols
(v) Operating systems
(vi) Device drivers
(vii) Input/output devices (scanners,
digitizers, printers, plotters)
and associated technical
characteristics/specifications
(viii) Data storage: device types,
the cloud; advantages,
limitations.
Describe the different components of a
computer system and the alternative ways
of communication between systems and
peripheral devices.
Describe the role of a device driver and its
relation to data transfer.
List technical specifications for
input/output devices used in cartographic
operations.
Describe the most commonly used data
storage devices and the cloud.
Compare and contrast data storage options
in the context of spatial data requirements.
B2.2 Office
work software
suites (I)
(i) Word processors
(ii) Spreadsheets
(iii) Graphics and image processing
software.
Use office work software suites.
Describe how graphics and image
processing software function.
B2.3
Programming
basics (I)
(i) Basic operations of a computer
program or script
(ii) File types (binary, text, XML) (iii) Algorithms (loops, conditional
instructions)
(iv) Programming languages
(e.g. Visual Basic, Visual C++,
Python, Java)
(v) Scientific computation
environments (e.g. Matlab)
(vi) Application to data exchange,
file and format conversion.
Write software programs or scripts for
simple data format conversion and/or
basic algorithm computation.
Perform simple computations using
common application environments.
B2.4 Databases
and DataBase
Management
Systems
(DBMS) (I)
(i) DataBase Management
Systems and query languages
(ii) Relational databases.
Describe and design a simple database.
Create/populate a database and query its
content.
B2.5 Web and
network
communications (B)
(i) Networks (LANs)
(ii) Internet
(iii) Networks integrity
(iv) Communication protocols.
Describe the different network
communication configurations and
associated protocols used in data
transfer/exchange applications.
Page 9
9
B3: Earth Sciences
Topic/Element Content Learning outcomes
B3.1 General
geography of
the Earth
(B)
(i) Earth as a system of
interacting 'zones'
(ii) Plate tectonics, earthquake
zones
(iii) Earth dynamics
(iv) Ecosystems.
Describe the major components of the
Earth as a system.
Identify general categories of land and
water masses.
Explain the plate tectonic theory.
B3.2 Marine
geomorphology
and marine
geographic
features
(B)
(i) Marine Geomorphology concepts
features
processes.
Describe and identify marine geographic
features, such as coastline, bays, inlets,
capes, oceans, seas, channels, etc.
Describe processes of deposition and
erosion.
B3.3 Marine
geophysics
(B)
(i) Gravity
(ii) Magnetics
(iii) Seismic profiles.
Describe the data acquired by gravity,
magnetic and seismic surveys. Describe
geophysical properties of undersea
features.
B3.4 Ocean
properties and
dynamics
(B)
(i) Sea water properties
(ii) Ocean Dynamics
nature
motion
tides
currents.
List the main properties of sea water.
Describe ocean dynamics in terms of
currents and tidal variations.
B3.5 Seafloor
characteristics (B)
(i) Sediment types
(ii) Submerged aquatic vegetation
(iii) Corals
(iv) Outcropping rocks.
Distinguish common seafloor
characteristics.
Page 10
10
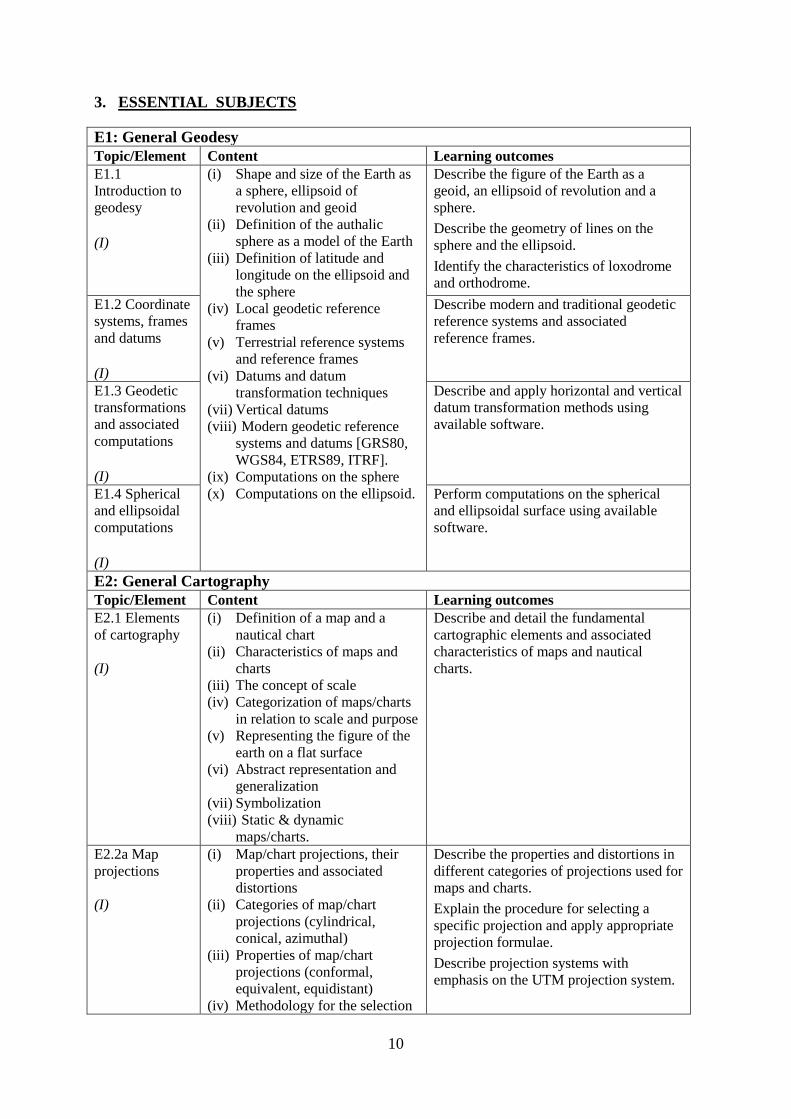
3. ESSENTIAL SUBJECTS
E1: General Geodesy
Topic/Element Content Learning outcomes
E1.1
Introduction to
geodesy (I)
(i) Shape and size of the Earth as
a sphere, ellipsoid of
revolution and geoid
(ii) Definition of the authalic
sphere as a model of the Earth
(iii) Definition of latitude and
longitude on the ellipsoid and
the sphere
(iv) Local geodetic reference
frames
(v) Terrestrial reference systems
and reference frames
(vi) Datums and datum
transformation techniques
(vii) Vertical datums
(viii) Modern geodetic reference
systems and datums [GRS80,
WGS84, ETRS89, ITRF].
(ix) Computations on the sphere
(x) Computations on the ellipsoid.
Describe the figure of the Earth as a
geoid, an ellipsoid of revolution and a
sphere.
Describe the geometry of lines on the
sphere and the ellipsoid.
Identify the characteristics of loxodrome
and orthodrome.
E1.2 Coordinate
systems, frames
and datums (I)
Describe modern and traditional geodetic
reference systems and associated
reference frames.
E1.3 Geodetic
transformations
and associated
computations (I)
Describe and apply horizontal and vertical
datum transformation methods using
available software.
E1.4 Spherical
and ellipsoidal
computations (I)
Perform computations on the spherical
and ellipsoidal surface using available
software.
E2: General Cartography
Topic/Element Content Learning outcomes
E2.1 Elements
of cartography
(I)
(i) Definition of a map and a
nautical chart
(ii) Characteristics of maps and
charts
(iii) The concept of scale
(iv) Categorization of maps/charts
in relation to scale and purpose
(v) Representing the figure of the
earth on a flat surface
(vi) Abstract representation and
generalization
(vii) Symbolization
(viii) Static & dynamic
maps/charts.
Describe and detail the fundamental
cartographic elements and associated
characteristics of maps and nautical
charts.
E2.2a Map
projections
(I)
(i) Map/chart projections, their
properties and associated
distortions
(ii) Categories of map/chart
projections (cylindrical,
conical, azimuthal)
(iii) Properties of map/chart
projections (conformal,
equivalent, equidistant)
(iv) Methodology for the selection
Describe the properties and distortions in
different categories of projections used for
maps and charts.
Explain the procedure for selecting a
specific projection and apply appropriate
projection formulae.
Describe projection systems with
emphasis on the UTM projection system.
Page 11
11
of a cartographic projection
(v) Projection formulae and
planimetric coordinates
(vi) Projection systems
(vii) The UTM projection system.
E2.2b Study of
map distortions
(B)
(i) Definition of Scale Factor
(ii) Tissot’s theorem
(iii) Principal directions
(iv) Tissot’s indicatrix
(v) Distortions in distances, areas
and angles associated with
specific map projections
(Mercator, Transverse
Mercator, Lambert conformal
conic).
Describe scale factor and its properties.
Identify the prevailing properties of a
projection using Tissot’s indicatrix.
Compute bearings and distances on
projections used in nautical cartography.
E2.3 Abstract
representation
and
generalization
(I)
(i) Rationale for generalization
(ii) Model, semantic and
cartographic generalization
(iii) Elements of generalization
(iv) Controls of generalization
(v) Rules for semantic
generalization
(vi) Cartographic generalization of
point, line and area features
(vii) Cartographic generalization
algorithms.
Explain the rationale for generalization.
Distinguish between model, semantic and
cartographic generalization.
Classify and detail the processes of
generalization.
Rationalize the selection of generalization
algorithms.
Perform generalization of point, line and
polygon features using:
a) manual methods,
b) appropriate generalization algorithms
and associated parameters’ values.
E2.4 Relief
representation
(I)
(i) Rationale for terrain and sea
bottom representation
(ii) Methods for terrain and sea
bottom representation
(contouring, zoning, etc.)
(iii) Relative and absolute accuracy
in contouring
(iv) Digital representation of the
relief – Digital Elevation
Models [DEM] and methods
of interpolation (Inverse
distance, TIN, GRID,
Kriging).
(v) Extraction of DEM by-
products (slope, aspect…..).
Explain the reasons underpinning terrain
and sea bottom representation.
Describe in detail and compare common
methods used for terrain and sea bottom
representation.
Describe common interpolation methods
used for DEM creation.
Create a DEM using appropriate methods
and extract its by-products.
E2.5
Cartographic
data, scales of
measurement
(B)
(i) Scales of cartographic data
measurement
Nominal scale
Ordinal scale
Interval scale.
Categorize cartographic data according to
their scale of measurement.
E2.6
Symbolization
(I)
(i) Rationale for symbolization
(ii) Concepts of symbolization
(iii) Graphical elements of symbols
(point, line, area)
(iv) Visual variables (shape, size,
Explain the rationale for symbolization.
Describe visual variables.
Use visual variables with respect to scale
of cartographic data measurement.
Page 12
12
orientation, color, pattern, etc.)
(v) Basic rules of symbol design
and use.
Distinguish types of symbols and their use
Explain the need for and use symbol
libraries.
E2.7 Color
(B)
(i) Rationale for the use of color
(ii) The nature of color (spectral
colors vs. reflected colors)
(iii) The dimensions of color
(iv) Systems of color modeling/
specification (CIE, Munsell)
(v) Electronic display color
models (RGB, HLS…)
(vi) Choosing colors for
maps/charts
(vii) Color conventions
(viii) Patterns (B/W – color)
(ix) Color for computer graphics
(screens, plotters, printers)
(x) Color for printing.
Explain the rationale, role and importance
of color and its use in mapping and
charting.
Outline the principal color conventions
for maps and charts and their features.
Differentiate color for various computer
graphics and printing applications.
E2.8 Map/chart
lettering and
toponymy
(I)
(i) Rationale of toponymy
(ii) Lettering and its functionality
(iii) Lettering style, size and color
(iv) Relationship between
toponyms and the use of
lettering
(v) Naming conventions
(vi) Positioning guidelines for
toponyms of point, line and
area features
(vii) Placement of toponyms with
respect to the scale/graticule.
Explain the rationale and the functionality
of toponymic display.
Describe and demonstrate appropriate use
of lettering in relation to the inherent
characteristics of cartographic features.
Describe and apply placement rules for
toponyms.
E2.9
Cartographic
design
(B)
(i) Principles of good
cartographic design
(ii) Design requirements for
different map/chart categories
(iii) Scale selection
(iv) Graphic organization
(map/chart layout)
(v) Visual balance
(vi) Types of data (point, linear,
areal, 3D)
(vii) Representation (of reality)
(viii) Composition
(ix) Visual hierarchy
(x) Presentation
(xi) Use of color/figure-
ground/contrast.
Describe the principles and characteristics
underpinning good cartographic design.
Identify selected maps/charts in terms of
the principles of good cartographic design
(with proper justification).
E2.10 Map/chart
compilation and
composition
(I)
(i) The cartographic compilation
and composition process
(ii) Compilation planning and
scheduling
(iii) Source data and map/chart
scale
(iv) Map/Chart data quality
elements
Describe the logical process of
cartographic compilation and composition
identifying discrete stages.
Differentiate between the appropriate
compilation processes for maps and
nautical charts of different themes and
scales.
Describe and apply cartographic data
Page 13
13
Accuracy (positional,
thematic, temporal)
Resolution (spatial,
temporal)
Consistency (logical,
domain)
Currency
Completeness
Clarity
(v) Data quality standards
(vi) Assessment of appropriateness
of source data for map or chart
compilation
(vii) Source data homogenization
(viii) Quality control process within
a quality management system
(ix) Analog compilation worksheet
(x) Digital compilation worksheet.
quality assessment processes.
Differentiate between analog and digital
compilation processes.
Develop a digital and an analog
compilation worksheet covering a defined
region and utilize it for map/chart
composition and symbolization.
E3: Hydrography and Nautical Products
Topic/Element Content Learning outcomes
E3.1
Hydrography,
nautical
cartography and
navigation
(B)
(i) Relationship between
hydrography, nautical
cartography and navigation.
Define hydrography, nautical cartography
and types of navigation explaining their
relationship.
Identify hydrographic and other data for
map/chart purposes.
E3.2
Navigational
hazards and aids
to navigation
(B)
(i) Navigational hazards
(ii) Types of buoys and beacons
(iii) The IALA system
(iv) Automatic Identification
Systems (AISs).
Identify and describe navigational
hazards.
Describe the principal fixed and floating
aids to navigation and their significance
for nautical charting.
Describe AIS.
E3.3
Navigational
publications
(I)
(i) Notices to mariners
(ii) Sailing directions
(iii) Light and radio lists
(iv) Tides and current tables.
Describe and use content derived from
nautical publications in a charting context.
E3.4
Hydrographic
surveys
(B)
(i) Types and scales of
hydrographic surveys
(ii) Hydrographic survey
operations.
Differentiate the type and purpose of
different hydrographic surveys.
Describe and explain hydrographic survey
operations essential to ensure nautical
charting integrity.
E3.5
Positioning
(B)
(i) Evolution of technology in
positioning
(ii) Satellite systems for
positioning
(iii) Relative accuracy of
commonly available systems.
Describe different methods and systems
used for positioning with respect to their
accuracy.
Describe the principles of Global
Navigation Satellite Systems (GNSS).
E3.6 Depth
measurement
(B)
(i) Evolution of technology and
methodologies for depth
measurement
(ii) Hydrographic vs. bathymetric
data measurement.
Describe different methods and associated
accuracies used in depth measurement.
Describe the suitability of different depth
measurement methods to achieve specific
Page 14
14
surveying and charting objectives.
E3.7
Hydrographic
data
management
(I)
(i) Management of hydrographic
data at various stages in the
chart compilation process
(ii) Databases for hydrographic
data.
Outline hydrographic data acquisition,
processing, analysis and management
procedures and methodologies.
Describe the content and use of a
hydrographic source database.
E4: Data for Nautical and Special Purpose Charting
Topic/Element Content Learning outcomes
E4.1
Coastline and
topographic data
(I)
(i) Data sources appropriate for
inclusion in nautical charting
for coastline and topography
(ii) Categories and corresponding
definitions of coastline
(iii) Relevance of scale for
selecting appropriate data
sources
(iv) Principles of selection and
depiction of topography
(v) Principles of selection and
depiction of bathymetry
(vi) Bathymetric data quality
(vii) The concept and use of
CATZOC.
Describe different categories of coastline
and their depiction.
Homogenize topographic data from
various data sources for depiction on
charts with regard to scale.
E4.2
Bathymetric
data
(I)
Evaluate bathymetric data sources for use
in nautical and special purpose charts.
Explain and use CATZOC.
Homogenize hydrographic/ bathymetric
data from various data sources for
depiction on charts with regard to scale.
E4.3
Navigational
hazards and aids
to navigation
(I)
(i) Cartographic representations
of hazards to navigation
(ii) Cartographic representations
of aids to navigation.
Evaluate selected data sources for hazards
and aids to navigation.
Describe and apply the appropriate
depiction of identified navigational
hazards and aids to navigation on nautical
charts.
E4.4 Sailing
directions and
nautical
publications
(I)
(i) Identification of textual and
administrative data suitable for
graphic presentation
(boundaries, environmental
areas, traffic routing etc.)
(ii) Symbiotic relationship
between textual and graphic
data.
(iii) E-publications.
Explain the relationship between nautical
charts and textual data sources and their
use (sailing directions and other nautical
publications including reports, lists and
tabular data).
Evaluate available administrative data for
consistency in its graphical depiction
and/or textual promulgation.
E4.5 Source
data adjustment
(B)
(i) Chart datums: horizontal and
vertical
(ii) Principles of horizontal and
vertical datums
(iii) Methodologies for adjusting
data against various datums
(iv) Adjusting data by use of
software.
Define horizontal and vertical datums.
Identify horizontal and vertical datums
commonly used in cartographic data
sources.
Perform horizontal and vertical
adjustments of data referred to various
datums using software applications.
E4.6
Oceanographic
information
(B)
(i) Identification of appropriate
oceanographic data sources
(ii) Depiction of oceanographic
information
(iii) Tidal and current information.
Evaluate the sources and characteristics of
oceanographic data.
Assess oceanographic data for its
depiction on nautical charts.
Display tidal and current information on
nautical charts.
Page 15
15
E4.7 Magnetic
data
(B)
(i) Magnetic variation and
anomalies, computation and
appropriateness for charting.
(ii) Magnetic data sources
utilization, computations and
depiction.
Explain “magnetic variation”.
Compute magnetic variation for specific
positions and time.
Depict magnetic anomalies.
E4.8
Metadata
(B)
(i) Metadata for analog and
digital data and chart products.
Explain the purpose and importance of
creating and using metadata.
Identify and utilize metadata.
E4.9 Quality
Management
System(s) for
chart production
(I)
(i) Nautical chart production
processes and their content
(ii) Quality Management
System(s), Quality Control
(QC) and Quality Assurance
(QA) processes for the
compilation and production of
nautical and special purpose
charts
(iii) Data quality implications
relevant to scales, density,
accuracy, time, different
datums, technologies, etc.
Describe nautical chart production
processes and their content.
Describe and apply QC processes to
nautical chart and special purpose chart
production.
Identify and describe the implications on
data quality arising from the variability of
source data types.
E4.10 Data for
special purpose
charting
(B)
(i) Requirement, use and design
of special purpose charts
(ii) Data types:
Subsurface
Imagery
Geotechnical
Environmental
Engineering and asset.
Describe special purpose charts and their
uses.
Identify and list data types for particular
special purpose charts.
E5: Photogrammetry and Remote Sensing
Topic/Element Content Learning outcomes
E5.1
Photogrammetry
and remote
sensing –
application to
charting
(B)
(i) Development of
photogrammetry and remote
sensing: brief history and
context
(ii) Introduction of equipment
types: sensors and formats of
aerial photographs and sensed
images
(iii) Satellite derived bathymetry
(iv) Basics of photogrammetric and
remote sensing geometry in
the context of adjustment and
application for charting:
Image scale, relief and
radial displacement
Theory and
implementation of spatial
rectification
Positional control
including use of aerial
GPS.
Describe basic geometrical principles
applicable to aerial photography and
imaging.
Describe the use of photogrammetric and
remotely sensed data sources to define
topographic features for charting.
List remotely sensed techniques
applicable to depth measurement.
Describe rectification and control
methods.
Page 16
16
E5.2
Sensor data
sources
(B)
(i) Characteristics of commonly
available photogrammetric and
satellite sensors (such as
EROS; IKONOS; SPOT;
Landsat; WorldView, GeoEye-
1, QuickBird panchromatic,
Sentinel, …) and associated
data
(ii) Pansharpening techniques
(iii) RADAR altimetry.
Identify the characteristics of commonly
available photogrammetric and satellite
sensor data sources.
Describe the merging of high resolution
panchromatic and lower resolution
multispectral imagery to create a single
high-resolution color image.
Compare and contrast the use of various
imagery for charting.
Describe the principles of RADAR
altimetry and its use.
E5.3
Geometric
modelling
(B)
(i) Utilization of different
imagery: panchromatic, multi-
spectral bands; color, laser,
altimetry
(ii) Image geo-referencing
(iii) Ortho-image production and
utilization.
Describe the process of preparing
photogrammetric and remotely sensed
imagery for feature extraction.
Explain the approach to be taken for
effective feature extraction suitable for
charting.
E 5.4
Data
management,
processing and
analysis
(B)
Describe geo-reference procedures for
photogrammetric and remotely sensed
imagery.
Identify changes to existing nautical
charting content with regard to more
recent imagery sources.
E5.5
Shoreline
delineation,
feature
extraction and
satellite
bathymetry
(I)
Perform shoreline extraction with regard
to the state of the tide at the time of
imagery.
Determine intertidal areas.
Utilize remotely sensed images for
bathymetry
Extract hydrographic features: reefs,
rocks, hazards, sea-bed features.
E5.6
Airborne and
terrestrial
LiDAR systems
and data
products
(B)
(i) Airborne and terrestrial
LiDAR systems and their
capabilities
(ii) Modeling land and sea-bed
topography
(iii) Water surface mapping
(iv) Environmental mapping
(v) Temporal mapping
(vi) Determining change using
both airborne and terrestrial
data.
Describe commonly available airborne
and terrestrial LiDAR systems and list
their capabilities.
Describe the potential of airborne and
terrestrial LiDAR systems for determining
coastal features and changes over time.
Identify how such techniques are
applicable to charting.
E6: Geospatial Information and Processing
Topic/Element Content Learning outcomes
E6.1 Overview
of Geospatial
Information
Science and
systems
(I)
(i) Geospatial Information
Science and data
(ii) Geographic Information
Systems [GIS] and
applications
(iii) Graphical User Interface
(GUI).
Define Geospatial Information Science
and its role in spatial data processing and
utilization.
Elaborate on the characteristics and the
functionality of a GIS.
Page 17
17
E6.2 Geospatial
data modeling
(I)
(i) Vector data models
(ii) Raster data models
(iii) Representation of point, line
and area data in vector and
raster models
(iv) Geospatial data structures
(v) Spatial resolution and Scale
(vi) Model suitability criteria
(vii) Topology: definition, levels
and topological relationships.
(viii) Open data formats: XML,
GML, SVG and their use.
Refer to the inherent characteristics of
vector and raster data models.
Select the appropriate data model and
structure for a specific purpose and scale.
Apply vector and raster models for the
encoding of spatial data taking into
account the spatial resolution required for
a specific application and scale.
Encode topological relationships in spatial
data files using available software tools.
Refer to open data formats.
E6.3 Geospatial
data input and
editing
(I)
(i) Feature and attribute data
encoding and standards
(ii) Data entry
(iii) Manual, semi-automatic and
automatic digitization
(iv) Scanning
(v) Data editing.
Use a GIS environment to encode spatial
data derived from manual, semi-automatic
and automatic digitization.
Apply the appropriate scanning
parameters with respect to a specific
application and scale and utilize the
resulting file.
E6.4 Geospatial
data
transformations
(I)
(i) Affine transformation
(ii) Projection transformations
(iii) Nature of problems associated
with geospatial data
transformations.
Describe and apply the most commonly
used spatial data transformations using
appropriate software.
Evaluate the results of spatial data
transformations.
E6.5 Raster to
Vector
Conversion
(I)
(i) Raster to Vector and Vector to
Raster conversion algorithms.
Apply raster to vector and vector to raster
conversions using appropriate software.
E6.6 Geospatial
and cartographic
databases
(B)
(i) Geospatial vs. cartographic
databases
(ii) Geospatial/Cartographic
database design
(iii) Geospatial/Cartographic
database integrity
(iv) Geospatial/Cartographic
database operations.
Describe different types of geospatial data
and their representation in a DBMS
environment.
Describe a spatial database on a
conceptual, logical and physical level.
For a given design, build and populate a
spatial database in a DBMS and use it to
support cartographic composition.
E6.7 Geospatial
data analysis
and modeling
(B)
(i) Single and multiple layer
operations.
Describe the functionality of a GIS in
geospatial data analysis and modeling.
E6.8 Raster data
compression
(B)
(i) Raster data compression
methods, e.g.:
Run-length encoding
Freeman chain codes
Quad tree encoding
JPEG compression.
Describe the various raster data
compression methods in terms of space
saving and resolution.
Page 18
18
E6.9 Geospatial
data transfer
standards
(B)
(i) Geospatial data transfer
standards (S-57, S100, SDTS,
DXF, DIGEST, ISO….)
(ii) Geospatial data transfer
process.
Explain the rationale underpinning
geospatial data transfer.
Describe a typical process for transferring
geospatial data between different
hardware and software environments.
E6.10 Spatial
Data
Infrastructures
(B)
(i) Spatial Data Infrastructures
[SDI] for the marine
environment.
Identify and explain the content and the
role of a SDI for the marine environment
as a means of:
facilitating and coordinating the
exchange of spatial data among providers
and users
compilation and production of nautical
charts.
marine spatial planning.
E6.11 Web
services
(B)
(i) Web services for geospatial data
(ii) Map and chart compilation,
composition and publication on
the web.
Compare web services with traditional
processes for delivery, storage and
portrayal of spatial data.
E7: Nautical Cartography
E7.1 The Nautical Chart
Element Content Learning outcomes
E7.1a Evolution
of nautical
charts
(I)
(i) Paper (national and INT)
(ii) ENC (ECDIS)
(iii) ECS.
Outline the evolution of nautical charts
and chart systems.
E7.1b Nautical
charts (I)
(i) Planning
(ii) Navigation
(iii) Types of charts
(iv) Chart reading.
Classify various types of nautical charts
according to their primary purpose.
Analyze various types of charts and their
uses.
E7.1c Nautical
chart design (I)
(i) Characteristics
(ii) Content
(iii) Terminology
(iv) Symbolization.
Describe present day characteristics and
design principles of nautical charts.
Describe the impact of technology on
nautical chart design and production.
E7.1d Nautical
chart reference
framework (I)
(i) Chart graticule
(ii) Chart grid.
Compute and prepare chart graticule and
chart grid using appropriate software
according to specifications.
E7.2 International Organizations and the Nautical Chart
Topic/Element Content Learning outcomes E7.2a Role and
structure of the
IHO (B)
(i) IHO roles and structure
(ii) General Assembly
(iii) Regional Hydrographic
Commissions
(iv) Committees and Working
Groups
(v) IMO and the SOLAS
convention
(vi) IALA guidelines and
Describe the roles of IHO, IMO and
IALA with respect to the development
and use of nautical charts for safe
navigation.
E7.2b Role of
the IMO (B) E7.2c Role of
Page 19
19
the IALA (B)
recommendations.
E7.3 Nautical chart compilation and production
Topic/Element Content Learning outcomes
E7.3a Planning
and scheming
(B)
(i) Geographical area and scale
(ii) Chart scheming
(iii) Overlapping and nesting
principles.
Refer to the planning processes adopted
internationally for the scheming and
production of (official) nautical charts.
E7.3b Data
sources
(I)
(i) Metadata considerations
(ii) Source data selection
(iii) Source data homogenization
(iv) Source data registration.
Analyze methods applied for the
appropriate selection and homogenization
of source data.
E7.3c Content
and Symbology
(I)
(i) Coastlines
Natural
Constructed
Approximate
(ii) Bathymetry
Soundings
Italicized
Upright
Special (e.g. Swept)
Sounding pattern
selection
Principles
Automated techniques
Channel depiction
(iii) Bathymetric contours
(iv) Dangers to navigation
Rocks
Wrecks
Reefs
Shoals
Offshore constructions
Submarine pipelines and
cables
Obstructions
Sea floor descriptions
(v) Topography
Depiction using seaward
view principle
Natural features
Landmarks
Constructed features
Conspicuous objects
(vi) Boundaries and limits
Dredged areas
Controlled areas
Controlled routes
Baselines
International boundaries
and maritime zones
Identify the various categories of features
portrayed in nautical charts and use them
in nautical chart production.
Explain the rationale underpinning the
symbology for each feature and/or data
category and apply them in nautical chart
production.
Page 20
20
(vii) Navigation aids
Lights, beacons, buoys,
marks
Light sectors
Leads
Radio beacons
Radar reflectors
Recommended tracks
Recommended routes
(viii) Source data diagrams –
depiction
(ix) ZOC
(x) Titles and chart notes
(xi) Graphic scales.
E7.3d
Chart
compilation and
composition
(I)
(i) The chart compilation and
composition processes.
Element selection
Database extraction
Synthesis and
homogenization
Conflict resolution
Validation.
Describe and perform the processes
required for chart compilation and
composition from a geospatial data base
using standalone software systems or
integrated cartographic production
systems.
E7.3e IHO
Standards and
Chart
Specifications
(I)
(i) IHO standards and chart
specifications
(ii) INT chart specifications
a. INT 1
b. INT 2
c. INT 3
(iii) IHO S-4
(iv) IHO S-11
(v) Feature attribution
(vi) Text (Styles as symbols)
(vii) Notes, legends.
Describe the processes of the IHO
Member States for the development of
international chart and ENC standards.
Identify, describe and use the international
standards and specifications for nautical
charts.
E7.3f Updating
(I)
(i) Notices to mariners
(ii) Editions.
Perform a complete chart updating task
including editing, updating and
publishing.
E7.3g Mapping
on demand
(B)
(i) Customized mapping from
existing databases.
Explain the concept of mapping on
demand.
E7.4 Map/chart production systems
Topic/Element Content Learning outcomes
E7.4a
Commercial
Systems (B)
(i) Commercial systems for
map/chart production
(ii) Graphics and image processing
software in cartographic
applications
(iii) Open standards and open
source systems
(iv) Open Geospatial Consortium
(OGC).
Identify common commercial systems
used for map/chart production.
Identify commercial graphic and image
processing systems.
Use a commercial system for map/chart
composition and production.
E7.4b Open
Source Systems (B)
Describe the concept of open source
systems as applied to map/chart
production.
Identify some open source geospatial
standards, their content and the
Page 21
21
organizations developing them.
E7.4c Map/chart
production
systems
evaluation
(I)
Identify the benefits and/or limitations of
the use of commercial and/or open source
systems.
E7.5 Electronic chart production
Topic/Element Content Learning outcomes
E7.5a
Introduction to
electronic charts
(I)
(i) Definition of ENC, SENC and
ECDIS
(ii) IMO carriage requirements
(iii) ENC as product
(iv) Production conventions
Issuance
Numbering
Cell structure
Updating
Official status
Security protection
SENC
Describe ENC, SENC and ECDIS
Explain the product characteristics of
ENCs.
E7.5b IHO
standards for
ENC production
(B)
(i) IHO S-57
Contents including
appendices
Data model
Topology
(ii) Object Catalogue
Object, attribute and
master/slave classes
Spatial objects
Feature objects
Relationships
Special cases
(iii) IHO S-52
Presentation Library
(iv) IHO S-65
ENC production
Quality control
Quality assurance
Quality management
systems
(v) IHO S-58
Validation process
Spatial accuracy
Feature completeness
Logical consistency
ECDIS display
consistency
Software validation tools
False warnings
Errors and warnings
(vi) ENC distribution system
Identify the international standards and
specifications relating to ENCs.
Describe the ENC standards and explain
the relationships between them.
Describe the S-57 data model.
Describe the content of Presentation
Library.
Describe the rationale underpinning the
development of S-100.
Describe the S-100 universal
hydrographic data model.
E7.5c ENC
production and
distribution
(I)
Explain Object Based Data Bases.
Explain the general principles
underpinning electronic chart data
visualization.
Describe recommended production
procedures for ENCs.
Identify best practices for the QC/QA of
an ENC including gaps and overlaps of
adjacent cells.
Use software applications to produce an
ENC.
Describe the ENC distribution system.
Page 22
22
IHO S-63
IHO WEND principles
and RENCS
(vii) IHO S-100
(viii) IHO S-99
S-100 Registry and
Registers
S-101 ENC product
specification
S-102 Bathymetry surface
product specification.
E7.6 Rasterized products
Topic/Element Content Learning outcomes
E7.6 Raster
charts (B)
(i) The rasterization process
(ii) Scanning processes
(iii) Advantages and limitations of
rasterized chart products
(iv) Raster data structures
(v) Raster chart formats
(vi) Raster chart products
(vii) Raster chart images and tiles
(viii) Raster chart images – use
within GIS and other
environments.
Describe the characteristics, advantages
and limitations of rasterized chart
products.
Describe rasterizing processes.
Describe the use of rasterized chart
images within navigation systems.
E8: Legal aspects (Relating to nautical cartography)
Topic/Element Content Learning outcomes
E8.1 Liability
and
responsibility
(B)
(i) The IMO SOLAS convention
(ii) The status of an official
nautical chart
General status under IMO
carriage requirements
Legal document
Status post maritime
incident
(iii) The role of national
hydrographic agencies
(iv) Potential legal issues:
Duty of care
Product liability
Defectiveness
Fitness for purpose.
Describe the role and responsibilities of
national hydrographic agencies as
required under the Safety of Life at Sea
convention
Describe the status of the nautical chart as
both an operational and legal entity.
Outline the role and responsibilities of the
nautical cartographer.
Describe potential issues of legal liability
relating to nautical charts.
E8.2 Intellectual
property and
copyright
(B)
(i) Definition
(ii) Protection
(iii) Permission/License and fees
(iv) Disclaimers
(v) Penalties.
Define intellectual property and copyright
in the framework of nautical charting.
Compare how copyright issues are
managed within different map and chart
production agencies.
E8.3 Law of the
Sea
(B)
(i) Historical development of the
Law of the Sea
(ii) The United Nations
Convention on the Law of the
Sea (UNCLOS):
General provisions
Base points
Describe the historical evolution of the
Law of the Sea
Describe the types of lines and areas
defined under UNCLOS and their
delimitation
Explain the status of the official nautical
Page 23
23
Baselines - normal
(including bay closing
lines); straight and
archipelagic
Internal waters
Territorial sea
Contiguous zones
Exclusive Economic Zone
Continental Shelf and
Extended Continental
Shelf.
(iii) Status of the nautical chart for
portrayal of boundaries and
maritime zones
(iv) Delimitation of boundaries and
maritime zones.
chart as a reference in relation to the
depiction of boundaries and maritime
zones.
E9: Special Purpose Charting
E9.1 Industrial and Engineering Survey Chart Production
Element Content Learning outcomes
E9.1a
Introduction to
industrial and
engineering
surveys charting
(B)
(i) Types of Industrial and
Engineering Surveys.
(ii) Data from remotely operated
and autonomous vehicles
(iii) Requirement for cartographic
presentation.
(iv) Applicable standards (e.g.
IOGP; UKOOA; IMCA; …).
Describe specific requirements,
equipment and standards for engineering
survey charts.
E9.1b
Route surveys
charting
(B)
(i) Rationale of charts and
graphics for route surveys
(ii) Forms of presentation for route
survey data
(iii) Use of vertical exaggeration in
DEMs and profiles.
Describe specific requirements and
guidelines for route survey charts.
E9.1c
Dredging
surveys
charting
(B)
(i) Rationale of charts and
graphics for dredging surveys
(ii) Forms of presentation for
dredging survey data
(iii) Presentation techniques for
volumetrics.
Describe specific requirements for
dredging survey charts.
E9.1d
Shallow
geophysical site
surveys
charting
(B)
(i) Rationale of charts and
graphics for Geophysical Site
surveys.
(ii) Forms of presentation for
Geophysical Site survey data.
(iii) Presentation techniques for
Geophysical Site survey data
including the depiction of
multiple layers.
Describe specific requirements and
guidelines for shallow geophysical survey
charts.
Page 24
24
E9.1e
Still photograph
and video
surveys charting
(B)
(i) Rationale for the use of still
photograph and video surveys
(ii) Photographic and video
formats
(iii) Video eventing
(iv) Relating video survey to other
relevant charts and graphics
(v) Positional considerations.
Describe specific requirements and
standards for photographic and/or video
survey charts.
E9.1f
Geo-technical
surveys charting
(B)
(i) Rationale of charts and
graphics for geotechnical data
(ii) Forms of presentation for
geotechnical data including
written reporting.
Describe specific requirements and
guidelines for engineering survey charts.
E9.1g
Environmental
surveys charting
(B)
(i) Rationale of charts and
graphics for environmental
data
(ii) Forms of presentation for
environmental data.
Describe specific requirements and
guidelines for environmental survey
charts.
E9.1h Industrial
and engineering
survey data
representation
(B)
(i) Forms of presentation for
industrial and engineering
survey data.
Differentiate the representation of
industrial and engineering survey data
from nautical charting data.
E10: Map/Chart Reproduction
Topic/Element Content Learning outcomes
E10.1 Forms of
map/chart
artwork
(B)
(i) Positive artwork
(ii) Negative artwork.
Describe the forms of map/chart artwork
and their characteristics.
E10.2 Output
options
(B)
(i) Soft copies
(ii) Hard copies.
Explain the differences and use of
available output options.
E10.3 Raster
processing
techniques
(B)
(i) Page description language
(Adobe Postscript)
(ii) Raster Image Processing
(RIP).
Explain raster processing techniques.
E10.4 Output
devices
(B)
(i) Electrostatic printers/plotters
(ii) Ink-jet printers/plotters
(iii) Laser printers/plotters
(iv) Thermal printers
(v) Image setters.
Describe the technical characteristics of
the various output devices used in
cartographic production.
E10.5 Color
management
(B)
(i) Standards for Color Matching
(ii) Color profiles
(iii) Gamut mapping.
Explain the need for the use of color
standards and the creation of color
profiles.
Describe the gamut mapping process.
E10.6 Color
separation
(B)
(i) Color separation
(ii) Image Setters
(iii) Compositing separations
(iv) Composite to film
(v) Composite to plate.
Explain the need for color separation.
Describe the color separation process in
analogue and digital environments.
E10.7 Proofing
(B)
(i) Pre-press proofing
(ii) Photo-mechanical proofs
Explain the need for proofing.
Distinguish between photo-mechanical
Page 25
25
(iii) Digital proofs. and digital color proofs.
E10.8
Lithography
(B)
(i) Single color lithography
(ii) Multiple color lithography.
Explain the processes involved in single
and multi-color lithography.
E10.9 Plate
making
(B)
(i) Plate making process. Describe the plate making process.
E10.10 Press
work
(B)
(i) Offset lithography
(ii) Printing units
(iii) Printed output quality check.
Describe the offset lithographic process.
Describe map/chart quality checks in
offset printing
E10.11 Printing
papers
(B)
(i) Printing paper specifications. Refer to printing paper specifications.
Page 26
26
CCP - COMPREHENSIVE CARTOGRAPHIC PROJECT
Programmes must include a supervised and evaluated Comprehensive Cartographic Project
(CCP) with a minimum aggregate period of at least four weeks; see “GUIDELINES FOR
THE IMPLEMENTATION OF THE STANDARDS OF COMPETENCE FOR
HYDROGRAPHIC SURVEYORS AND NAUTICAL CARTOGRAPHERS”.
Notes:
a. The Comprehensive Cartographic Project does not include practical exercises,
which form a part of the course modules syllabi and are designed to complement
the theory component see “GUIDELINES FOR THE IMPLEMENTATION OF
THE STANDARDS OF COMPETENCE FOR HYDROGRAPHIC
SURVEYORS AND NAUTICAL CARTOGRAPHERS”.
b. The Comprehensive Cartographic Project must contain all those items that will
enable the student to compile and compose a modern nautical chart, ENCs and
special purpose charts according to international specifications.
c. The Comprehensive Cartographic Project must be divided in phases, representing
the distinct processes involved in cartographic composition and production i.e.
planning, preparation, acquisition & processing, composition, deliverables (paper
charts, ENCs, special purpose charts) and reports.
d. Each phase will be further divided in tasks that will:
result in specific outcome(s)
require specific equipment, software, data sources, etc.
be carried out in specific number of hours and
be related to specific S-B elements.
THE TABLE -AS SPECIFIED IN THE GUIDELINES- MUST BE COMPLETED AND
SUBMITTED IN ADDITION TO A DETAILED AND COMPREHENSIVE
NARRATIVE DESCRIPTION OF THE COMPREHENSIVE CARTOGRAPHIC
PROJECT MODULE IN ACCORDANCE WITH THE GUIDELINES.