1 32 STANDING COMMITTEE ON FINANCE (2010-11) FIFTEENTH LOK SABHA Ministry of Planning APPRAISAL OF BPL CRITERIA THIRTY SECOND REPORT LOK SABHA SECRETARIAT NEW DELHI March, 2011/ Phalguna, 1932 (Saka)
Transcript
1
32
STANDING COMMITTEE ON FINANCE
(2010-11)
FIFTEENTH LOK SABHA
Ministry of Planning
APPRAISAL OF BPL CRITERIA
THIRTY SECOND REPORT
LOK SABHA SECRETARIAT
NEW DELHI
March, 2011/ Phalguna, 1932 (Saka)
2
THIRTY SECOND REPORT
STANDING COMMITTEE ON FINANCE (2010-2011)
(FIFTEENTH LOK SABHA)
Ministry of Planning
APPRAISAL OF BPL CRITERIA
Presented to Lok Sabha on 18 March, 2011
Laid in Rajya Sabha on 18 March, 2011
LOK SABHA SECRETARIAT NEW DELHI
March, 2011/ Phalguna, 1932 (Saka)
3
CONTENTS
Page No
COMPOSITION OF THE COMMITTEE (iii)
INTRODUCTION (v)
REPORT
PART - I
BACKGROUND ANALYSIS
Sl.No Subject
A. Introduction
(i) Definition of Poverty Line
(ii) Estimation of Poverty
(iii) Identification of Below Poverty Line (BPL)
(iv) Unit of ‗Household‘ in BPL Census
(v) Poverty Alleviation Programmes – Role of BPL Criteria
1
1
6
12
14
16
B. BPL Identification – Criteria
(i) Evolution of BPL Criteria
(ii) Conducting next BPL Census
(iii) Proposed Food Security Act
17
17
26
28
C. Divergence between estimated and identified population Below Poverty Line (BPL)
(i) Estimation of BPL
(ii) Other Estimates of Poverty
(iii) BPL Population identified by the State Governments vis-à-vis estimates of the Planning Commission
29
29
29
31
D. Implementation of Welfare Schemes for the Poor
(i) Welfare Schemes for rural poor
(ii) Welfare Schemes for urban poor
(iii) Public Distribution System
35
36
41
42
4
(iv) Antyodaya Anna Yojana
(v) National Rural Health Mission
(vi) Mahatma Gandhi National Rural Employment
Guarantee Act (MGNREGA)
(vii) Monitoring of Welfare Schemes
45
46
47
48
Part II Recommendations/Observations of the Committee……………………………… 51
ANNEXURES I Percentage of population below poverty line by States II Minutes of the sittings of the Committee held on 31 May, 14 July,
29 September, 2010 and 15 March, 2011
5
COMPOSITION OF STANDING COMMITTEE ON FINANCE – 2010-2011
* Nominated to this Committee w.e.f. 28.01.2011 vice Shri Y.S. Jagan Mohan Reddy, ceased to be a member of the Committee on his resignation from Lok Sabha
6
INTRODUCTION
I, the Chairman of the Standing Committee on Finance, having been authorized by the
Committee, present this Thirty-Second Report on ‘Appraisal of BPL Criteria‘.
2. The Committee obtained Background note and written information on the subject
from the Ministry of Planning, Ministry of Housing & Urban Poverty Alleviation, Ministry of Rural
Development (Department of Rural Development), Ministry of Statistics and Programme
Implementation and various States and Union Territories.
3. Written views/memoranda were received from Prof. M.H. Suryanarayana, IGIDR,
Mumbai, Dr. Himanshu, JNU, Delhi, Dr. Suranjan Sengupta, Kolkata and Prof. Indrani Gupta, IEG,
Delhi.
4. The Committee, at their sitting held on 31 May, 2010 took evidence of the representatives
of the Ministry of Planning and Ministry of Rural Development (Department of Rural Development).
On 14 July, 2010, the Committee heard the views of Dr. Shubhasis Gangopadhyay, Prof. M.R. Saluja
and Prof. Indrani Gupta on the subject. They also took evidence of the representatives of the Ministry
of Housing and Urban Poverty Alleviation.
5. The Committee took further evidence of the representatives of the Ministry of
Planning and Ministry of Rural Development (Department of Rural Development) on 29 September,
2010.
6. The Committee, considered and adopted the draft report at their sitting held on 15
March, 2011.
7. The Committee wish to express their thanks to the officials of the Ministry of
Planning, Ministry Rural Development (Department of Rural Development), Ministry of Housing &
Urban Poverty Alleviation for appearing before the Committee and furnishing the requisite material
and information which were desired in connection with the examination of the Bill.
8. The Committee also wish to express their thanks to Prof. M.H. Suryanarayana,
IGIDR, Mumbai, Dr. Himanshu, JNU, Delhi, Dr. Suranjan Sengupta, Kolkata, Prof. Indrani Gupta,
IEG, Delhi. Dr. Shubhasis Gangopadhyay, IDF, Gurgaon and Prof. M.R. Saluja, IDF, Gurgaon, for
placing before them the requisite material and their considered views in connection with the
examination of the subject.
New Delhi; YASHWANT SINHA 15 March, 2011 Chairman, 24 Phalguna, 1932(Saka) Standing Committee on Finance.
7
Report Part I
Background Analysis A. Introduction
1.0 Poverty alleviation programmes have been the cornerstone of
economic policy and planning since independence. Reliable estimation of poverty is
the first step towards eradication of poverty as they provide the basic input for
design, implementation and monitoring of anti poverty programmes. Crucial input for
measurement of poverty is defining a poverty line.
(i) Definition of Poverty Line
1.1 Defining a poverty line is the first step in measurement of poverty
which divides the poor from the non-poor.
(a) Task Force on Projection of Minimum needs and Effective Consumption Demand
Planning Commission set up a Task Force on Projection of Minimum
needs and Effective Consumption Demand under the Chairmanship of Dr. Y. K.
Alagh in 1979 to determine poverty line. It defined the poverty line as per capita
consumption expenditure level which meets the average per capita daily calorie
requirement of 2435 kcal (say 2400 kcal) in the rural areas and 2095 kcal (say 2100
kcal) in urban areas along with the associated quantum of expenditure on non-food
items such as clothing, shelter, transport, education, health care etc. The Task Force
calculated the average calorie requirements from the age, sex and activity
distribution of the population and associated calorie norm recommended by the
nutrition experts of the Indian Council of Medical Research.
1.2 Accordingly, the poverty line for rural areas was fixed at per capita
monthly consumption expenditure of Rs. 49.09 and for urban areas at Rs. 56.6.
These poverty line expenditures conform to a consumption basket which also meets
a minimum of non-food requirements like clothing, shelter, transport, education and
health care etc.
(b) Expert Group on Estimation of Proportion and Number of Poor
1.3 The Planning Commission, in 1989, constituted the Expert Group on
Estimation of Proportion and Number of Poor (Lakdawala Committee) to look into
8
the methodology for estimation of poverty and to redefine the poverty line, if
necessary. The Expert Group recommended that Task Force Poverty line which
quantified at the national level separately in rural and urban areas be adopted.
Further, the Expert Group disaggregated the National Poverty lines separately in
rural and urban areas into States specific poverty lines in order to reflect the inter
state price differentials.
1.4 Major recommendations of the Expert Group are as follows:
(a) ―The Poverty Line recommended by the Task Force on projection of minimum needs and effective consumption demand, namely a monthly per capita total expenditure of Rs.49.09 (rural) and Rs.56.64(urban) rounded respectively to Rs.49 and Rs.57 at all India level at 1973-74 prices be adopted as the base line. This was anchored in the recommended per capita daily intake of 2400 calories in rural areas and 2100 calories in urban areas with reference to the consumption pattern as obtained in 1973-74. The Group recommends that these norms may be adopted uniformly for all State.
(b) Given that much systematic work has already been done with the base 1973-74, the Group is in favour of continuing it as the base year for estimating the poverty line.
(c) State-specific poverty line should be estimated as follows. The standardised commodity basket corresponding to the poverty line at the national level should be valued at the prices prevailing in each State in the base year, i.e., 1973-74. For updating poverty line to the current prices in a given year, a State-specific consumer price-index needs to be formed. For this purpose, the observed all-India consumption pattern of the 20 to 30 per cent of the population around the poverty line in 1973-74 should constitute the State-specific weighting diagram. This diagram should be used in the construction of State-specific price index over the years using the disaggregated commodity indices from the consumer price- index for the agricultural labourers (rural) and consumer price index for the industrial workers and non- manual employees (urban).
(d) After considering various possible choices for the deflator, the Group came to the conclusion that it would be most suitable to rely on the disaggregated commodity indices from Consumer Price Index for Agricultural Labourers (CPIAL) to update the rural poverty line and a simple average of suitably weighted commodity indices of consumer price index for industrial workers (CPIIW) and consumer price index of non-manual employees (CPINM) for updating the urban poverty line.
(e) Given the updated State-specific poverty lines and the corresponding size distribution of per capita consumption expenditure (PCTE) of National Sample Survey (NSS), the number of poor as a percentage of total population or the poverty ratio should be calculated separately for rural and urban areas for each State. The absolute number of poor in each State in rural and urban areas should be calculated by applying the
9
poverty ratio to the estimated population as given by the Registrar General of Census. The all-India (rural or urban) poverty ratio should be derived as a ratio of the aggregate number of State-wise poor persons to the total all- India (rural and urban) population. The implicit all-India poverty line may be worked out, given the all- India poverty ratio and the all- India distribution of population by expenditure classes obtained from the same NSS survey.
(f) (i) The poverty-ratio of Assam has been adopted for Sikkim and the North-eastern States namely, Arunachal Pradesh, Meghalaya, Mizoram, Manipur, Nagaland, and Tripura. In case of Manipur, the population distribution by expenditure classes and the price indices, both are available. But the use of such information for estimating the incidence of poverty in Manipur gave poverty ratios which were completely out of line with the poverty ratios in the other North-Eastern States and also the numbers and the ratios were not very consistent over the years. This happened because of the sample size. Hence the Group preferred to adopt the poverty-ratio of Assam for Manipur also. (ii) For Goa, Daman and Diu, the poverty line of Maharashtra and the population distribution by expenditure classes for Goa was used. (iii) Among the Union Territories, for Andaman and Nicobar Islands, the poverty -ratio of Tamil Nadu, for Lakshdweep the poverty ratio of Kerala, for Dadra and Nagar Haveli the poverty-ratio of Goa, and for Pondicherry the poverty ratio of Tamil Nadu was used. For rural and urban Chandigarh the Group used the urban poverty-ratio of Punjab‖.
1.5 The estimates of the proportion and number of poor based on the
methodology recommended by this Group are as given below:
Year Rural % of persons Urban % of persons
Combined % of persons
1973-74 56.44 49.23 54.93
1977-78 53.07 47.40 51.81
1983 45.61 42.15 44.76
1987-88 39.06 40.12 39.36
1.6 The Group also suggested certain priority areas for research and data
improvement for improving poverty estimates in future. These are as follows:
(a)―Non -availability of appropriate State-specific cost of living indices is an important gap in data availability for making State-specific estimates of poverty. This Group recommends taking immediate steps to construct the price indices representing changes in consumer prices of the poor at relevant disaggregated levels.
(b) The estimates of the poverty-ratio derived from the NSS
10
provide a composite picture of the number of people whose per capita consumption expenditure is below the level corresponding to the basket of commodities constituting the desired minimum. It does not, however, provide a complete picture of the State of well-being of the population. Therefore, the estimates of the proportion and number of poor needs to be supplemented with the assessment of the following aspects in order to capture a fuller picture of the living conditions and well being of the poor:
(i) The composition of the poor population in terms of dominant characteristics, i.e., their distribution by region, social group, family characteristics (e.g., size, education, age, sex of household head, dependency ratio) and the way this is changing over time. Much of this can be done by appropriate tabulation of NSS employment and consumption survey data.
(ii) Nutritional status of the population: levels of intake of principal nutrients, incidence of malnourishment, anthropometric measurements and activity patterns by age, sex and socio-economic categories. This can be done by the National Institute of Nutrition.
(iii) Health status: mortality (overall, infant and child, maternal); morbidity; access to and use of health services (public and private) and costs. The quinquennial surveys of public consumption as well as the mortality indicators based on the Sample Registration System and the morbidity surveys of NSS need to be put on a systematic and continuing basis.
(iv) Educational status: school enrolment by region, sex and age group and by economic-social class; reach and quality of public education services and costs. Here again information from the NSS social consumption enquiries and the all-India Education Survey suitably restructured would provide the basic data.
(v) Living Environment: distribution by density of settlement; living space per head; type of houses; access to safe drinking water and sanitation; access to amenities (post office, telephones, railway, pucca road, markets, etc).
IRDP. We believe that, in principle, the improved estimates we have recommended will make them more usable for this purpose. In practice, however, it is difficult to estimate or verify incomes or consumption expenditure at the level of individual households. In these circumstances, the "first information' indicator provided by the poverty-ratio under this methodology needs to be supplemented and corrected with other indicators - which may also be more readily verifiable than income or consumption expenditure. This is important in order to refine targeting so that the ineligible are excluded from, and the eligible are fully covered in, the intended benefits from targetted anti-poverty programmes.
(d) At present, the agencies concerned with the implementation of poverty-alleviation programmes resort to special surveys to identify the eligible households. Such surveys, besides being expensive, cannot really give a correct picture because they may suffer from the reporting bias which arises when it is known to form the basis for identifying beneficiaries of Government assistance. Analysis of data relating to sample households obtained form the NSS can give us an idea of certain easily identifiable characteristics of poor households. Such analyses have already been attempted on a limited scale and they show that the ranks of the poor tend to have a relatively high concentration of households with large household size, high-dependency-ratio and female heads, rural households which do not cultivate any land, and households belonging to scheduled castes and scheduled tribes. It should be possible from the NSS data to estimate,by State and region, separately for rural and urban areas, the probability of a household being poor for various values of each of these characteristics taken individually and in combination. Once this is done, it should be possible to give guidelines for identifying the poor households in a given locality of the region in terms of the value of specified characteristics, information on which is already available in the population census or can be collected without much expense. We would urge the Planning Commission to take the initiative in exploring these possibilities.‖
1.7 Based on the Expert Group methodology, the poverty lines in 2004-05
at all India level has been calculated by Planning Commission as Rs. 356.30 per
capita per month for rural areas and Rs. 538.60 per capita per month for urban
areas. The State specific rural poverty lines calculated by the Expert Group in 1973-
74 are updated by using state specific Consumer Price Indices of Agricultural
12
Labourers (CPI-AL). Similarly the state specific urban poverty lines are updated by
state specific Consumer Price Indices of Industrial Workers (CPI-IW).
(ii) Estimation of Poverty
1.8 Incidence of poverty is estimated by the Planning Commission on the
basis of the large sample surveys on household consumer expenditure conducted
by the National Sample Survey Organisation (NSSO) on a quinquennial basis.
Household Consumer Expenditure (HCE) surveys conducted by National Sample
Survey Organisation (NSSO)
1.9 One of the most important data requirements for assessment of
inequality and deprivation is that relating to levels of income of the people and
corresponding expenditure by them for meeting their various needs. Since, such
data are generally not available through any other data sources of the statistical
system, direct data collection through large scale sample surveys on the subject
‗Household Consumer Expenditure‘ (HCE) becomes an important statistical
exercise. A Comprehensive survey of household consumer expenditure (HCE) is a
valuable tool for studies of poverty and nutrition, for analysis of consumer demand,
and for assessment of the impact of specific socio-economic policies on level and
pattern of consumption. Based on the NSS HCE, the Planning Commission arrives
at the poverty line and the people living below poverty line.
Salient features of the NSS HCE surveys
1.10 NSS HCE surveys are conducted as part of the socio-economic
surveys of NSSO. A sample of villages and urban blocks is selected from the list of
Census villages and the list of urban blocks drawn up so as to cover practically the
entire geographical area of the country. Field investigators visit the selected villages
and urban blocks, list the households therein, and select the households to be
surveyed. Different samples of households are selected for the enquiry on
consumer expenditure and the other subject of enquiry such as employment,
unemployment etc. which are covered in the same round. The survey work is
spread over the entire survey year partitioned into four sub-rounds of 3 months
each, to neutralize the effect of seasonality of consumption in the estimates.
Profile of Information in NSS HCE
13
1.11 The information collected from each surveyed household has four
parts:
(a) household characteristics other than consumption data such as
number of members, principal household industry and occupation,
social group, land possessed etc.;
(b) member characteristics such as age, sex, educational level, etc.,
collected separately for each members;
(c) data on item wise consumption by household (Total 341 items, 142
food items and 199 non food items); and
(d) possession by the household of certain specified durable goods on the
date of survey.
1.12 Of these, consumption data is the most important and elaborate and
consists of quantity and value of consumption by the household as a whole during a
specified period (reference period) for each of a large number of items which
together cover the entire range of consumer goods and services. No attempt is
made to ascertain person-wise consumption for any item. To reduce recall errors,
and also to take account of heterogeneity in consumption over different parts of the
country and different income levels, the schedule uses a very detailed item break-
up.
Existing methodology of poverty calculation
1.13 For the calculation of income poverty, one need (a) distribution of
households by size of per capita total expenditure that is generated by quinquennial
Consumer Expenditure Survey (CES) conducted by NSSO; (b) exogenously
specified poverty line; and (c) price deflator to update the poverty line to the
prevailing prices in the survey period(s) of CES. The distribution of households by
size of per capita total expenditure is obtained from NSS Consumer Expenditure
Survey (CES). The current poverty estimates are based on 61st round (2004-05)
CES data. However, in 2004-05 distribution of two Monthly Per Capita Consumer
Mixed recall period) were generated by NSS. Hence two poverty ratios, one using
14
MPCE (URP) and other using MPCE (MRP) were computed for each state and
sector combination and presented by Planning Commission.
1.14 Accordingly the estimates of poverty were worked out by the Planning
Commission for the years 1973-74, 1977-78, 1983, 1987-88, 1993-94 and 2004-05.
On the basis of the poverty line of Rs. 356.30 for rural areas and Rs. 538.60 for
urban areas in the year 2004-05, the percent of population below poverty line for
rural, urban and all India during 2004-05 was estimated at 28.3%, 25.7% and 27.5%.
However these estimates came in for sharp criticism as the poverty line did not allow
the consumption of required calorie norms and the periodic price corrections, carried
out to update the poverty lines were found to be inadequate and inappropriate.
Therefore the Planning Commission constituted an Expert Group under the
Chairmanship of Prof. Suresh D. Tendulkar in 2005 to review the methodology for
estimation of poverty.
Expert Group to Review the Methodology for Estimation of Poverty
1.15 Major highlights of the recommendations of the Expert Group are as
follows:
1. ―While acknowledging the multidimensional nature of poverty, the estimates of poverty will continue to be based on private household consumer expenditure of Indian households as collected by the National Sample Survey Organization (NSSO).
2. The expert group has also taken a conscious decision to move away from anchoring the poverty lines to a calorie intake norm in view of the fact that calorie consumption calculated by converting the consumed quantities in the last 30 days as collected by NSS has not been found to be well correlated with the nutritional outcomes observed from other specialized surveys either over time or across space (i.e. between states or rural and urban areas).
3. The quinquennial National Sample Surveys of household consumer expenditure surveys carried out by the NSSO provide the basic data set for official poverty calculations. For canvassing household expenditure on a recall basis, the NSSO has decided to shift to Mixed Reference Period (MRP) for all its consumption surveys in future, namely, 365 days for low frequency items (clothing, footwear, durables, education and institutional health expenditure) and 30 days for all the remaining items. This change captures the household consumption expenditure of the poor households on low frequency items of purchase more satisfactorily than the earlier 30 day recall period. The Expert Group decided to adopt the MRP
15
based estimates of consumption expenditure as the basis for future poverty lines as against the previous practice of using Uniform Reference Period estimates of consumption expenditure.
4. Underlying consumption poverty line is the reference poverty line basket (PLB) of household goods and services consumed by those households at the borderline separating the poor from the non poor. In the interest of continuity as well as in view of the consistency with broad external validity checks with respect to nutritional, educational and health outcomes, it was decided to recommend MRP equivalent of urban PLB corresponding to 25.7 per cent urban headcount ratio as the new reference PLB to be provided to rural as well as urban population in all the states after adjusting it for within state urban relative to rural and rural and urban state relative to all India price differentials.
5. It may be noted that while the new poverty lines have been arrived at after assessing the adequacy of private household expenditure on education and health, the earlier calorie anchored poverty lines did not explicitly account for these. The proposed poverty lines are in that sense broader in scope.
6. It may be noted that although those near the poverty line in urban areas continue to afford the original calorie norm of 2100 per capita per day, their actual observed calorie intake from 61st Round of NSS is 1776 calories per capita. This actual intake is very close to the revised calorie intake norm of 1770 per capita per day currently recommended for India by the Food and Agriculture Organization (FAO). Actual observed calorie intake of those near the new poverty line in rural areas (1999 calories per capita) is higher than the FAO norm.
7. The proposed reference PLB is situated also in the latest available data on the observed consumption patterns from the household consumer expenditure survey of NSS for the year 2004-05 and takes into account all items of consumption (except transport and conveyance) for construction of price indices. Separate allowance for private expenditure on transport and conveyance has been made in the recommended poverty lines.
8. The proposed price indices are based on the household level unit values (approximated price data) obtained from the 61st round (July 2004 to June 2005) of NSS on household consumer expenditure survey for food, fuel and light, clothing and footwear at the most detailed level of disaggregation and hence much closer to the actual prices paid by the consumers in rural and urban areas. Price indices for health and education were also obtained from unit level data from related National Sample Surveys. The recommended price indices take care of most of the criticisms of the earlier population segment specific consumer price indices with outdated base used for updating poverty lines. An added and a significant advantage is that the recommended procedure permits the derivation of new poverty lines and the corresponding
16
headcount ratios for all the states including the north eastern states. In the judgment of the Expert Group, these advantages outweigh the problem of ignoring the quality differences in consumption of commodities across households that is involved in equating unit values with approximated prices.
9. The new poverty lines seek to enable rural as well as urban population in all the states to afford the recommended all-India urban PLB after taking due account of within-state rural-urban and inter-state differentials (rural and urban) incorporating observed consumer behaviour both at the all India and state levels.
10. The new poverty lines have been generated for all the states including the north eastern states. However, in the absence of adequate data, the expert group has suggested use of poverty line of the neighbouring states for union territories‖.
1.16 The all-India rural headcount ratio using the recommended procedure
is 41.8 per cent in comparison with 28.3 per cent. The expert group re-estimated
poverty for states and all India for 2004-05. A preliminary exercise for 1993-94 has
been carried out by the Expert Group to facilitate a broad two point comparison of
changes in headcount ratios. By this exercise, poverty at all India level in 1993-94
was 50.1% in rural areas, 31.8% in urban areas and 45.3% in the country as a whole
as compared to the 1993-94 official estimates of 37.2 per cent rural, 32.6 per cent
urban and 36.0 per cent combined.
1.17 On the basis of above methodology, the all-India rural poverty
headcount ratio for 2004-05 is estimated at 41.8 %, urban poverty headcount ratio at
25.7% and all India level at 37.2%. Tendulkar Committee’s estimates are, however,
not strictly comparable to the present official poverty estimates because of different
methodologies. The divergent estimates for 1993-94 and 2004-05 are given below.
Poverty Ratios
1993-94 2004-05
Year Rural Urban Total Rural Urban Total
Planning
Commission (URP)
37.3 32.4 36.0 28.3 25.7 27.5
Tendulkar
Estimates (2004-
05) (MRP)
50.1 31.8 45.3 41.8 25.7
37.2
17
N.B.: 1. URP = URP consumption = Uniform Recall Period consumption in which the consumer expenditure data for all the items are collected from 30-day recall period. 2. MRP = MRP consumption = Mixed Recall Period consumption in which the consumer expenditure data for five non-food items, namely, clothing, footwear, durable goods, education and institutional medical expenses are collected from 365-day recall period and the consumption data for the remaining items are collected from 30-day recall period.
1.18 Following major departures were suggested by the Expert group from
the earlier methodology followed by Lakdawala Committee:
i. Moved away from calorie anchor but included the adequacy of actual
food expenditure near the poverty line to ensure certain aggregates
like nutritional outcomes.
ii. No discrimination between the rural and the urban population and
recommended to provide a uniform Poverty Line Basket (PLB) based
in the latest available observed household consumption data to both
the rural and urban populations.
iii. Recommended a price adjustment procedure that is predominantly
based in the same data set that underlines the poverty estimation. This
has been proposed to correct for the problems associated with
externally generated population segment specific price indices with
outdated price and weight base used so far in the official poverty
estimations.
iv. Recommended to incorporate an explicit provision in price indices for
private expenditure on health and education which has been rising
over time and test for their adequacy to ensure certain desirable
educational and health outcomes.
1.19 The report of the Expert Group has been accepted by the Government.
Planning Commission is going to issue a press note on identification of the poor.
1.20 In a post evidence submission, the Ministry of Housing and Urban
Poverty Alleviation have apprised the Committee about their comments on findings
of urban poverty by Expert Group headed by Tendulkar, which were forwarded to
Planning Commission which are stated as below:
―The report submitted by the Tendulkar Committee accepts the urban poverty ratio at 25.7 per cent, while it increases the figure for rural
18
poverty to 41.8 per cent on the basis of a uniform Poverty Line Basket (PLB)… the figures for rural poverty have mainly increased due to the adjustment process that basically takes care of the expenditure on health, education and other non-food items by the poor due to the fact that public provision on these accounts in rural areas have not kept pace. Similar adjustment, however, has not been done for urban areas because the urban poverty figures have been taken on ―as is given basis‖ as reference for computation of rural poverty… urban poverty also needs redefinition and adjustment, especially if we accept the Tendulkar Committees‘ own argument that ―the composition of the minimal basket of human needs that the society would expect every citizen to satisfy may be expected to keep expanding with economic and social progress in society‖. We do know from simple everyday knowledge that there have been changes in the consumption behaviour and consumption patterns of residents in cities, with housing shortages and high level of house rents, especially for EWS and LIG categories and with shrinking access to free health, education and rising transportation costs. Expenditure on account of education, health, housing and transport that the urban people are required to spend are proportionately much more as compared to their rural counterparts. Therefore, the assumption that urban poverty figure of 25.7 per cent is acceptable while observing that for the same reasons rural poverty figures need readjustment requires a thorough re-examination… Further, in case of housing, transport, conveyance, rent etc. adjustments have been done by the Tendulkar committee by taking into account data from NSSO on actual expenditures. However, whether these actual expenditures are adequate to meet the minimum basic needs on these counts have not been examined… Another issue is whether abandoning the calorie norm is a wise step. It is true that calorie intakes were poorly correlated with nutritional outcomes. However, abandoning the calorie norm altogether appears to be a controversial proposition. It is unclear whether there is any robust basis, theoretical or empirical, for this relationship to hold at all in the years to come.‖
(iii) Identification of Below Poverty Line (BPL) households
1.21 While Planning Commission estimates the poverty, actual identification
of the BPL households in rural areas is done by the Ministry of Rural Development
(MORD) which conducts BPL census for this purpose. As the identification of the
poor is generally done at the beginning of the Five Year Plan through door-to-door
survey with hundred per cent coverage of rural households, the MORD has been
conducting the BPL Census for this purpose. It provides financial and technical
support to States/UTs for conducting BPL Census. For identification of BPL families
19
in urban areas, the Ministry of Housing and Urban Poverty Alleviation is the nodal
agency which issues guidelines for carrying out house to house survey by the
States/Union Territories on the basis of State specific poverty lines indicated by
Planning Commission.
BPL Census in rural areas
1.22 The Ministry of Rural Development has so far conducted BPL Census
in 1992 for 8th Five Year Plan, in 1997 for 9th Five Year Plan and in 2002 for 10th
Five Year Plan.
1.23 The BPL census of 1992 used an income criterion to determine
poverty and the annual income cut-off was fixed at Rs. 11,000 per household. The
BPL Census of 1997 was conducted in two stages. First, some families were
excluded on the basis of certain criteria. In the second stage, each remaining
household was interviewed to determine its total consumer expenditure, and was
identified as a BPL household if its per capita consumer expenditure was below the
poverty line set by the planning Commission. BPL Census conducted in 2002 for the
10th Five Year Plan was based on the methodology of Score Based Ranking of rural
households for which 13 socio-economic parameters were used, each parameter
having a score between 0-4.
Expert Group to advise the Ministry of Rural Development on the methodology for
conducting the BPL Census for 11th Five Year Plan
1.24 For conducting the BPL Census for the Eleventh Five Year Plan, the
Ministry, on 12th August, 2008, constituted an Expert Group, which could advise it on
the suitable methodology. The Expert Group submitted its report on 21st August
2009 under chairmanship of Dr. N. C. Saxena. This Group suggested automatic
exclusion and inclusion criteria on the basis of which families will be selected which
will be again ranked on the basis of points given for such characteristics as caste,
tribal groups, employment and health status etc.
1.25 The report of the Expert Group has been circulated by the Ministry of
Rural Development to the State Governments/UTs and the concerned Central
Ministries for their comments.
20
(iv) Unit of „Household‟ used in BPL Census
1.26 As per the instructions issued by the Ministry of Rural Development for
BPL Census 2002, a household is defined as a group of persons who commonly
reside together and would take their meals from a common kitchen, unless the
exigencies of work prevented any of them doing so. The household may comprise of
persons related by blood or of unrelated persons or combination of both.
1.27 As an effort to make the system of identifying the BPL families in the
rural areas more accurate, methodology for conducting the BPL Census is examined
and reviewed from time to time.
1.28 The Expert Group headed by N.C.Saxena had also recommended the
following definition of household for the BPL Census:
A joint family comprising all adults and children who eat from a common hearth and reside under a common roof.
However for the purpose of inclusion and survey (but not exclusion), within households which may even share a kitchen and roof, the following will be treated as separate households:
o a single woman;
o old individuals or couples in which one or both are beyond the age of 60 years
o every adult with TB, leprosy, disability, mental illness or HIV AIDS with spouse and children; and
o bonded labourers with spouse and children.
In case a minor has these afflictions, his/her parents and siblings will constitute the household. This logic will also apply to bonded child workers.
1.29 The Ministry has consulted with experts and States and it has been
decided to conduct a pilot survey to arrive on the methodology for the forthcoming
BPL Census which will also include definition of households.
BPL Census for urban areas
1.30 In respect of BPL in urban areas, the guidelines issued by Ministry of
Housing and Poverty Alleviation (HUPA) for identification of BPL families in urban
areas are relevant. These stipulate that house to house survey is to be carried out
21
by the States/UTs. for identification of genuine beneficiaries on the basis of State
specific poverty lines indicated by Planning Commission from time to time. During
door to door survey focus has to be on slums and low income settlements. The
model formats & general guidelines for conducting slum survey, household survey
and livelihood survey are issued by Ministry of Housing & Urban Poverty Alleviation
(HUPA). In addition to economic criteria of urban Poverty Line, non- economic
parameters are also suggested to be applied for identification of urban poor. The
States and UTs have the flexibility to use the parameters of their choice to identify
urban poor for providing assistance under poverty alleviation programmes on priority
basis.
1.31 Keeping in view the need to review and revisit the methodology for
identification of urban poor, the Ministry of Housing and Urban Poverty Alleviation
(HUPA) had requested the Planning Commission to initiate efforts. Accordingly, the
Planning Commission has constituted an Expert Group recently to recommend
suitable methodology for identification of BPL families in urban areas under the
chairmanship of Prof. S.R. Hashim, Ex-Member, Planning Commission vide
notification dated 13th May 2010. The Terms of Reference of the Expert Group are:
(i) To recommend appropriate detailed methodology with simple, transparent
and objectively measurable indicators to identify Below Poverty Line (BPL)
households in Urban Areas for providing assistance under various schemes
targeted at the urban poor.
(ii) To recommend periodicity for the conduct of BPL Survey in Urban Areas or
the mechanisms to review such BPL list;
(iii) To recommend suitable institutional mechanism for the conduct of BPL
survey, survey questionnaire, processing of data, training, validation and
approval of urban BPL list at various levels;
(iv) To recommend suitable institutional mechanism to address grievances of
public on exclusion/ inclusion in the urban BPL list.
(v) Any other suggestions/recommendations to make the exercise of Urban BPL
survey simple, transparent and acceptable.
22
1.32 Initially the Group was given four months period for submitting the
report, which has now been extended and the Group is expected to submit its report
by 12 January, 2011.
(v) Poverty Alleviation Programme – Role of BPL Criteria
1.33 The poverty alleviation programmes so far have been based on two
approaches viz. universal and targeted approach. While under universal
programmes beneficiaries are self selected, targeted programmes are based on
inclusion or targeting of beneficiaries, based on the criteria of Below Poverty Line
(BPL). The concept and method of estimating poverty has come in for criticism in
recent years in the context of (a) economic policy reforms based on targeted policy
interventions; and (b) the findings on economic growth involving a decline in poverty
along with an increase in calorie deprivation.
1.34 The issue of BPL criteria and identification of people below the poverty
line assumes great significance in view of its crucial role in identification of
beneficiaries of targeted poverty alleviation programmes and various welfare
schemes of the Government. The BPL survey is primarily used for PDS. Only two
programmes of Ministry of Rural Development use BPL i.e. Indira Awas Yojana and
Swarnajayanti Gram Swarojgar Yojana. But State Governments use it for various
purposes. Despite all the instructions for automatic inclusion and exclusion there is
vagueness in implementation of criteria giving rise to serious problems of errors in
exclusion and inclusion with corruption playing an important role in wrong
identification of people under the below poverty line.
1.35 In the light of above the Committee decided to examine the subject,
Appraisal of BPL Criteria. They invited suggestions and heard the views of experts in
the field to understand the issues involved. They received memoranda from various
States and Union Territories regarding total number of BPL population and card
holders etc. They also took evidence of the various Ministries which are directly or
indirectly related to address the problem of poverty and implementation of various
welfare schemes for the poor.
23
1.36 Major shortcomings/problems which were highlighted during the
examination of this subject included multiple indicators/criteria used for identification
of poor, divergence of official estimates of poverty ratio with the actual incidence of
poverty, use of different methodologies for estimation and identification of poverty,
restricting the identification of poor in States to the cap fixed by the Planning
Commission, lack of proper implementation of various welfare schemes directed to
poor etc. The Committee have examined these issues in detail in subsequent
sections.
B. BPL identification - Criteria (i) Evolution of BPL Criteria 2.0 The Integrated Rural Development Programme (IRDP) was the first
programme targeted to rural poor and aimed at providing self employment to the
poor through acquisition of productive assets or appropriate scheme which would
generate additional income on a sustained basis to enable them to cross the poverty
line. It was launched in 1980 in all the blocks of the country. Rural families having
annual income below Rs. 4800 were to be assisted under IRDP. But families with
an annual income upto Rs. 3500 were to be assisted first. Thus the focus was
centred on poorest of the poor. However, no census or survey was carried out to
identify poor families. It was found later that a large number of ineligible people got
benefits of this programme. Therefore the issue of devising criteria to identify poor
assumed great significance. With the objective of identifying poor, the Ministry of
Rural Development has conducted three BPL Census in rural areas since 1992. It
also provides technical assistance, in shape of methodology and guidelines, survey
instrument, training etc. to the States and UTs to conduct the BPL Census.
2.1 The BPL survey of 1992 used income criterion to determine poverty.
This survey determined the poor using the family based income level of Rs. 11000
per year. However this criterion could not reflect the true picture of poverty. In the
next BPL census of 1997 consumption criteria was adopted to identify poor. Also
exclusion criteria was used to rule out ineligible families in the first place. This
Census was also criticized for the use of exclusion criteria.
24
2.2 For the BPL census of 2002, the Ministry of Rural Development
adopted a methodology of score- based ranking of household, as suggested by an
Expert Group, headed by Dr. P. L. Sanjeev Reddy. Thirteen socio economic
indicators were used to identify the poor families. These were:
1. Land holding
2. Type of House
3. Availability of Clothing
4. Food Security
5. Sanitation
6. Ownership of consumer durables
7. Literacy status of highest literate
8. Status of Household Labour
9. Means of Livelihood
10. Status of Children
11. Type of indebtedness
12. Reason for migration
13. Preference for Assistance
2.3 For each of these thirteen indicators, the households are awarded
scores in a five-point scale from 0 to 4. The scores are inversely related to the
poverty and deprivation of the household. A low score indicates a higher level of
poverty and deprivation and vice-versa. For each household, the scores from these
13 indicators are summed up to get the aggregate score of the household. The
aggregate score of a household can range from a minimum of zero to a maximum of
52. The households are arranged in ascending order to get BPL List with the State
wise upper limits defined by the poverty ratios released by the Planning
Commission.
2.4 However, using this criterion, errors of inclusion and exclusion far
exceeded the acceptable limits. One of the important feature of the guidelines issued
for BPL census 2002 was to put the ceiling on the number of BPL households to be
identified in conformity with the poverty estimates of Planning Commission. The
State Governments were asked to select the poorest households such that the total
percentage of such families did not cross the limit fixed by Planning Commission.
25
However several States selected more than this limit and many of them objected to
the cap imposed by the Planning Commission.
2.5 During the examination of the Demands for Grants (2010-11), the
Ministry of Planning explained the reasons for divergence in variation in the
estimates of BPL population as brought by the State Governments, Ministry of Rural
Development and the Planning Commission, as under:-
―It may be clarified that Planning Commission is the nodal agency to estimate poverty in the country. The Ministry of Rural Development undertakes an exercise through the States and UTs to identify the BPL families in the rural areas for targeting them under its various programmes which is different from estimation of poverty. For BPL census 2002 conducted by the Ministry of Rural Development, the States were provided enough flexibility to identify the number of BPL households in rural areas. The States were given the option to identify the number of BPL families equal to the poverty estimates of 1999-2000 or the adjusted share worked out by the Planning Commission, whichever is higher. Further, additional 10% was allowed to account for the transient poor‖.
2.6 Apprising the Committee about serious inconsistencies found in
poverty data, as ascertained on the basis of the socio economic indicators and the
reasons for delay in conducting next BPL census, the Secretary, Ministry of Rural
Development, stated following during the evidence held on 31.05.2010:
―Of course, the bigger problem was that there were several analyses and there were a large number of complaints that a part of the BPL population had been missed out. It had later transpired from these reports that for instance 86 per cent of the APL population had the ration cards, which were meant for the BPL. It also transpired from some studies that almost 17 per cent of the richest quintile of the rural population was found not in place in the BPL and they had BPL cards. Some studies are also there to indicate that about 28 per cent of the BPL population is placed in the APL groups. In the meantime, there was a court case, namely, PUCL Vs. the Union of India, and in that court case the final verdict was given in 2006 and that is how the survey which should have been conducted in 2007 got delayed and it is getting conducted now.‖
2.7 The Ministry of Rural Development, on 12th August, 2008, constituted
an Expert Group, which could advise it on the suitable methodology for conducting
the BPL Census for the Eleventh Five Year Plan. The Expert Group submitted its
26
report on 21st August 2009 under chairmanship of Dr. N. C. Saxena. This group
suggested a higher percentage of poverty, as stated below:
―The percentage of rural population that is poor, and is not able to satisfy the minimum required calorie needs, nor is able to consume the minimum cereal required for healthy living, is far greater than the present cut-off line of 28.3%. The Committee would therefore strongly recommend that the percentage of people entitled to BPL status should be drastically revised upwards to at least 50%, though the calorie norm of 2400 would demand this figure to be about 80%.”
2.8 This Group suggested identification of poor families according to the
criteria as listed below:
Automatic exclusion
The households which fulfill any one of the following conditions will not be
surveyed for BPL status:
a) Families who own double the land of the district average of the agricultural
land per agricultural household if partially or wholly irrigated (3 times if
completely un-irrigated).
b) Families who have three or four wheeled motorized vehicles, such as jeeps,
SUVs etc.
c) Families who have at least one mechanized farm equipment, such as
tractor, power tiller, thresher, harvester, etc.
d) Families who have any person who is drawing a salary of over Rs. 10,000
per month in non-government/ private organizations or is employed in
government (including para-statals) on a regular basis with pension or
equivalent benefits.
e) Income tax payers.
Automatic inclusion
The following would be compulsorily included in the BPL list:
a) Designated Primitive Tribal Group
b) Designated most discriminated against SC groups, called ‗Maha Dalit
Groups‘, if so identified by the state
27
c) Single women headed households
d) Households with disabled persons as bread-earner
e) Household headed by a minor
f) Destitute households which are dependent predominantly on alms for
survival
g) Homeless households
Survey of the remaining rural households by scoring
2.9 The survey will rank remaining families according to the scale and
weight-ages given below. The proposed scoring for the ranking on a scale of ten
is as follows:
a) SC/ST: 3 points
b) De-notified Tribes, and Designated ‗Most Backward Castes‘: 2 points;
Muslim/OBC : 1 point
c) Landless agricultural worker: 4 points; agricultural labourer (with some
employed fisher folk (including those employed by others in such
professions): 2 points
d) No adult (above thirty years of age) has studied up to class 5 in the
household: 1 point
e) Any member of the household has TB, leprosy, disability, mental illness or
HIV AIDS : 1 point
f) Household headed by an old person of age 60 and above: 1 point
2.10 An expert, Prof. Indrani Gupta, in her note submitted to the Committee
stated that at present there are two approaches for identification of poor; one
suggested by Shri N.C. Saxena and other suggested by Jean Dreze and Reetika
Khera. The approach of Dreze and khera has been stated as follows:
―It includes among priority groups SC/ST households, landless households with no adult educated beyond class five, households led by single women and households with one adult working as agricultural labour. For the purpose of identifying the poorer among the selected, it
28
suggests binary scoring, which is giving a single mark to each of the five indicators. Anyone with even one score gets a BPL card and two scores get an Antyodaya card. The experts also suggest an option of exclusion based on three other criteria; one, possession of car, refrigerator, colour TV, scooters, and landline phone; second, having piped water, power and flush toilet; and thirdly, ownership of multi-room house or multi-storied house.‖
2.11 It is found that identification of BPL remains the most important
problem in addressing poverty. Speaking on the persistent problem of inclusion and
exclusion error, the Member Secretary, Planning Commission, stated the following
during the course of oral evidence held on 31st May and 29th September, 2010:
―I would like to mention that in April, 2008 when we began the distribution of smart cards for health insurance, we began with BPL although we were not happy about confining it to BPL. The inclusion in the BPL list is as much an expression of power as exclusion is an expression of lack of power. That is a fact on the ground. We would agree with you and the Honorable Committee that certainly the expected results are not there. I also agree that inclusion in the BPL list is the desire of every person in the village because our effort is to direct the spending from both Consolidated Fund of India and the State Consolidated Fund which is actually focused on those who are in the official below poverty line. We do accept the fact and I personally feel that people can slip back and forth into the poverty line. One illness in the family or one disaster can put the family into destitution even though they may have been actually above the poverty line, basically quite stable as a family and they would get nothing because they are not included at the time when the Census is done. So the dynamism of the rural society and people slippages back and forth are not actually part of the way we are doing things.‖ 2.12 While suggesting introduction of ―coupon system‖ for delivery of
subsidized grains through public distribution system, the Economic Survey 2009-10,
states following on the issue of identification of BPL:
―For the full success of this ―coupons system‖ what is needed is an effective method of identifying the poor. This is where the Unique Identification (UID) System, an initiative already launched by the present Government, under the Unique Identification Authority of India (UIDAI) comes into play. Since the UID System will come into effect in 2012 and the roster of individuals registered in it will gradually move towards completion, it is possible to plan on a switch to a coupons system by 2012 and also let it achieve full maturity as the UID
29
registration moves to completion. Since the Unique Identification will not, in itself, have information on people‘s poverty status, these kinds of tailoring of information will need to be added on to the UID System. Further, since households do move in and out of BPL status there has to be provision for updating on information. However, it is not necessary to wait for the entire UID System to be in place to begin the switch to the coupons system. This is because even our current method of rations relies on ration shops having with them lists of BPL customers whom they are meant to serve. So some identification of BPL citizens is already available and this can be used to hand over coupons to these individuals.‖
2.13 In her memorandum submitted by Prof. Gupta, following additional
criteria (in addition to those suggested by N.C. Saxena and Dreze and Khera) have
been suggested for identification of poor:
“Health expenditure: The Expert Group set by the Planning Commission to review the methodology for estimation of poverty under the chairmanship of Prof. Suresh Tendulkar also looked at the links between health and poverty. It will be possible to collect information on the number of illnesses of household members in the last one month, which would certainly indicate to a certain extent the possible economic burden on households from poor health outcomes. Indebtedness: Evidence indicates that households go into debt for a variety of reasons, in addition to illness, like weddings, education etc. NSS Report No. 503 on ―Household Assets Holding, Indebtedness, Current Borrowings and Repayments of Social Groups in India (as on 30.06.2002)‖ based on the All-India Debt and Investment Survey (AIDIS) indicate for example, that about 27 percent of the rural households were indebted while only 18 per cent of the urban households were indebted. The proportion of indebted households or incidence of indebtedness was highest for OBC households in both rural and urban areas, and was 29 per cent for rural and 21 per cent for urban households. For ST households, the incidence was 18 per cent in the rural areas and 12 per cent in the urban areas. For SC households, this was 27 per cent in the rural areas and 19 per cent in the urban areas. Thus, the extent of indebtedness is an important variable that should find its way in the list of indicators for identification. Ownership and type of residence: This is almost always a good indicator of the status of households, and a simple 3-way stratification like kuccha, semi-pukka and pukka would be sufficient.
30
Ratio of total household members to the total working members: While the inclusion criteria of landless household with no adult educated beyond class V is useful, it may not be sufficient if the same household members happen to be engaged in some economically productive occupation or are self-employed. Instead, the criterion could look at the ratio of total household members to the total working members in the household. For example, if the household size is 8 and there are only 2 working members, this ratio would be 4, i.e. 4 members to be supported by each working member. Number of children working: This is an important indicator of the economic status of households. Clearly, this will not be an easy variable to get response on; however, schooling status in conjunction with other probing questions may yield some information. Dependency ratio: (a) the number of children and (b) the number of elderly per earning household member, which would indicate the economic strain on a household. These are also useful indicators because these would in turn determine to a certain extent the additional burden emanating from schooling of children and ill health of children but especially the elderly, the latter due to chronic conditions. In fact the demographic composition of the household along with information on work status is going to remain a key variable for identification of vulnerable households. Asset sale in recent past: Instead of a direct asset question, a more easily answerable question will be on sale of assets in the last one year. Any household that has been forced to sell major assets may very well qualify as vulnerable in conjunction with other variables. Operational methodology The identification of the poor must be based on a multidimensional approach and should include the criteria that can be easily observable: the following criteria are directly or easily observable:
a. Type & ownership of housing b. Education of head of household c. Whether female headed
For the remaining parameters, simple probing would suffice: d. Total household size
i. Number of school going children below age 15 ii. Number of non-working elderly (62 & above)
iii. Others e. Number of employed household members f. Employment status (the exact definition may be subsequently
decided) g. Land holding
31
Whether household has any large debts (a cut off for the amount may be decided)
Whether sold one or more of the following in the last one year: o Land o House o Farm animals o Agricultural implements o Jewellery
Like implied in the two earlier approaches, a matrix of vulnerability can be built up and households ranked accordingly. It is also possible to use different weights for different responses: for example, homeless can take a value of 3, kuccha 2 and semi-pukka 1. The idea is that a higher total indicates a higher vulnerability and, therefore, is an indication of poverty. However, the weighting will have to be done carefully and is a later exercise. Like the previous approaches, there can be a set of exclusion criteria as well, and in conjunction with the inclusion criteria will give a comprehensive picture of those who can be labeled poor, including the very poor, depending on a scoring matrix.‖
2.14 A memorandum submitted to the Committee by an expert in the field,
Dr.Himanshu, highlights the crux of the problem of identifying BPL according to the
existing methodology, and suggests alternative ways available to capture the
genuine BPL, as stated below:
―The methodologies suggested by N C Saxena Committee and Dreze use characteristics which are difficult to verify and need to be clearly defined and are possibly disincentives. For example, agricultural labour, artisan and so on which need to be clearly defined. Also operated land or owned land need to be defined. Even other characteristics such as ownership of durables and incomes are difficult to verify. Some of these durables could also lead to disincentive effects. The methodology for identification of BPL should have following characteristics:
Should be a good proxy of poverty (for example, agricultural labour households, SCST households, households with illiterate head of households and so on)
Should be easily identifiable and measurable and clearly defined (rules out characteristics which can not be measured, such as perceptions on food availability etc.)
32
Should not be a disincentive (rules out indicators such as child labour, availability of toilets etc.)
Should be stable in the medium run if not in the long run (ownership of durables)
It should be verifiable using secondary data such as land, using visual inspection such as housing characteristics, using community institutions such as Gram Sabha or Panchayats‖
2.15 Further the Member Secretary, Planning Commission, while deposing
before the Committee, emphasized the role of local Governments in identification of
poor also, as follows:
―One more thing I would like to submit is about the role of the local Governments. It has not yet been fully internalised. In fact, we find that wherever local Governments have been empowered, even the identification of those who deserve all the help, it is much better. Therefore, there is a connection between these two, that is, empowerment of local Governments – the Panchayats – and also making sure that the municipalities play their constitutionally mandated role for identification of poor. We have done that in Kerala. I think the efforts that are being made by Kutumb Shri in Kerala perhaps act as a model.‖
(ii) Conducting next BPL Census
2.16 The Secretary, Ministry of Rural Development informed that the Report
of the Expert Group by Shri N.C. Saxena had been discussed by a smaller Expert
Group and it was recommended that there should be a pre testing. During the BPL
Census conducted earlier in 1992, 1997 and 2002 no study on the feasibility aspect
of the implementation of criteria was carried out. However, for the forthcoming BPL
Census, the Ministry of Rural Development has decided to conduct a pilot study to
arrive on the methodology. The Ministry of Rural Development propose to address
the problem of errors in inclusion/exclusion of poor in the estimation of below the
poverty line category by conducting a pilot to test the methodology for the
forthcoming BPL Census. Pilot survey followed by Participation Rural Appraisal
(PRA) exercise would help in deciding most suitable parameters/methodology for
capturing poverty and thereby minimizing errors.
2.17 In the pilot survey, the Ministry would take recommendations of Dr.
N.C. Saxena led Expert Group as reference point and various other parameters
suggested by States/UTs and experts to arrive at most suitable methodology. The
33
pilot would be conducted in around 260 villages, selected from list of sample villages
of NSSO for 66th round, of almost all the States. A PRA exercise to corroborate the
results of pilot survey will also be carried out.
2.18 When the Committee pointed out that there was delay in conducting
next BPL Census, the Secretary, Ministry of Rural Development, while tendering
evidence on 31.5.2010, stated as below:
―We will start the BPL census in the year 2011, that is, as soon as the main census 2011 is concluded. One novel feature in this is that we have tied up with the Unique Identity Authority, and we are also having a census together with them so that the exercise is not repeated and every BPL person in the rural area is able to have a UID number straightaway. Another feature in it is that we propose to use the households listed by the census operations, so that we do not have to repeat the exercise. However, there is a debate going on as to what should be the definition of the household that should be taken, namely, whether it should be the census household or whether it should be a further nuclear household. We will be able to conclude it only when we have seen the results of the pre-testing. This is in summary the measures that we have taken, and we are open to guidance from this hon. Committee.‖ 2.19 The Chief Economic Adviser, Department of Rural Development,
informed the Committee further about the initiative taken to start the process of BPL
census for the Eleventh five year plan during the evidence held on 29 September,
2010:
―The BPL pilot survey is at a very advanced stage right now. It has already been completed in most of the States. We hope that by the end of next week or so, most of the States would have completed the survey. There is a different methodology now. It is called the Rural People‘s Participation Appraisal. So, that is the alternative method which has evolved very recently, particularly for doing this kind of a survey. That is very useful. So, we want to corroborate whatever the findings are there on the basis of the survey by this methodology.‖ 2.20 In response to a query of the Committee that whether the identified
number of families after BPL census could be at variance with that of the estimate
given by Tendulkar Committee, a representative of the Department of Rural
Development, stated following, during the course of oral evidence:
34
―You are absolutely right that this 37.2 per cent is somewhat applicable and not applicable, but the Ministry of Rural Development is saying that because Tendulkar was requested to suggest the methodology based on the consumption pattern and they have come up with the figure of 37.2 per cent for 2004-05. Right now, the Ministry of Rural Development is trying to do for 2010. You are absolutely right that the figure that they would come up with after the pilot survey could be different.‖ (iii) Proposed Food Security Act 2.21 Asked about the status of proposed Food Security Act and target
group, the Planning Commission, in their written submission, informed as under:
―The issue of proposed legislation on Food Security has been referred to the Empowered Group of Ministers (EgoM) which has discussed it during its meetings. The National Advisory Council (NAC) is also examining the matter and final view will emerge after the consultation process is completed. The decision on the magnitude of population to be covered under the proposed legislation has been one of the issues discussed by the EgoM. There may be different approaches such as adopting a targeted approach, or universalizing the food security keeping in view the impact of food subsidy, availability of food grains stocks and efficient public distribution system etc. For identification of targeted beneficiaries under the proposed legislation, the Ministry of Rural Development is working on finalizing the methodology for identification of BPL households for the rural areas and the Planning Commission has constituted an Expert Group under the chairmanship of Prof S.R. Hashim for the urban areas. The Ministry of Consumer Affairs, Food and Public Distribution has already circulated a concept note on the proposed legislation and also held consultations with the State governments.‖ 2.22 When the Committee invited attention of the Planning Commission to
the possible fallout of bringing Food Security Act based on a faulty criteria of
identification, the Ministry, in their post evidence replies shifted the responsibility to
the Department of Food and Public Distribution, stated as below:
―The food security law is not yet finalized. As and when it is firmed up, the Government in the Department of Food and Public Distribution are expected to address the issues of errors of inclusion and exclusion, to avoid anomalies.‖
35
C. Divergence between estimated and identified population Below
Poverty Line (BPL)
(i) Estimation of BPL
3.0 The Planning Commission‘s estimates of the poverty line are based on
monthly per capita consumption expenditure as the criterion, to determine the
persons living below the poverty line (BPL). The Commission has been following the
methodology suggested by the Expert Group on ‗Estimation of Number and
Proportion of Poor‘ (known as Lakdawala Committee Report) since 1997 and
worked out poverty estimates for the years 1973-74, 1977-78, 1983, 1987-88, 1993-
94, 2004-05.
3.1 The poverty ratio at the national level for the year 1993-94 and 2004-
05 are as given below:
Percentage and Number of Poor
Poverty Ratio (%) Number of Poor (million)
Year Rural Urban Total Rural Urban Total
1973-74 56.4 49.0 54.9 261.3 60.0 321.3
1977-78 53.1 45.2 51.3 264.3 64.6 328.9
1983 45.7 40.8 44.5 252.0 70.9 322.9
1987-88 39.1 38.2 38.9 231.9 75.2 307.1
1993-94 37.3 32.4 36.0 244.0 76.3 320.3
2004-05 28.3 25.7 27.5 220.9 80.8 301.7
(ii) Other Estimates of Poverty
3.2 Various agencies/ Committees have also indicated different estimates
of poverty based on different assumptions, perceptions and context. The National
Commission for Enterprises in the Unorganised Sector (NCEUS) referred to as Arjun
Sengupta Committee brought out a report on Conditions of Work and Promotion of
Livelihoods in the Unorganised Sector. In this report, it was brought out that 77% of
the population was with a per capita daily consumption of upto Rs 20 in 2004-05.
This section of the people was called poor and vulnerable. However, the Economic
36
Survey 2008-09, brought out that based on the calculations on data on household
consumption expenditure for 2004-05 (NSS 61st round-2004-05), the population with
less than Rs 20 per day per capita consumption expenditure was 60.5% only. In any
case, the above observation in the report of National Commission for Enterprises in
the Unorganised Sector (NCEUS) is based on the criterion which is different from
the poverty line adopted by the Planning Commission. The Saxena Committee
which was constituted to recommend a suitable methodology for identification of
rural poor suggested assuming poverty ratio at national level as 50% merely relying
on the criteria of calorie intake. There has been a consistent decrease in the calorie
intake among all the sections of the society over the years. Therefore, merely relying
on the criteria of calorie intake for defining a poverty line is a debatable issue. The
World Bank poverty estimates of 41.6% are based on the world poverty line of $
1.25 per capita per day income at 2005 prices. The Tendulkar Committee which was
constituted by the Planning Commission to look into all these issues has
recommended to adopt a new Poverty Line Basket (PLB) and thus, redefined the
poverty line which gives the poverty ratio of 37.2% in 2004-05.
3.3 Commenting on the different estimates of poverty ratio suggested by
the Expert Group headed by Prof. Tendulkar, the Economic Survey, 2009-10 states
as below:
―It is, however, worth clarifying that the higher poverty estimates that Tendulkar reports, compared to existing estimates of the Planning Commission based on NSS data, do not reflect an increase in poverty, but merely a changed definition of what constitutes poverty. As calculations in a later chapter show, if we use the Tendulkar method to calculate poverty in earlier years those rates go up as well compared to standard estimates based on NSS data. Nevertheless, whether we take India‘s poverty rate to be 37.2 per cent or 27.5 per cent (as is implied by the 61st round of NSS data of 2004-05), it is easy to argue that it is too high for a nation growing as rapidly as India, and that special initiatives are needed to combat it.‖
3.4 Queried as to how different measurements of poverty were arrived at
by different institutions and reasons for lack of uniformity in estimates, the Ministry of
Planning, in their written reply, submitted as under:
37
―Planning Commission is the nodal agency in the Government of India to release the Official Poverty Estimates. A time series estimates of poverty since 1973-74 have been released by the Planning Commission. The other agencies/Committees have indicated different numbers based on different assumptions, perceptions and context. Till now the official estimates released by Planning Commission have been based on the methodology recommended by the Expert Group (Lakdawala Committee). Now the Tendulkar Committee has given its recommendations and once a decision is taken, there will be a uniform methodology for estimation of poverty and there are no contradictions.‖
(iii) BPL population identified by the State Governments vis-à-vis
estimates of the Planning Commission
3.5 State Governments and Union Territories, who have furnished the
details of the total number of BPL population identified in the States/Union
Territories, in the last BPL census of 2002, vis-à-vis the Planning Commission
estimates, as shown in the table given below:
States
Total BPL population in the State as on 1.3.2000 based on 1993-94 poverty estimates of Planning Commission and population estimates of Registrar General of India as on 1.3.2000 (in lakh)
Total BPL population identified in the State in the BPL suryey conducted in the year 2002 (in lakh)
Jammu and Kashmir 7.36 37.78
Himachal Pradesh 5.14 23.54
Karnataka 31.29 98.41
Rajasthan 17.36 21.21
Madhya Pradesh 41.25 68.89*
Arunachal Pradesh 0.99 40.08
Bihar 65.23 113.41$
Kerala 10.25 20.50
Chattisgarh 18.75 34.50
Bihar 66.32 125.55
*The figures pertain to BPL survey carried out by State in 2001.
$ As furnished by the Ministry of Rural Development.
38
3.6 The above table shows wide divergence in the total number of BPL
population from the estimates of Planning Commission. In reply to a query of the
Committee on reasons for divergence of estimates of Planning Commission and
those of State Governments, the Ministry of Planning, in their post evidence written
submission, stated as under:
―While the estimation of poverty is done by the Planning Commission based on the poverty line defined by the Expert Group (Lakdawala Committee), the Ministry of Rural Development identifies the BPL households in the rural areas through the state governments and UT administrations. The last BPL census to identify the rural BPL households was conducted in 2002 and it is reported that the states and UTs have identified 5.51 crore households as BPL in the rural areas. The estimation of poverty and identification of BPL households are two separate exercises‖.
3.7 The Planning Commission uses the poverty ratio of Assam for
estimating poverty in Sikkim, Arunachal Pradesh, Meghalaya, Mizoram, Manipur,
Nagaland and Tripura. Poverty line of Maharashtra and expenditure distribution of
Goa is used to estimate poverty ratio of Goa. Poverty ratio of Tamil Nadu is used for
Pondicherry and Andaman and Nicobar island. Urban Poverty ratio of Punjab has
been used for both rural and urban poverty of Chandigarh. Poverty line of
Maharashtra and expenditure distribution of Dadra and Nagar Haveli is used to
estimate poverty ratio of Dadra and Nagar Haveli. Poverty ratio of Goa is used for
Daman and Diu. Poverty ratio of Kerala is used for Lakshadweep. Annexure –I
shows the poverty ratio of various States estimated by the Planning Commission in
2004-05.
3.8 When the Committee pointed out the variation in estimates of poverty
in North Eastern States and desired to know the reasons for estimation done on the
basis of sample data of Assam, the Member Secretary, Planning Commission,
deposed before the Committee as follows:
―I will come to the point about Tripura and about other North Eastern States depending on the data from Assam. The point about the inadequacy and veracity or the correctness of statistics in our country continues to be a tremendous problem. Sir, as regards the North Eastern States, I have actually checked up with my officers. They have to rely on Assam data because either the data is not available or the sample size of the NSSO is so small as to
39
be virtually unusable. It is not statistically significant, and it is here I want to start at the last issue about the applicability of Assam data to eight States. Sir, in fact to any reasonable person‘s mind, this is not the really correct thing to do.‖ 3.9 While questioning the authenticity of poverty estimates of Planning
Commission in some of the States, Expert Group headed by Shri N.C. Saxena have
also made following observation:
―Planning Commission‘s poverty estimates for Assam, Andhra Pradesh and J&K seem to be lower than what their figures are on other related indicators, such as malnutrition, Body Mass Index (BMI) and per capita Net State Domestic Product (NSDP), whereas poverty estimates for Uttarakhand seem to be on the higher side. For instance, per capita NSDP for Uttarakhand in 2004-05 was Rs. 23,069, which was higher than for West Bengal at Rs. 22,675. As incomes are better distributed in Uttarakhand than in West Bengal, it is difficult to believe that poverty there would be higher by eleven percentage points.‖
3.10 Asked to comment on the above, the Ministry of Planning, in their
written submission before the Committee, stated as under:
―It may be pointed out that the poverty line approach has its limitations. Even the report of the Expert Group (Lakdawala) accepts it and acknowledged that the poverty line is not a true indicator of malnourishment which it might be mistaken for. It also acknowledges that the poverty line may not capture important aspects of poverty such as ill health, low educational attainments, geographical isolation, powerlessness in civil society, caste or gender based disadvantages and so on. Furthermore, the per capita NSDP may not truly represent the incidence of poverty in a state.‖
3.11 In a memorandum, submitted by Dr. Himanshu, the problem of
divergence in poverty estimates has been explained as under:
―Large number of secondary data analysis suggests huge errors of inclusion (wrong beneficiaries included) and errors of exclusion (genuine beneficiaries excluded) in the BPL population ascertained as per the existing methodology. The discrepancy is because poverty estimates of Planning Commission are used by converting into households. Due to conversion of percentage of population to percentage of households, loss of households occur. The difference is largely because of the
40
interpretation of household which is different in the case of secondary data but is different for operational purposes. Cross check with secondary data (National Sample Survey/National Family Health Survey/District Level Household and Facility Survey) suggest that majority of exclusion/inclusion errors are attributable to implementation problems and not so much because of design problems. However there are some design problems which need to be improved.‖ 3.12 When asked whether economic census will be more effective in better
projection of poverty in the Country, the Ministry, in their written submission, stated
as under:
―Poverty is generally considered a multi dimensional problem as the poor suffer from a variety of deprivations. However, consumption expenditure is considered a better indicator to capture poverty as compared to income or other criteria primarily because consumption expenditure data reflects accurately people‘s level of living whereas income data are more concerned with people‘s potential level of living. Moreover, the expenditure data are considered more reliable than income data.‖
41
D. Implementation of Welfare Schemes for the Poor
4.0 At present 139 Centrally Sponsored Schemes (CSS) with a total outlay
of Rs. 157051.40 crore are being operated, out of which three schemes are being
operated by the Ministry of Rural Development for directly benefiting the BPL in rural
areas. The Ministry of Housing and Urban Poverty Alleviation administers one
scheme, namely Swarna Jayanti Shahari Rozgar Yojana (SJSRY) for improving the
condition of urban BPL. The performance of these programmes since 2007-08 is as
given below:
PERFORMANCE OF MAJOR PROGRAMMES
(Rs. in Crores)
Swaranjayanti Gram Swarozgar Yojana (SGSY) – Ministry of Rural Development
Indira Awaas Yojana (IAY) – Ministry of Rural Development
National Social Assistance Programme (NSAP) – Ministry of Rural Development
Swarna Jayanti Shahari Rozgar Yojana (SJSRY) – Ministry of Housing and Urban Poverty Alleviation
Eleven Plan Project
(06-07) 15740.53 23767.92 15691.00 1547.26
(Current 17803.00 26882.21 17746.98 1750.00
2007-08
BE 1800.00 4040.00 2407.00 344.00
Actuals 3882.00 2851.37* 341.00
2008-09
BE 2150.00 5400.00 3500.00 515.00
Actuals 8348.34 4442.24* 545.00
2009-10
BE 2350.00 8800.00 5200.00 515.00
Actuals 2350.00 8800.00 5109.24 428.69
2010-11
BE 2985.00 10000.00 5762.00 564.60
* For Andaman only
42
(i) Welfare Schemes for Rural Poor
4.1 The Ministry of Rural Development implements three programme for
the benefit of BPL Households. These are Swaranjayanti Gram Swarozgar Yojana
(SGSY) which is a self employment programme, Indira Awaas Yojana (IAY)
providing assistance to BPL households for housing and National Social Assistance
Programme (NSAP).
Swaranjayanti Gram Swarozgar Yojana (SGSY)
4.2 The Swarnjayanti Gram Swarojgar Yojana (SGSY) is a major self
employment scheme launched in April, 1999 after restructuring and combining the
IRDP with allied programmes i.e. TRYSEM, DWCRA, SITRA, GKY, MWS. It was
designed as a holistic self employment scheme aimed at providing sustainable
income to rural BPL families through income generating assets / economic activities
so as to bring them out of the poverty line. It is a process oriented scheme involving
processes like organization of the rural poor (BPL) into Self-Help Groups (SHGs)
through social mobilization, capacity building & training, provision of revolving fund,
making available credit and subsidy, technology, infrastructure & marketing. Each
process has a bearing on the successive process.
4.3 SGSY aims at bringing the assisted poor families (swarozgaries)
above poverty line by providing them income generating – assets through a mix of
bank credit and government subsidy. Subsidy under the SGSY is given at the
uniform rate of 30% of the project cost, subject to a maximum of Rs.7500. In
respect of SC/STs and disabled however, these will be 50% and Rs.10,000/
respectively. For Groups of Swarozgaris (SHGs), the subsidy would be at 50% of
the cost of the scheme or per capita subsidy of Rs.10,000/- or Rs.1.25 lakh,
whichever is less. There will be no monetary limit on subsidy for irrigation projects.
Subsidy is back ended. The SGSY seeks to promote multiple credits rather than a
one – time credit injection. 15% outlay under SGSY is set apart for Special Projects
to field test and validate alternative strategies for livelihood opportunities and
enhancement of livelihood support for rural poor. Each Special Project is expected to
be executed in a time-bound manner for bringing a specific number of BPL families
above the poverty line through a projectised approach with the funding requirement
43
to be shared between centre and state, except for north eastern states, in the ratio of
75:25. The ratio of sharing of funds between Centre and north eastern states
including Sikkim is 90:10.
New initiatives proposed and future plans for strengthening of SGSY:
4.4 SGSY is being restructured as National Rural Livelihoods Mission
(NRLM) to implement it in a mission mode for targeted and time bound delivery of
results. NRLM recognizes that the poor people have the potential to come out of
poverty with proper landholding, training and capacity building and credit linkage.
NRLM also recognizes that poor people have multiple livelihoods – wage
employment and self employment. It will stabilize and enhance incomes from both
the livelihoods. It will also promote diversification of livelihoods. NRLM will have
special focus on the poorest households, who are currently dependant on
MSNREGA. The main features of NRLM are as follows:
Universal social mobilisation through formation of SHGs under NRLM. To
bring each and every BPL household under the SHG network.
To take the social mobilization process to the next stage of maturity SHG
federations will be set up at the levels of villages, cluster of villages, blocks &
districts.
The goal of universal financial inclusion will be furthered by enabling SHGs to
be linked to banks and to access credit from them.
Under NRLM it is proposed that upto Rs. 7500 per beneficiary would be
provided for capacity building & training in place of the present provision of
Rs. 5000 per beneficiary.
In order to ensure institutional arrangement for skill development for self
employment and wage employment, dedicated training institute for rural BPL
youth i.e Rural Self Employment Training Institutes (RSETIs) are being set up
with the aim of having at least one such institution in each district of the
country.
Under NRLM, interest subsidy will be provided to SHGs for prompt repayment
of loans to banks. The difference between 7% and Prime Lending Rates
44
(PLR), will be provided to the poor households for every loan accessed from
the banks, up to a limit of Rs 1 lakh per household.
It is proposed to provide flexibility to the States for formulating their own
poverty alleviation plans on the basis of available resources and skills.
It is now proposed to make special projects as a subset of NRLM and
earmarking 20% of allocation for special projects.
Presently evaluation of SGSY is done by commissioning studies through
NIRD and other reputed organizations and the programme is monitored
through online Monthly Progress Report, regular meetings of the Performance
Review Committee, visit by Area Officers and the mechanism of DLMs
(District Level Monitors), NLMs (National Level Monitors) etc. In addition to
these, NRLM will put in place a (i) a comprehensive MIS encompassing
database of SHG profiles, federations, training institutions and activities,
placements of trained beneficiaries, marketing of products etc., (ii), concurrent
and mid-term evaluations, (iii) social accountability practices like social audits
etc. to facilitate monitoring & bring in transparency in program
implementation.
A mission approach will enable time bound achievement of the goals of
N.R.L.M.
NRLM will have partnerships with:
a) Civil Society Organizations
b) Industries
c) Educational Institutions
d) Other resource organizations.
Indira Awaas Yojana (IAY)
4.5 With a view to meeting the housing needs of the rural poor, Indira
Awaas Yojana (IAY) was launched in May 1985 as a sub-scheme of Jawahar
Rozgar Yojana. It is being implemented as an independent scheme since 1 January
1996. The Indira Awaas Yojana aims at helping rural people below the poverty-line
belonging to SCs/STs, freed bonded laboureres and non-SC/ST categories in
45
construction of dwelling units and up gradation of existing unserviceable kutch
houses by providing grant-in-aid.
Under IAY, a rural Below Poverty Line(BPL) family is given grant of Rs. 45000/-
in plain areas and Rs.48,500/- in hilly/difficult areas for construction of a house.
IAY houses have also been included under the Differential Rate of Interest (DRI)
scheme for lending by Nationalized Banks upto Rs.20,000/- per unit at an
interest rate of 4% in addition to financial assistance provided under IAY.
The criteria for allocation of IAY funds to the States & UTs involves assigning
75% weightage to housing shortage and 25% to poverty ratio. The allocation
amongst districts is based on 75% weightage to housing shortage and 25%
weightage to SC/ST component.
In order to introduce transparency in selection of beneficiaries permanent IAY
waitlists have to be prepared gram panchayat wise by the States/UTs. These
lists contain the name of deserving BPL families who need IAY houses in order
of their poverty status based on the BPL list 2002.
Necessary instructions have been issued to all the DRDAs regarding
Convergence of various Centrally Sponsored Schemes (CSS) with IAY. IAY
beneficiaries can get the benefits available under Rajiv Gandhi Grameen
Vidyutikaran Yojana (RGGVY), Total Sanitation Campaign (TSC), Janshree and
Aam Aadmi Bima Yojana and Differential Rate of Interest (DRI) Scheme etc.
Homestead Site Scheme:
4.6 As per Ministry‘s estimates, there are 7.7. million rural BPL households
who do not have a house site in the country. For the poorest of the poor who are
landless and do not have house-sites, the Government has approved a scheme as
part of IAY for providing homestead sites to those rural BPL households whose
names are included in the Permanent IAY Waitlists but do not have a house site.
Rs.10,000/- per homestead site is being provided under the Scheme and the funding
of which is shared by the Centre and the States in the ratio of 50:50. Funds
amounting to Rs. 157.47 crores have since been released to five States namely,
Kerala, Karnataka, Rajasthan , Sikkim, and Bihar. As an incentive, Rs. 43.51 crore
46
have been released to the Govt. of Gujarat for construction of additional 33154
houses under IAY.
National Social Assistance Programme (NSAP)
4.7 National Social Assistance Programme (NSAP) was introduced in
1995 as a Centrally Sponsored Programme but was subsequently transferred to
State Plan w.e.f. 2002-03. NSAP aims at ensuring minimum national standards in
addition to the benefits that the States are providing or would provide in future.
4.8 At present, NSAP consists of five schemes namely Indira Gandhi
National Old Age Pension Scheme (IGNOAPS), Indira Gandhi National Widow
Pension Scheme (IGNWPS), Indira Gandhi National Disability Pension Scheme
(IGNDPS), National Family Benefit Scheme (NFBS) and Annapurna.
4.9 The funds for NSAP are allocated by Planning Commission and are
released as Additional Central Assistance (ACA) by the Ministry of Finance in a
combined manner for all the five schemes under NSAP together, on the
recommendation of the Ministry of Rural Development.
Indira Gandhi National Old Age Pension Scheme (IGNOAPS)
4.10 Pension under IGNOAPS is provided to a person of 65 years or higher
and belonging to a household living below the poverty line according to the criteria
prescribed by the Government of India. The number of beneficiaries covered at
present are 163 lakhs. Central Assistance of Rs.200 per month per beneficiary is
being provided and States have been requested to contribute another Rs.200 from
their own resources so that a destitute pensioner could get at least Rs.400 per
month. Presently 18 States are contributing on their own Rs.200 or more per person
per month, 11 States are contributing less than Rs.200.
Introduction of IGNWPS and IGNDPS
4.11 NSAP was expanded in February 2009 by addition of two new pension
schemes for BPL Widows (40-64 yrs) and persons with severe or multiple disability
(18-64 yrs). 45 lakh beneficiaries are estimated to be covered under IGNWPS and
15 lakh beneficiaries are estimated to be covered under IGNDPS. States have
reported coverage of 31 lakh under IGNWPS and 7 lakh beneficiaries under
IGNDPS till date.
47
National Family Benefit Scheme (NFBS)
4.12 Under NBFS a grant of Rs. 10,000 in case of death of ―Primary
breadwinner‖ is provided to the bereaved household. The primary breadwinner as
specified in the scheme, whether male or female, had to be a member of the
household whose earning contributed substantially to the total household income.
The death of such a primary breadwinner occurring whilst he or she was in the age
group of 18 to 64 years i.e., more than 18 years of age and less than 65 years of
age, made the family eligible to receive grants under the scheme.
Annapurna Scheme
4.13 Annapurna Scheme was introduced in April 2000 for persons not
covered under Old Age Pension Scheme. Under Annapurna Scheme 10 Kg. of food
grains per month is provided free of cost. The total number of Annapurna
beneficiaries was estimated as 20% of the persons eligible to receive old age
pension under the then National Old Age Pension Scheme ( NOAPS).
(ii) Welfare Scheme for Urban poor
Swarna Jayanti Shahari Rozgar Yojana (SJSRY)
4.14 The Ministry of Housing & Urban Poverty Alleviation is implementing
an employment oriented urban poverty alleviation centrally sponsored scheme
named Swarna Jayanti Shahari Rozgar Yojana (SJSRY) since 1.12.1997. The
scheme aims to provide gainful employment to the urban poor by assisting them to
set up individual/group enterprises as well as utilising their labour for the
construction of socially useful public assets. The scheme has been comprehensively
revamped by the Government, with effect from 1st April 2009. The revamped SJSRY
(ii). Urban Women Self-help Programme (UWSP) - targets urban poor
women self-help groups for setting up of group-enterprises and
48
providing them assistance through a revolving fund for thrift & credit
activities.
(iii). Skill Training for Employment Promotion amongst Urban Poor (STEP-
UP)-targets urban poor for imparting quality training so as to enhance
their employability for self-employment or better salaried employment.
(iv). Urban Wage Employment Programme (UWEP)- seeks to assist
urban poor living in towns having population less than 5 lakhs as per
1991 census, by utilizing their labour for the construction of socially
and economically useful public assets.
(v). Urban Community Development Network (UCDN) - seeks to assist
the urban poor in organizing themselves in self- managed community
structures so as to gain collective strength to address the poverty
related issues facing them and to participate in the effective
implementation of urban poverty alleviation programmes.
(iii) Public Distribution System (PDS)
4.15 As stated earlier BPL surveys are primarily used for public Distribution
System. PDS evolved as a major instrument of the Government‘s economic policy
for ensuring availability of foodgrains to the public at affordable prices as well as for
enhancing the food security for the poor. It is an important constituent of the strategy
for poverty eradication and is intended to serve as a safety net for the poor whose
number is more than 330 million and are nutritionally at risk. PDS with a network of
about 4.99 lakh Fair Price Shops (FPS) is perhaps the largest distribution network of
its type in the world. PDS, with its focus on distribution of food grains in urban
scarcity areas, had emanated from the critical food shortages of 1960. PDS had
substantially contributed to the containment of rise in food grains prices and ensured
access of food to urban consumers. As the national agricultural production had
grown in the aftermath of Green Revolution, the outreach of PDS was extended to
tribal blocks and areas of high incidence of poverty in the 1970s and 1980s.
4.16 PDS is operated under the joint responsibility of the Central and the
State Governments. The Central Government has taken the responsibility for
49
procurement, storage, transportation and bulk allocation of foodgrains, etc. The
responsibility for distributing the same to the consumers through the network of Fair
Price Shops (FPSs) rests with the State Governments. The operational
responsibilities including allocation within the State, identification of families below
poverty line, issue of ration cards, supervision and monitoring the functioning of
FPSs rest with the State Governments.
4.17 Under the PDS, presently the commodities namely wheat, rice, sugar
and kerosene, are being allocated to the States/UTs for distribution. Some
States/UTs also distribute additional items of mass consumption through the PDS
outlets such as cloth, exercise books, pulses, salt and tea, etc.
4.18 PDS, till 1992, was a general entitlement scheme for all consumers
without any specific target. Revamped Public Distribution System (RPDS) was
launched in June 1992 in 1775 blocks throughout the country. The Targeted Public
Distribution System (TPDS) was introduced with effect from June 1997.
4.18 The scheme, when introduced, was intended to benefit about 6 crore
poor families for whom a quantity of about 72 lakh tonnes of food grains was
earmarked annually. The identification of the poor under the scheme is done by the
States as per State-wise poverty estimates of the Planning Commission for 1993-
94 based on the methodology of the ―Expert Group on estimation of proportion and
number of poor‖ chaired by Late Prof Lakdawala. The allocation of food grains to the
States/UTs was made on the basis of average consumption in the past i.e. average
annual off-take of food grains under the PDS during the past ten years at the time of
introduction of TPDS.
4.20 The quantum of food grains in excess of the requirement of BPL
families was provided to the State as ‗transitory allocation‘ for which a quantum of
103 lakh tonnes of food grains was earmarked annually. Over and above the TPDS
allocation, additional allocation to States was also given. The transitory allocation
was intended for continuation of benefit of subsidized food grains to the population
Above the Poverty Line (APL) as any sudden withdrawal of benefits existing under
50
PDS from them was not considered desirable. The transitory allocation was issued
at prices, which were subsidized but were higher than the prices for the BPL quota
of food grains.
4.21 While discussing the main challenges of poverty, Economic Survey,
2009-10 has offered good exposition of the problems in Public Distribution System
and also suggested ways to tackle them so as to better target the subsidies, as
given below:
―Through a vast network of public distribution system (PDS) outlets across the nation, we try to deliver some minimal supplies of heavily subsidized grain to our below poverty line (BPL) households and also some to our above poverty line (APL) households. The PDS stores are first given this subsidized grain and then instructed to deliver it at below market price to these specified households. It is believed many of these storekeepers (i) sell off this subsidized grain on the open market, and (ii) then adulterate the remaining grain and sell the diluted product to the BPL and APL households, who have no choice in the matter. We may harangue about the dishonesty of PDS store-keepers and all those entrusted with delivering the subsidies. It is indeed true that personal integrity, honesty and trustworthiness in the citizenry are vital ingredients for a nation‘s economic progress—there is enough cross country evidence of this. But when crafting policy, there is need to be realistic about the system within which we work. To assume that all those entrusted with the task of administering the programme will do so flawlessly and then to blame them when the system fails, is not the mark of a good policy strategist. For effective policy, what is needed is to take people to be the way they are and then craft incentive-compatible interventions. This paragraph outlines an altered system that, once in place, will be no more costly to run than the existing one and is likely to be much more effective. The plan suggested here is not novel and has been suggested on occasion by Indian policymakers and even in Budget documents. However, it has never been fully spelled out. The two planks of this system are (i) the subsidy should be handed over directly to the households, instead of giving it to the PDS store-keeper in the form of cheap grain and then have him deliver it to the needy households and (ii) the household should be given the freedom to choose which store it buys the food from. Suppose the BPL household gets a net subsidy of Rs x for wheat each month. Instead of giving this by charging the household less than the market price for wheat, it should be given coupons worth Rs x, which can be used at PDS stores in lieu of money when buying wheat. Under this new system no grain will be given at a subsidized rate to the PDS stores and they will be free to charge the market price when selling grain irrespective of who the customer is. The only change is that the PDS stores are now allowed to accept these coupons which they can then take to the local bank and change to money, and the banks, in turn, can go to
51
the government and have them changed to money. Further, households that get these coupons should be allowed to go to any PDS store of their choice.‖
(iv) Antyodaya Anna Yojana (AAY)
4.22 In order to make Targeted Public Distribution System (TPDS) more
focused and targeted towards this category of population, the ―Antyodaya Anna
Yojana‖ (AAY) was launched in December, 2000 for one crore poorest of the poor
families. AAY contemplates identification of one crore poorest of the poor families
from amongst the BPL families covered under TPDS within the States and providing
them foodgrains at a highly subsidized rate of Rs.2/ per kg. for wheat and Rs. 3/ per
kg for rice. The States/UTs are required to bear the distribution cost, including
margin to dealers and retailers as well as the transportation cost. Thus the entire
food subsidy is being passed on to the consumers under the scheme.
4.23 The scale of issue that was initially 25 kg per family per month has
been increased to 35 kg per family per month with effect from 1st April, 2002. The
AAY Scheme has been expanded in 2003-2004 by adding another 50 lakh
households from amongst the BPL families. The Antyodaya Anna Yojana (AAY) has
further been expanded with effect from 1st August, 2004 by another 50 lakh BPL
families by including, inter-alia, all households at the risk of hunger.
Identification Of Antyodaya Families And Allocation of Foodgrains:
4.24 The identification of the Antyodaya families and issuing of distinctive
Ration Cards to these families is the responsibility of the concerned State
Governments. Detailed guidelines were issued to the States/UTs for identification of
the Antyodaya families under the AAY and additional Antyodaya families under the
doctors and 2184 AYUSH paramedics were appointed. Further, out of 1,45,894 Sub-
centres functioning across the country, 1,38,119 are having at least one ANM.
40,730 sub-centres are having second ANM also. 8341 Primary health Centres are
functioning 24 X 7 basis as on 30th June 2010 as against 1263 Primary health
Centres at the initial year of the NRHM (2005).
4.27 The CAG report had examined the implementation of NRHM during the
period from 2005-06 to 2007-08. CAG looked into the various aspects of the
programme viz. planning, implementation, monitoring and evaluation procedures
from village level to Centre level, community participation in planning, convergence
with other departments, health spending, capacity building and strengthening of
physical and human infrastructure, procurement and supply of equipments, drugs
and services, health awareness issues through Information, Education and
Communication (IEC) activities and performance indicators for reproductive and
child healthcare and disease control programmes. Besides recommendations to
overcome the shortcomings in implementing NRHM, CAG Report had also brought
out some positive findings in terms of completion of district as well as block level
computerization of health facilities in 13 States/UTs, Rogi Kalyan Samitis formed at
every health centre in 10 States, constitution of Village Health and Sanitation
Committees in all villages of 5 states, the increased patient in flow at PHCs and
CHCs and improved institutional deliveries and immunisation efforts.
(vi) Mahatma Gandhi National Rural Employment Guarantee Act
(MGNREGA)
4.28 Mahatma Gandhi National Rural Employment Guarantee Act
(MGNREGA) is meant for the enhancement of livelihood security of the households
in rural areas of the country by providing at least one hundred days of guaranteed
54
wage employment in every financial year to every rural household whose adult
members volunteer to do unskilled manual work. The vision of MGNREGA is that no
vulnerable household in rural India goes hungry due to lack of income earning
opportunities. One of the basic entitlements under MGNREGA is employment within
15 days of application by anyone who demands employment (at any time of the
year), failing which s/he is eligible for an unemployment allowance. Therefore, under
the extant provisions of the Act, Planning Commission cannot put the condition to
the State Governments to implement MGNREGA during non agricultural season.
However, Section 27(1) of the Act provides that the Central Government may give
such directions as it may consider necessary to the State Governments for effective
implementation of the provisions of the Act.
(vii) Monitoring of Welfare Schemes
4.29 Asked, as to whether any survey/study/evaluation of the welfare
schemes have been done to assess their impact, the Ministry of Planning, in their
written replies, stated as under:
―During the course of the implementation of the scheme of Swarna Jayanti Shahari Rozgar Yojana (SJSRY), an independent evaluation of the scheme in 9 representative States/UTs was carried out in 2006-2007, by an independent agency named M/s Access Development Services Limited, New Delhi. Based on the outcome of the evaluation study as well as suggestions received from the States/UTs and other stakeholders, the scheme of SJSRY was comprehensively revised with effect from 2009-2010.
The study by M/s Access Development Services Ltd. did not address the issue of how many BPL were upgraded to APL. It focused on the scheme parameters and problems faced in the implementation of the scheme. However, the following conclusions of the evaluation study are worth noting:
(i). In order to have better impact of the programme, a ―Mission Mode‖ should be followed for SJSRY rather than a centrally sponsored scheme.
(ii). More stringent beneficiary identification system for optimum allocation of resources under the scheme.
(iii). Capacity building of local governmental bodies is recommended for processes like monitoring and reporting of the scheme.
(iv). Focus should be on self-employment component of the scheme.
Similarly, the Ministry of Rural Development (MoRD) also conducts evaluation studies of all the rural development programmes periodically through independent Research Organizations located in various parts of
55
the country. As per the MoRD, a view to assess the Impact of Swarnjayanti Gram Swarojgar Yojana (SGSY) on rural poor, Concurrent Evaluation was conducted during 2001-02. One of the findings of the study indicated that among the total Swarojgaris (individuals and Groups) who reported income generated from their SGSY activities, at the National Level 37.24 % of individual Swarojgaris and 15.09 % members of the Self Help Groups (SHGs) crossed the poverty line through the assistance provided to them in the form of subsidy and institutional credit.‖
4.30 On the issue of effective implementation of the Schemes to enable
their benefits reach the poor, the Ministry of Planning, in their post evidence written
submission, informed the Committee as under:
―The Planning Commission and also the Ministry of Panchayati Raj has been emphasizing the need to empower the local bodies for effective implementation of schemes including the Central and Centrally Sponsored Schemes. As per the provisions of the Constitution, the decision for the extent of empowerment of the local bodies is to be taken by the State Governments. The Ministry of Panchayati Raj is making all the necessary efforts to persuade the State Governments to take necessary action in this regard.‖ 4.31 Besides shortcomings of the existing criteria for identification of poor,
certain implementation problems have been highlighted in the written memorandum
submitted by Dr. Himanshu, stated as below:
―Implementation is done by State Government using village level Officials
Since the criteria is known it introduces a bias among the respondents
But even otherwise, due to local situations, it is prone to elite capture
The victim/loser in most cases are the poor
Weak redressal mechanism
Implementing agencies vary in their capacity from state to state.
Gram sabhas and panchayats are weak
Implementation also depends on the design of delivery programmes which depend on the capacity of line departments and -state governments‖
4.32 Member Secretary, Planning Commission, while deposing before the
Committee, also highlighted the problem of under utilization of funds of various
schemes, stated as below:
56
―The focus on allocations of money on the funds which are going, I crave your indulgence to say that what is going is not getting spent well and sometimes it not reaching also. It is not that it is getting embezzled on the way, but it is getting blocked up on the way. Either the money is given from the Centre to the State or from State it goes to the District and then from District to the Intermediate Panchayats and Village Panchayats wait to get the allocations. There is some delay in that. The Budget year is the end loss. The next year, the release is dwindled because the opening balance is very large or the money which is received only in the last week of March is not spent. So, there are certain flow problems which can be handled. These are not policy issues, but these are issues of mechanism of ensuring that money reaches.‖
Poverty alleviation Programme in Brazil
4.33 Ensuring that every rupee reaches the person it is meant for, as
Brazil's popular cash-transfer scheme Bolsa Famila Programme (BFP) shows, can
strengthen India's fight against poverty. BFP transfers cash via banks to poor
Brazilian families on the condition that their children attend school and are
vaccinated. According to a World Bank study, BFP, which reaches 12.7 million
families, helped lift 20 million people out of poverty between 2003 and 2009. In that
time, poverty - based on a purchasing power parity of less than $2 a day - fell from
22% of Brazil's population to 7%. The income of Brazil's poor grew seven times
faster than that of the rich, and three times the national average. Inequality in the
country is now at a 30-year low. Brazil has 12.71 bank branches per 1,000 adults;
India has 10.11.
Study Tour of the Committee
4.34 During the recent study tour of the Committee to Mumbai discussions
were held with the representatives of the Life Insurance Corporation of India and
the Ministry of Finance (Department of Financial Services) on the subject ‗Social
Insurance‘ on 31st January, 2011. In their deliberations the Committee found to their
dismay that the coverage of BPL households under social insurance schemes such
as Aam Aadmi Bima Yojana (AABY) was quite negligible and far from achieving the
BPL target.
57
OBSERVATIONS / RECOMMENDATIONS
1. Despite six decades of planning, a plethora of schemes and
various measures initiated by successive Governments, it remains a stark
reality that large number of our people are forced to live in abject poverty. It is
disconcerting that we still have not yet arrived at a flawless and acceptable
poverty estimation formula, which has predictably resulted in large variations
of poverty estimates between the Planning Commission/Central Government
on the one hand and the States on the other, which again, may be at variance
with the actual incidence of poverty. Several States have questioned the
inconsistency in the criteria determined by the Planning Commission and
have termed it absurd, as it seeks to pre-determine state-wise poverty
according to certain normative criteria super imposed on the States. Such
mis-match and contradictions have inevitably resulted in wrong targeting of
different welfare schemes and consequent failure to achieve the objectives
envisaged. In the year 2008-09 alone, the actual expenditure incurred in
respect of centrally sponsored flagship schemes was to the tune of Rs.
126848.32 crore. It is obvious that the huge amount of anti-poverty funds
spent over the years have not yielded the desired and tangible results. This
obviously raises issues inter-alia about the role, mandate and functioning of
the Planning Commission and the efficacy of the planning process per se.
While not attempting a critique on the planning process as a whole at this
point, the Committee would like to emphasise in this Report, the key concern
areas relating to estimation of poverty, targeting of poverty alleviation
58
schemes and suggest ways to overcome the discrepancies, mis-match and
distortions that have crept in the system over the years.
2. Presently, incidence of poverty is estimated by the Planning
Commission on the basis of sample surveys of household consumer
expenditure conducted by the National Sample Survey Organisation (NSSO)
on a quinquennial basis. Accordingly, the estimates of poverty were worked
out for the years 1973-74, 1977-78, 1983, 1987-88, 1993-94, 1999-2000 and 2004-
05. The latest poverty estimates have been made for the year 2004-05 based
on the poverty line adopted at all-India level as Rs. 356.30 per capita per
month at 2004-05 prices for rural areas; and Rs. 538.60 per capita per month
for urban areas. On this basis, the percentage of population below poverty
line for rural, urban and all India during 2004-05 was estimated at 28.3%, 25.7%
and 27.5% respectively. While the estimation of poverty in the country is done
by the Planning Commission, the Ministry of Rural Development conducts the
Below Poverty Line (BPL) census to identify the BPL households in rural areas
which could be targeted under its various programmes. The Ministry of Rural
Development has thus been conducting BPL census every five years since
1992 to identify the BPL households in the rural areas. In the latest BPL
census conducted in 2002 by the Ministry of Rural Development, the States
were given the option to identify the number of BPL families equal to the
poverty estimates of 1999-2000 or the adjusted share worked out by the
Planning Commission, whichever was higher; an additional 10% was allowed
to account for the transient poor. However, no such census/survey has been
conducted by the Ministry of Housing & Urban Poverty Alleviation for the
59
urban areas on the plea that it is very costly and that the size of urban poverty
alleviation programme handled by the Ministry had hitherto been very small.
3. During the course of examination of the subject by the
Committee, significant lacunae came into sharp focus such as multiple
indicators/criteria used for identification of the poor, divergence of official
estimates of poverty ratio with the actual incidence of poverty, no poverty
census in urban areas, use of different methodologies for estimation and
identification of BPL households, restricting the identification of poor in
States to the cap fixed by the Planning Commission, variation in estimates,
wrong-targeting of beneficiaries of welfare schemes etc. The Committee have
sought to address these issues in the succeeding paragraphs.
4. The issue of BPL criteria and identification of people „below the
poverty line‟ assumes significance in view of its crucial role in the efficacy and
functioning of the Public Distribution System (PDS) as also the identification
of beneficiaries of targeted poverty alleviation programmes and different
welfare schemes of the Government. The BPL Survey done by the Ministry of
Rural Development in 1992 used the income criterion to determine poverty.
This survey determined the poor using the family based income level of Rs.
11000 per year. However, the Committee note that in the next BPL census of
1997, the consumption criterion was adopted to identify the poor. Also, for the
first time, exclusion criterion was used to rule out ineligible families in the first
place. For the BPL census of 2002, the Ministry of Rural Development adopted
a methodology of score-based ranking of household, as suggested by an
Expert Group. In this process, thirteen socio-economic indicators were used
60
to identify the poor families. The Committee, however, find that while using
this criterion, errors of inclusion and exclusion in the BPL list far exceeded
acceptable limits. Serious discrepancies also came to the fore as a result of
the guidelines issued by the Ministry of Rural Development for the BPL Survey
of 2002 which stipulated a ceiling on the number of BPL households to be
identified, in order to be in conformity with the poverty estimates of the
Planning Commission. The Committee find it strange that the State
Governments were asked to select the poor households so that the total
percentage of such families did not exceed the limit already fixed by the
Planning Commission. Paradoxically, this was like “the feet being made to fit
the shoe”. As was to be expected, several States fixed their BPL number in
excess of the Planning Commission limit, while objecting to the cap imposed
by the Planning Commission. The fact that a large number of complaints were
received on this mis-match in poverty estimates and also that “a part of the
BPL population had been missed out” was conceded by the Secretary (Rural
Development) in his deposition before the Committee. In this connection, the
Committee were astonished to learn from the Secretary that there have been
specific findings that 86% of the APL population ended up in the BPL and
almost 17% of the richest quintile of the rural population were provided BPL
cards. The Committee are alarmed that such glaring inconsistencies,
distortions and irregularities have plagued the BPL enumeration process. It is
axiomatic that the criteria and estimates formulated by the Planning
Commission have proved to be inadequate, unrealistic and thus eluded proper
implementation at the State level. The Committee do not consider it prudent,
61
practical and fair that the Planning Commission should impose a ceiling or
limit on poverty to be strictly adhered to by the States. Such a top-down
approach can only yield the kind of distorted results evidenced so far.
5. With a view to ascertaining the extent of divergence in the BPL
estimates drawn by the Planning Commission with those identified by the
State Governments, the Committee requested the State Governments/UTs to
furnish the total number of BPL population identified in the States/UTs in the
last BPL Census of 2002. The Committee note with surprise that there is a
wide divergence between the aggregate estimates made by the Planning
Commission and those submitted by the State Governments. The divergence
is all the more glaring in respect of States like Jammu & Kashmir, Himachal
Pradesh, Karnataka, Madhya Pradesh, Bihar and Arunachal Pradesh. The
Committee are thus constrained to observe that the estimation of poverty and
the consequential identification of BPL households, which have been stated
as two separate exercises by the Planning Commission, do not seem to have
worked in tandem at the ground level. This has thus resulted in unacceptably
high level of divergence in many States, thereby defeating the very purpose of
estimation by the Planning Commission. The Committee would, therefore,
recommend that the Planning Commission should only confine itself to
formulating the indicative criteria for determination of BPL population, while
leaving the estimation and enumeration to a better- equipped machinery.
6. The Committee are given to understand that the Planning
Commission uses the poverty ratio of Assam (estimated at 19.73% in 2004-05)
for estimating poverty in seven States, namely, Sikkim (20.06% in 2004-05),
62
Arunachal Pradesh (17.60% in 2004-05), Meghalaya (18.52% in 2004-05),
Mizoram (12.62% in 2004-05), Manipur (17.34% in 2004-05), Nagaland (19.05%
in 2004-05) and Tripura (18.94% in 2004-05). According to the Member
Secretary, Planning Commission, they have to rely on Assam data because
the data for other States is either not available or the sample size of the NSSO
is so small as to be virtually unusable. The Committee find such a situation
unsatisfactory where accurate poverty estimates for North-eastern States are
not available at all. This raises serious questions about the adequacy and
veracity of poverty related statistics in the country. The Committee are
astonished that loose estimation is being done without undertaking proper
household survey. When the Ministry of Rural Development is conducting
household survey, there does not appear to be any need on the part of
Planning Commission to go for mere estimates, resulting in wastage of
resources. In the opinion of the Committee, such duplication of exercise,
added with the issues of divergence in approach and mis-match in
determining the incidence of poverty and the poor households are problem
areas that need to be addressed. The Committee would thus recommend that
a joint mechanism may be instituted for this purpose, comprising of all the
concerned Central Departments viz., Planning Commission, Ministry of Rural
Development, Ministry of Housing and Urban Poverty Alleviation, NSSO under
the Ministry of Statistics and Programme Implementation, Registrar General of
Census under the Ministry of Home Affairs, Unique Identification Authority of
India (UIDAI) etc, the concerned state Government Departments including the
Panchayati Raj Institutions, for a joint and comprehensive poverty survey.
63
Since different wings of Government cannot be allowed to function at cross-
purposes and jeopardise the goal of poverty eradication, the proposed survey
in 2011 should thus be undertaken on a joint basis.
7. The Committee note that various Expert Groups/ agencies have
indicated different estimates of poverty based on different assumptions and
context. The Expert Group headed by Prof. Tendulkar, which was constituted
by the Planning Commission to review the methodology for poverty
estimation, suggested moving away from anchoring the poverty lines to the
calorie intake norm and incorporating the changing consumption patterns of
the people which would reflect more accurately their nutritional status. On the
basis of their proposed methodology, the all-India rural poverty head count
ratio for 2004-05 was estimated at 41.8%, urban poverty head count ratio at
25.7% and all India level at 37.2%. The Ministry of Rural Development
constituted an Expert Group in 2008 under the Chairmanship of Dr. N.C.
Saxena to advise them on the suitable methodology for conducting the BPL
Census for the Eleventh Five Year Plan. This Expert Group suggested that
„the percentage of people entitled to BPL status should be drastically revised
upwards to at least 50%, though the existing calorie norm of 2400 would
warrant this figure to be about 80%‟. This Group also suggested identification
of poor families according to „automatic exclusion and inclusion criteria‟. The
remaining households will be surveyed according to specified weightages.
The Economic Survey, 2008-09 had brought out that based on the calculations
of data on household consumption expenditure for 2004-05 (NSS 61st round
2004-05), the population with less than Rs. 20 per day per capita consumption
64
expenditure was 60.5%. The National Commission for Enterprises in the
Unorganised Sector (NCEUS) under the Chairmanship of Late Shri Arjun
Sengupta in their report on „conditions of work and promotion of livelihood in
the Unorganised Sector‟ estimated that 77% of the population had a per capita
daily consumption of upto Rs. 20 in 2004-05, which could be considered as
„poor and vulnerable‟. The proposed Survey/Census to be conducted by the
Ministry of Rural Development in 2011 may further produce different results.
The Committee are confounded at such a wide variation in the estimates of
poverty made by Expert Groups constituted by the Government based on
different sets of criteria. These facts only add credence to the emphasis
placed by the Committee on the need for harmonising the criteria for
identifying and enumerating the poor through a joint mechanism of the
concerned central, state and local agencies.
8. The Committee would also like to point out that the existing
poverty line approach has its inherent limitations and may not capture
important aspects of the real living conditions of the people. This is also
abundantly evident from the fact that though States like Assam, Andhra
Pradesh and J&K have a high malnourishment ratio, the poverty estimates of
these States, as per the Planning Commission‟s figures are much lower. This
leads us to the key question of appropriate criteria to estimate poverty and its
various facets. While economic growth and Government welfare programmes
have made some impact on the living standards of the people, conditions
relating to basic health, nutrition, education and social security have not
improved to the desired extent. The Committee cannot help expressing regret
65
over the fact that the criteria / approach recommended by various expert
groups set up from time to time for defining and determining „poverty‟ or
„poverty line‟ thus far have only left question marks and have failed in
capturing the actual incidence of poverty in the country. Important aspects
such as ill health, low educational attainments, geographical isolation,
powerlessness or dis-empowerment in civil society, caste or gender based
inherent disadvantages etc. remain to be conclusively captured in identifying
and enumerating the poor. The wide variation in determining the population of
the poor is illustrated by the fact that as per one of the expert groups
appointed recently, the BPL population in the country would be as much as
80% as per the existing calorie norm of 2,400, while as per another norm it is
only 37.2%.
9. The Committee are sanguine that the poverty ratio needs to be
estimated objectively and realistically and the criteria therefor should stretch
beyond the current norm which lays emphasis on calorific value and reflect
faithfully the changing nutritional profile and living status of the masses. The
Committee, therefore, recommend that the operational methodology for
identification of the poor should be based inter-alia on collectible information
covering aspects relating to access to primary health including the number of
illnesses of household members in a period of about a month which would
give an indicative account on the extent of economic burden of households
owing to poor health outcomes; level of indebtedness which often leads
households into destitution and the reasons therefor; ownership and type of
residence like kuccha, semi-pukka and pukka; proportion of total household
66
members to the total members engaged in economically productive
occupation or are self employed; schooling status of children along-with
number of working children in a household; and proportion of dependent
children and the elderly, which would indicate the extent of economic strain
on a household. Aspects relating to access to basic education, banking
channels and micro credit should be suitably factored in operationalising the
criteria for identification of the poor. The criteria may also provide for
automatic exclusion of specified categories like those (a) possessing irrigated
land double that of district average, (b) possessing two/four wheel
mechanised transport vehicle, (c) income tax payees, (d) residence in a pucca
house more than specified covered area, say 1,000 sq. ft., (e) house-holds with
at least one person holding pensionable job etc. Keeping in view such a
broader approach, the Committee feel that there need not be any specific
„automatic inclusion criteria‟. In the view of the Committee, it would thus be in
order to have a more comprehensive and multi-dimensional approach to
determine poverty, which will also take into account dynamic aspects like
slipping back and forth across the poverty line as also issues relating to
empowerment of masses.
10. The Committee believe that poverty cannot be eliminated by
under-stating the figures or simply wishing away the problem. Government
programmes can be more effectively delivered if the multiple dimensions of
poverty are recognized and the criteria nuanced accordingly. The proposed
criteria for poverty estimation should thus be easily defined and measurable,
67
stable in the medium term and should also not become a disincentive for
progress.
11. As the special category of the „poorest of the poor‟ comprise a
vast chunk of the people, the Committee are of the view that we can make a
real dent on poverty only by paying special attention to this category by
devising and implementing focussed and exclusive schemes/programmes for
them. The Committee would, therefore, emphasise that a set of exclusive
criteria may be specially considered to identify „the poorest of the poor‟, so
that Government schemes and programmes particularly aimed at them
including the PDS are targeted in a fail-safe manner. Such a strategy
distinguishing the “poorest of the poor” from the general BPL will help ensure
that this particularly vulnerable category does not get marginalized in the
scheme of things. It will also help the Government devise and implement
exclusive programmes to address problems of endemic hunger, starvation,
acute malnourishment and agrarian distress. The Committee would therefore
recommend that schemes such as Indira Awas Yojana (IAY) with suitable
modifications, should be made universal for the „poorest of the poor‟, while
schemes such as NREGA should try to cover the BPL segment as well.
12. With a view to avoiding a rat race to be identified under BPL
category for availing benefits of Government schemes and programmes
including the PDS, the Committee would like the Government to encourage
more community-based schemes, whose benefits will accrue to the identified
communities/hamlets/villages as a whole. The mutual compatibilities amongst
the related schemes/ programmes, aimed at a common pool of beneficiaries,
68
will go a long way in minimizing their mis-use, while imparting credibility and
sustainability to the BPL identification process. The Committee would,
therefore, recommend that separate criteria may be formulated for community-
centric programmes focusing on villages having more than two-third BPL
population.
13. With a view to ensuring that every rupee reaches the person it is
meant for, the Committee would like the Government to examine direct cash-
transfer scheme as tried out successfully in large countries like Brazil. The
Committee gather that under their Bolsa Famila Programme (BFP) cash
transfers via banks to poor Brazilian families are made on the condition that
their children attend school and are vaccinated. According to a World Bank
Study, the BFP in Brazil helped lift 20 million people out of poverty between
2003 and 2009, as the income of Brazil‟s poor grew seven times faster than
that of the rich, and three times the national average. There are also
experiments such as that in Indonesia where even the entire village is
identified as „poor‟ for targeted action and the people are incentivised to come
out of the „poverty trap‟. The Committee desire that the Government should
evaluate such popular programmes successfully tried out in countries
similarly placed like ours with a large population of poor and the marginalized.
In this context, the Committee would like to emphasise that direct cash
transfers to bank accounts of beneficiaries will also facilitate the process of
„financial‟ inclusion‟ being attempted by the banking sector. Such a scheme
may also be integrated with the „Aadhar‟ project of the Unique Identification
(UID) programme to be implemented on a national scale, which will go a long
69
way in plugging the rampant leakages in the dissemination of benefits to the
poor.
14. The Committee would like to avail this opportunity to extend the
discourse and suggest that the plethora of schemes and programmes
obtaining now should be streamlined and rationalised to manageable
proportions. There is no reason why there should be a scheme seeking to
touch every aspect of human or livestock life. Such proliferation of schemes
eventually leads to slipping of „plan‟ expenditure to „non-plan‟ segment,
thereby slowing down the process of creation of capital infrastructure or
durable assets in rural areas. The Committee suggest that the Central
Government Schemes should focus on areas such as (i) rural roads (ii)
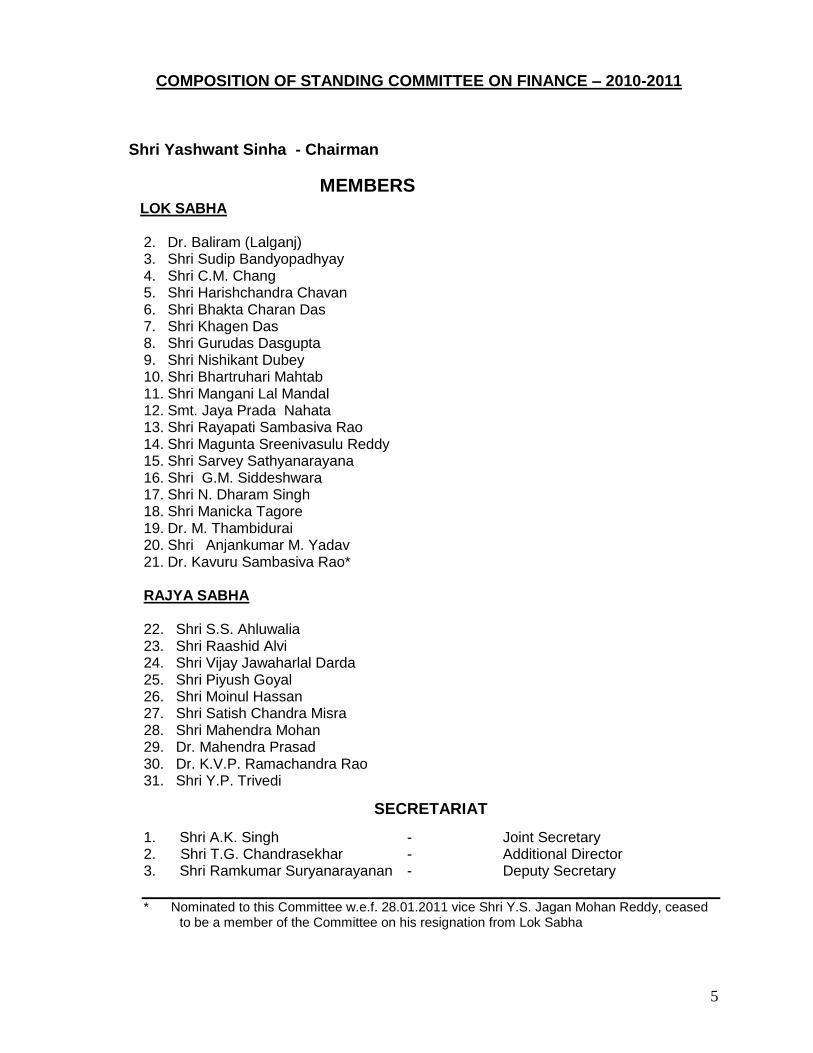
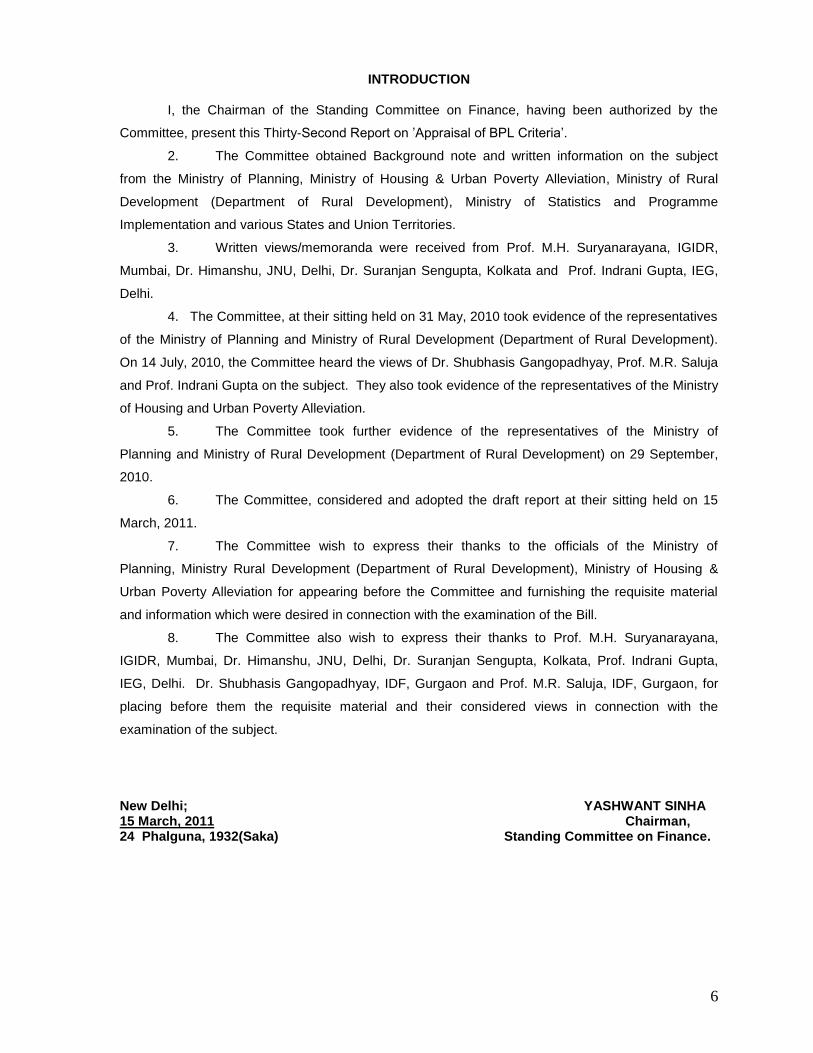
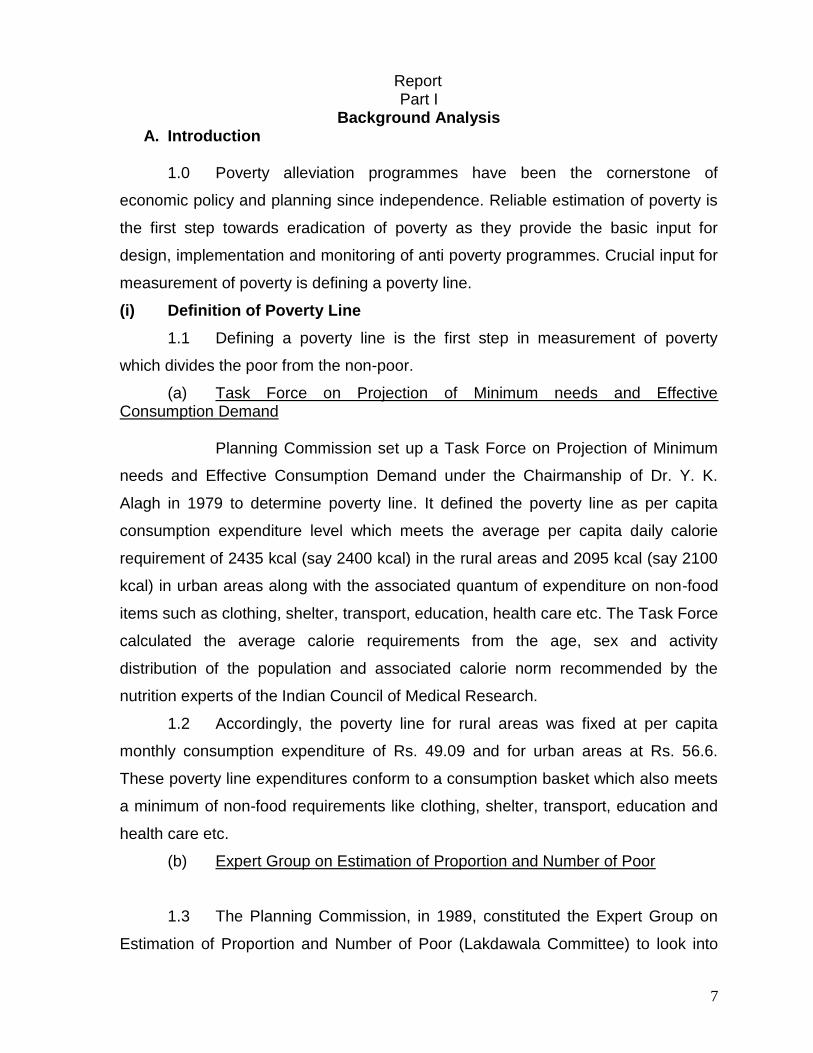
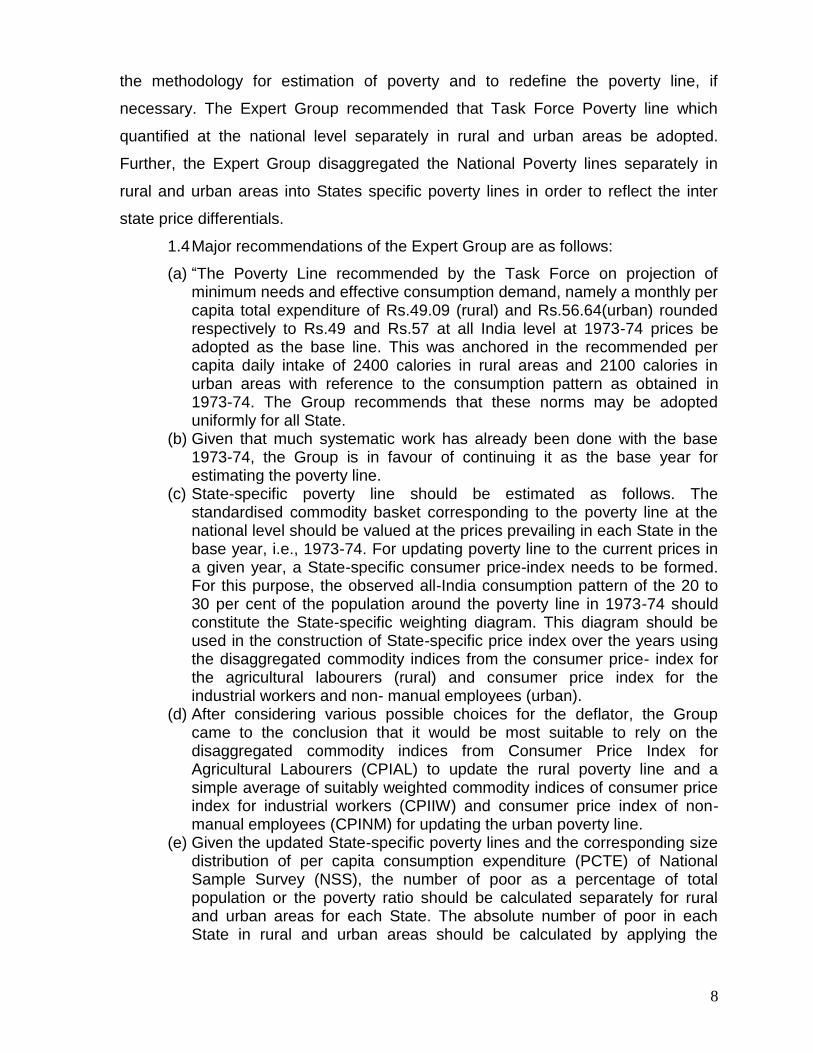
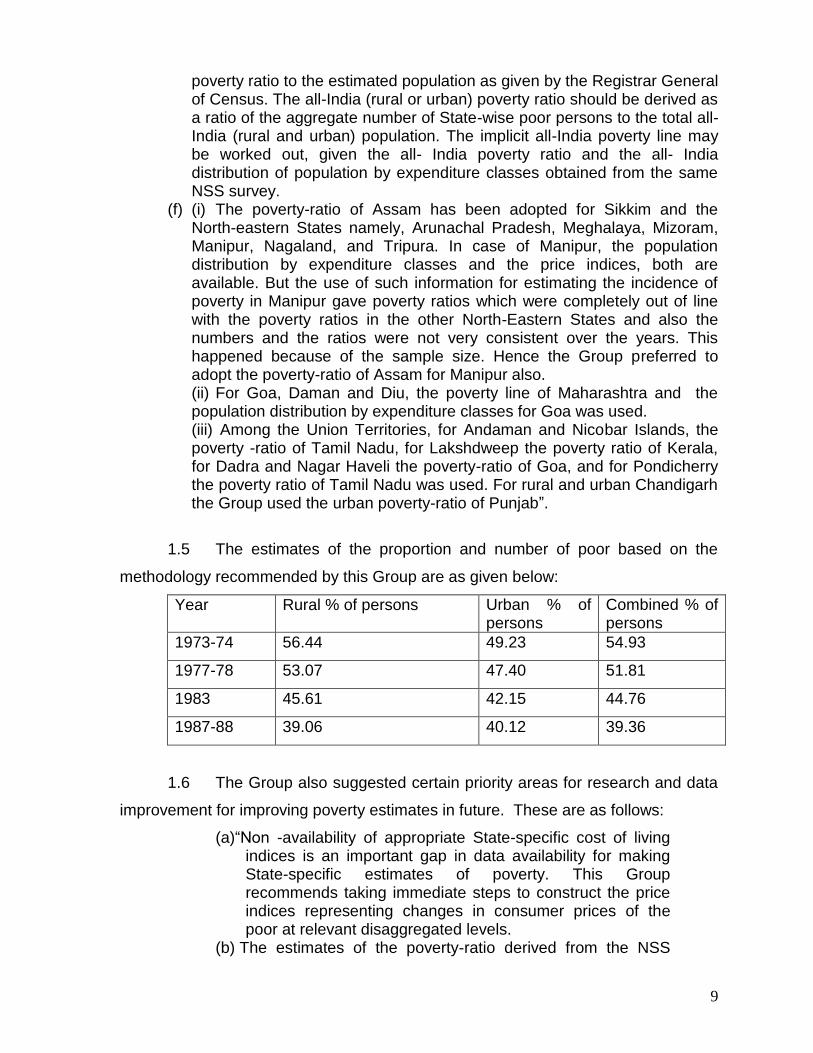


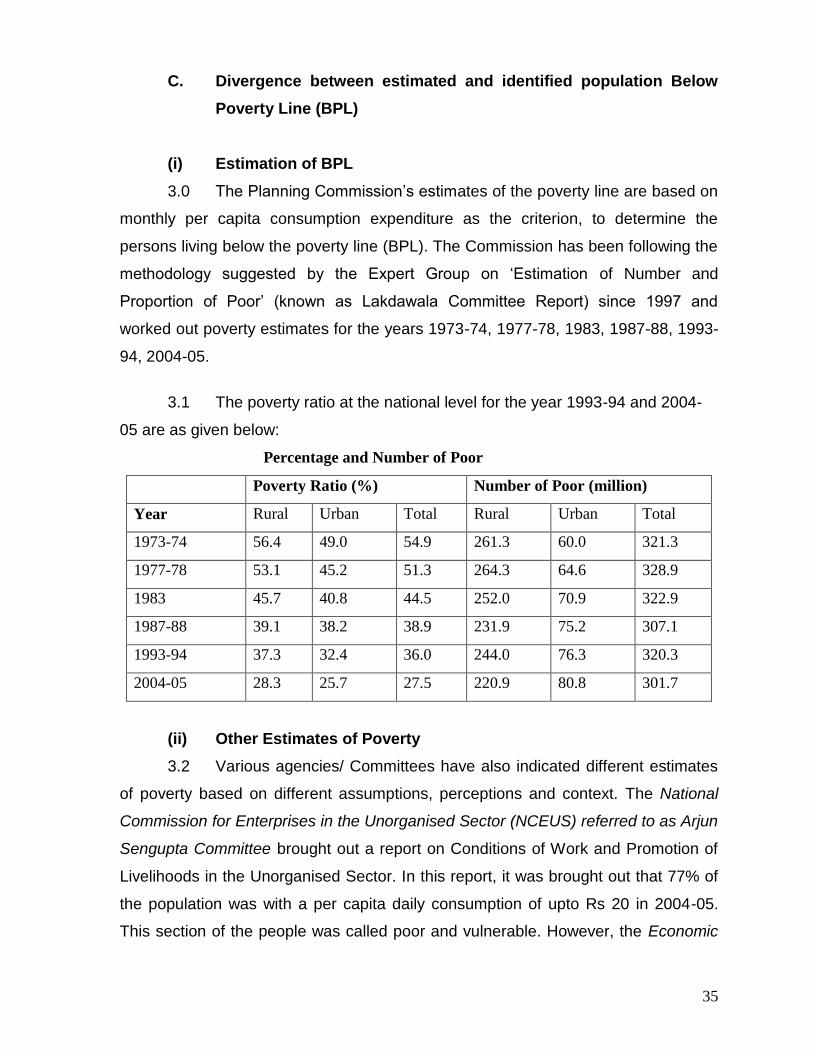
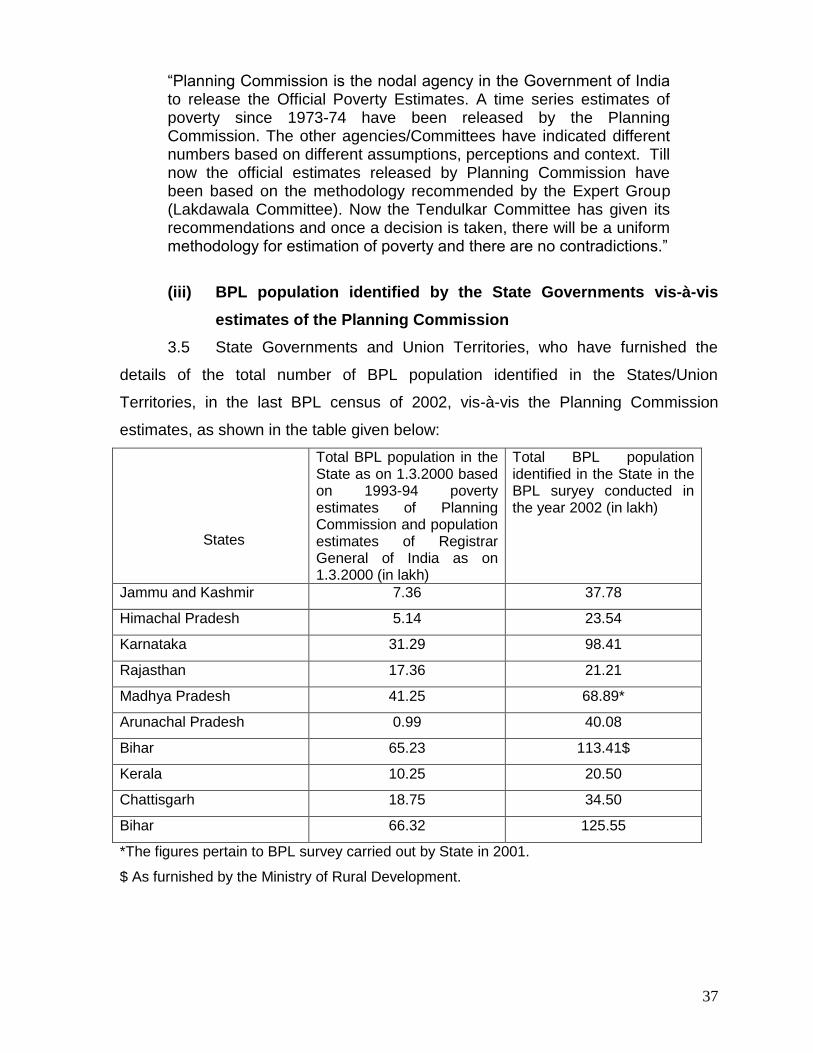


![LOK SABHA DEBATES...1976/11/02 · LOK SABHA DEBATES LOK SABHA. Tuesday, November 2, 1976/Kartika 11, 1898 (SaJea) The Lok Sabha met at Eleven of the Clock [Mr.Speaker in the Chair]](https://static.documents.pub/doc/80x56/60c3a65ad5ad066fdb14c890/lok-sabha-debates-19761102-lok-sabha-debates-lok-sabha-tuesday-november.jpg)


