STAR FORMATION IN GALAXIES: 1. INTRODUCTION TO GALAXIES Jari Kotilainen Tuorla Observatory University of Turku Nordic-Baltic Optical/NIR and Radio Astronomy Summer School: Star Formation in the Milky Way and Nearby Galaxies Tuorla Observatory, 11.6.2009 1. Introduction to galaxies 2. How to measure star formation? 3. Where is star formation located? 4. Why is star formation triggered? 5. Starbursts and galaxy mergers Further reading: Kennicutt, 1998, ARA&A 36, 189
Transcript
STAR FORMATION IN GALAXIES:1. INTRODUCTION TO GALAXIES
Jari KotilainenTuorla ObservatoryUniversity of Turku
NordicBaltic Optical/NIR and Radio Astronomy Summer School:Star Formation in the Milky Way and Nearby Galaxies
Tuorla Observatory, 11.6.2009
1. Introduction to galaxies2. How to measure star formation?3. Where is star formation located?4. Why is star formation triggered?5. Starbursts and galaxy mergers
Further reading: Kennicutt, 1998, ARA&A 36, 189
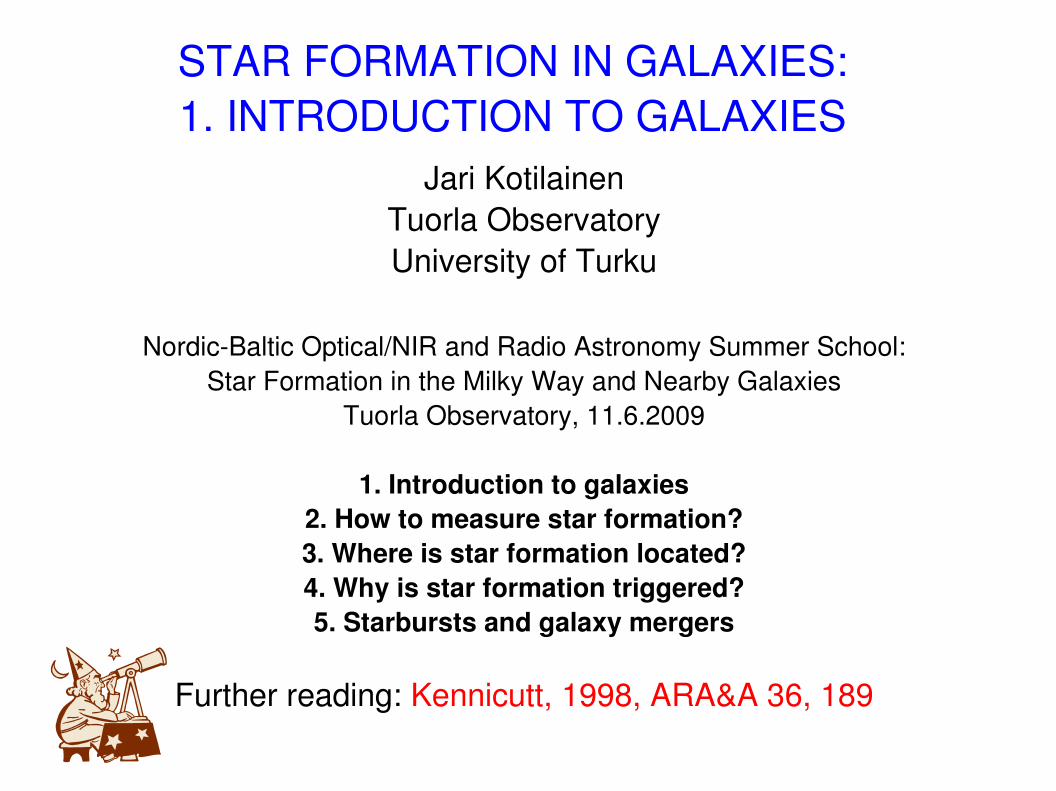
The Hubble Morphological Sequence of Galaxies
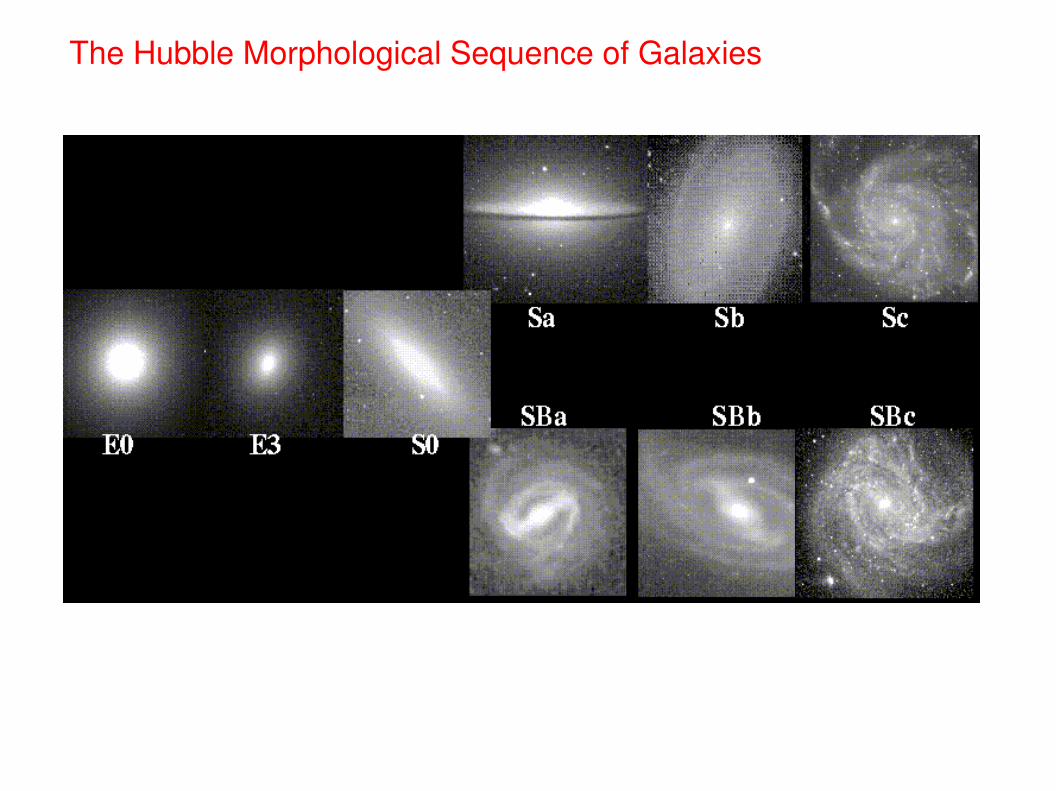
Galaxies at different wavelengths
Multiwavelength imaging of M81
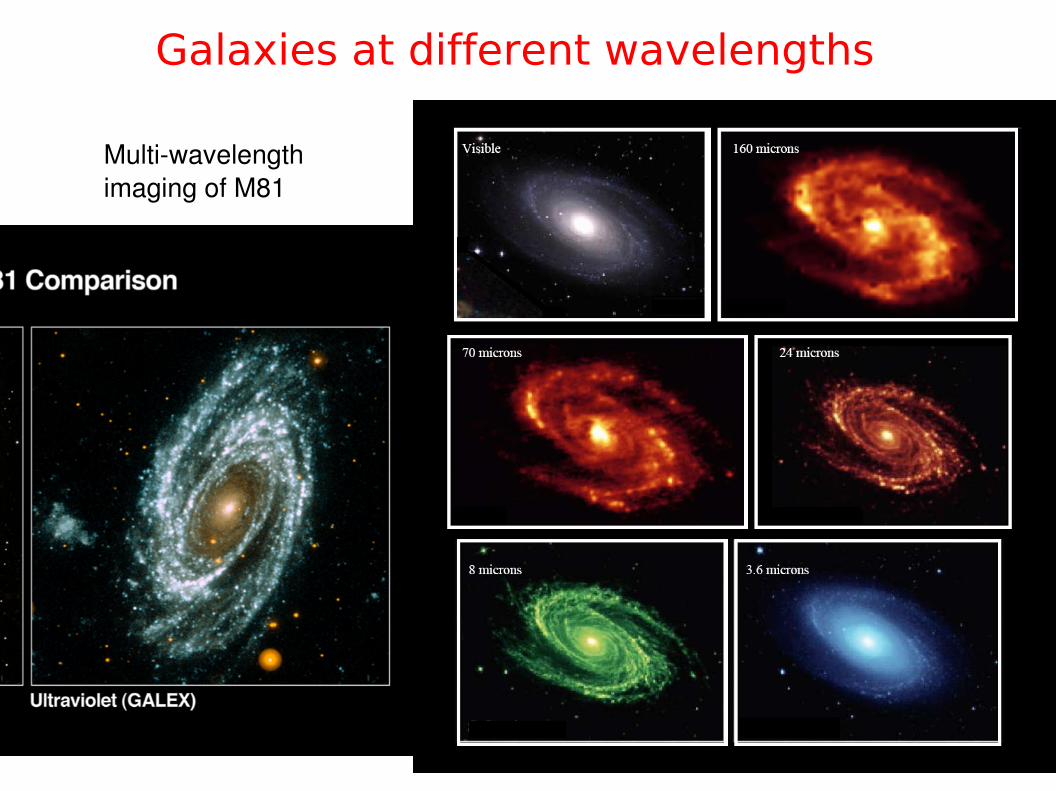
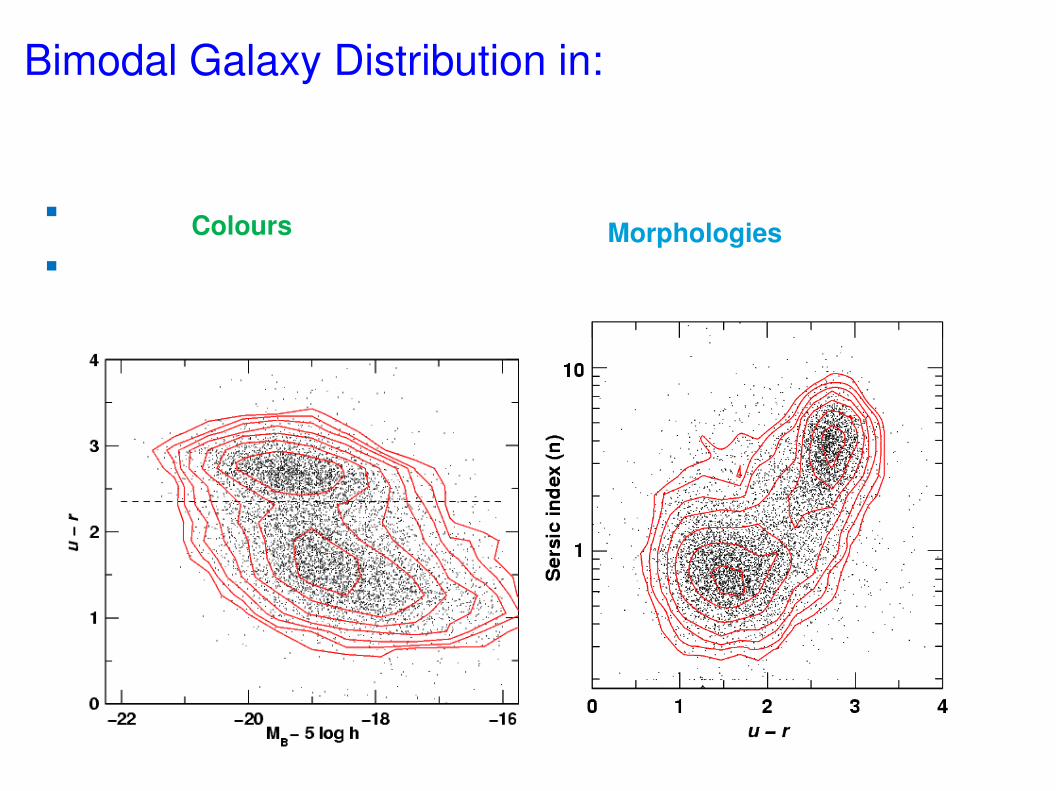
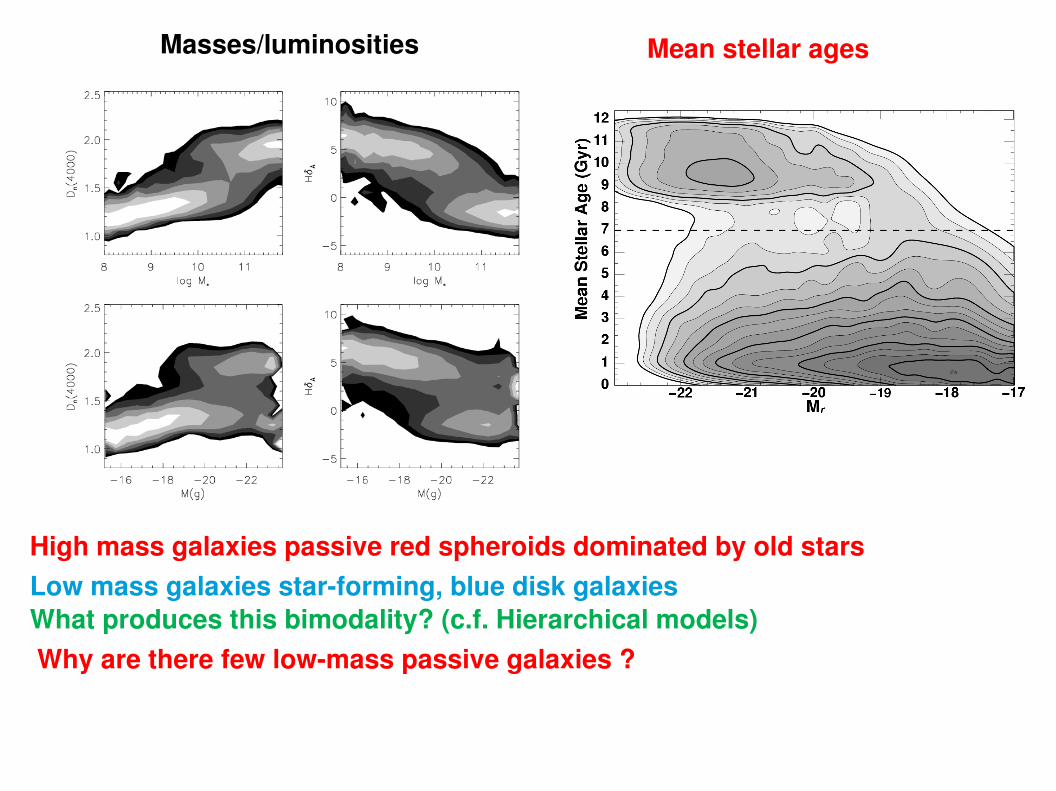
Bimodal Galaxy Distribution in:
Colours Morphologies
High mass galaxies passive red spheroids dominated by old starsLow mass galaxies starforming, blue disk galaxiesWhat produces this bimodality? (c.f. Hierarchical models) Why are there few lowmass passive galaxies ?
Masses/luminosities Mean stellar ages
STAR FORMATION IN GALAXIES
2. HOW TO MEASURE STAR FORMATION?
Jari KotilainenTuorla ObservatoryUniversity of Turku
NordicBaltic Optical/NIR and Radio Astronomy Summer School:Star Formation in the Milky Way and Nearby Galaxies
Tuorla Observatory, 11.6.2009
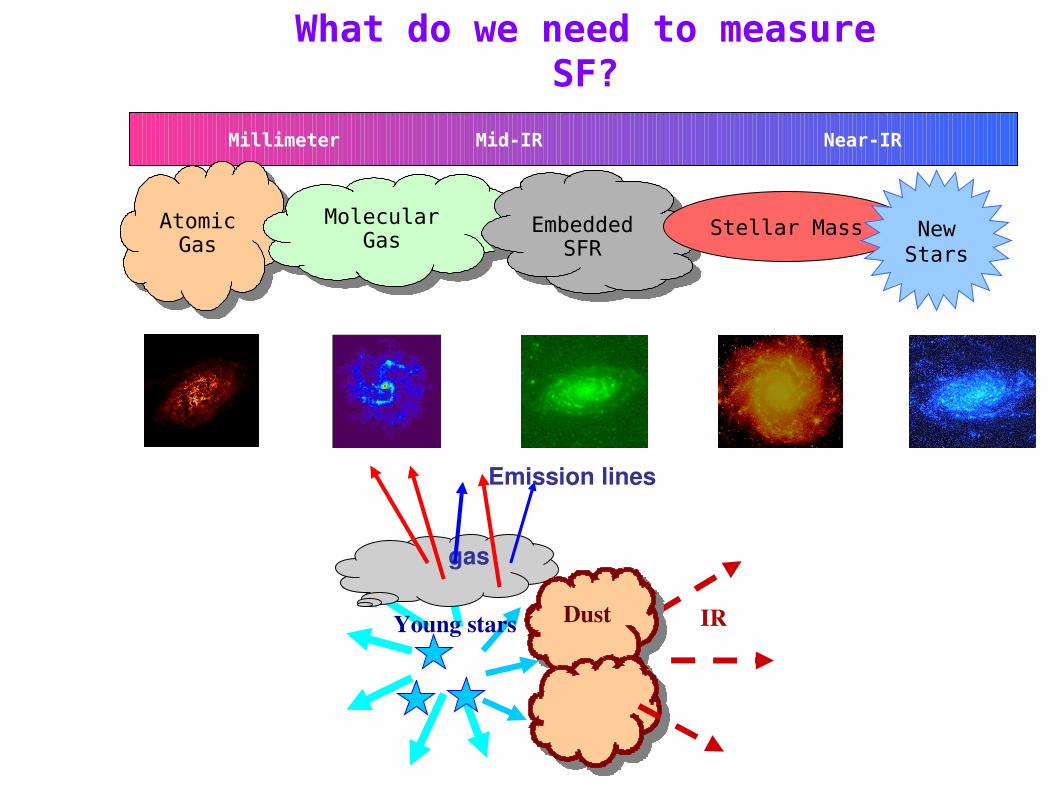
What do we need to measure SF?
Radio Millimeter Mid-IR Near-IR UV
Atomic Gas
Molecular Gas
Embedded SFR
Stellar Mass NewStars
gas
Emission lines
Young stars IRDust
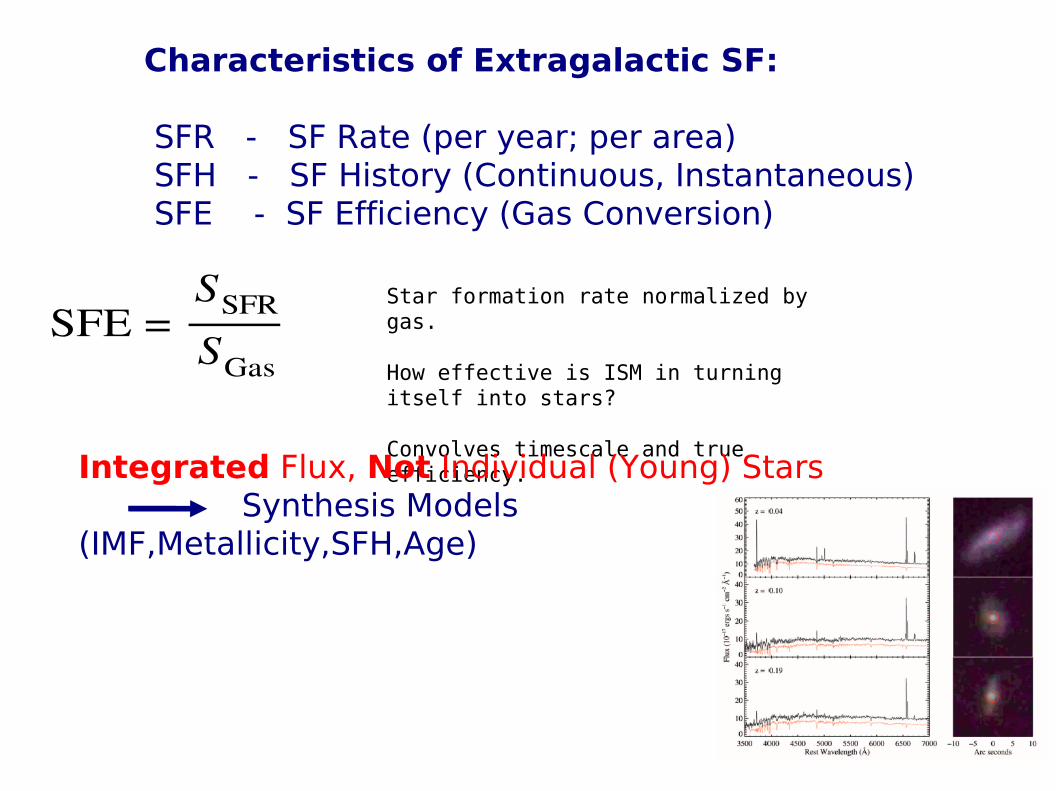
Characteristics of Extragalactic SF:
SFR - SF Rate (per year; per area) SFH - SF History (Continuous, Instantaneous) SFE - SF Efficiency (Gas Conversion)
SFE = SSFR
SGas
Star formation rate normalized by gas.
How effective is ISM in turning itself into stars?
Convolves timescale and true efficiency.Integrated Flux, Not Individual (Young) Stars
Synthesis Models (IMF,Metallicity,SFH,Age)
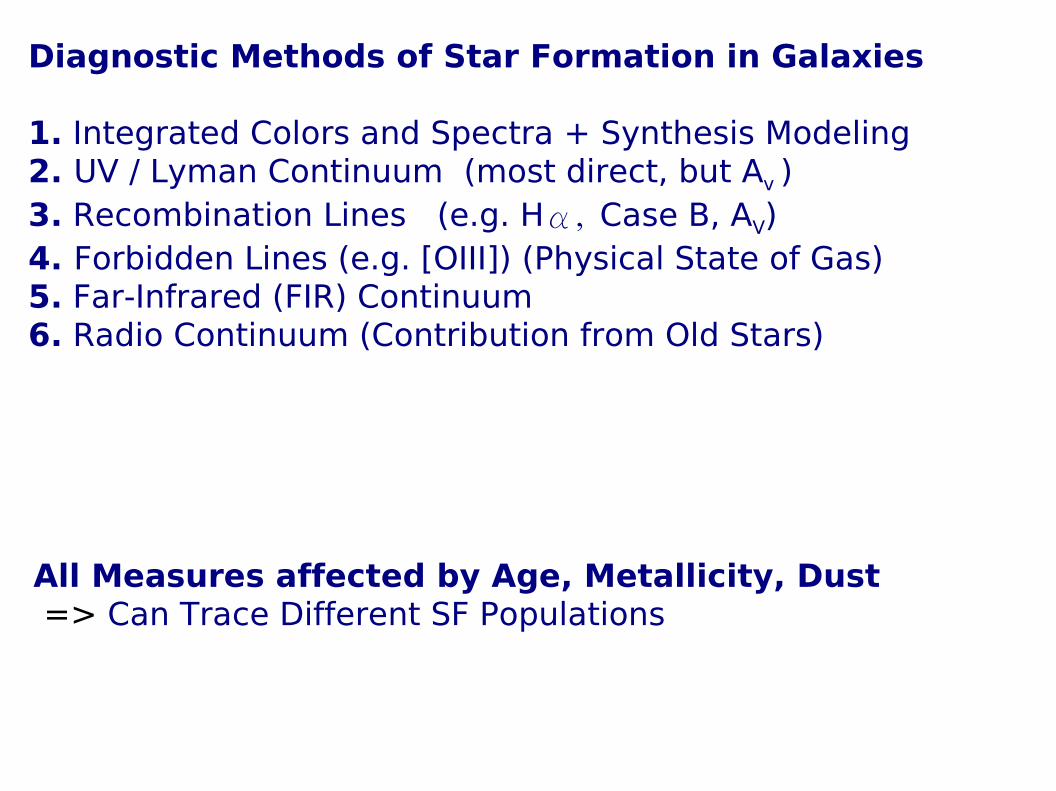
All Measures affected by Age, Metallicity, Dust => Can Trace Different SF Populations
Diagnostic Methods of Star Formation in Galaxies
1. Integrated Colors and Spectra + Synthesis Modeling2. UV / Lyman Continuum (most direct, but Av )
�
3. Recombination Lines (e.g. H Case B, AV)4. Forbidden Lines (e.g. [OIII]) (Physical State of Gas)5. Far-Infrared (FIR) Continuum 6. Radio Continuum (Contribution from Old Stars)
10
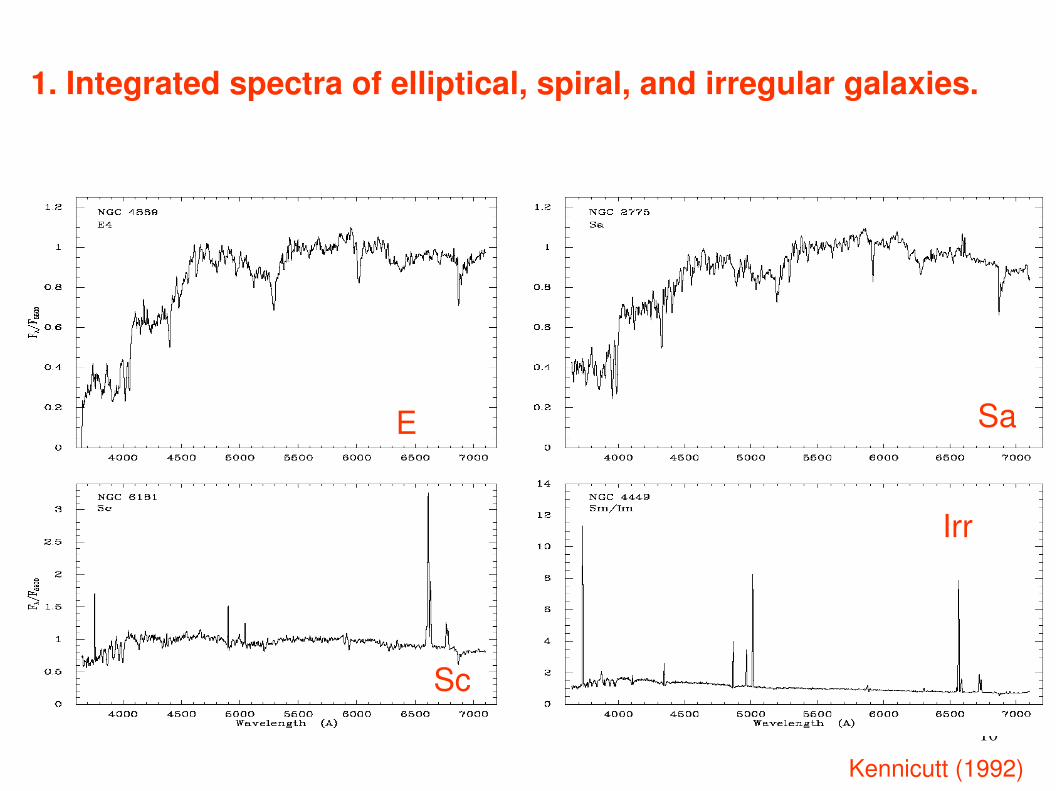
1. Integrated spectra of elliptical, spiral, and irregular galaxies.
Kennicutt (1992)
E Sa
Sc
Irr
11
• Several changes along this sequence: rise in the blue continuum, change in the stellar absorption spectrum from Kgiant to Astar, dramatic increase in the nebular emission lines, especially H .α
• Dominant contributors at visible wavelengths are intermediate main sequence stars (A to early F) and GK giants.
• The spectrum of any given object dictated by the ratio of earlytype (< 1 Gyr) to latetype (> 3 Gyr) stars..
• The contributions to the spectrum by young and old stars need to be discriminate using evolutionary synthesis models to infer the evolution and SF history of the galaxy
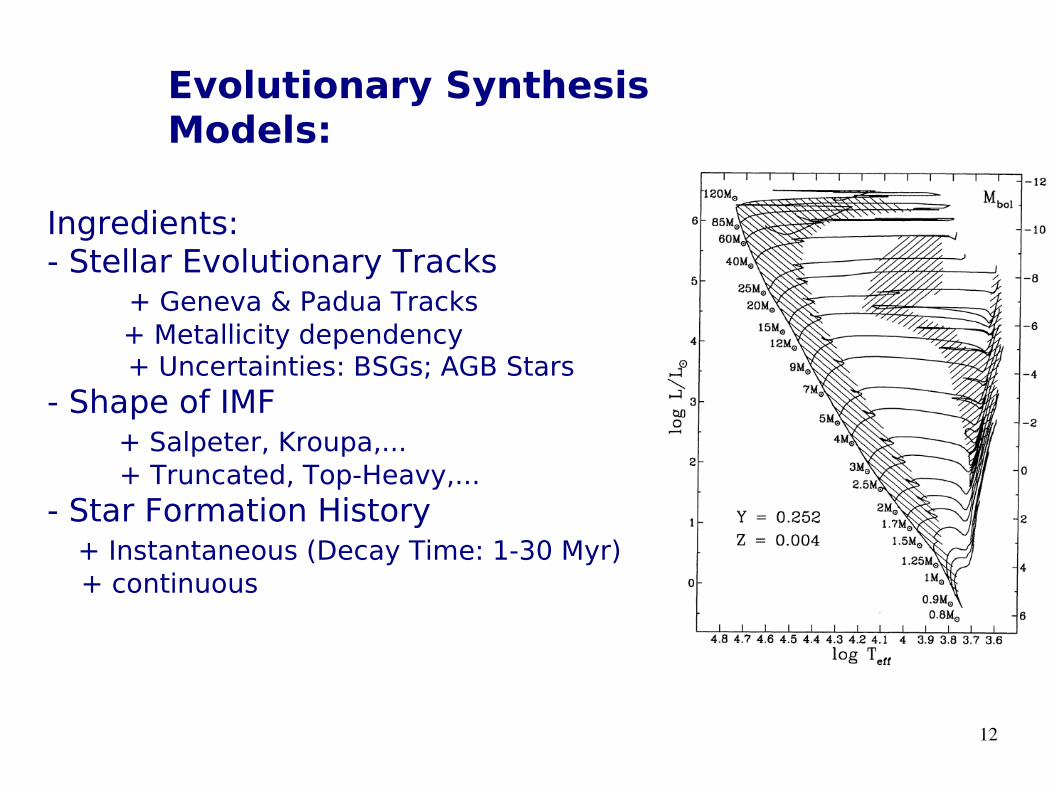
+ Uncertainties: BSGs; AGB Stars- Shape of IMF + Salpeter, Kroupa,...
+ Truncated, Top-Heavy,...- Star Formation History + Instantaneous (Decay Time: 1-30 Myr) + continuous
Evolutionary Synthesis Models:
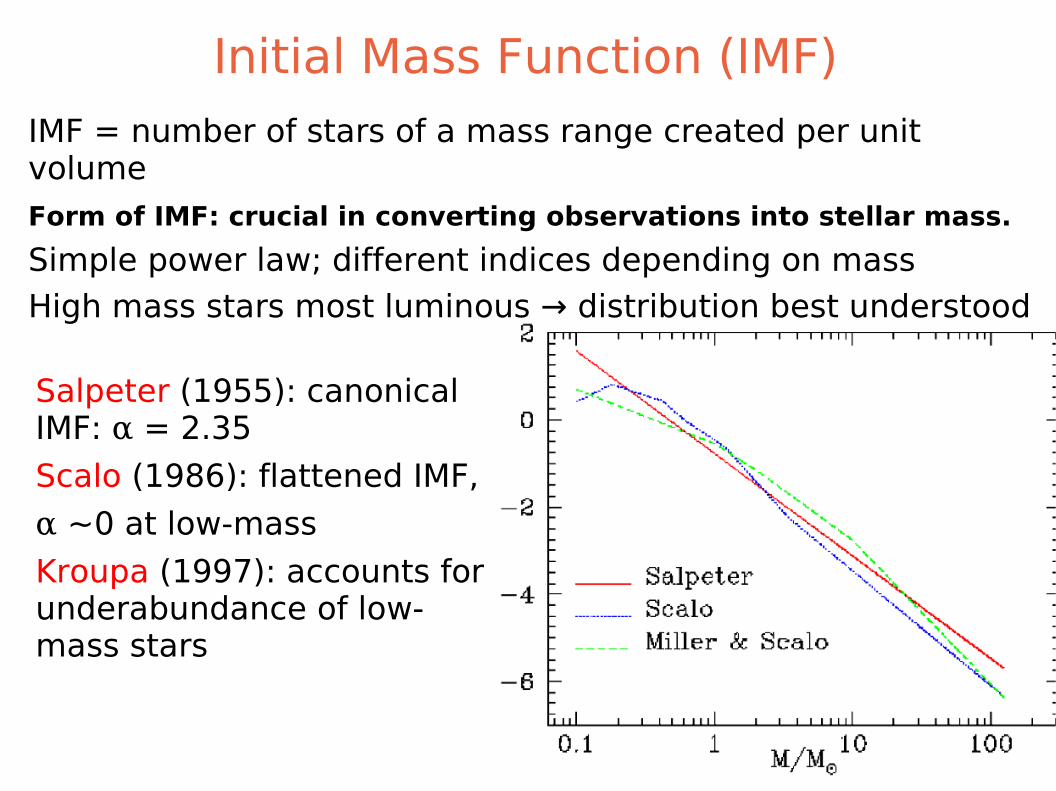
Initial Mass Function (IMF)IMF = number of stars of a mass range created per unit volumeForm of IMF: crucial in converting observations into stellar mass.
Simple power law; different indices depending on mass
High mass stars most luminous → distribution best understood
Salpeter (1955): canonical IMF: α = 2.35
Scalo (1986): flattened IMF,
α ~0 at low-mass
Kroupa (1997): accounts for underabundance of low-mass stars
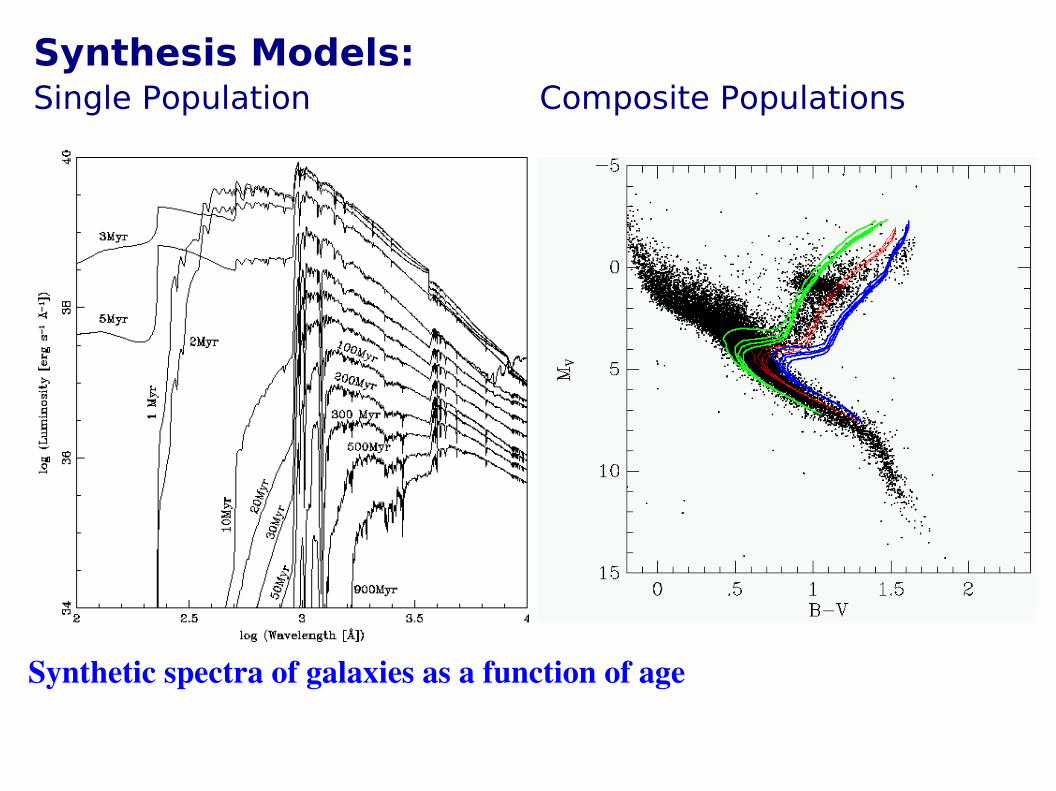
Synthetic spectra of galaxies as a function of age
Synthesis Models:Single Population Composite Populations
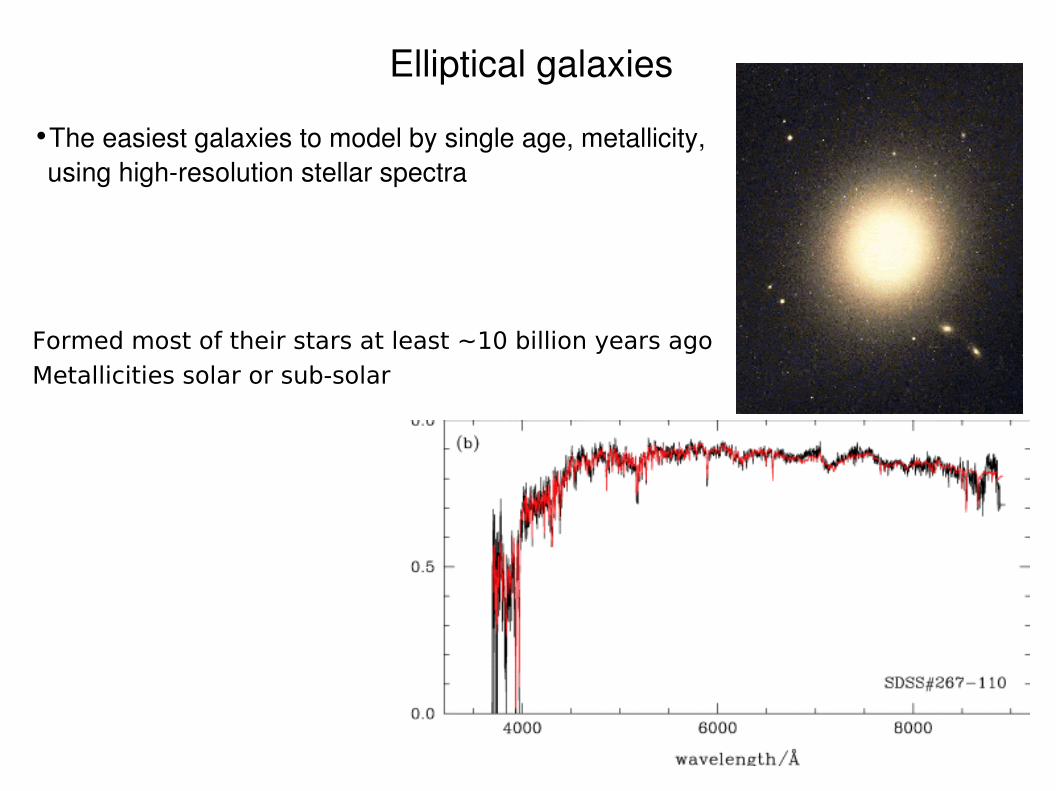
Elliptical galaxies
•The easiest galaxies to model by single age, metallicity, using highresolution stellar spectra
Formed most of their stars at least ~10 billion years agoMetallicities solar or sub-solar
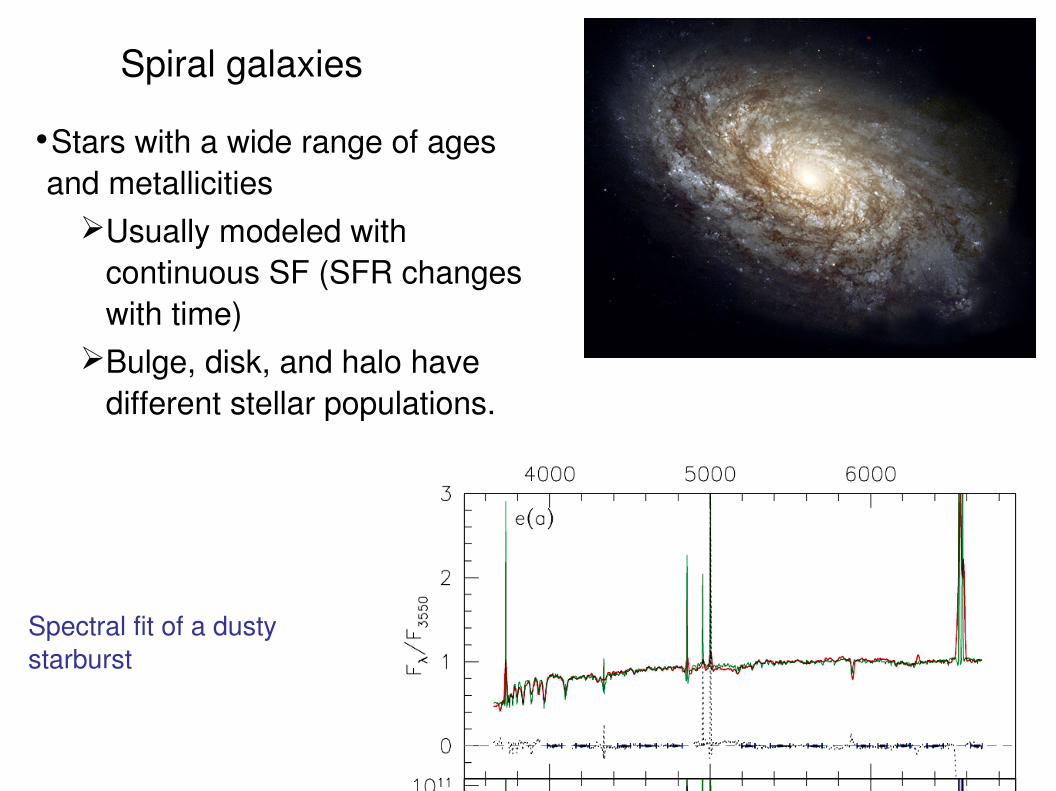
Spiral galaxies
•Stars with a wide range of ages and metallicities
Usually modeled with continuous SF (SFR changes with time)
Bulge, disk, and halo have different stellar populations.
Spectral fit of a dusty starburst
17
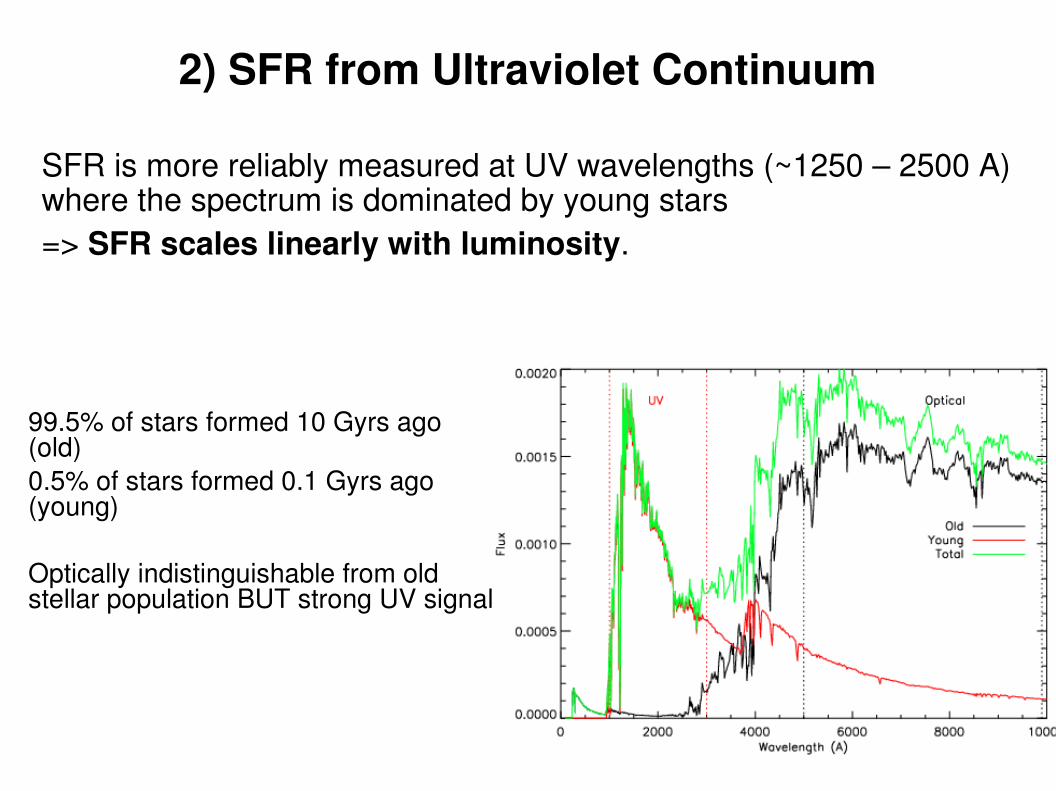
• SFR is more reliably measured at UV wavelengths (~1250 – 2500 A) where the spectrum is dominated by young stars
• => SFR scales linearly with luminosity.
2) SFR from Ultraviolet Continuum
99.5% of stars formed 10 Gyrs ago (old) 0.5% of stars formed 0.1 Gyrs ago (young)
Optically indistinguishable from old stellar population BUT strong UV signal
18
Conversion between UV flux and SFR using synthesis models.
Usually assume that SFR has remained constant over timescales longer than the lifetimes of the dominant UV population (<108 yr), i.e. continuous star formation. Assuming a Salpeter IMF between 0.1 and 100 M⊙ yields: SFR (Msun yr1) = 1.4 1028 LUV(erg s1 Hz1) N.B. SFR/L ratio is significantly lower in younger populations (e.g. starburst galaxies).
Advantage: directly tied to the photospheric emission of the young stellar population.
Drawbacks: (a) sensitivity to extinction which is very patchy, with UV emission dominated by regions of low obscuration.
(b) sensitivity to the assumed form of IMF. The integrated UV spectrum is dominated by stars with M > ~5 M⊙, => a large extrapolation to lower masses.
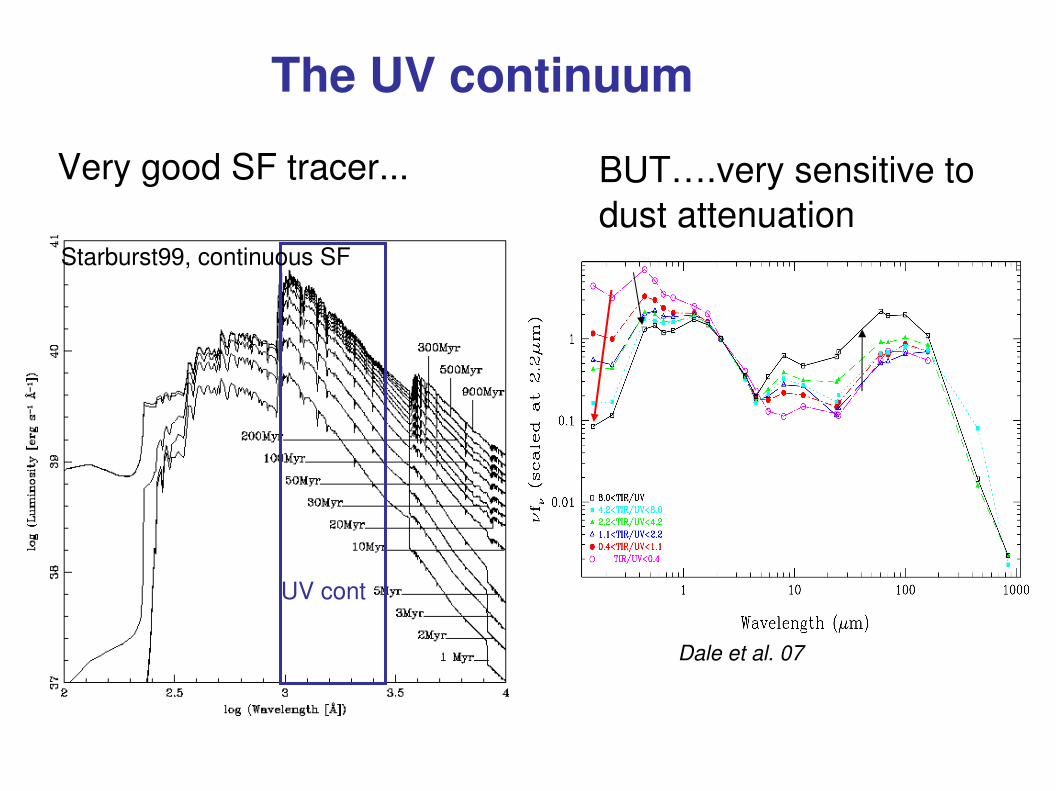
The UV continuum
UV cont
Starburst99, continuous SF
BUT….very sensitive to dust attenuation
Dale et al. 07
Very good SF tracer...
20
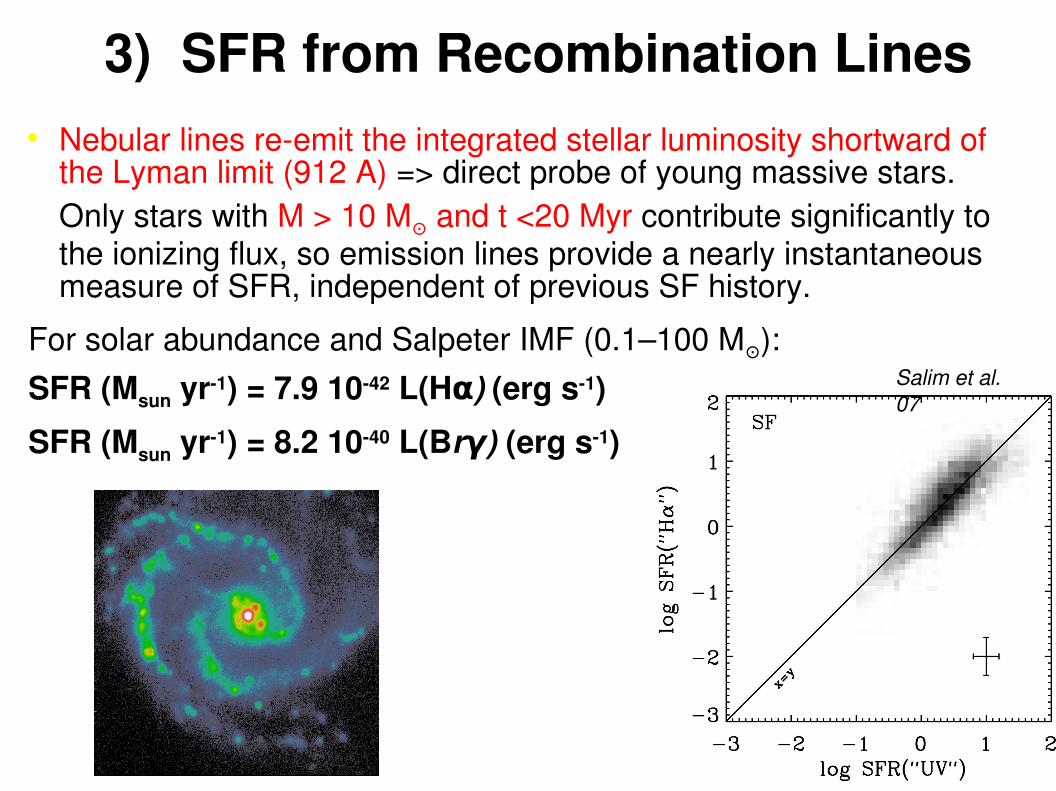
• Nebular lines reemit the integrated stellar luminosity shortward of the Lyman limit (912 A) => direct probe of young massive stars.
• Only stars with M > 10 M⊙ and t <20 Myr contribute significantly to the ionizing flux, so emission lines provide a nearly instantaneous measure of SFR, independent of previous SF history.
3) SFR from Recombination Lines
For solar abundance and Salpeter IMF (0.1–100 M⊙):SFR (Msun yr1) = 7.9 1042 L(Hα) (erg s1)
SFR (Msun yr1) = 8.2 1040 L(Br ) γ (erg s1)
Salim et al. 07
21
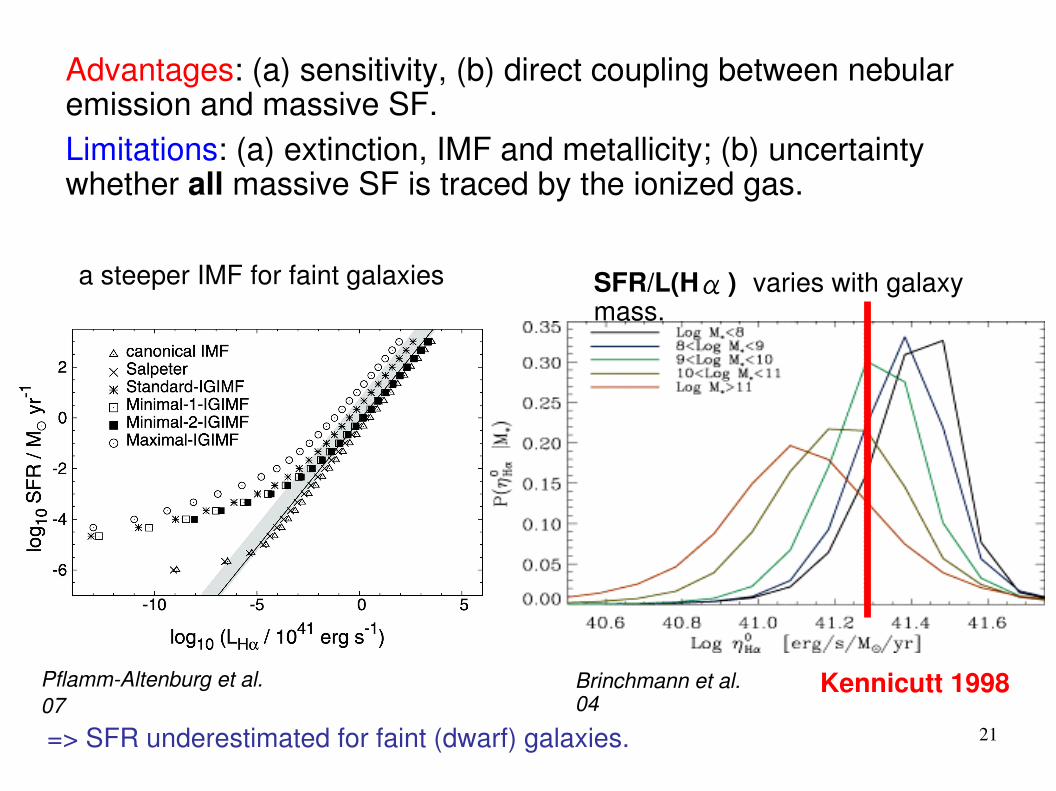
• Advantages: (a) sensitivity, (b) direct coupling between nebular emission and massive SF.
• Limitations: (a) extinction, IMF and metallicity; (b) uncertainty whether all massive SF is traced by the ionized gas.
a steeper IMF for faint galaxies SFR/L(H) varies with galaxy mass.
PflammAltenburg et al. 07
=> SFR underestimated for faint (dwarf) galaxies.
Kennicutt 1998Brinchmann et al. 04
22
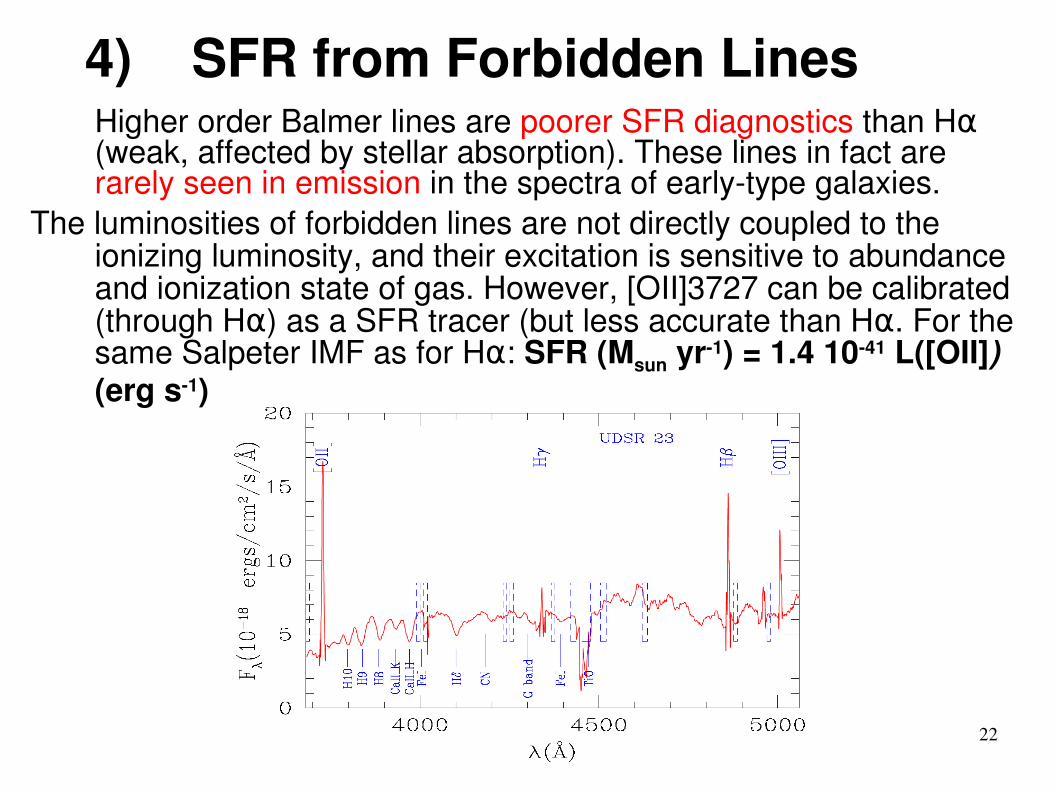
� Higher order Balmer lines are poorer SFR diagnostics than H α(weak, affected by stellar absorption). These lines in fact are rarely seen in emission in the spectra of earlytype galaxies.
The luminosities of forbidden lines are not directly coupled to the ionizing luminosity, and their excitation is sensitive to abundance and ionization state of gas. However, [OII]3727 can be calibrated (through H ) as a SFR tracer (but less accurate than H . For the α αsame Salpeter IMF as for H : α SFR (Msun yr1) = 1.4 1041 L([OII]) (erg s1)
4) SFR from Forbidden Lines
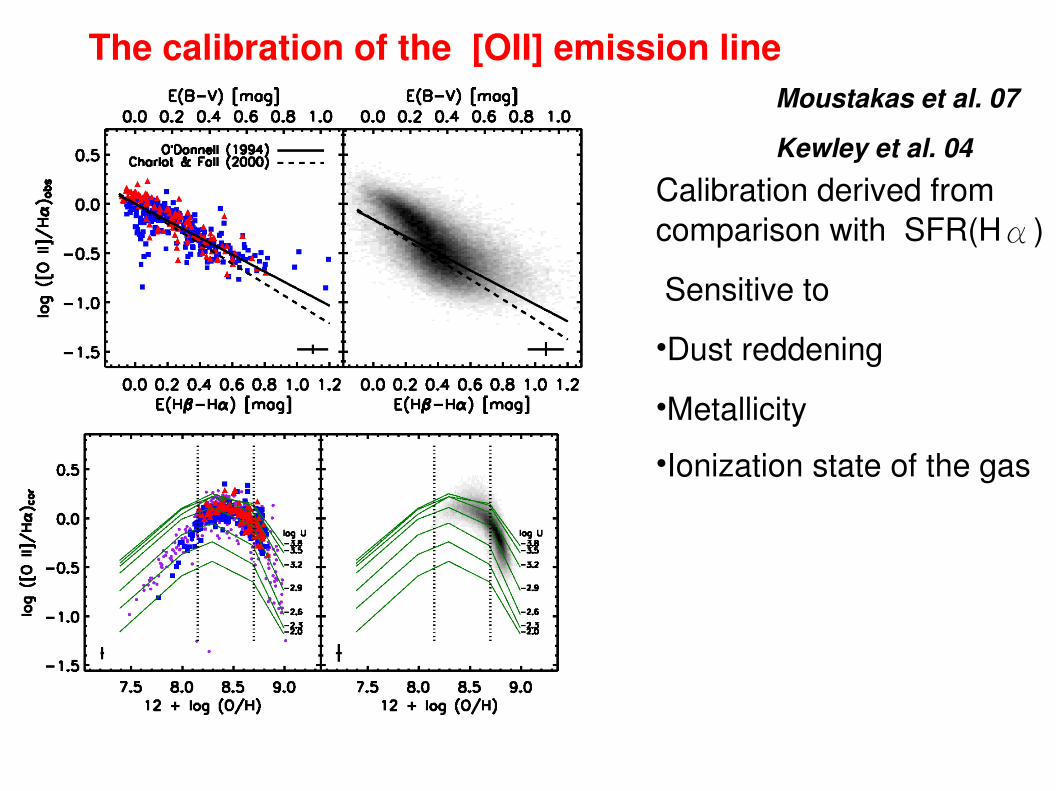
Calibration derived from comparison with SFR(H)
Sensitive to
•Dust reddening
•Metallicity
•Ionization state of the gas
The calibration of the [OII] emission lineMoustakas et al. 07
Kewley et al. 04
24
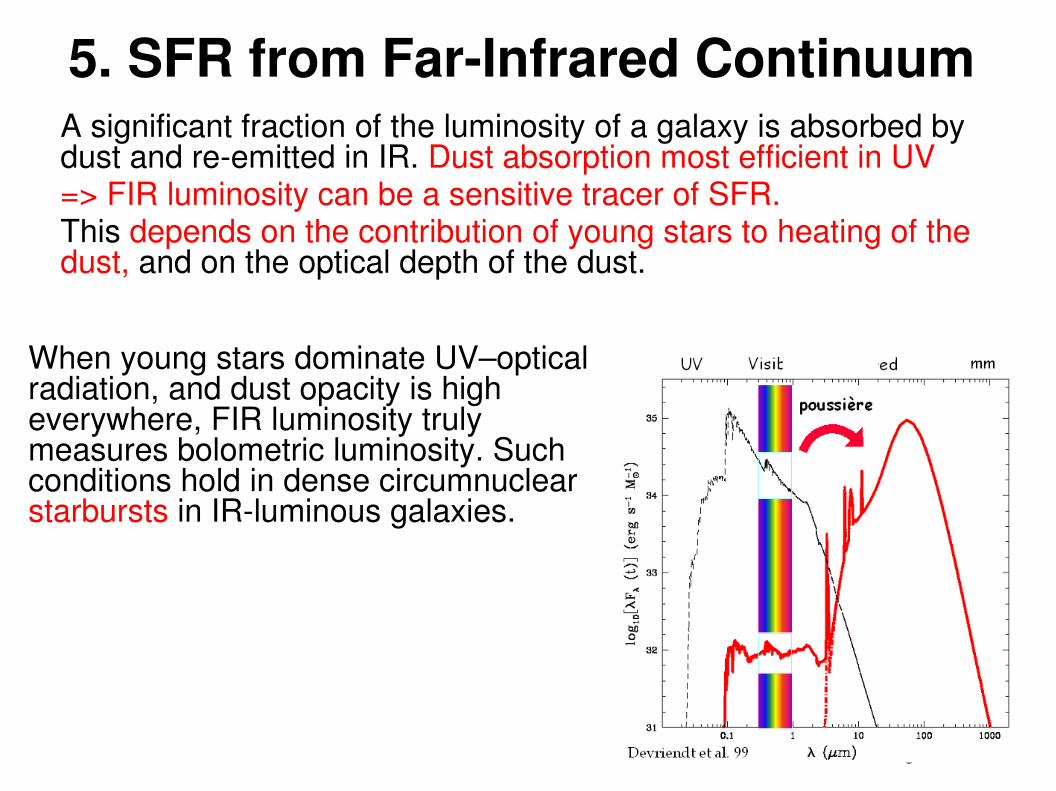
• A significant fraction of the luminosity of a galaxy is absorbed by dust and reemitted in IR. Dust absorption most efficient in UV
• => FIR luminosity can be a sensitive tracer of SFR.• This depends on the contribution of young stars to heating of the
dust, and on the optical depth of the dust.
5. SFR from FarInfrared Continuum
When young stars dominate UV–optical radiation, and dust opacity is high everywhere, FIR luminosity truly measures bolometric luminosity. Such conditions hold in dense circumnuclear starbursts in IRluminous galaxies.
25
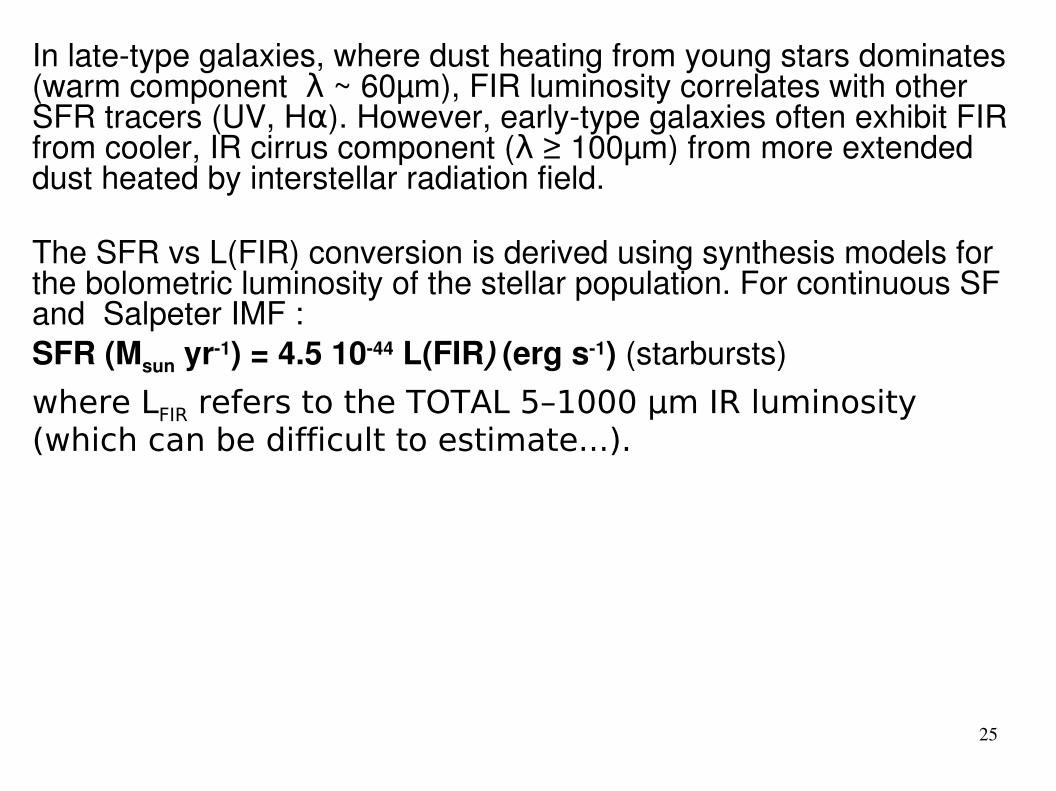
In latetype galaxies, where dust heating from young stars dominates (warm component ~ 60µm), FIR luminosity correlates with other λSFR tracers (UV, H ). However, earlytype galaxies often exhibit FIR αfrom cooler, IR cirrus component ( ≥ 100µm) from more extended λdust heated by interstellar radiation field.
The SFR vs L(FIR) conversion is derived using synthesis models for the bolometric luminosity of the stellar population. For continuous SF and Salpeter IMF :SFR (Msun yr1) = 4.5 1044 L(FIR) (erg s1) (starbursts) where LFIR refers to the TOTAL 5–1000 μm IR luminosity (which can be difficult to estimate...).
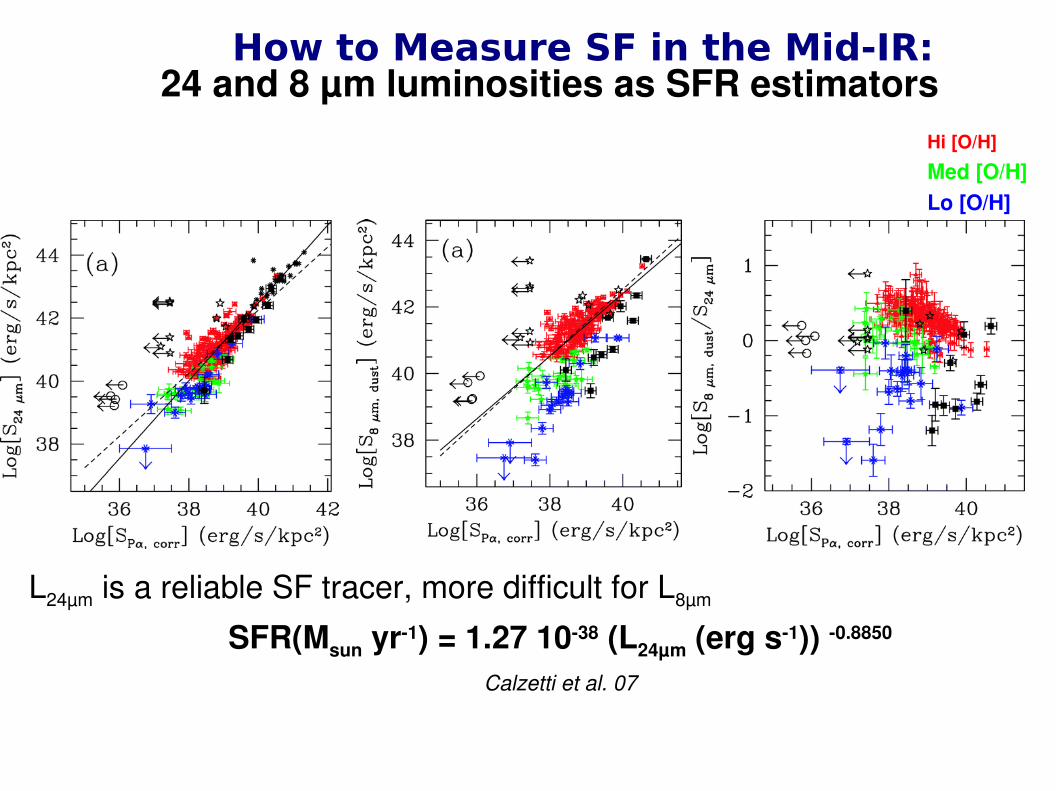
24 and 8 µm luminosities as SFR estimators
L24µm is a reliable SF tracer, more difficult for L8µm
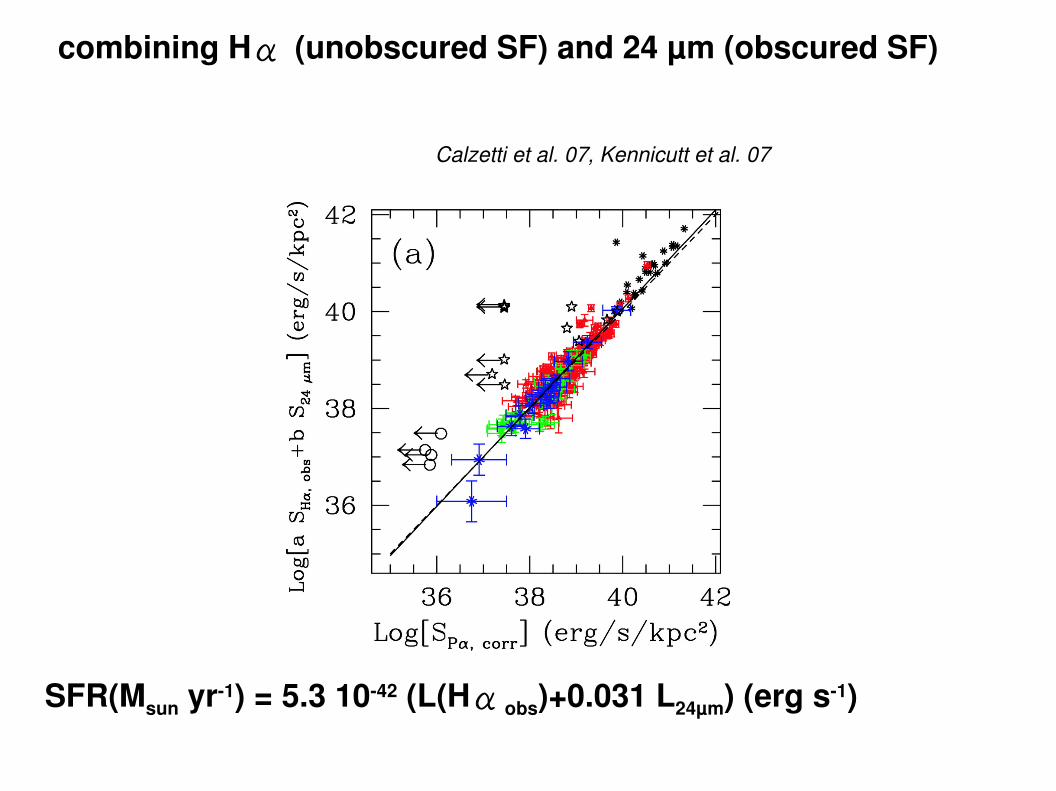
combining H (unobscured SF) and 24 µm (obscured SF)
29
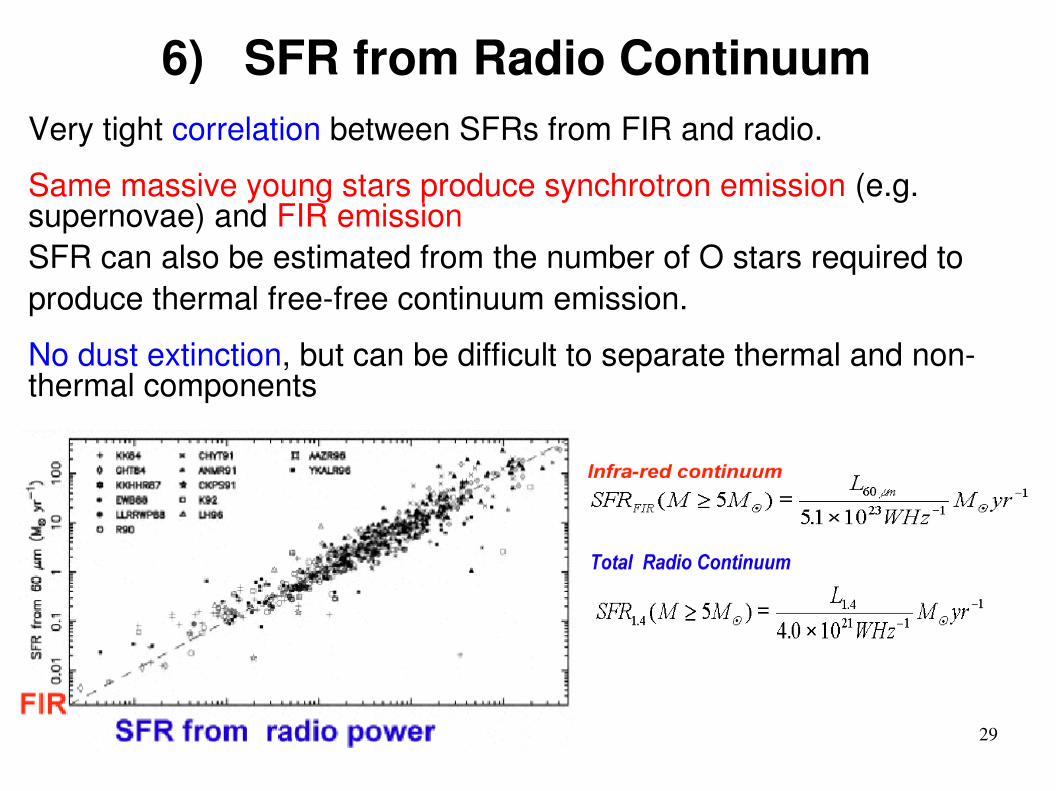
Very tight correlation between SFRs from FIR and radio.
Same massive young stars produce synchrotron emission (e.g. supernovae) and FIR emissionSFR can also be estimated from the number of O stars required to produce thermal freefree continuum emission.
No dust extinction, but can be difficult to separate thermal and nonthermal components
6) SFR from Radio Continuum
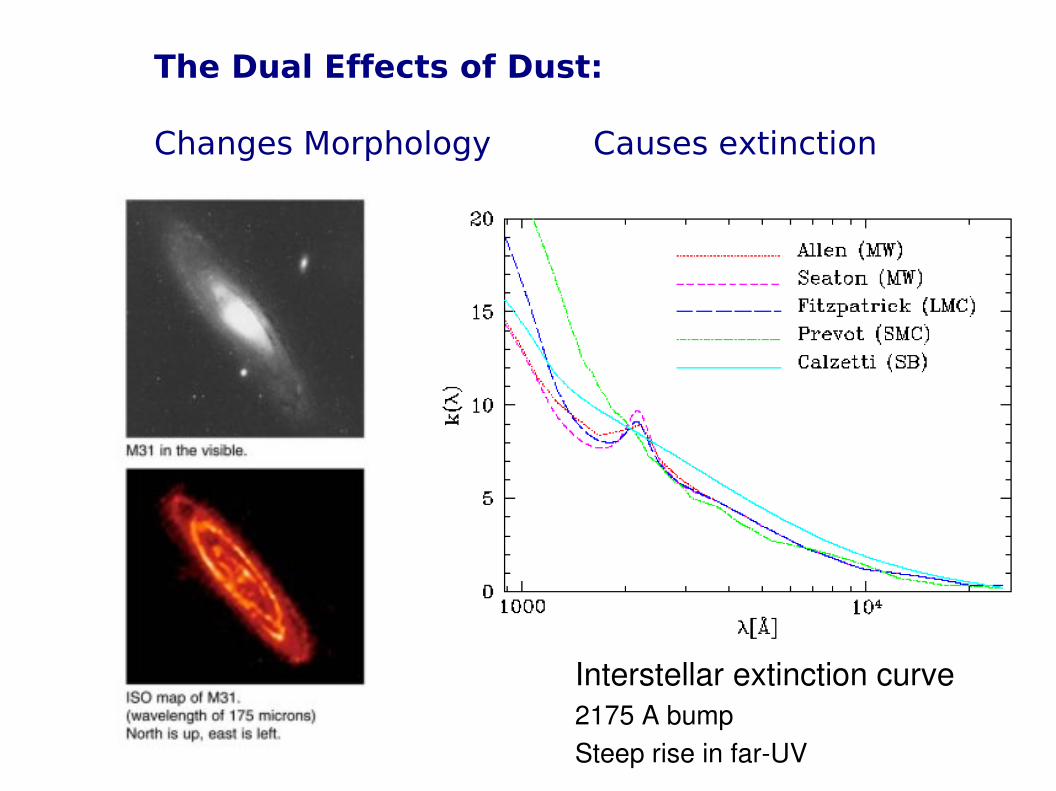
The Dual Effects of Dust:
Changes Morphology Causes extinction
Interstellar extinction curve2175 A bump Steep rise in farUV
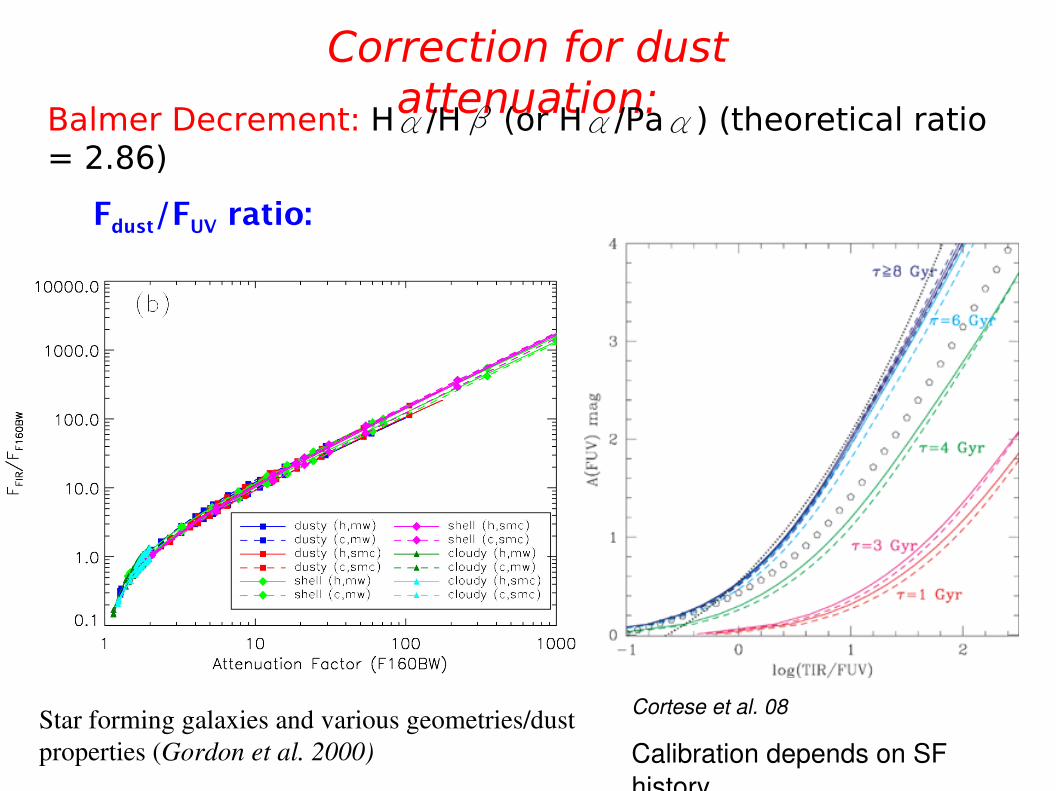
Correction for dust attenuation:
Star forming galaxies and various geometries/dust properties (Gordon et al. 2000)
Cortese et al. 08
Calibration depends on SF history
Fdust/FUV ratio:
Balmer Decrement: H/H (or H/Pa) (theoretical ratio = 2.86)
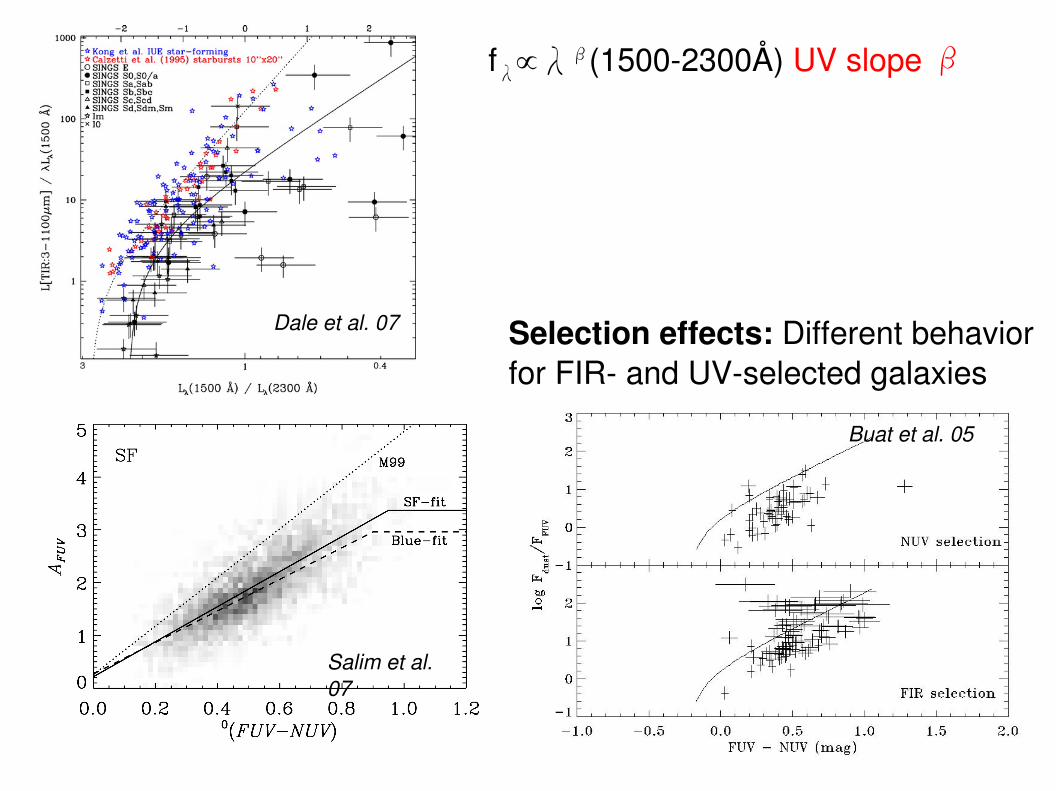
f(15002300Å) UV slope
Selection effects: Different behavior for FIR and UVselected galaxies
Dale et al. 07
Buat et al. 05
Salim et al. 07
Summary
How to measure SF?: all SF measures affected by Age, Dust, Metallicity always integrated Light from Many (Young) Stars synthesis Models for Single & Multiple Populations


![ENVIRONMENTAL PROPERTIES OF z~[1-3] AGN AND STARFORMING GALAXIES:](https://static.documents.pub/doc/80x56/56813224550346895d988756/environmental-properties-of-z1-3-agn-and-starforming-galaxies.jpg)


