PERSONNEL PSYCHOLOGY 2014, 67, 313–350 STAR PERFORMERS IN TWENTY-FIRST CENTURY ORGANIZATIONS HERMAN AGUINIS Indiana University ERNEST O’BOYLE JR. University of Iowa We argue that changes in the nature of work in 21st-century organi- zations have led to the emergence of star performers—a few individ- uals who contribute a disproportionate amount of output. We describe how stars negate the long-held belief that the distribution of individ- ual performance is normal and, instead, suggest an underlying power law distribution. In addition, we offer 9 propositions to guide future empirical research on star performers and an underlying power law dis- tribution of individual performance. We describe how the presence of stars is likely to affect all individual-, team-, and firm-level manage- ment theories addressing individual performance directly or indirectly, but focus on specific implications for those addressing human capital, turnover, compensation, downsizing, leadership, teamwork, corporate entrepreneurship, and microfoundations of strategy. In addition, we dis- cuss methodological considerations necessary to carry out our proposed research agenda. Finally, we discuss how a consideration of star per- formers has important implications for management practice. Since reassuming the role of Starbucks CEO in 2008, Howard Schultz has achieved a market capitalization of $33 billion, more than $11 billion annual sales, and net annual profits of $1.7 billion (Starbucks Corpora- tion, 2012). In a still struggling US economy where the average growth of S&P 500 companies was −.4% in 2011, Starbucks’ share price increased by more than 40%. Thirty years earlier, a young Japanese programmer named Shigeru Miyamoto developed a bizarre game involving a gorilla Both authors contributed equally to this paper. We thank Frederick Morgeson and two Personnel Psychology anonymous reviewers for highly constructive and useful feedback. Also, we thank Adam Grant for sharing data described in Grant (in press) and Grant and Sumanth (2009). A previous version of this paper was presented at the meetings of the Academy of Management in Orlando, Florida (August 2013) and a much abbreviated version excluding figures, table, and other material was published in the 2013 Academy of Management Best Paper Proceedings. Correspondence and requests for reprints should be addressed to Herman Aguinis, Department of Management & Entrepreneurship, Kelley School of Business, Indiana Uni- versity, 1309 E. 10th Street, Bloomington, IN 47405; [email protected]. C 2013 Wiley Periodicals, Inc. doi: 10.1111/peps.12054 313
Transcript
PERSONNEL PSYCHOLOGY2014, 67, 313–350
STAR PERFORMERS IN TWENTY-FIRST CENTURYORGANIZATIONS
HERMAN AGUINISIndiana University
ERNEST O’BOYLE JR.University of Iowa
We argue that changes in the nature of work in 21st-century organi-zations have led to the emergence of star performers—a few individ-uals who contribute a disproportionate amount of output. We describehow stars negate the long-held belief that the distribution of individ-ual performance is normal and, instead, suggest an underlying powerlaw distribution. In addition, we offer 9 propositions to guide futureempirical research on star performers and an underlying power law dis-tribution of individual performance. We describe how the presence ofstars is likely to affect all individual-, team-, and firm-level manage-ment theories addressing individual performance directly or indirectly,but focus on specific implications for those addressing human capital,turnover, compensation, downsizing, leadership, teamwork, corporateentrepreneurship, and microfoundations of strategy. In addition, we dis-cuss methodological considerations necessary to carry out our proposedresearch agenda. Finally, we discuss how a consideration of star per-formers has important implications for management practice.
Since reassuming the role of Starbucks CEO in 2008, Howard Schultzhas achieved a market capitalization of $33 billion, more than $11 billionannual sales, and net annual profits of $1.7 billion (Starbucks Corpora-tion, 2012). In a still struggling US economy where the average growth ofS&P 500 companies was −.4% in 2011, Starbucks’ share price increasedby more than 40%. Thirty years earlier, a young Japanese programmernamed Shigeru Miyamoto developed a bizarre game involving a gorilla
Both authors contributed equally to this paper. We thank Frederick Morgeson and twoPersonnel Psychology anonymous reviewers for highly constructive and useful feedback.Also, we thank Adam Grant for sharing data described in Grant (in press) and Grantand Sumanth (2009). A previous version of this paper was presented at the meetings ofthe Academy of Management in Orlando, Florida (August 2013) and a much abbreviatedversion excluding figures, table, and other material was published in the 2013 Academy ofManagement Best Paper Proceedings.
Correspondence and requests for reprints should be addressed to Herman Aguinis,Department of Management & Entrepreneurship, Kelley School of Business, Indiana Uni-versity, 1309 E. 10th Street, Bloomington, IN 47405; [email protected].
throwing barrels for a near-bankrupt company named Nintendo. The suc-cess of Donkey Kong helped fund Nintendo’s launch of a home-gamingsystem where Miyamoto continued to work and develop some of the mostsuccessful franchises in gaming history, including Mario Brothers and theLegend of Zelda (Suellentrop, 2013). More recently, in Bangalore, India,dropout rates in the public school system were soaring due to students’malnutrition until an engineer named Shridhar Venkat overhauled the fail-ing lunch program with a series of logistical and supply chain adaptations(Vedantam, 2012). Venkat’s continued enhancements of the program haveso significantly improved both children’s health and school attendance thatthe Bangalore Public School System is now a Harvard Business Schoolcase study.
Schultz, Miyamoto, and Venkat typify star performers who consis-tently generate exorbitant output levels that influence the success or failureof their organizations and even society as a whole. Although their produc-tion is extraordinary, their prevalence is not (O’Boyle & Aguinis, 2012).In adddition, although it is likely that such star performers have existedthroughout history, their presence is particularly noticeable across manyindustries and organizations that make up the 21st-century workplace.They occupy roles ranging from frontline workers to top management.Moreover, their addition can signal the rise of an organization and theirdeparture can portend decline and even organizational death (Bedeian &Armenakis, 1998). We do not single out these elite performers based onsome bundle of traits or combination of ability and motivation. Rather,we conceptualize stars based on their output. What makes them special isthat their production is so clearly superior.
In spite of their central role for organizational success, we do nothave a good understanding of star performers. In fact, their presence isoften treated as a data “problem” because the normal distribution can-not account for such extreme levels of productivity. Reliance on existingtheories of individual performance, which often rest on the assumptionthat performance is normally distributed (Hull, 1928; Schmidt & Hunter,1983; Tiffin, 1947), results in identifying these top performers as “anoma-lies” that must be fixed through data transformations or even deletion ofcases from the analysis (Aguinis, Gottfredson, & Joo, 2013). Moreover,supervisors involved in performance appraisal systems are often trainedto ignore stars and, instead, force a normal distribution on performancescores they assign to their subordinates (Motowidlo & Borman, 1977;Schneier, 1977).
Situational constraints that restricted individual performance in thepast, such as geographic distances, lack of good communications, inabil-ity to access information and knowledge, and slow technological disper-sion, are now being minimized by the Internet and flow of information
AGUINIS AND O’BOYLE 315
and knowledge around the world. The organizational hierarchy includingcontrol, command, and centralization has been replaced by an organic,web-like organizational structure (Cascio & Aguinis, 2008; Way, Lepak,Fay, & Thacker, 2010), and there is an increasing awareness that the major-ity of overall productivity is due to a small group of elite workers (Ready,Conger, & Hill, 2010). The result of this new organizational landscape isthat many of our theories so firmly rooted in the manufacturing sector,corporate hierarchy, and the human capital of the “necessary many” maynot apply to today’s workplace that operates globally and is driven by the“vital few.”
The goal of our paper is to serve as a springboard for a research agendaon star performers. First, we define star performers based on their perfor-mance relative to others and discuss the role of time in the identification ofstars. Second, we offer a research agenda including nine research proposi-tions to guide future empirical study of star performers. Third, we discussimplications for future theory and empirical research in several main-stream theories in the field of management and offer recommendationsregarding methodological approaches that will be instrumental regardingthe implementation of our proposed research agenda. Finally, we discussimplications of star performers and an underlying power law distributionof individual performance for management practice.
Star Performers
Stars are defined by their location on the production distribution. Ac-cordingly, a star is a relative position and their identification is onlypossible by viewing them in relation to the productivity of others. In ad-dition, time is an important element to star identification because starsare identified by their exceptional output over time and not just a singleexceptional result. The minimum amount of time required to identify astar performer is the same as the minimum amount of time needed forimportant results to be produced and observed in various organizationalcontexts. For example, the minimum amount of time that a CEO’s ac-tions generate a stable estimate of firm financial performance is typicallyconsidered to be a quarter—and this is why the performance of CEOs isusually evaluated on a quarterly basis. As a second example, it usuallytakes 2 to 3 years for a researcher in the field of management to producea refereed journal article—and this is why many universities evaluate theperformance of their management professors based on a 2- to 3-year win-dow. Although there are minimum time frames needed to identify starperformers, it is possible to also accumulate several such time windows toidentify star performers over longer periods of time such as the number ofcitations accumulated by researchers over 5-year windows and even over
316 PERSONNEL PSYCHOLOGY
their entire careers (e.g., Podsakoff, MacKenzie, Podsakoff, & Bachrach,2008).
Finally, performance can be defined in terms of behaviors (i.e., howpeople do their work) or results (i.e., the output of people’s work). Ourdefinition of star performers is based on results, which does not considerthe traits that workers possess or how they do the job and, instead, focuseson what they produce. According to the performance management litera-ture, a focus on results rather than behaviors is most appropriate when (a)workers are skilled in the needed behaviors, (b) behaviors and results areobviously related, and (c) there are many ways to do the job right (Agui-nis, 2013). Although we readily acknowledge that for more traditionalindustries such as farming and manufacturing, which are still importantcomponents of the economy in the United States and other countries,these conditions may not fully apply, a focus on results seems appropriatefor a vast number of occupations and organizational settings in today’sknowledge-intensive economy dominated by the service industry.
A practical consideration regarding the identification of star perform-ers relates to sources of data regarding an individual’s output. This is notan issue unique to our paper but a topic that is relevant for all performancemanagement theories and practices that include a results component. Thus,there is an extensive literature that offers guidelines regarding this point(e.g., Aguinis, 2013, chapter 5; Cascio & O’Connor, 1974). Fortunately,due to today’s analytics movement as well as the sharp decrease in costof data storage technology (Davenport, Harris, & Shapiro, 2010), mostorganizations regularly collect data not only on employees but also oncustomers and many other issues. In fact, Berry and Linoff (2004) arguedthat firms are faced with the problem of too much data rather than too little.However, we readily acknowledge that it will not be possible to identifystar performers if data regarding results and outcomes are not available.
Star Performers and the Performance Distribution
When attempting to compare stars to average, or even very goodworkers, the output attributable to stars is inconsistent with what wouldbe expected using a traditional normal (i.e., bell-shaped) distribution. Forexample, in academics, where top-tier journal publication is one of themost influential antecedents to rewards such as salary and tenure (Gomez-Mejia & Balkin, 1992), individuals whose publication record is three ormore standard deviations above the mean should be roughly .15% ofthe sample size according to a normal distribution. In other words, in asample of 10,000 academics, approximately 15 are predicted to be at orabove three standard deviations. However, O’Boyle and Aguinis (2012)found that the number of individuals above this threshold far exceeded
AGUINIS AND O’BOYLE 317
what would be predicted under a normal distribution. Across 54 scientificdisciplines, this star effect was found in both the natural sciences such asagriculture where a normal distribution predicted 35 academics when therewere actually 460, as well as social sciences such as clinical psychologywhere a normal distribution of performance predicted 16 individuals, butresults showed 162 academics above three standard deviations (O’Boyle &Aguinis, 2012).
In challenging the prevalence of normality as a model to describe thedistribution of individual performance, several points need considering.First, normal is not the same as common or natural. This is not a new idea,and Thorndike (1913) noted that “there is nothing arbitrary or mysteriousabout variability which makes the so-called normal type of distributiona necessity, or any more rational than any other sort . . . Nature does notabhor irregular distributions” (pp. 88–89). Second, although the extantresearch typically finds and reports a normal distribution of individualperformance, most research involving individual performance uses super-visory ratings that reflect behaviors rather than results (Aguinis, 2013),and, for decades, supervisors have been trained to place workers alonga normal distribution (Motowidlo & Borman, 1977; Reilly & Smither,1985; Schneier, 1977). Finally, there is some research conceptualizingperformance in terms of results that has also shown a normal pattern.Specifically, Schmidt and Hunter compared the best and worst workers’productivity over 40 samples and concluded that, “[t]he low levels ofvariability for [the estimated population standard deviation] across jobsindirectly supports the assumption of normality of the output distribution”(Schmidt & Hunter, 1983, p. 410). However, of the 40 studies included intheir meta-analysis, 38 were conducted in the manufacturing sector.
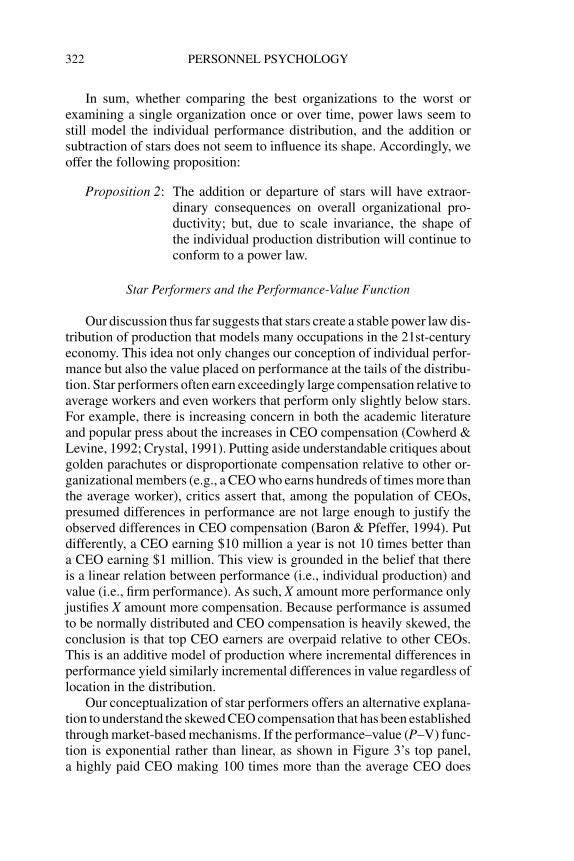
Given important changes in the economy from manufacturing toknowledge, organizations have changed from hierarchies to webs, cap-ital has changed from land and resources to people and innovation,and work itself has changed from scripted duties to complex interac-tions. Accordingly, we may not be able to extrapolate the distributionof performance from 20th-century manufacturing environments to 21st-century knowledge-based organizations. More specifically, the distribu-tion of worker productivity seems to have changed from a normal distri-bution with limited variability to a distribution that allows stars to emerge(O’Boyle & Aguinis, 2012). One potential answer to the shape of produc-tion in the 21st-century workplace is a power law distribution. Althoughnormal distributions are defined by their midpoints, power law distribu-tions are defined by their tails. Put differently, instead of a massive groupof average performers dominating production through sheer numbers, asmall group of elite performers seem to dominate production throughmassive performance.
318 PERSONNEL PSYCHOLOGY
Figure 1: Normal Distribution Overlaying a Power Law Distribution.
Power law distributions, such as the one overlaying a normal distribu-tion in Figure 1, are found in a number of contexts such as biodiversity(Crawley & Harral, 2001), crime waves (Johnson, 2008), stock marketperformance (Gabaix, Gopikrishnan, Plerou, & Stanley, 2003), and in-creasingly among jobs that comprise the modern economy. For example,in entrepreneurship research, star effects are so extensive that nearly ev-ery metric of productivity including sales, profits, and growth requireslog transformations to create a distribution more aligned with theoreticaland statistical assumptions based on normality (e.g., Audretsch, Dagnino,Faraci, & Hoskisson, 2010). For scientists, inventions and innovationswhether quantified in frequency or returns on investment show a powerlaw distribution with the top decile capturing between 48% and 93%of the patents and National Science Foundation grants (Marsili, 2005;Scherer & Harhoff, 2000). In addition, sales positions and jobs withcomplex, nonscripted duties (e.g., dentists, physicians, attorneys) showextreme variances and highly skewed distributions relative to their bluecollar and low-complexity counterparts (Schmidt, Hunter, & Judiesch,1990). Even in industries where one might expect a normal distributionsuch as the military, given their emphasis on uniformity, hierarchy, andregimented activity, stars still emerge when performance is operational-ized based on outcomes such as the number of downed aircraft (Toliver &Constable, 1998). Most recently, O’Boyle and Aguinis (2012) conducteda study involving 198 samples of academics, athletes, entertainers, and
AGUINIS AND O’BOYLE 319
politicians and found 94% of the samples better conformed to a powerlaw distribution than a normal distribution.
In sum, evidence for a normal distribution of production is primarilyfound among two sources: low-complexity jobs that reflect the prominentindustries of the 20th-century workplace (Boisot & McKelvey, 2010;Schmidt et al., 1990) and samples that rely exclusively on ratings ofbehavior (as opposed to actual production or results). Alternatively, powerlaw distributions seem to best model productivity among the types ofjobs found in the sales, service, technology, research, and white-collarsectors as well as the high-complexity occupations and industries thatare increasingly dominating the 21st-century workplace. Accordingly, weoffer the following proposition:
Proposition 1: In organizations that adapt to and typify the 21st-century workplace of increased job complexity, re-duced situational constraints, and flexible hierarchies,the distribution of individual performance will be bet-ter modeled by a power law compared to a normaldistribution.
If star presence creates a power law distribution, their exit may elimi-nate it. However, if certain properties of power laws extend to individualperformance, then the shape of the distribution may remain unchangedeven if star performers leave. This is because dynamic systems, be theygenetic (Weng, Bhalla, & Iyengar, 1999), biological (Koch & Laurent,1999), ecological (Gallagher & Appenzeller, 1999), social (Barabasi &Albert, 1999; Watts, 2003), economic (Podobnik, Fu, Jagric, Grosse, &Stanley, 2006; Scheinkman & Woodford, 1994), or finance based(Andriani & McKelvey, 2009; Aoyama, Yoshikawa, Iyetomi, &Fujiwara, 2010; Arthur, 1994; Souma, et al., 2006), demonstrate a prop-erty of power laws known as scale invariance. Sometimes referred to asfourth dimension modeling or fractal geometry, the classic example isa cauliflower stalk where a branch can be cut from the stalk, a smallerbranch can be cut from the first branch, and so on. When the branchesare lined up, they all maintain the same shape and structure (Mandelbrot,1982).
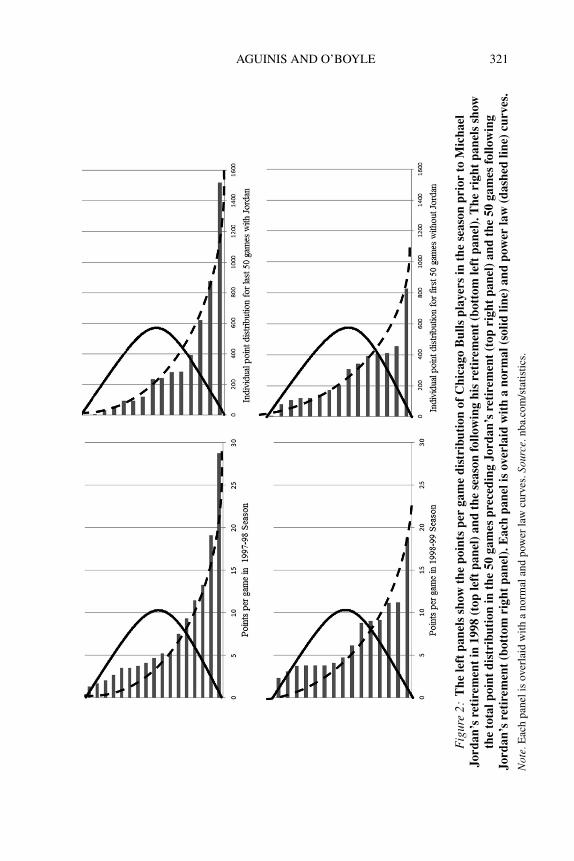
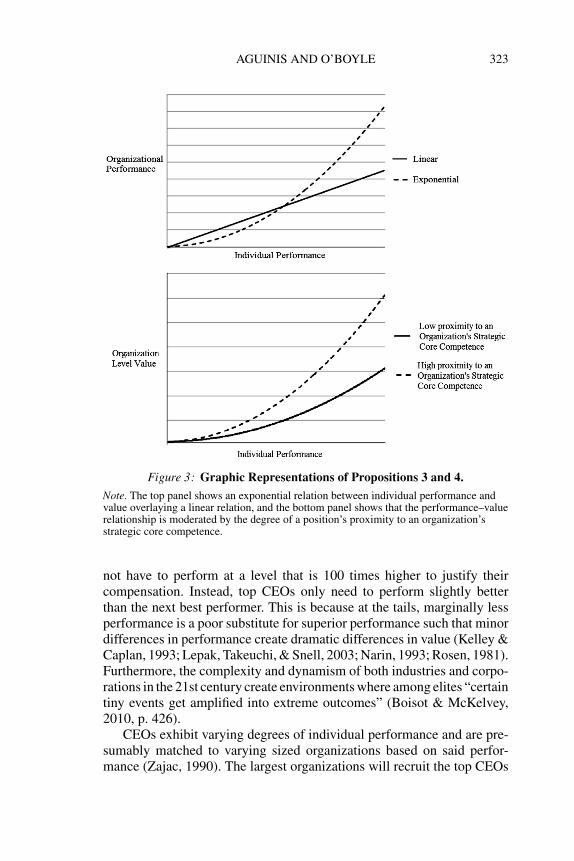
If the property of scale invariance extends to worker production,the shape of the performance distribution will be the same for grow-ing, stagnant, and declining organizations. For example, consider starsin professional basketball. Michael Jordan led the Chicago Bulls to sixNational Basketball Association (NBA) championships in 8 years dur-ing which time he was named NBA’s Most Valuable Player five times.While a member of the team, the distribution of points scored conformedto a power law with Jordan at the tail of the distribution dominating
320 PERSONNEL PSYCHOLOGY
offensive productivity. This is consistent with Proposition 1. But, whatmakes Michael Jordan a particularly interesting case is that he retiredtwice from the Bulls, once in 1993 and again in 1998. The effect at the or-ganizational level following these retirements was disastrous, particularlyin 1998 when the Chicago Bulls went from winning three consecutivechampionships to becoming the worst team in their conference. However,despite the tremendous cost to organizational success and significant dropin individual player production (i.e., points per game), the right panels ofFigure 2 show that the shape of the point distributions for the 50 priorto Jordan’s retirement and 50 games after his retirement are nearly iden-tical.1 The loss of Jordan had a profound impact on every aspect of theBulls’ performance and success, except the shape of the distribution ofindividual performance.
Michael Jordan was a high-profile star that fundamentally altered theindustry he worked in, but star distributions and scale invariance maybecome increasingly common among 21st-century jobs. In the words ofBill Gates, “A great lathe operator commands several times the wage ofan average lathe operator, but a great writer of software code is worth10,000 times the price of an average software writer” (Veksler, 2010,point 2). There is empirical evidence to support Gates’ claim as the dis-tribution of programmer performance follows a nonnormal distributionthat is consistent across task (e.g., debugging programs, writing code) andexperience (e.g., novice or experienced programmers; Curtis, Sheppard,Milliman, Borst, & Love, 1979; Darcy & Ma, 2005; DeMarco & Lister,1985; Sackman, Erikson, & Grant, 1968).
As an additional example, a study involving the number of scholarlypublications produced by researchers in 178 radiology departments par-ticipating in the National Resident Matching Program found that a powerlaw distribution resulted in better-fit indexes compared to a normal dis-tribution (Morelli & Bokhari, 2013). Moreover, results suggested scaleinvariance because a power law distribution had a better fit to the dataregardless of whether analyses were based on the total number of 14,219journal articles produced by 163 departments from 1987 to present oronly a subset of 4,252 journal articles produced by 142 departments thatappeared in the past decade only.
Finally, scale invariance is also likely to be observed in jobs that re-quire less training and credentials. For example, we gained access to per-formance data for call center representatives described by Grant (in press)and Grant and Sumanth (2009), and results showed that a power lawdistribution emerges whether looking at sales, revenue, or calls per hours.
1Due to a player’s strike in the 1998–99 season that shortened the season to 50 games,we limit the comparison to the 50 games pre- and post-Jordan retirement.
AGUINIS AND O’BOYLE 321
Fig
ure
2:T
hele
ftpa
nels
show
the
poin
tspe
rga
me
dist
ribu
tion
ofC
hica
goB
ulls
play
ers
inth
ese
ason
prio
rto
Mic
hael
Jord
an’s
reti
rem
ent
in19
98(t
ople
ftpa
nel)
and
the
seas
onfo
llow
ing
his
reti
rem
ent
(bot
tom
left
pane
l).T
heri
ght
pane
lssh
owth
eto
talp
oint
dist
ribu
tion
inth
e50
gam
espr
eced
ing
Jord
an’s
reti
rem
ent
(top
righ
tpa
nel)
and
the
50ga
mes
follo
win
gJo
rdan
’sre
tire
men
t(b
otto
mri
ght
pane
l).E
ach
pane
lis
over
laid
wit
ha
norm
al(s
olid
line)
and
pow
erla
w(d
ashe
dlin
e)cu
rves
.N
ote.
Eac
hpa
neli
sov
erla
idw
itha
norm
alan
dpo
wer
law
curv
es.S
ourc
e.nb
a.co
m/s
tatis
tics.
322 PERSONNEL PSYCHOLOGY
In sum, whether comparing the best organizations to the worst orexamining a single organization once or over time, power laws seem tostill model the individual performance distribution, and the addition orsubtraction of stars does not seem to influence its shape. Accordingly, weoffer the following proposition:
Proposition 2: The addition or departure of stars will have extraor-dinary consequences on overall organizational pro-ductivity; but, due to scale invariance, the shape ofthe individual production distribution will continue toconform to a power law.
Star Performers and the Performance-Value Function
Our discussion thus far suggests that stars create a stable power law dis-tribution of production that models many occupations in the 21st-centuryeconomy. This idea not only changes our conception of individual perfor-mance but also the value placed on performance at the tails of the distribu-tion. Star performers often earn exceedingly large compensation relative toaverage workers and even workers that perform only slightly below stars.For example, there is increasing concern in both the academic literatureand popular press about the increases in CEO compensation (Cowherd &Levine, 1992; Crystal, 1991). Putting aside understandable critiques aboutgolden parachutes or disproportionate compensation relative to other or-ganizational members (e.g., a CEO who earns hundreds of times more thanthe average worker), critics assert that, among the population of CEOs,presumed differences in performance are not large enough to justify theobserved differences in CEO compensation (Baron & Pfeffer, 1994). Putdifferently, a CEO earning $10 million a year is not 10 times better thana CEO earning $1 million. This view is grounded in the belief that thereis a linear relation between performance (i.e., individual production) andvalue (i.e., firm performance). As such, X amount more performance onlyjustifies X amount more compensation. Because performance is assumedto be normally distributed and CEO compensation is heavily skewed, theconclusion is that top CEO earners are overpaid relative to other CEOs.This is an additive model of production where incremental differences inperformance yield similarly incremental differences in value regardless oflocation in the distribution.
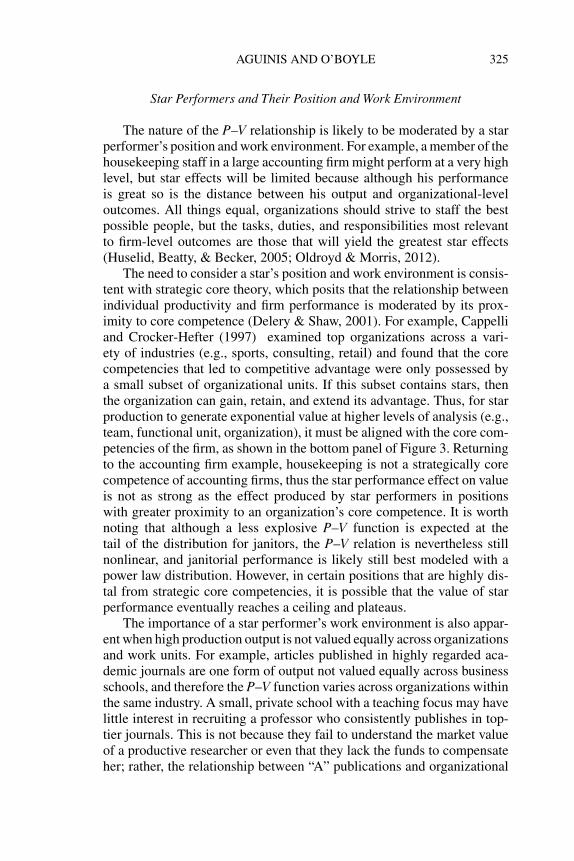
Our conceptualization of star performers offers an alternative explana-tion to understand the skewed CEO compensation that has been establishedthrough market-based mechanisms. If the performance–value (P–V) func-tion is exponential rather than linear, as shown in Figure 3’s top panel,a highly paid CEO making 100 times more than the average CEO does
AGUINIS AND O’BOYLE 323
Figure 3: Graphic Representations of Propositions 3 and 4.Note. The top panel shows an exponential relation between individual performance andvalue overlaying a linear relation, and the bottom panel shows that the performance–valuerelationship is moderated by the degree of a position’s proximity to an organization’sstrategic core competence.
not have to perform at a level that is 100 times higher to justify theircompensation. Instead, top CEOs only need to perform slightly betterthan the next best performer. This is because at the tails, marginally lessperformance is a poor substitute for superior performance such that minordifferences in performance create dramatic differences in value (Kelley &Caplan, 1993; Lepak, Takeuchi, & Snell, 2003; Narin, 1993; Rosen, 1981).Furthermore, the complexity and dynamism of both industries and corpo-rations in the 21st century create environments where among elites “certaintiny events get amplified into extreme outcomes” (Boisot & McKelvey,2010, p. 426).
CEOs exhibit varying degrees of individual performance and are pre-sumably matched to varying sized organizations based on said perfor-mance (Zajac, 1990). The largest organizations will recruit the top CEOs
324 PERSONNEL PSYCHOLOGY
and compensate them exponentially more than smaller organizations.Beyond their capacity to pay more, larger organizations compensate theirCEOs more because they have more at stake than smaller organizations.For CEOs in large corporations in the United States, compensation in-creased 600% between 1980 and 2003 (Gabaix & Landier, 2008). Thisrepresents many millions of dollars in pay raises for these top CEOs, butthis must be contextualized with the fact that among these same firmsthe six-fold increase in pay corresponded to a six-fold increase in marketcapitalization (Gabaix & Landier, 2008). The small differences in CEOperformance among firms at the tails yielded exponential differences invalue for the organizations that employed them.
Consistent with our arguments, in industries such as entertainment andin certain occupations such as CEO, labor economics research shows anexponential P–V function (Ikeda, Aoyama, Iyetomi, Fujiwara, & Souma,2008). Moreover, it seems that nonlinear P–V functions may become thenorm as in industries and occupations beyond entertainment and CEObecause many jobs in the knowledge economy require a great deal ofinnovation and cannot be scripted as easily as those jobs in the manufac-turing economy (Cascio & Aguinis, 2008). In other words, it seems that the21st-century workplace no longer restricts variance in the same manneras the 20th-century workplace, and this creates the potentiality for stars todistance themselves so greatly from the average worker in terms of valueadded (Lepak & Snell, 2002; Oldroyd & Morris, 2012). Accordingly, weexpect that many occupations in the 21st-century workplace will conformto a similar exponential relation between performance and value. For ex-ample, sales managers typically find that 80% of unit sales are attributableto 20% of their workforce (Aoyama et al., 2010). An examination acrossmultiple industries at multiple time points suggests that the P–V functionis exponential with the top decile of performers contributing an averageof 30.1% of the total production, whereas the top quartile produced inexcess of 50% (O’Boyle & Aguinis, 2012). The best performers dominateproduction, but the difference in their individual output relative to theirpeers is often small when contrasted with the differences in resulting valueto the organization (Crain & Tollison, 2002). Returning to the top panelof Figure 3, small differences at the tails of the performance distributionlikely create very large differences in value. Using conservative estimates,we propose that:
Proposition 3: Within similar organizational positions, the relationbetween performance and value will follow an ex-ponential function with approximately 30% of valuevested in the top decile of workers and 50% of valuevested in the top quartile.
AGUINIS AND O’BOYLE 325
Star Performers and Their Position and Work Environment
The nature of the P–V relationship is likely to be moderated by a starperformer’s position and work environment. For example, a member of thehousekeeping staff in a large accounting firm might perform at a very highlevel, but star effects will be limited because although his performanceis great so is the distance between his output and organizational-leveloutcomes. All things equal, organizations should strive to staff the bestpossible people, but the tasks, duties, and responsibilities most relevantto firm-level outcomes are those that will yield the greatest star effects(Huselid, Beatty, & Becker, 2005; Oldroyd & Morris, 2012).
The need to consider a star’s position and work environment is consis-tent with strategic core theory, which posits that the relationship betweenindividual productivity and firm performance is moderated by its prox-imity to core competence (Delery & Shaw, 2001). For example, Cappelliand Crocker-Hefter (1997) examined top organizations across a vari-ety of industries (e.g., sports, consulting, retail) and found that the corecompetencies that led to competitive advantage were only possessed bya small subset of organizational units. If this subset contains stars, thenthe organization can gain, retain, and extend its advantage. Thus, for starproduction to generate exponential value at higher levels of analysis (e.g.,team, functional unit, organization), it must be aligned with the core com-petencies of the firm, as shown in the bottom panel of Figure 3. Returningto the accounting firm example, housekeeping is not a strategically corecompetence of accounting firms, thus the star performance effect on valueis not as strong as the effect produced by star performers in positionswith greater proximity to an organization’s core competence. It is worthnoting that although a less explosive P–V function is expected at thetail of the distribution for janitors, the P–V relation is nevertheless stillnonlinear, and janitorial performance is likely still best modeled with apower law distribution. However, in certain positions that are highly dis-tal from strategic core competencies, it is possible that the value of starperformance eventually reaches a ceiling and plateaus.
The importance of a star performer’s work environment is also appar-ent when high production output is not valued equally across organizationsand work units. For example, articles published in highly regarded aca-demic journals are one form of output not valued equally across businessschools, and therefore the P–V function varies across organizations withinthe same industry. A small, private school with a teaching focus may havelittle interest in recruiting a professor who consistently publishes in top-tier journals. This is not because they fail to understand the market valueof a productive researcher or even that they lack the funds to compensateher; rather, the relationship between “A” publications and organizational
326 PERSONNEL PSYCHOLOGY
success is less curved or less exponential as it is at a more research-orienteduniversity (see Figure 3, bottom panel). The strategic core competence ofa teaching school is based on knowledge dissemination rather than knowl-edge creation, and to recruit a top researcher would not leverage resourcesefficiently (Humphrey, Morgeson, & Mannor, 2009). It is worth mention-ing that although the P–V function is likely to be less explosive at thetail, if the property of scale invariance applies (as noted in Proposition 2),then there will still be research stars at these small schools who contributea disproportionate production relative to their colleagues. The shape ofthe individual performance distribution remains constant even though theP–V function varies. In sum,
Proposition 4: The exponential relationship between individual per-formance and value will be moderated by a position’sdegree of proximity to an organization’s strategic corecompetence such that the relationship will becomemore curved as proximity increases.
To summarize our discussion thus far, star performers seem to existacross many occupations and organizational contexts, and their presencecreates a distribution better modeled with power laws compared to a nor-mal distribution (as shown in Figure 1). Stars seem to dominate the totalproduction of growing, failing, and stable organizations, and althoughtheir turnover can be disastrous to overall production, the shape of theindividual performance distribution in an organization is predicted to berelatively constant (as shown in Figure 2). Furthermore, we hypothesizedthat stars create extraordinary value such that the relation between perfor-mance and value is exponential with a sharp steepening of value foundat the tail of the performance distribution (as shown in the top panel ofFigure 3). The greatest exponential value of star production is predicted tobe in organizations and work units that attract and retain elite performersto positions with tasks, duties, and responsibilities most relevant to theirstrategic core competencies (as shown in the bottom panel of Figure 3).Next, we discuss how our reconceptualization of the individual perfor-mance distribution has the potential to account for presumed “anomalies”in previous empirical results as well as inconsistencies in establishedtheories.
Star Performers and the Power Law Performance Distribution: Accountingfor Anomalous Empirical Results and Theoretical Inconsistencies
Scientific fields often operate under untenable assumptions thatare nevertheless necessary conveniences. For example, neoclassical
AGUINIS AND O’BOYLE 327
economics assumes rationality and full information in transactions, nei-ther of which are met in practice (Sen, 1977; Simon, 1986; Slovic,Finucane, Peters, & MacGregor, 2002). However, despite these faultyassumptions, economics researchers have produced theoretical insightsthat can often lead to satisfactory predictions (Becker, 1962). If currentmanagement theories could predict and explain individual performanceaccurately, then reconceptualizing the distribution of performance fol-lowing a power law instead of a normal curve would not seem neces-sary. Unfortunately, the current state of the science is that our ability topredict individual productivity (i.e., observed validity coefficients relat-ing preemployment test scores and performance measures) has changedvery little over the past 50 years. Without a series of statistical correc-tions, even the best predictors correlate with job performance no higherthan r = .30 (Salgado et al., 2003) and multipredictor tests of theo-ries rarely account for even half of the total variance in individual per-formance scores. Thus, despite more than half a century of new the-ories, new constructs, new measures, and new analytic techniques, theincrease in predictive accuracy of individual performance has been mod-est. Perhaps it is not deficient theories, measures, or theories that hamperprogress but that we need to revisit our understanding of the performancedistribution.
Next, we outline how a reconceptualized performance distribution andthe presence of star performers can serve as an explanatory framework formany of the presumed “anomalies” in previous empirical results as well asinconsistencies in established theories. Although we see star productionas potentially affecting all management theories addressing individualperformance directly or indirectly, we focus on two areas that have bothindividual- and firm-level consequences and are likely to require importanttheoretical revision. First, we examine how human capital (HC) changes asa result of most production deriving from a small minority of workers andwhat effect this has on theories such as the resource-based view (RBV) andthe attraction-selection-attrition (ASA) model. Second, we discuss effectsof stars and a power law performance distribution on theories regardingvoluntary turnover and compensation.
Human Capital
RBV emphasizes HC as key to sustained competitive advantage(Barney, 1991; Barney, Ketchen, & Wright, 2011; Coff & Kryscynski,2011; Foss, 2011). Because RBV was primarily applied to firm-levelresearch, little attention has been given to individual variations in work-ers. However, when the microfoundations of HC were sought, a para-dox emerged. In order for HC to become a competitive advantage, it
328 PERSONNEL PSYCHOLOGY
must be valuable, rare, inimitable, and nonsubstitutable (Barney, 1991). Ifproduction is normally distributed then the majority of HC is found nearthe center of the distribution. The paradox is that HC becomes competitiveadvantage through workers that are the most plentiful, produce averagevalue, and whose outputs are easily imitated and substituted. The paradoxcan only be addressed by speculating that the sum must be greater thanthe parts, and this has bred a number of Gestaltian theories of HC. Forexample, the ASA model (Schneider, 1987) posits that through attraction,selection, and attrition, organizational members’ knowledge, skills, andabilities (KSAs) homogenize, and this allows HC to more easily aggregateup and create competitive advantage (Ployhart, Weekley, & Baughman,2006). The aggregation is necessary because under the assumption ofa normal distribution, individual workers have little influence on higherlevels of the organization, and the only way HC becomes competitiveadvantage is through group-level phenomena such as culture and norms(Schneider, 1987).
These types of HC models seem most viable in organizations thatstrove for efficiencies through economies of scale where uniformity ofworkers was important—just as important as uniformity of products(Groshen, 1991). Homogeneous workers on an assembly line behavealike, resulting in no worker holding up the line and no worker wait-ing idly for the others to catch up. The similarity breeds commitment,satisfaction, and reduced conflict, and it also frees up resources at the or-ganizational level because it makes it easier for the human resources func-tion to establish practices and thresholds for job applicants and trainees.Furthermore, management only need be concerned with those who deviatefrom the group (i.e., management by exception), and compensation canbe broadly applied as workers who share attitudes, KSAs, and behaviorsare also likely to share motivations and expectancies (Coff & Kryscynski,2011; Mossholder, Richardson, & Settoon, 2011; Ployhart & Moliterno,2011).
In contrast, HC in 21st-century organizations seems to be generatedprimarily by stars, and many of the tenets of aggregation models such as theASA no longer apply. First, a homogenous workforce is best able to createa homogenous product, but when presented with novel problems, as is sooften the case in the 21st-century workplace, diversity and heterogeneityin work groups is an asset and avoids many of the pitfalls of groupthink(Forbes & Milliken, 1999). Second, hypercompetitive environments aretypified by quick change and rapid obsolescence (Cascio & Aguinis, 2008;Powell & Snellman, 2004). This makes specialization critical and KSAhomogeneity impractical. By the time an organization achieves homo-geneity for a specific set of KSAs, those KSAs are likely to be obsolete.
AGUINIS AND O’BOYLE 329
Third, if broad human resources policies, especially those concerned withcompensation, are applied to stars, there would be a disparity between theextreme production of the elite and the modest increases in rewards offeredby the organization (i.e., reward omission; Hinkin & Schriesheim, 2008).Finally, much of the benefit derived from homogeneity is in the form oforganizational culture and production norms created through proximityand repeated interactions with peers. With the rise in telecommuting, out-sourcing, crowdsourcing, and alternative work arrangements, many of theadvantages of homogeneity due to proximity are lost (Ashford, George, &Blatt, 2007).
Our discussion of star performers offers an alternative explanationfor how HC results in organizational-level competitive advantage. Starspossess HC that does not require aggregation to influence firm-level out-comes. Their output is so immense that it directly affects performance atthe firm level and makes this small minority of workers both valuable andrare. Furthermore, star production is nonadditive and not replaceable withmultiple average workers or less productive alternatives (Rosen, 1981),thus avoiding the microfoundation paradox. As such, a view of HC basedon the perspective that performance is distributed following power lawsavoids the paradoxes of RBV and ASA, and provides a plausible expla-nation compared to other models of HC that suggest homogeneity is anecessary precondition to competitive advantage.
Traditional models of HC that rely on the mean and the constrictionof variance as metrics of competitive advantage implicitly assume thatHC derives from the average quality of resources. In light of a nonnormaldistribution of individual performance, an implication is that the meanquality of resources provides a rather spurious relation to competitiveadvantage that can be explained (or mediated) by the quality of the bestresources. That is, competitive advantage is better described as the HCpossessed by stars. As illustrated in the top panel of Figure 3, we proposethat the bend in the curve is attributable to star effects (e.g., the top decilecontributes more than a quarter of total production). Thus, if most output isattributable to stars, then this is where the source of competitive advantageresides. In short,
Proposition 5: Within the markets and industries that comprise many21st-century workplaces, a firm’s competitive advan-tage will be primarily derived from the proportion ofthe entire set of human resources (i.e., human capi-tal) that can be qualified as being “the best” (i.e., starperformers) rather than the average quality of the re-sources.
330 PERSONNEL PSYCHOLOGY
Turnover and Compensation
The heterogeneity in performance, value, and HC brought on by thenature of work in today’s organizations potentially changes how we viewtheories of turnover. At the individual level, our current understand-ing of turnover is that its relation to performance is curvilinear withlow-producing workers forced out by the organization (i.e., involuntaryand functional turnover) and high-producing individuals leaving for betteropportunities (i.e., voluntary and dysfunctional turnover; Allen, Bryant, &Vardaman, 2010). Given our interest in stars, we focus on the latter group,but it is worth noting that under a normal distribution of productivity, thecurvilinear relation is the optimal form because it retains the portion of thedistribution where most production is derived (i.e., workers clustered atand around the center). We propose that if we continue to apply traditionalmodels based on normality, the curvilinear relation will persist and theseorganizations will retain the majority of their workers. However, whatwill change is that they will lose the majority of their productivity to starturnover.
The change from normal curve to power law will likely require signif-icant alterations to turnover theory as well as practice. For example, oneof the most consistent mediators of the various antecedents of voluntaryturnover is job search behavior, particularly at the later stages of the searchprocess where the worker actively contacts a prospective employer (Hom,Caranikas-Walker, Prussia, & Griffeth, 1992). This contact is proposedto be the final phase in the causal sequence and the most closely relatedto turnover intention and eventual departure (Steel, 2002). The processmay be particularly important as the weakened economy and high unem-ployment rate reduces most workers’ perception of alternatives and easeof movement. However, this critical construct to voluntary turnover maynot be relevant to stars because they do not need to contact employers.Rather, employers contact them (Capron & Chatain, 2008; Gardner, 2002,2005).
Head hunting and employee poaching of stars place the competingorganization as the active agent in the job search and circumnavigates theplethora of predictors, mediators, and moderators that play such centralroles in current conceptualizations of turnover theory. Although some(e.g., Steel, 2002) have proposed that “spontaneous offers” can acceleratethe job search sequence, the link between stardom and these unsolicitedemployment offers is largely unexplored. Thus, the weak economy maynot serve as a sufficient retention strategy for star performers; in fact, itis likely that the most productive workers have employment alternativesand will be sought after by competitors. In short, we offer the followingproposition:
AGUINIS AND O’BOYLE 331
Proposition 6: The relation between job search behavior and volun-tary turnover will be moderated by worker productionsuch that the relation will be weaker for star performerscompared to nonstars.
Although job search behavior is likely very different for star per-formers, we expect some similarities in other voluntary turnover an-tecedents. For example, we expect that breaches in psychological contract,perceptions of workplace injustice, and workplace incivility will all playa role in a star’s decision to leave in a similar manner to the role theyplay in the turnover decision of nonstars. However, stars and a power lawdistribution of production raise two important implications. First, as statedearlier, stars are highly desired assets, and because of this their turnoverthreshold for perceived contract breaches, injustice, and incivility is likelyto be lower compared to their nonelite counterparts.
The second implication is related to compensation. Compensation isone of the primary sources where a worker assesses or perceives thevalue their organization places on them (Aguinis, Gottfredson, & Joo,2012), and the rise of stars seems to necessitate a paradigm shift in mosttheories of compensation. Compensation systems that best retain starswill require considerably higher pay for elites and will also likely entailidiosyncratic work arrangements (I-deals; Rousseau, Ho, & Greenberg,2006). Both of these strategies can have a deleterious effect on the retentionof nonelites and may lead to higher overall voluntary turnover (Rousseauet al., 2006). One reason for this is that increased pay for elites willcreate pay dispersion. If stars are compensated in ways reflective of theircontribution, then it is possible that top performers may not earn just a bitmore than their peers; rather, the pay disparity between elite and nonelitecould rise to 5-, 10-fold, or even higher. This is not likely to happen whena normal distribution is forced upon salary structures. But, when a “pure”pay for performance system (e.g., straight commission) is applied, paydispersion seems quite certain.
Research on the effects of pay dispersion is mixed (Bloom & Michel,2002; Harrison & Klein, 2007; Pfeffer & Langton, 1993) but these resultsmay be indicative of not differentiating between more traditional jobs thatoperated in static environments with relatively homogeneous productionfrom many current jobs that operate in dynamic environments with hetero-geneous worker output. Among occupations where productivity naturallyfollows a normal curve, as was the case in much of the manufacturingeconomy of the 20th century, pay dispersion related negatively to higherlevels of performance, as heterogeneous compensation did not map wellonto relatively homogeneous performance (Bloom, 1999). However, inmost 21st-century industries where power laws are likely to apply and
332 PERSONNEL PSYCHOLOGY
stars drive production, pay dispersion relates positively to higher levelsof performance as compensation accurately reflects the extensive hetero-geneity in individual production levels. The change in the relation betweenpay dispersion and higher levels of performance is reflective of the changein the nature of production from normal to power law. For example, Trevor,Reilly, and Gerhart (2012) found that when pay dispersion is the result ofrewarding stars, the consequences are improved overall performance andgreater retention of outstanding performers.
Beyond pay, more heterogeneity in performance will demand moreheterogeneity in other forms of compensation. That is, stars not onlyrequire higher wages (Scully, 1999), they may more readily engage inI-deals with their employer. Rousseau (2001) recounts the story of VickyKing’s tenure at Amerco where she found a number of strategically coreindividuals engaged in I-deals ranging from taking a year off to do under-water photography to being allowed 2 hours each morning to run a sidebusiness. King was initially appalled by what she perceived as superfluouswork arrangements, but the supervisors of these I-deal recipients offeredone consistent explanation, “I can’t lose my best people” (Hochschild,1997).
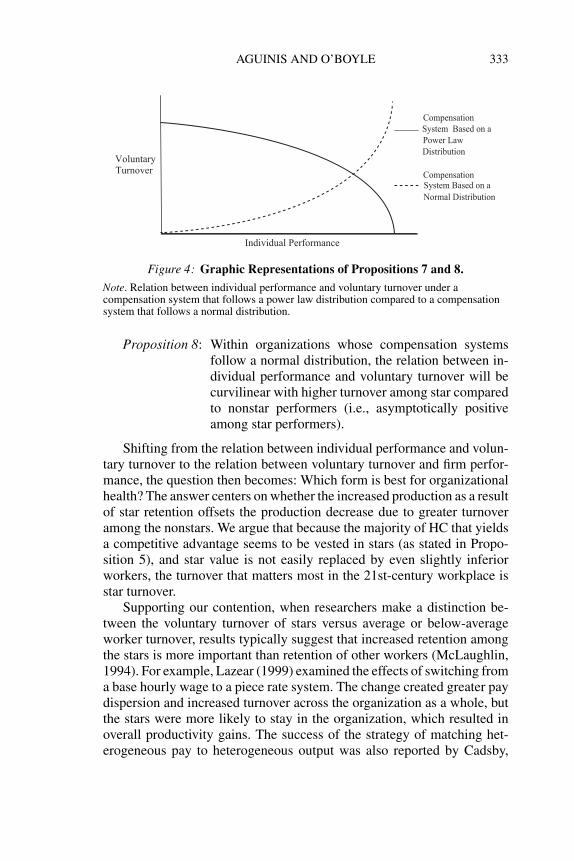
I-deals increase the retention of stars, but they can also foster animosityand perceptions of injustice among those not receiving them, especiallywhen the justification for preferential treatment is not clearly explained(Rousseau et al., 2006; Shaw & Gupta, 2007). As a result, for the vastmajority of workers who are not stars, the consequence of increased I-deals and rewarding a power law distribution of production with a powerlaw distribution of compensation is likely to increase voluntary turnover.Although nonlinear models of turnover have been offered in the past(e.g., Hausknecht & Trevor, 2011; Jackofsky, Ferris, & Breckenridge,1986; Trevor, Gerhart, & Boudreau, 1997), we propose that not only is therelation curvilinear but that it is moderated by compensation policy towardstars, specifically the extent of pay dispersion and presence of I-deals. Insum, as shown in Figure 4, we hypothesize that practices that retain theaverage worker will be the same practices that encourage the departure ofstar performers and vice versa.
Proposition 7: Within organizations whose compensation systemsfollow a power law distribution, the relation betweenindividual performance and voluntary turnover will becurvilinear with higher turnover among nonstar com-pared to star performers (i.e., asymptotically positiveamong nonstar performers).
AGUINIS AND O’BOYLE 333
Individual Performance
VoluntaryTurnover
CompensationSystem Based on aPower Law Distribution
CompensationSystem Based on aNormal Distribution
Figure 4: Graphic Representations of Propositions 7 and 8.Note. Relation between individual performance and voluntary turnover under acompensation system that follows a power law distribution compared to a compensationsystem that follows a normal distribution.
Proposition 8: Within organizations whose compensation systemsfollow a normal distribution, the relation between in-dividual performance and voluntary turnover will becurvilinear with higher turnover among star comparedto nonstar performers (i.e., asymptotically positiveamong star performers).
Shifting from the relation between individual performance and volun-tary turnover to the relation between voluntary turnover and firm perfor-mance, the question then becomes: Which form is best for organizationalhealth? The answer centers on whether the increased production as a resultof star retention offsets the production decrease due to greater turnoveramong the nonstars. We argue that because the majority of HC that yieldsa competitive advantage seems to be vested in stars (as stated in Propo-sition 5), and star value is not easily replaced by even slightly inferiorworkers, the turnover that matters most in the 21st-century workplace isstar turnover.
Supporting our contention, when researchers make a distinction be-tween the voluntary turnover of stars versus average or below-averageworker turnover, results typically suggest that increased retention amongthe stars is more important than retention of other workers (McLaughlin,1994). For example, Lazear (1999) examined the effects of switching froma base hourly wage to a piece rate system. The change created greater paydispersion and increased turnover across the organization as a whole, butthe stars were more likely to stay in the organization, which resulted inoverall productivity gains. The success of the strategy of matching het-erogeneous pay to heterogeneous output was also reported by Cadsby,
334 PERSONNEL PSYCHOLOGY
Song, and Tapon (2007) who found that systems that encouraged com-pensation heterogeneity were most often selected by better performers andyielded more overall production than homogenous compensation systemspreferred by average performers. Among practitioners in the financial mar-kets, the attraction and loss of star analysts is considered one of the mostinfluential factors in attracting quality initial public offerings (Kessler,2001). There is also evidence that the attraction or loss of a star CEOdirectly influences abnormal stock returns (Falato, Li, & Milbourn, 2009).In sum, we offer the following proposition:
Proposition 9: The impact of turnover on team and organizational-level performance will be moderated such that the re-lation will be positive when turnover among star per-formers is lower relative to nonstars and negative whenturnover among stars is higher relative to nonstars.
Discussion
Our paper addresses the distribution of individual performance and,accordingly, has implications for all theories in the field of managementthat directly or indirectly relate to individual performance. Fields such asorganizational behavior and human resource management have a directinterest in this topic, which permeates theories of leadership, motivation,organizational commitment, and job satisfaction, among others. From theperspective of strategic management studies, a better understanding ofindividual performance is crucial for making progress regarding the mi-crofoundations of strategy, which are the foundations of a field based onindividual actions and interactions (Foss, 2011). For example, Mollick(2012) noted that the overwhelming focus on macrolevel process vari-ables in explaining firm performance, rather than compositional variables(i.e., workers), “has prevented a thorough understanding of which individ-uals actually play a role in determining firm performance [and] to expectthat not all variation among individuals contributes equally to explain-ing performance differences between firms” (pp. 1001–1002). Next, weconsider additional implications of our paper for theory and empiricalresearch, research methodology, and practice. Also, we offer a summaryof these implications in Table 1.
Implications for Theory and Empirical Research
In addition to implications for HC, turnover, and compensation, whichwe discussed earlier, our paper suggests that as the normal distribution and
AGUINIS AND O’BOYLE 335
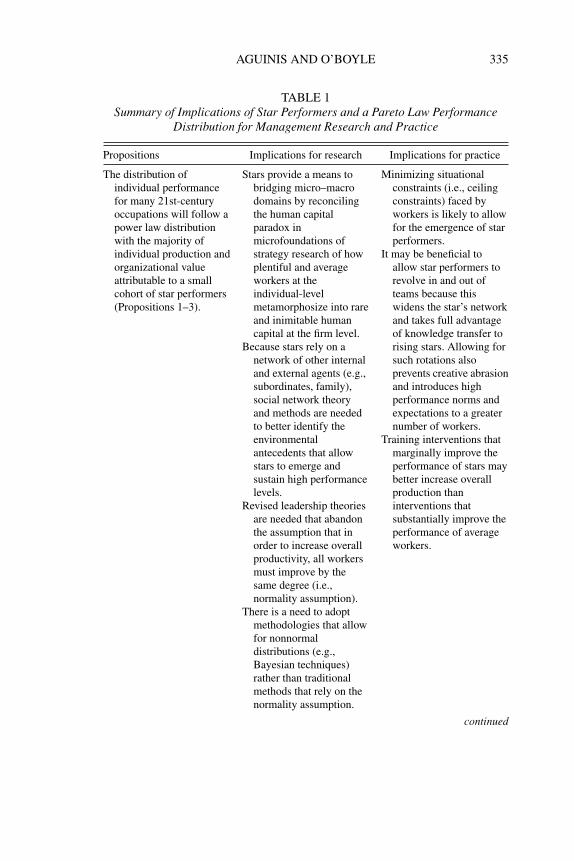
TABLE 1Summary of Implications of Star Performers and a Pareto Law Performance
Distribution for Management Research and Practice
Propositions Implications for research Implications for practice
The distribution ofindividual performancefor many 21st-centuryoccupations will follow apower law distributionwith the majority ofindividual production andorganizational valueattributable to a smallcohort of star performers(Propositions 1–3).
Stars provide a means tobridging micro–macrodomains by reconcilingthe human capitalparadox inmicrofoundations ofstrategy research of howplentiful and averageworkers at theindividual-levelmetamorphosize into rareand inimitable humancapital at the firm level.
Because stars rely on anetwork of other internaland external agents (e.g.,subordinates, family),social network theoryand methods are neededto better identify theenvironmentalantecedents that allowstars to emerge andsustain high performancelevels.
Revised leadership theoriesare needed that abandonthe assumption that inorder to increase overallproductivity, all workersmust improve by thesame degree (i.e.,normality assumption).
There is a need to adoptmethodologies that allowfor nonnormaldistributions (e.g.,Bayesian techniques)rather than traditionalmethods that rely on thenormality assumption.
Minimizing situationalconstraints (i.e., ceilingconstraints) faced byworkers is likely to allowfor the emergence of starperformers.
It may be beneficial toallow star performers torevolve in and out ofteams because thiswidens the star’s networkand takes full advantageof knowledge transfer torising stars. Allowing forsuch rotations alsoprevents creative abrasionand introduces highperformance norms andexpectations to a greaternumber of workers.
Training interventions thatmarginally improve theperformance of stars maybetter increase overallproduction thaninterventions thatsubstantially improve theperformance of averageworkers.
continued
336 PERSONNEL PSYCHOLOGY
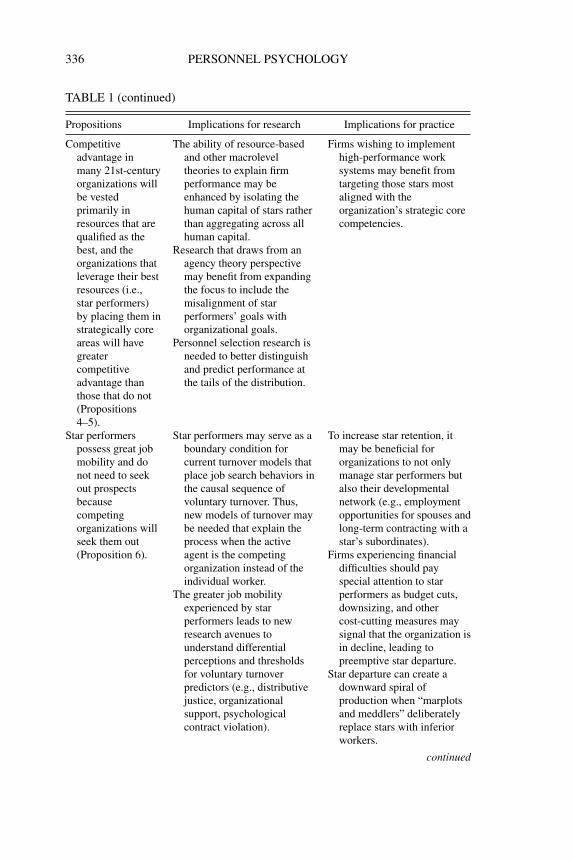
TABLE 1 (continued)
Propositions Implications for research Implications for practice
Competitiveadvantage inmany 21st-centuryorganizations willbe vestedprimarily inresources that arequalified as thebest, and theorganizations thatleverage their bestresources (i.e.,star performers)by placing them instrategically coreareas will havegreatercompetitiveadvantage thanthose that do not(Propositions4–5).
The ability of resource-basedand other macroleveltheories to explain firmperformance may beenhanced by isolating thehuman capital of stars ratherthan aggregating across allhuman capital.
Research that draws from anagency theory perspectivemay benefit from expandingthe focus to include themisalignment of starperformers’ goals withorganizational goals.
Personnel selection research isneeded to better distinguishand predict performance atthe tails of the distribution.
Firms wishing to implementhigh-performance worksystems may benefit fromtargeting those stars mostaligned with theorganization’s strategic corecompetencies.
Star performerspossess great jobmobility and donot need to seekout prospectsbecausecompetingorganizations willseek them out(Proposition 6).
Star performers may serve as aboundary condition forcurrent turnover models thatplace job search behaviors inthe causal sequence ofvoluntary turnover. Thus,new models of turnover maybe needed that explain theprocess when the activeagent is the competingorganization instead of theindividual worker.
The greater job mobilityexperienced by starperformers leads to newresearch avenues tounderstand differentialperceptions and thresholdsfor voluntary turnoverpredictors (e.g., distributivejustice, organizationalsupport, psychologicalcontract violation).
To increase star retention, itmay be beneficial fororganizations to not onlymanage star performers butalso their developmentalnetwork (e.g., employmentopportunities for spouses andlong-term contracting with astar’s subordinates).
Firms experiencing financialdifficulties should payspecial attention to starperformers as budget cuts,downsizing, and othercost-cutting measures maysignal that the organization isin decline, leading topreemptive star departure.
Star departure can create adownward spiral ofproduction when “marplotsand meddlers” deliberatelyreplace stars with inferiorworkers.
continued
AGUINIS AND O’BOYLE 337
TABLE 1 (continued)
Propositions Implications for research Implications for practice
Compensation systemsthat follow a normaldistribution will retainaverage workers atthe expense of losingstars, whereascompensationsystems that follow apower lawdistribution will retainstars but lose averageworkers (Propositions7–8). In both cases,there will be an initialdegree of lost overallproductivity, butcompensationsystems that betterretain stars will leadto better overall teamand organizationperformance(Proposition 9).
Theories of voluntaryturnover couldincorporate the polarityof turnover between starsand nonstars. This mayrequire areconceptualization ofturnover that focuses onthe amount ofproductivity lost ratherthan the number ofworkers lost.
Star human capital and starturnover suggest anetwork approach toteams research andanalysis that considersthe differential effects oftie formation betweenmultiple stars and tiesbetween stars andnonstars.
Research on teams isneeded to address theeffect of interactionsbetween star teams bothwithin and outside of theorganization.
Theory and research areneeded that explorealternative conceptions ofteams that allow forindividuals to directlyinfluence group outcomeswithout the mediatingeffect of processes.
Compensation systems maybenefit from conforming tothe distribution ofperformance rather thanattempting to force workersto conform to the establisheddistribution of thecompensation system.
Compensation systems thatbest retain stars will requireconsiderably higher pay forelites and will likely entailidiosyncratic workarrangements (i.e., I-deals).
The justification forpreferential treatment ofstars should be clearlyarticulated to all workers andapplied fairly to reduceunnecessary voluntaryturnover among nonstars.
Compensation should motivatefuture star output not rewarda star’s past glory.
Managers investing adisproportionate amount oftheir resources into stars arelikely to generate greateroverall output and createpositive gain spirals.
Management practices such asnonperformance-basedincentives, limited paydispersion, andlongevity-based promotiondecisions emphasizehomogeneity of workers andare unlikely to motivate stars.
average worker give way to power law distributions and stars, managementtheory and research may need to change the lens through which it viewsthe workplace. Production now seems to be vested in a small number ofworkers at the tail of the distribution rather than a large number of workersin the middle. As such, substantial improvements in average workers mayprovide little value to the organization as a whole, whereas very small
338 PERSONNEL PSYCHOLOGY
changes in the performance of an elite worker may determine whether afirm survives or dies.
Micro (i.e., organizational behavior and human resource management)and macro (e.g., strategy) researchers usually adopt different theoreticaland methodological approaches (Aguinis, Boyd, Pierce, & Short, 2011;Hitt, Beamish, Jackson, & Mathieu, 2007). The propositions we offeredin our paper provide an avenue by which the micro–macro divide may bebridged. Specifically, whereas the macrostudies literature has recognizedthat the individual is the base component of organizational performance(e.g., Felin & Hesterly, 2007), the specific details of how individual work-ers influence higher levels of performance continue to be elusive (Coff &Kryscynski, 2011; Kell, Lubinski, & Benbow, 2013). In our paper, wediscussed how under a star distribution of production RBV avoids theparadox of trying to transform a normal distribution of abundant, averageworkers into valuable, rare, and nonsubstitutable HC. In addition, starsalso provide microfoundations to other macroconcepts such as agencytheory. The central tenet of agency theory is the alignment of individ-ual and organizational goals. This is most often discussed and tested asaligning management goals with owner goals. However, the alignmentof star goals with owner goals is an area of research that is likely to be-come increasingly important. Stars are defined by levels of production thatmeaningfully influence organizational performance, but given that mostconceptions of job performance are that the construct is multifaceted(Bergeron, 2007), aligning the specific facets of job performance to orga-nizational performance is paramount, otherwise the excess production ofthe star is wasted. For example, in the mid-1970s, a rising star in HewlettPackard’s (HP) calculator division offered the blueprints and prototype ofa personal computer five times and was refused by top management allfive times. The designer was outputting star levels of production, but itwas a form of production not consistent with HP’s organizational goals.As such, Steve Wozniak left HP in 1976 with his design of a personalcomputer and cofounded Apple. Thus, in the rapidly transitioning envi-ronment that was the computing industry in the late 1970s, an environmentsimilar to today’s in many respects, the alignment of management’s goalswith ownership’s goals (i.e., increasing share of existing markets) was lessimportant than its misalignment with the star’s goals (i.e., introduction toan emerging market). In areas of management research such as corporateentrepreneurship, where agency theory has been applied in the past (e.g.,Jones & Butler, 1992; Zahra, 1996), a closer consideration of stars mayhelp explain how innovation and elite performance are best leveraged bythe organization through star–owner goal alignment.
Our paper leads to additional implications for future research in otherresearch domains such as teamwork. The dominant conceptualization of
AGUINIS AND O’BOYLE 339
teamwork is the input–process–output model (Stewart & Barrick, 2000)where the relation between member performance and unit-level perfor-mance is fully mediated by team processes (Mathieu, Maynard, Rapp, &Gilson, 2008). Similar to models of HC, team performance relies on ag-gregation to affect higher-level outcomes. However, emerging networkmodels based on stars may provide an alternative direction for theories ofteam production. Specifically, a network perspective where nodes are notequally weighted and ties are not equally likely to form between nodesmay best be able to explain the role of stars on a team and overall teamproduction. Similar to research demonstrating the importance of certainties over others (Crawford & Lepine, 2013), incorporating the presenceof a star will require more advanced conceptions of networks than tradi-tional Bernoulli graphs where all possible distinct ties are independent ofone another. For example, theoretical considerations where the presenceand strength of ties to one individual influence the presence and strengthof ties to other individuals through characteristics of the performer (i.e.,Markov attributes) are needed to understand the influence of the star onthe formation of relationships within the team (Newman, 2001; Robins,Pattison, Kalish, & Lusher, 2007; Snijders, 2002). Specifically, do similarperformance levels discourage or encourage ties between stars? Perhaps“stacking” a team with stars will result in tremendous synergies and out-puts (i.e., a complementary model of star team production), or perhaps thetoo much of a good thing effect (Pierce & Aguinis, 2013) will create anunstable system and production levels less than the sum of their individualcontributions and increased star turnover (e.g., Faraj & Sproull, 2000).
Related to future research on teams, what roles do the links betweenone star team and another star team play? Research increasingly findsthe need for the best workers to have interactions with other elites bothwithin and outside of the organization (Oliver & Liebeskind, 1998; Zucker,Darby, & Brewer, 1998), but it is unclear whether these interactions creategreater volatility in the network by way of member poaching and increasedturnover. As stars increasingly define the new workplace, the issue of timein the formation, performance, and disbanding of teams seems to deservegreater attention (Mitchell & James, 2001).
Finally, future research could examine ties between stars and nonstars.There is a significant team component to stardom as elites rely on devel-opmental networks (Cotton, Shen, & Livne-Tarandac, 2011) and careercommunities (Guimera, Uzzi, Spiro, & Amaral, 2005; Parker, Arthur, &Inkson, 2004) to achieve their massive output. Nonelites are not merelyorbiting the star; they are playing critical roles in the generation of pro-duction. For example, Groysberg and Lee (2009) found that star financialanalysts suffered significant and long-term drops in productivity whenthey changed organizations and did not bring their team with them to
340 PERSONNEL PSYCHOLOGY
the new organization. These cross-level ties between stars and nonstarsmay prove to be an important issue in explaining team performance in the21st-century workplace.
Implications for Research Methodology
The empirical study of star performers requires different methodolog-ical designs and different statistical techniques. For example, split plots,Student’s t, random assignment, and p values were developed for appli-cation in agriculture and manufacturing where many of the usual normal-ity and independence assumptions of Gaussian statistics and the centrallimit theorem hold true. Specifically, these methods and data-analytic ap-proaches are based on the stability of the mean and the finite nature of thestandard deviation. In contrast, a power law distribution has an unstablemean and infinite variance (Andriani & McKelvey, 2007; McKelvey &Andriani, 2005). Traditional methods cannot accommodate power lawswithout compromising the interpretation of findings (i.e., log transforma-tions), deleting data (i.e., dropping outliers), or downwardly weightingthose most responsible for production (e.g., robust regression).
Fortunately, there are research designs and data-analytic approachesmore appropriate for studying stars. Consider the following possibilities.First, stars are embedded in networks, and there is now the ability in socialnetwork analysis for testing hypotheses and using inferential statistics suchas exponential random graph models (Robins, Elliott, & Pattison, 2001;Robins, Pattison, & Elliott, 2001). Second, Bayesian statistics offer thepossibility of specifying the functional form of the distribution of produc-tion a priori, which allows researchers to specify a power law distributionrather than rely exclusively on the normal curve (Kruschke, Aguinis, &Joo, 2012). As a third possibility, Clauset, Shalizi, and Newman (2009) de-veloped and validated a technique for analyzing power law distributionsusing a combination of maximum likelihood estimators and fit indicessuch as the Kolmogorov–Smirnov statistics. In short, recent developmentsin statistical theory and applications have paved the way for a researchagenda focusing on stars and power law distributions of performance.
Implications for Management Practice
The rise of the star performer has the potential to have a profoundimpact on how managers do their job. Management practices of the pastare deeply embedded in homogeneity of workers and normality of out-put. This creates inertia against changing focus from the uniformity ofthe necessary many to the dynamism of the vital few. The discourage-ment of heterogeneous output can be seen in human resources systems
AGUINIS AND O’BOYLE 341
such as nonperformance based incentives, limited pay dispersion, andlongevity-based promotion decisions. These types of practices encouragestar turnover and deincentivize production beyond minimum standards(Huselid, 1995; Shaw & Gupta, 2007). The departure of stars is particu-larly dangerous for firm-level performance because this is not just aboutlosing an elite performer but losing an elite performer to a competitor(Mirvis, 1997). In an unusually vivid description for an academic journalarticle, Bedeian and Armenakis (1998) noted that systems that foster ho-mogeneity at the cost of total output lead to the cesspool syndrome where“marplots and meddlers,” perhaps out of their own inadequacy, seek toreplace departing stars with individuals who perform poorly. The conse-quence is that the “dreck” floats to the top, and within these work units,homogeneity becomes the hallmark of organizational decline.
The implication of stardom for downsizing is particularly relevantgiven the financial difficulties of many firms in today’s economy. Down-sizing may signal to elite workers that the organization is in decline,leading to their preemptive departure (Bedeian & Armenakis, 1998). Inaddition, organizations that in the past have rewarded their stars throughpay increases and idiosyncratic work arrangements may find themselvestempted to oust the very individuals most responsible for their success outof a misguided attempt to cut costs (Cascio, 1993). This is a flawed strat-egy as the output of elites cannot be replaced with inferior workers (Rosen,1981), and organizations may find themselves in the unenviable positionof trying to rehire or, worse yet, contract with the elite for consultantwages (Cascio, 1995).
A consequence of the assumption that workers’ performance is nor-mally distributed is that, to increase productivity, supervisors must movethe entire distribution forward. These practices assume that because mostworkers are at or around the mean, the leader’s job is to only correct thosewho deviate too far from the center (i.e., management by exception). How-ever, focusing on low performers advocates a laissez-faire managementstyle toward stars, which not only misdirects management resources tothose least likely to produce but may also reduce star retention, as beingleft alone is a management practice easily replicated by a competitor. Ourpaper suggests that managers and human resource practitioners may needto accommodate the rise of stars and change focus from the necessarymany to the elite few. Specifically, it seems that leaders must address howto leverage star production by removing unique situational constraints (i.e.,ceiling constraints) and shifting to a network approach of star manage-ment. In other words, it seems that leadership in the new economy requiresthe investment of a manager’s limited pool of resources (e.g., time, effort,rewards) into improving the performance of subordinates most likely toyield the highest payoff (Hobfoll, 1989). The investment with the highest
342 PERSONNEL PSYCHOLOGY
payoff will be stars, as small increases in their performance will yieldexponential increases in value added. The increased production generatessecondary gains for the manager, who can then reinvest in the star, cre-ating positive gain spirals (Hobfoll, 2001). Therefore, for managers, thedisproportionate distributions of subordinate output will require equallydisproportionate distributions of supervisor resources.
For stars, resources are allocated to either increase production or de-crease turnover. Although there is certainly crossover between the two,increased production will largely derive from the removal of unique sit-uational constraints that generally do not affect the majority of workers.For example, suppose that the time it takes to close a sale at a large bro-kerage firm is 1 hour, of which 30 minutes are devoted to paperwork. Ifthe average broker closes two sales in an 8-hour workday, the paperworkis a relatively minor constraint to his or her production. However, for starbrokers, the paperwork creates a ceiling constraint of eight sales a day. Inthis situation, resources (e.g., administrative assistant) should be allocatedto the star in ways that remove or raise the ceiling constraint of paperwork.
The second target of resource allocation is increasing star retention,and an additional implication is that managers may need to shift frommanaging the star to managing the star’s network. Elites rely on develop-mental networks that include extraorganizational members (Parker et al.,2004). For example, in Cotton et al.’s (2011) content analysis of elite per-formers, only 13.5% of a star’s production network consisted of managers.Peers, family, and friends all had similar influence on a star’s production.Resource allocation should consider how to meet the needs of the net-work not just the star. As mentioned earlier, one route to accomplishingthis objective is the implementation of idiosyncratic work arrangementsor I-deals (Rousseau et al., 2006). Because the star’s network is likely notas mobile as the star, reduced turnover can be accomplished by integratingthese extraorganizational individuals into the teams and organizations thatthe star serves. If the network on which the star relies on for intellectualstimulation, emotional support, physical health, and other sources of lifesatisfaction is tied closely to the organization, then this should reduce starturnover. For example, in attracting top candidates in academia, it is notan uncommon practice to help their spouses find employment within thesame university, make special childcare arrangements, and assist with thehome-buying process.
Finally, sustained star production is a concern, and there are manyexamples of star’s past glory leading to overpayment and reduced produc-tion (Byrne, Symonds, & Siler 1991; Malmendier & Tate, 2009). As such,resource allocation that motivates the star and maximizes their positiveinfluence on other workers is critical. For example, revolving stars in andout of teams widens the star’s network and takes full advantage of their
AGUINIS AND O’BOYLE 343
knowledge transfer to rising stars. In addition, this prevents creative abra-sion by reducing repeat collaborations and introduces high performancenorms and expectations to a greater number of workers (Skilton & Dooley,2010). Regardless of past achievement, resources should be allocated inways that increase or at least maintain production in the future (Aguinis,Joo, & Gottfredson, 2013).
Concluding Remarks
The nature of work in the 21st century is quite different from thatof the 20th century. Although industries such as farming and paper arestill important components of the economy in the United States and othercountries, today’s world of work is dominated by organizational settingsbased on a knowledge-intensive economy and the service industry. Ac-cordingly, situational constraints that restricted individual performance inthe past, including geographic distances, lack of good communications,inability to access information and knowledge, and slow technologicaldispersion, are now being minimized by the Internet and increased flowof information and knowledge around the world. Although it is likely thatstar performers have existed throughout history, their presence is particu-larly noticeable across the industries, organizations, and teams that makeup the 21st-century workplace. These star performers are the few individ-uals who account for a disproportionate amount of output in relationshipto their peers. We argued that it is likely that all management theoriesthat address individual performance directly or indirectly may have to berevisited to consider the presence of stars and an underlying power lawdistribution of performance. We hope that our paper will serve as a cat-alyst for future research on a topic that has implications for bridging themuch-lamented micro–macro divide in the field of management. Finally,given the importance of individual performance for firm performance, wealso hope that our paper will lead to future research efforts that will benot only rigorous but also relevant for organizations and society at large.
REFERENCES
Aguinis H. (2013). Performance management (3rd ed.). Upper Saddle River, NJ: Pear-son/Prentice Hall.
Aguinis H, Boyd BK, Pierce CA, Short JC. (2011). Walking new avenues in managementresearch methods and theories: Bridging micro and macro domains. Journal ofManagement, 37, 395–403.
Aguinis H, Gottfredson RK, Joo H. (2012). Using performance management to win thetalent war. Business Horizons, 55, 609–616.
Aguinis H, Gottfredson RK, Joo H. (2013). Best-practice recommendations for defining,identifying, and handling outliers. Organizational Research Methods, 16, 270–301.
344 PERSONNEL PSYCHOLOGY
Aguinis H, Joo H, Gottfredson RK. (2013). What monetary rewards can and cannot do:How to show employees the money. Business Horizons, 56, 241–249.
Allen DG, Bryant PC, Vardaman JM. (2010). Retaining talent: Replacing misconceptionswith evidence-based strategies. Academy of Management Perspectives, 24, 48–64.
Andriani P, McKelvey B. (2007). Beyond Gaussian averages: Redirecting internationalbusiness and management research toward extreme events and power laws. Journalof International Business Studies, 38, 1212–1230.
Andriani P, McKelvey B. (2009). Extremes and scale-free dynamics in organization science.Organization Science, 20, 1053–1071.
Aoyama H, Yoshikawa H, Iyetomi H, Fujiwara Y. (2010). Productivity dispersion: Facts,theory, and implications. Journal of Economic Interaction and Coordination, 5,27–54.
Arthur JB. (1994). Effects of human resource systems on manufacturing performance andturnover. Academy of Management Journal, 37, 670–687.
Ashford SJ, George E, Blatt R. (2007). Old assumptions, new work: The opportunitiesand challenges of research on nonstandard employment. Academy of ManagementAnnals, 1, 65–117.
Audretsch DB, Dagnino GB, Faraci R, Hoskisson RE. (2010). New frontiers in en-trepreneurship. New York, NY: Springer.
Barabasi A-L, Albert R. (1999). Emergence of scaling in random networks. Science, 286,509–512.
Barney JB. (1991). Firm resources and sustained competitive advantage. Journal of Man-agement, 17, 99–120.
Barney JB, Ketchen DJ, Wright M. (2011). The future of resource-based theory: Revital-ization or decline? Journal of Management, 37, 1299–1315.
Baron JN, Pfeffer J. (1994). The social psychology of organizations and inequality. SocialPsychology Quarterly, 57, 190–209.
Becker GS. (1962). Irrational behavior and economic theory. The Journal of PoliticalEconomy, 70, 1–13.
Bedeian AG, Armenakis AA. (1998). The cesspool syndrome: How dreck floats to the topof declining organizations. Academy of Management Executive, 12, 58–67.
Bergeron DM. (2007). The potential paradox of organizational citizenship behavior: Goodcitizens at what cost? Academy of Management Review, 32, 1078–1095.
Berry MJA, Linoff GS. (2004). Data mining techniques for marketing, sales, and customerrelationship management (2nd ed.). Indianapolis, IN: Wiley.
Bloom M. (1999). The performance effects of pay dispersion on individuals and organiza-tions. Academy of Management Journal, 42, 25–40.
Bloom M, Michel JG. (2002). The relationships among organizational context, pay disper-sion, and managerial turnover. Academy of Management Journal, 45, 33–42.
Boisot M, McKelvey B. (2010). Integrating modernist and postmodernist perspectives onorganizations: A complexity science perspective. Academy of Management Review,35, 415–433.
Byrne JA, Symonds WC, Siler HF. (1991). CEO disease. BusinessWeek, 3206, 52–60.Cadsby CB, Song F, Tapon F. (2007). Sorting and incentive effects of pay for performance:
An experimental investigation. Academy of Management Journal, 50, 387–405.Cappelli P, Crocker-Hefter A. (1997). Distinctive human resources are firms’ core compe-
tencies. Organizational Dynamics, 24, 7–22.Capron L, Chatain O. (2008). Competitors’ resource-oriented strategies: Acting on com-
petitors’ resources through interventions in factor markets and political markets.Academy of Management Review, 33, 97–121.
Cascio WF. (1993). Downsizing: What do we know? What have we learned? Academy ofManagement Executive, 7, 95–104.
AGUINIS AND O’BOYLE 345
Cascio WF. (1995). Guide to responsible restructuring. Washington, DC: U.S. Departmentof Labor, Office of the American Workplace.
Cascio WF, Aguinis H. (2008). Staffing twenty-first-century organizations. Academy ofManagement Annals, 2, 133–165.
Cascio WF, O’Connor EJ. (1974). Magnitude estimations of expressions of frequency andamount. Journal of Applied Psychology, 59, 313–320.
Clauset A, Shalizi CR, Newman MEJ. (2009). Power-law distributions in empirical data.SIAM Review, 51, 661–703.
Coff R, Kryscynski D. (2011). Drilling for micro-foundations of human capital–basedcompetitive advantages. Journal of Management, 37, 1429–1443.
Cotton RD, Shen Y, Livne-Tarandach R. (2011). On becoming extraordinary: The contentand structure of the developmental networks of major league baseball hall of famers.Academy of Management Journal, 54, 15–46.
Cowherd DM, Levine DI. (1992). Product quality and pay equity between lower-levelemployees and top management: An investigation of distributive justice theory.Administrative Science Quarterly, 37, 302–320.
Crain WM, Tollison RD. (2002). Consumer choice and the popular music industry: A testof the Superstar Theory. Empirica, 29, 1–9.
Crawford ER, LePine JA. (2013). A configural theory of team processes: Accounting forthe structure of taskwork and teamwork. Academy of Management Review, 38,32–48.
Crystal GS. (1991). In search of excess: The overcompensation of American executives.New York, NY: Norton.
Curtis B, Sheppard SB, Milliman P, Borst MA, Love T. (1979). Measuring the psychologicalcomplexity of software maintenance tasks with the Halstead and McCabe metrics.Software Engineering, IEEE Transactions, 2, 96–104.
Darcy DP, Ma M. (2005). Exploring individual characteristics and programming perfor-mance: Implications for programmer selection. In Proceedings of the 38th AnnualHawaii International Conference on System Sciences, 2005 (HICSS’05) (pp. 1–10).Honolulu, HI: IEEE Computer Society Press.
Davenport TH, Harris J, Shapiro J. (2010). Competing on talent analytics. Harvard BusinessReview, 88, 52–58.
Delery JE, Shaw JD. (2001). The strategic management of people in work organizations:Review, synthesis, and extension. Research in Personnel and Human ResourcesManagement, 20, 165–197.
DeMarco T, Lister T. (1985). Programmer performance and the effects of the workplace.In Proceedings of the 8th International Conference on Software Engineering (pp.268–272). Los Alamitos, CA: IEEE Computer Society Press.
Falato A, Li D, Milbourn T. (2009). Inside the CEO labor market: The role of CEO talentin pay and turnover decisions. Working Paper. Federal Reserve Board.
Faraj S, Sproull L. (2000). Coordinating expertise in software development teams. Man-agement Science, 46, 1554–1568.
Felin T, Hesterly W. (2007). The knowledge-based view, nested heterogeneity, and newvalue creation: Philosophical considerations on the locus of knowledge. Academyof Management Review, 32, 195–218.
Forbes DP, Milliken FJ. (1999). Cognition and corporate governance: Understanding boardsof directors as strategic decision-making groups. Academy of Management Review,24, 489–505.
Foss NJ. (2011). Why micro-foundations for resource-based theory are needed and whatthey may look like. Journal of Management, 37, 1413–1428.
346 PERSONNEL PSYCHOLOGY
Gabaix X, Gopikrishnan P, Plerou V, Stanley HE. (2003). A theory of power law distribu-tions in financial market fluctuations. Nature, 173, 267–270.
Gabaix X, Landier A. (2008). Why has CEO pay increased so much? The Quarterly Journalof Economics, 123, 49–100.
Gallagher R, Appenzeller T. (1999). Beyond reductionism. Science, 284, 79–109.Gardner TM. (2002). In the trenches at the talent wars: Competitive interaction for scarce
human resources. Human Resource Management, 41, 225–237.Gardner TM. (2005). Human resource alliances: Defining the construct and exploring the
antecedents. International Journal of Human Resource Management, 16, 1049–1066.
Gomez-Mejia L, Balkin D. (1992). The determinants of faculty pay: An agency theoryperspective, Academy of Management Journal, 35, 921–955.
Grant A. (in press). Rocking the boat but keeping it steady: The role of emotion regulationin employee voice. Academy of Management Journal.
Grant AM, Sumanth JJ. (2009). Mission possible? The performance of prosocially moti-vated employees depends on manager trustworthiness. Journal of Applied Psychol-ogy, 94, 927–944.
Groshen EL. (1991). Five reasons why wages vary among employers. Industrial Relations:A Journal of Economy and Society, 30, 350–381.
Groysberg B, Lee LE. (2009). Hiring stars and their colleagues: Exploration and exploitationin professional service firms. Organization Science, 20, 740–758.
Guimera R, Uzzi B, Spiro J, Amaral LA. (2005). Team assembly mechanisms determinecollaboration network structure and team performance. Science, 308, 697–702.
Harrison DA, Klein KJ. (2007). What’s the difference? Diversity constructs as separation,variety, or disparity in organizations. Academy of Management Review, 32, 1199–1228.
Hausknecht JP, Trevor CO. (2011). Collective turnover at the group, unit, and organizationallevels: Evidence, issues, and implications. Journal of Management, 37, 352–388.
Hinkin TR, Schriesheim CA. (2008). A theoretical and empirical examination of the trans-actional and non-leadership dimensions of the Multifactor Leadership Questionnaire(MLQ). Leadership Quarterly, 19, 501–513.
Hitt MA, Beamish PW, Jackson SE, Mathieu JE. (2007). Building theoretical and empiricalbridges across levels: Multilevel research in management. Academy of ManagementJournal, 50, 1385–1399.
Hobfoll SE. (1989). Conservation of resources: A new attempt at conceptualizing stress.American Psychologist, 44, 513–524.
Hobfoll SE. (2001). The influence of culture, community, and the nested-self in the stressprocess: Advancing conservation of resources theory. Applied Psychology: An In-ternational Review, 50, 337–370.
Hochschild AR. (1997). When work becomes home and home becomes work. CaliforniaManagement Review, 39, 79–91.
Hom PW, Caranikas-Walker F, Prussia GE, Griffeth RW. (1992). A meta-analytical struc-tural equation analysis of a model of employee turnover. Journal of Applied Psy-chology, 77, 890–909.
Hull CL. (1928). Aptitude testing. Chicago, IL: World Book Company.Humphrey SE, Morgeson FP, Mannor MJ. (2009). Developing a theory of the strategic
core of teams: A role composition model of team performance. Journal of AppliedPsychology, 94, 48–61.
Huselid MA. (1995). The impact of human resource management practices on turnover, pro-ductivity, and corporate financial performance. Academy of Management Journal,38, 635–672.
AGUINIS AND O’BOYLE 347
Huselid MA, Beatty RW, Becker BE. (2005). “A players” or “A positions?” The strategiclogic of workforce management. Harvard Business Review, 83, 110–117.
Ikeda Y, Aoyama H, Iyetomi H, Fujiwara Y, Souma W. (2008). Correlated performance offirms in a transaction network. Journal of Economic Interaction and Coordination,3, 73–80.
Jackofsky E, Ferris K, Breckenridge B. (1986). Evidence for a curvilinear relation-ship between job performance and turnover. Journal of Management, 12, 105–111.
Johnson N. (2008). Mathematics, physics, and crime. Policing, 2, 160–166.Jones G, Butler J. (1992). Managing internal corporate entrepreneurship: An agency theory
perspective. Journal of Management, 18, 733–749.Kell HJ, Lubinski D, Benbow CP. (2013). Who rises to the top? Early indicators. Psycho-
logical Science, 24, 648–659.Kelley R, Caplan J. (1993). How Bell Labs creates star performers. Harvard Business
Review, 71, 128–139.Kessler A. (2001). We’re all analysts now. Wall Street Journal, 30, A18.Koch C, Laurent G. (1999). Complexity and the nervous system. Science, 284, 96–98.Kruschke JK, Aguinis H, Joo H. (2012). The time has come: Bayesian methods for data
analysis in the organizational sciences. Organizational Research Methods, 15, 722–752.
Lazear EP. (1999). Personnel economics: Past lessons and future directions: Presidentialaddress to the society of labor economists, San Francisco, May 1, 1998. Journal ofLabor Economics, 17, 199–236.
Lepak DP, Snell SA. (2002). Examining the human resource architecture: The relationshipsamong human capital, employment, and human resource configurations. Journal ofManagement, 28, 517–543.
Lepak DP, Takeuchi R, Snell SA. (2003). Employment flexibility and firm performance:Examining the interaction effects of employment mode, environmental dynamism,and technological intensity. Journal of Management, 29, 681–703.
Malmendier U, Tate G. (2009). Superstar CEOs. The Quarterly Journal of Economics, 124,1593–1638.
Mandelbrot BB. (1982). The fractal geometry of nature. New York, NY: Freeman and Co.Marsili O. (2005). ‘Inequality’ of innovation: Skewed distributions and the returns to
innovation in Dutch manufacturing. Economics of Innovation and New Technology,14, 83–102.
Mathieu J, Maynard MT, Rapp T, Gilson L. (2008). Team effectiveness 1997–2007: Areview of recent advancements and a glimpse into the future. Journal of Management,34, 410–476.
McKelvey B, Andriani P. (2005). Why Gaussian statistics are mostly wrong for strategicorganization? Strategic Organization, 31, 219–228.
McLaughlin KJ. (1994). Rent sharing in an equilibrium model of matching and turnover.Journal of Labor Economics, 12, 499–523.
Mirvis PH. (1997). Human resource management: Leaders, laggards, and followers.Academy of Management Executive, 11, 43–56.
Mitchell TR, James L. (2001). Building better theory: Time and the specification of whenthings happen. Academy of Management Review, 26, 530–547.
Mollick E. (2012). People and process, suits and innovators: The role of individuals in firmperformance. Strategic Management Journal, 33, 1001–1015.
Morelli JN, Bokhari D. (2013). Distribution of scholarly publications among aca-demic radiology departments. Journal of the American College of Radiology, 10,190–194.
348 PERSONNEL PSYCHOLOGY
Mossholder KW, Richardson HA, Settoon RP. (2011). Human resource systems and helpingin organizations: A relational perspective. Academy of Management Review, 36, 33–52.
Motowidlo SJ, Borman WC. (1977). Behaviorally anchored scales for measuring moralein military units. Journal of Applied Psychology, 62, 177–183.
Narin F. 1993. Technology indicators and corporate strategy. Review of Business, 14, 19–23.National Basketball Association (2012, January). Raw data. Retrieved from NBA.com/
statistics.Newman MEJ. (2001). The structure of scientific collaboration networks. Proceedings of
the National Academy of Sciences, 98, 404–409.O’Boyle EH Jr, Aguinis H. (2012). The best and the rest: Revisiting the norm of normality
of individual performance. PERSONNEL PSYCHOLOGY, 65, 79–119.Oldroyd JB, Morris S. (2012). Catching falling stars: A human resource response to social
capital’s detrimental effect of information overload on star employees. Academy ofManagement Review, 37, 396–418.
Oliver AL, Liebeskind JP. (1998). Three levels of networking for sourcing in-tellectual capital in biotechnology: Implications for studying interorganiza-tional networks. International Studies of Management & Organization, 27, 76–103.
Parker P, Arthur MB, Inkson K. (2004). Career communities: A preliminary exploration ofmember-defined career support structures. Journal of Organizational Behavior, 25,489–514.
Pfeffer J, Langton N. (1993). The effect of wage dispersion on satisfaction, productivity,and working collaboratively: Evidence from college and university faculty. Admin-istrative Science Quarterly, 38, 382–407.
Pierce JR, Aguinis H. (2013). The too-much-of-a-good-thing effect in management. Journalof Management, 39, 313–338.
Ployhart RE, Moliterno TP. (2011). Emergence of the human capital resource: A multilevelmodel. Academy of Management Review, 36, 127–150.
Ployhart RE, Weekley JA, Baughman K. (2006). The struggle and function of humancapital emergence: A multilevel examination of the attraction-selection-attritionmodel. Academy of Management Journal, 49, 661–677.
Podobnik B, Fu D, Jagric T, Grosse I, Stanley HE. (2006). Fractionally integrated processfor transition economics. Physica A, 362, 465–470.
Podsakoff PM, MacKenzie SB, Podsakoff NP, Bachrach DG. (2008). Scholarly influence inthe field of management: A bibliometric analysis of university and author impact onthe management literature during the past quarter century. Journal of Management,34, 641–720.
Powell WW, Snellman K. (2004). The knowledge economy. Annual Review of Sociology,30, 199–220.
Ready DA, Conger JA, Hill LA. (2010). Are you a high potential? Harvard BusinessReview, 88, 78–84.
Reilly RR, Smither JW. (1985). An examination of two alternative techniques to estimatethe standard deviation of job performance in dollars. Journal of Applied Psychology,70, 651–661.
Robins G, Pattison P, Kalish Y, Lusher D. (2007). An introduction to exponential randomgraph (p) models for social networks. Social Networks, 29, 173–191.
Robins GL, Elliott P, Pattison PE. (2001). Network models for social selection processes.Social Networks, 23, 1–30.
Robins GL, Pattison PE, Elliott P. (2001). Network models for social influence processes.Psychometrika, 66, 161–190.
AGUINIS AND O’BOYLE 349
Rosen S. (1981). The economics of superstars. The American Economic Review, 71, 845–858.
Rousseau DM. (2001). The idiosyncratic deal flexibility versus fairness? OrganizationalDynamics, 29, 260–273.
Rousseau DM, Ho V, Greenberg J. (2006). I-Deals: Idiosyncratic terms in employmentrelationships. Academy of Management Review, 31, 977–994.
Sackman H, Erikson WJ, Grant EE. (1968). Exploratory experimental studies comparingonline and offline programming performance. Communications of the ACM, 11,3–11.
Salgado JF, Anderson N, Moscoso S, Bertua C, de Fruyt F, Rolland JP. (2003). A meta-analytic study of general mental ability validity for different occupations in theEuropean community. Journal of Applied Psychology, 88, 1068–1081.
Scheinkman JA, Woodford M. (1994). Self-organized criticality and economic fluctuations.American Economic Review, 84, 417–421.
Scherer F, Harhoff D. (2000). Technology policy for a world of skew-distributed outcomes.Research Policy, 29, 559–566.
Schmidt FL, Hunter JE. (1983). Individual differences in productivity: An empirical testof estimates derived from studies of selection procedure utility. Journal of AppliedPsychology, 68, 407–414.
Schmidt JE, Hunter FL, Judiesch MK. (1990). Individual differences in output variabilityas a function of job complexity. Journal of Applied Psychology, 75, 28–42.
Schneider B. (1987). The people make the place. PERSONNEL PSYCHOLOGY, 40, 437–453.
Schneier CE. (1977). Multiple rater groups and performance appraisal. Public PersonnelManagement, 6, 13–20.
Scully GW. (1999). Free agency and the rate of monopsonistic exploitation in baseball. InJeanrenaud C, Kesenne S (Eds.), Competition policy in professional sports: Europeafter the Bosman case (pp. 59–69). Antwerp, Belgium: Standard Editions.
Sen AK. (1977). Rational fools: A critique of the behavioral foundations of economictheory. Philosophy & Public Affairs, 6, 317–344.
Shaw JD, Gupta N. (2007). Pay system characteristics and quit patterns of good, average,and poor performers. PERSONNEL PSYCHOLOGY, 60, 903–928.
Simon HA. (1986). Rationality in psychology and economics. Journal of Business, 59,209–224.
Skilton P, Dooley K. (2010). The effects of repeat collaboration on creative abrasion.Academy of Management Review, 35, 118–134.
Slovic P, Finucane M, Peters E, MacGregor DG. (2002). Rational actors or rational fools:Implications of the affect heuristic for behavioral economics. Journal of Socio-economics, 31, 329–342.
Snijders T. (2002). Markov chain Monte Carlo estimation of exponential random graphmodels. Journal of Social Structure, 3, 2–40.
Souma W, Aoyama H, Fujiwara Y, Ikeda, Y, Iyetomi H, Kaizoji T. (2006). Correlation inbusiness networks. Physica A, 370, 151–155.
Starbucks Corporation. (2012). FY(2011) Annual Report. SJBQ412OTH-00801.Steel RP. (2002). Turnover theory at the empirical interface: Problems of fit and function.
Academy of Management Review, 27, 346–360.Stewart GL, Barrick MR. (2000). Team structure and performance: Assessing the medi-
ating role of intra-team process and the moderating role of task type. Academy ofManagement Journal, 43, 135–148.
Suellentrop C. (2013, March 30). Divining what’s next for video games. The New YorkTimes. Retrieved from http://www.nytimes.com/2013/03/12/arts/video-games.
350 PERSONNEL PSYCHOLOGY
Thorndike EL. (1913). Educational psychology: Vol. 2. The psychology of learning. NewYork, NY: Teacher’s College Press.
Tiffin J. (1947). Industrial psychology (2nd ed.). New York, NY: Prentice-Hall.Toliver RF, Constable TJ. (1998). Die Deutschen jagdflieger-asse [The German fighter
Curvilinearity and the moderating effects of salary growth and promotions. Journalof Applied Psychology, 82, 44–61.
Trevor CO, Reilly G, Gerhart B. (2012). Reconsidering pay dispersion’s effect on the per-formance of interdependent work: Reconciling sorting and pay inequality. Academyof Management Journal, 55, 585–610.
Vedantam S. (2012, April 6). Indian engineers build a stronger society with school lunchprogram. National Public Radio.
Veksler D. (2010). Some lesser-known truths about programming. Retrieved fromhttp://automagical.rationalmind.net/2010/08/17/some-lesser-known-truths-about-programming/.
Watts D. (2003). Six degrees: The science of a connected age. New York, NY: Norton.Way SA, Lepak DP, Fay CH, Thacker JW. (2010). Contingent workers’ impact on stan-
dard employee withdrawal behaviors: Does what you use them for matter? HumanResource Management, 49, 109–138.
Weng G, Bhalla US, Iyengar R. (1999). Complexity in biological signaling systems. Science,284, 92–96.
Zahra SA. (1996). Governance, ownership, and corporate entrepreneurship: The moderatingimpact of industry technological opportunities. Academy of Management Journal,39, 1713–1735.
Zajac EJ. (1990). CEO selection, succession, compensation and firm performance: A theo-retical integration and empirical analysis. Strategic Management Journal, 11, 217–230.
Zucker LG, Darby MR, Brewer MB. (1998). Intellectual human capital and the birth ofU.S. biotechnology enterprises. American Economic Review, 88, 290–306.