103
STAR Reports – Analyzing Property Level Performance The SHARE Center Supporting Hotel-related Academic Research and Education
| Date post: | 22-Dec-2015 |
| Category: |
Documents |
| Upload: | harold-solomon-ross |
| View: | 216 times |
| Download: | 2 times |

STAR Reports – Analyzing
Property Level Performance
The SHARE CenterSupporting Hotel-related Academic Research and Education

Table of Contents
• STAR Report Foundations
• Introduction to the STAR Report
• Monthly STAR Reports
• Weekly STAR Reports
• Additional Property Reports

STAR Report
Foundations

Affiliations in the Hotel Industry
• Chain – the hotel brand
• Parent Company – the company that includes multiple chains
• Management Company – operates a hotel for another party
• Owner – there are many companies that own hotels
• Asset Management Company – represents the owner
• Membership or Marketing Groups – provide additional benefits to hotels
• Independent hotels – an important part of the industryCopyright 2011 Smith Travel Research

STR Geographic Categorization
• World• Continents: Americas, Europe, Mideast/Africa, Asia Pacific
• Sub-continents – subsets of continents(Americas: North Am., South Am., Central Am., & Caribbean)
• Countries – based on ISO/WTO definitions
• Regions – for certain countries such as US, Canada, UKM(US: New England, Mid Atlantic, Southeast, East North Central, …)
• Markets – for major cities, also non-metro areas(US: 162 markets)
• Tracts – subsets of markets (US: 612 tracts)
• Additional geo. fields: state, county, zip code, city, MSA, lat/long, user-defined
The STAR Report displays Market and Tract data of the subject hotel

STR Markets and Tracts
• STR markets represent both metro and non-metro areas
• Each market contains at least two sub-divisions called tracts (or submarkets outside North America)
• There are 162 US markets and 613 tracts. Over 500 markets worldwide
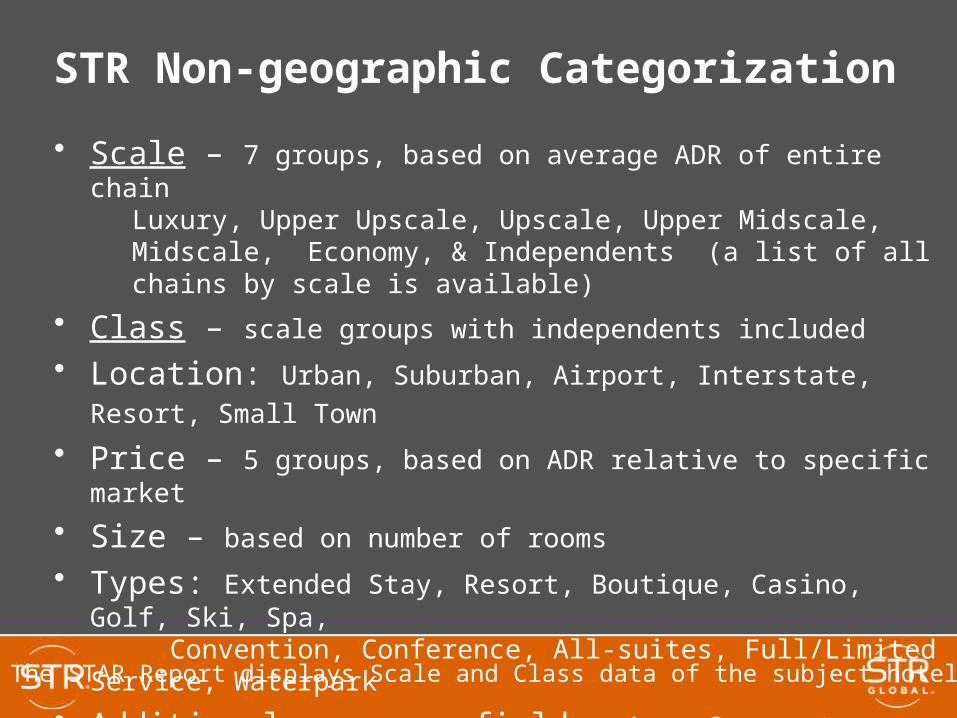
• Scale – 7 groups, based on average ADR of entire chainLuxury, Upper Upscale, Upscale, Upper Midscale, Midscale, Economy, & Independents (a list of all chains by scale is available)
• Class – scale groups with independents included
• Location: Urban, Suburban, Airport, Interstate, Resort, Small Town • Price – 5 groups, based on ADR relative to specific market
• Size – based on number of rooms
• Types: Extended Stay, Resort, Boutique, Casino, Golf, Ski, Spa, Convention, Conference, All-suites, Full/Limited Service, Waterpark
• Additional non-geo. fields: Age, Corporate Housing, Condotel Star Rating (WW) , User-defined (green, pet-friendly, …)
STR Non-geographic Categorization
The STAR Report displays Scale and Class data of the subject hotel

• Which hotels directly compete with my property?– Usually similar hotels– Usually hotels in close proximity– Numbers can include or exclude the subject property
• Hotels can have more than one comp set– May have a local comp set and a 2nd that uses a broader
geographic area with more similar features, or one for WD and another for WE, or Group/Transient
– The chain may have one comp set and the management company may have another, or old versus new
Competitive Sets
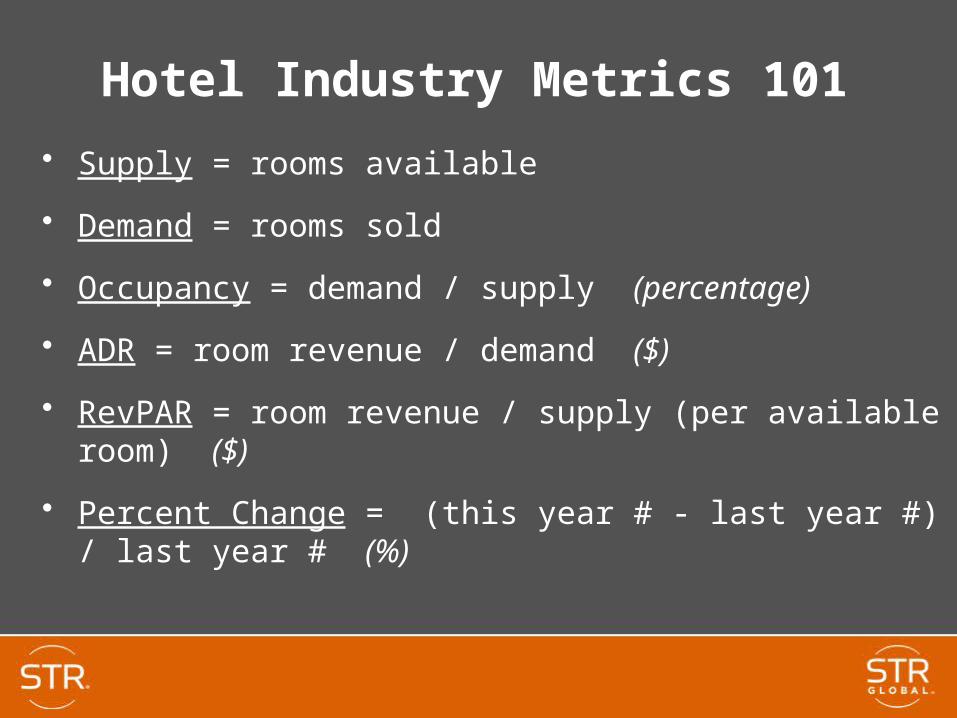
• Supply = rooms available
• Demand = rooms sold
• Occupancy = demand / supply (percentage)
• ADR = room revenue / demand ($)
• RevPAR = room revenue / supply (per available room) ($)
• Percent Change = (this year # - last year #) / last year # (%)
Hotel Industry Metrics 101

• Index = property # / comp set # (number > or < 100)
• Penetration = Occupancy Index
• Yield = RevPAR Index
• Rank = property’s position among comp set for values such as ADR (i.e.: 2 of 7)
• Share = property’s percent of total, for example a hotel’s Demand Share would be their percent of the total Demand versus their comp set
Hotel Metrics 101 Continued

• Week = Sunday through Saturday
• Comparable Day = same day of same week last year, most daily percent changes are based on comparable days (“day to day”), versus “date to date” (MTD would be based on date to date)
• Weekday = Sunday through Thursday
• Weekend = Friday and Saturday
Hotel Date & Time Definitions

• MTD = from first to current day of month
• YTD = from January to current month
• Running #-month = last 3 or 12 months including the current month, valuable for comparing current month to longer time period or for graphing
• Running 28-day = last 28 days including the current day, same advantage as above
• Running 4-week = last 4 weeks of data for a specific day of the week
Date & Time Definitions Continued

• Group = rooms sold in block of ten or more and corresponding revenue
• Transient = rooms sold at rack, corporate, package, or government rates and corresponding revenue
• Contract = rooms sold at rates stipulated by contracts including airline crews and permanent guests
• Food & Beverage Revenue = revenue from any F&B establishment
• Other Revenue = all revenue excluding room & F&B
Segmentation and Additional Revenue Definitions

Introduction to the
STAR Report

What is the STAR Report?
• The name “STAR” stands for “Smith Travel Accommodations Report”
• The original version of this report was launched in 1987. The STAR reports are continually being fine tuned and new pages are added on a regular basis.
• The STAR Reports analyze your hotel’s performance:– Occupancy– Average Daily Rate (ADR)– Revenue per Available Room (RevPAR)– Demand (Room Nights) – Room Revenue

What is the STAR Report? - continued
• STAR Reports provide comparison to competitors:– Index numbers
• greater than 100 means the subject is winning, less than 100 means the comp set is winning
– Ranking information• Displayed in the format “# of #”, for example “2 of 7” means the
subject has the 2nd best value in the comp set of 7
• In addition to the comp sets, the STAR Reports also provide comparison to various industry segments– It is very important to compare the subject hotel to relevant industry
segments– You can also compare the comp set to these industry segments

What is the STAR Report? - continued
• STAR Reports track performance for multiple time periods– Current month, week, and day– YTD and MTD– Running 3-month, Running 12-month, 28-day, and Running
4-week
• They also track year-over-year performance– TY vs. LY percent change for all metrics and indexes
• There are additional pages that display specialized information
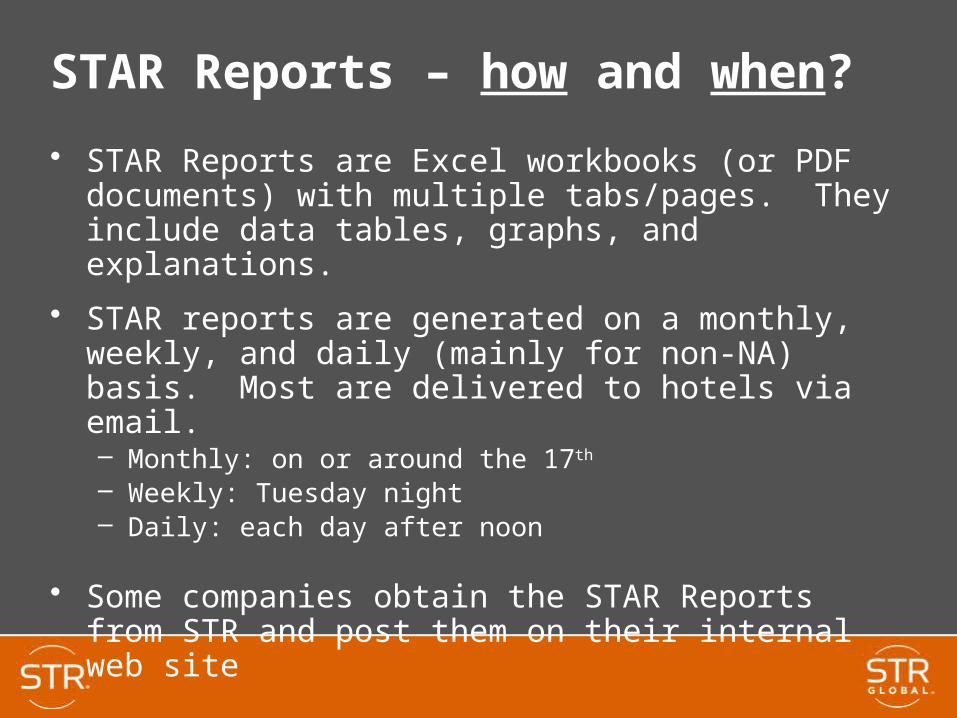
STAR Reports – how and when?
• STAR Reports are Excel workbooks (or PDF documents) with multiple tabs/pages. They include data tables, graphs, and explanations.
• STAR reports are generated on a monthly, weekly, and daily (mainly for non-NA) basis. Most are delivered to hotels via email.– Monthly: on or around the 17th – Weekly: Tuesday night– Daily: each day after noon
• Some companies obtain the STAR Reports from STR and post them on their internal web site

Why do I need the STAR Report?
• Benchmarks your performance
• Allows you to keep an eye on your competitors and your market
• Lends perspective to good and bad performance
• Aids pricing decisions, help improve profitability
• Allows you to monitor the effect of your business strategies
• View Supply, Demand, & Revenue changes in your market (new hotels, more travelers, more money)

Who am I compared to?
• Competitive Set: a set of 4 or more properties
• Market: for example Memphis or Nashville
• Market Class: subset of market with similar chain affiliated and independent hotels (6 groups)
• Tract: geographic subset of market such as Memphis Airport or Nashville South
• Tract Scale: subset of tract with similar chain or independent hotels (4 groups). Scales are collapsed in this segment (Luxury and Upper Up, Upscale and Upper Mid, Midscale and Economy, Independents)
Monthly STAR Reports

Table of Contents• First tab of the workbook
• Lists all the pages/tabs that are included
• Will list two additional pages for Daily participants (most hotels)
• Will list eleven additional pages for Segmentation participants (most Luxury and Upper Upscale hotels)
• Would include additional pages for hotels with 2nd, 3rd, or 4th comp sets

Monthly Table of Contents

Tab 1 - Monthly Performance at a Glance
• Provides a quick one-page overview of performance relative to your comp set
• Displays Occupancy, ADR, and RevPAR for your property and your comp set, also Index numbers and Percent Changes
• For four points in time: Current Month, Year to Date, Running 3-month, and Running 12-month
• Also displays basic information for the subject property and the report settings at the top

Monthly Performance at a Glance

Tab 2 – STAR Summary• Provides a detailed comparison of your property to
various industry segments and your comp set
• Displays Occupancy, ADR, and RevPAR, as well as percent changes for each group
• For four points in time: Current Month, Year to Date, Running 3-month, and Running 12-month
• Also shows Supply, Demand, and Revenue Percent Changes; Census and Sample property and room counts; and a Pipeline overview
STAR Summary - Hints• Use this page to compare the subject hotel and the
comp set to the industry segments nearby. If the subject is beating the comp set, but both are losing to the industry segments, it might be worth checking the validity of the comp set
• Check the Census/Sample section to see the relative sizes of each industry segment
• Check the Supply, Demand, and Revenue percent changes to see growth in your area. Are you getting your fair share?

STAR Summary

STAR Summary – My Property vs. Comp Set and Industry Segments
• Rows display data for your hotel, 4 industry segments, and your comp set
• Columns display values and percent changes for the current month, YTD, running 3 month, and running 12 month time periods
• There are similar sections for Occupancy, ADR and RevPAR

STAR Summary – Supply, Demand, and Revenue Section
Supply: The number of rooms in the segment multiplied by the number of days in the period.
Check to see if there are more rooms available in each area
Demand: The number of rooms sold (excluding complimentary rooms).
Check to see if there are more travelers in an area.
Revenue: Total room revenue generated from the sale (rental) of rooms.
Check to see if there is more money coming into an area.
Percent changes for multiple time periods are displayed

STAR Summary – Census and Participation Information
Participation information is displayed for the industry segments and comp set
Census: Total number of properties/rooms in a segment
Sample: The number of properties/rooms that report data to STR
Sample %: Percentage of rooms in each segment that report data to STR
Numbers generally decrease as you move from Market down to Comp Set. Tract Scale will have the smallest number of properties after the Comp Set.

STAR Summary – Pipeline Information
Under construction: Ground has been broken or the owner is finalizing bids for the general contracting
Planning: Project will go out for bids, construction will start within 4 months, or an architect has been selected and plans are underway
Provides a quick snapshot of pipeline activity in the market
Check this data for changes from month to month
Pipeline data is detailed further in the STR Market Pipeline Report

STAR Summary - Questions• How does my property perform compared to its industry
segments?
• How does my property’s comp set perform compared to its industry segments?
• How does the performance compare for different time periods?
• What do the Supply, Demand, & Revenue Percent Changes show about an area?
• Has the Pipeline data changed since last month?

Tab 3 – Competitive Set Report• Provides a historic comparison of your property to your
comp set over time
• Displays Occupancy, ADR, and RevPAR, as well as Percent Changes, Index numbers, and Ranking information
• Shows 18 months of monthly data and 3 years of Year to Date, Running 3-month, and Running 12-month
• Graphs monthly indexes (line graph) and RevPAR % Change (separate bar graphs for YTD and Running numbers)
Comp Set Report - Hints
• Review the graphs to see the interaction of the different indexes over time
• Check the monthly data to compare current month numbers to trends over last several months
• Check the annual data to compare current numbers to longer trends
• Compare the percent changes to the actual values
• Compare the ranking numbers to the actual values

Competitive Set Report

The graph shows 18 months of Occupancy (blue), ADR (green=$), and RevPAR (brown) indexes by month
Allows you to see interaction of indexes over time
The dotted line represents an Index of 100
Competitive Set Report – Graph of Indexes

Here is a hypothetical scenario. In April the hotel decided to raise ADRs. They may have thought they had a loyal customer base. What happened? (The occupancy was immediately affected to a significant degree.) The hotel continued for several months and ADRs were still affected. In June the hotel lowered ADRs and Occupancy returned.
Did the hotel do the wrong thing? (No, they should be trying things like this. It did not have the intended results.) What else could they try?
Competitive Set Report – Another Sample Graph
Monthly Indexes
77
82
87
92
97
102
107
112
117
Feb Mar Apr May Jun Jul Aug Sep Oct Nov Dec Jan Feb Mar Apr May Jun Jul
Occupancy ADR RevPAR 100 %

Monthly table displays 18 months of occupancy, ADR and RevPAR for your hotel versus the competitive set
Includes % change calculations, index numbers, and ranking information
(Index = Property performance / competitive set performance X 100)
Competitive Set Report – Monthly Data Tables

Tables display 3 years of YTD, running 3-month and running 12-month data with % changes, index numbers, and ranking information
Graphs display RevPAR % change
Competitive Set Report – Multi Month Data and Graphs

Competitive Set Report - Questions
• How has the comp set performance changed during the last 18 months and what seasonal trends exist?
• How has the YTD, Running 3 & 12 Month performance changed over the last 3 years?
• What do the Index numbers and the Index Percent Changes show?
• How are the Rank numbers and the Percent Change Ranks?

Tab 4 – STAR Response Report• Provides monthly calendars for this year and last year,
including special events
• Lists your hotel and every property in your comp set with basic information and data participation detail for the last three years
• Empty circles indicate monthly only; filled in circles indicate monthly and daily; no circle means no data
• Check to be sure all properties in the comp set are participating consistently

STAR Response Report
Displays info and participation for hotels in the comp set, also months and events

STAR Response Report – Questions
• Did all the properties in my comp set submit monthly data?
• Did all the properties in my comp set submit daily data?
• Were there any room changes (adds or drops) to the properties in my comp set?
• Did any of the hotels in my comp set close? (You can check the Summary Page to track new hotels that are opening in your area.)

Tab 5 – Day of Week and WeekdayWeekend Report
• Drills down into daily data by each day of week and subtotals by Weekday and Weekend
• Provides Occupancy, ADR, and RevPAR for property and comp set, plus Index numbers and Percent Changes
• Allows you to compare DOW and WD/WE performance for Current Month, YTD, Running 3 and Running 12-month

Day of Week and Weekday/Weekend Report - Hints
• Compare subject versus comp set performance on specific days of the week to look for opportunities to improve. The subject hotel might be comfortably beating the comp set when it comes to monthly numbers, but might be losing on specific days or on weekends versus weekdays.
• Compare current month and recent (Running 3-month) performance to historic data (YTD, Running-12 month) to check for trends and market changes. Are hotels in your comp set working to improve on specific days?

Day of Week and Weekday/Weekend Report

Day of Week and Weekday/Weekend Report – Day of Week Data
• Displays Occupancy, ADR, RevPAR, and % changes per each day of the week for the current month, year-to-date, running 3-month and 12-month periods
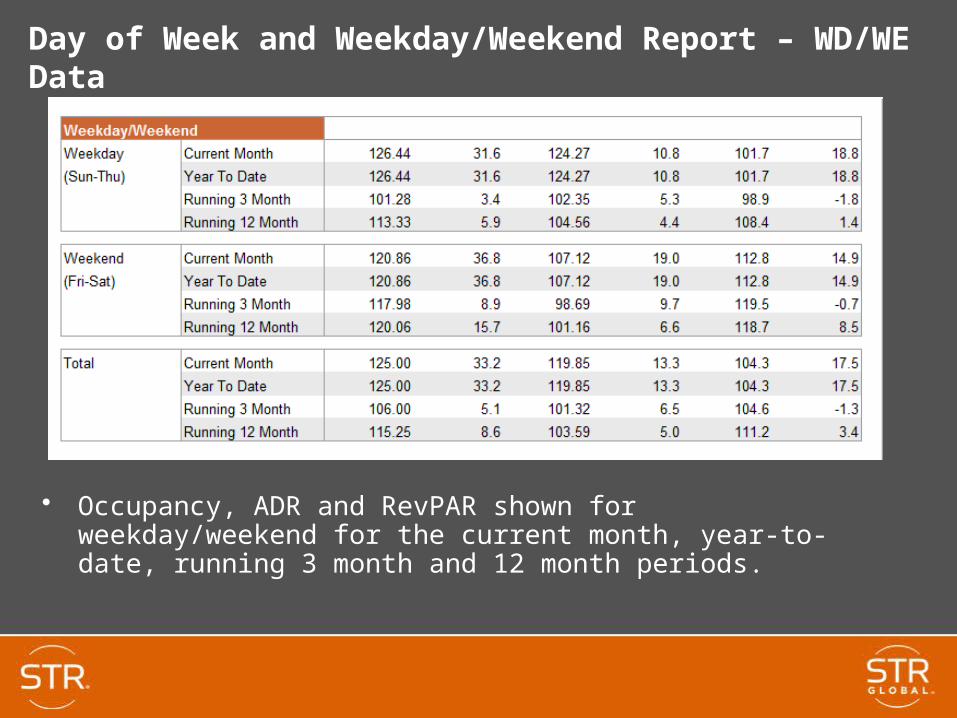
Day of Week and Weekday/Weekend Report – WD/WE Data
• Occupancy, ADR and RevPAR shown for weekday/weekend for the current month, year-to-date, running 3 month and 12 month periods.

Day of Week and Weekday/Weekend Report - Questions
• How did my hotel perform compared to the comp set on weekdays versus weekends?
• How did my hotel perform compared to the comp set on specific days of the week?
• Are there days where I am winning or losing disproportionately?
• How does this performance vary over time?

Tab 7 – Daily Data for the Month
• Provides a recap of all the daily data for the current month
• Helps you reconcile the daily data to the monthly results
• Graphs daily index values during the month
• Should be similar to the daily data from your weekly reports although there may be minor changes due to adjustments. There are two types of adjustments:
– Adjustments made to monthly data not reflected in daily data
– Adjustments made to daily data after the fact that may not show up on weekly reports

Daily Data For Month – My Property vs. Competitive Set

Daily Data For Month – Graph
The graph shows daily indexes for the month for Occupancy (blue), ADR (green=$), and RevPAR (brown)
The dotted line represents an index of 100
Allows you to see interaction of the different indexes during the month

Daily Data For Month – Data Tables
• Compares the subject property data to the comp set
• Displays Occupancy, ADR and RevPAR for each day of the entire month
• Includes Index numbers and ranking information
• The percent change section shows these values for each metric

Daily Data for the Month - Questions
• How did the daily data add up to the monthly numbers?
• Were there specific periods during the month where I won or lost in Occupancy or ADR?
• How did special events contribute to the monthly numbers and how did I compare at those times?
• Are there trends when I compare the daily data for this month to the same page of prior months?

Segmentation and Additional Revenue pages in STAR Reports
• Companies can subscribe to obtain these additional pages (tabs) in their monthly STAR reports
• Most Luxury and Upper Upscale hotels receive these pages. Many Upscale and Upper Midscale hotels also receive them.
• An individual hotel can subscribe separately if there company does not elect to subscribe
• Additional pages are also available in weekly STAR reports
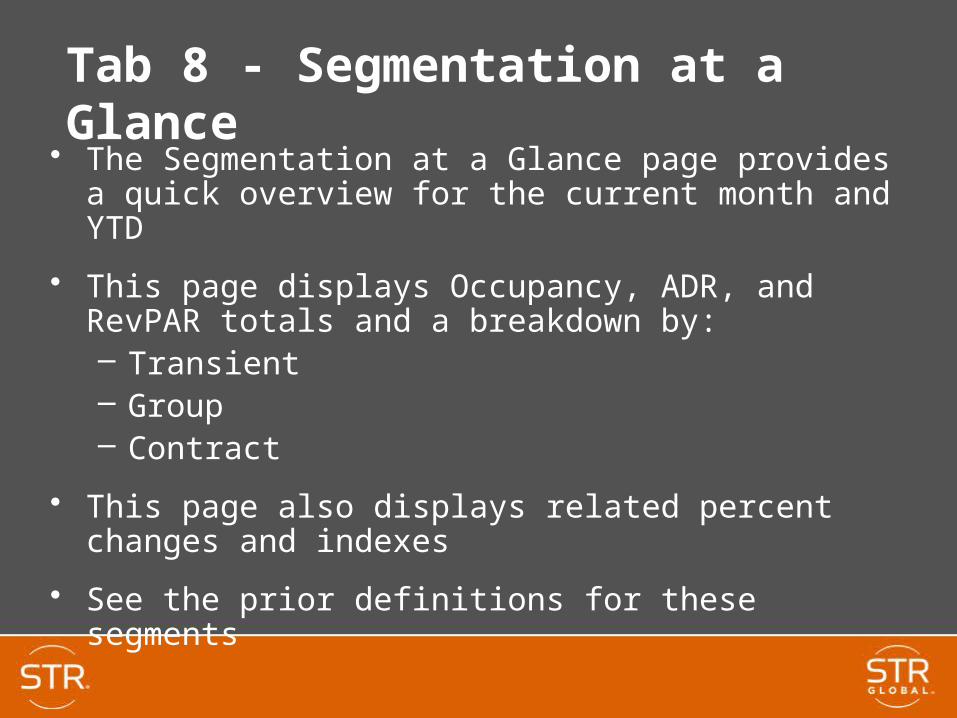
Tab 8 - Segmentation at a Glance
• The Segmentation at a Glance page provides a quick overview for the current month and YTD
• This page displays Occupancy, ADR, and RevPAR totals and a breakdown by:– Transient– Group– Contract
• This page also displays related percent changes and indexes
• See the prior definitions for these segments

Segmentation at a Glance

Segmentation Analysis pages
• There are several pages that provide a more detailed analysis of the Segmentation data
• These pages display 18 months of monthly data and 3 years of YTD, Running 3 and Running 12 month data
• There are separate Occupancy, ADR, and RevPAR Analysis pages that displays values and percent changes for the subject, comp set, and Market Scale
• There is an Index Analysis page that displays all the index numbers for the metrics above
• There is a Ranking Analysis page that displays all the rank numbers for the metrics above

Segmentation pages - Hints
• The Segmentation pages allow a hotel to compare their performance to their comp set and Market Scale separately by each of the different segments
• The subject hotel might be beating the comp set when looking at a total monthly number, but the comp set might have a higher Group or Contract occupancy or ADR
• Be sure to compare the subject hotel and the comp set to the Market Scale. Do these other groups relay upon Group and Contract business similar to the subject hotel?

Segmentation RevPAR Analysis

Segmentation Index Analysis

Segmentation Ranking Analysis

Segmentation Day of Week pages
• The Segmentation Day of Week pages display Occupancy, ADR, and RevPAR values and percent changes for the subject property, the comp set, and the Market Scale for Group, Transient, Contract, and Total
• Numbers are broken down for each day of the week and for total weekday versus weekend, and a total
• There is one page for Current Month numbers and another page for YTD numbers
• Use this page to compare segment performance on different days of the week, for example Group numbers on weekdays versus weekend.
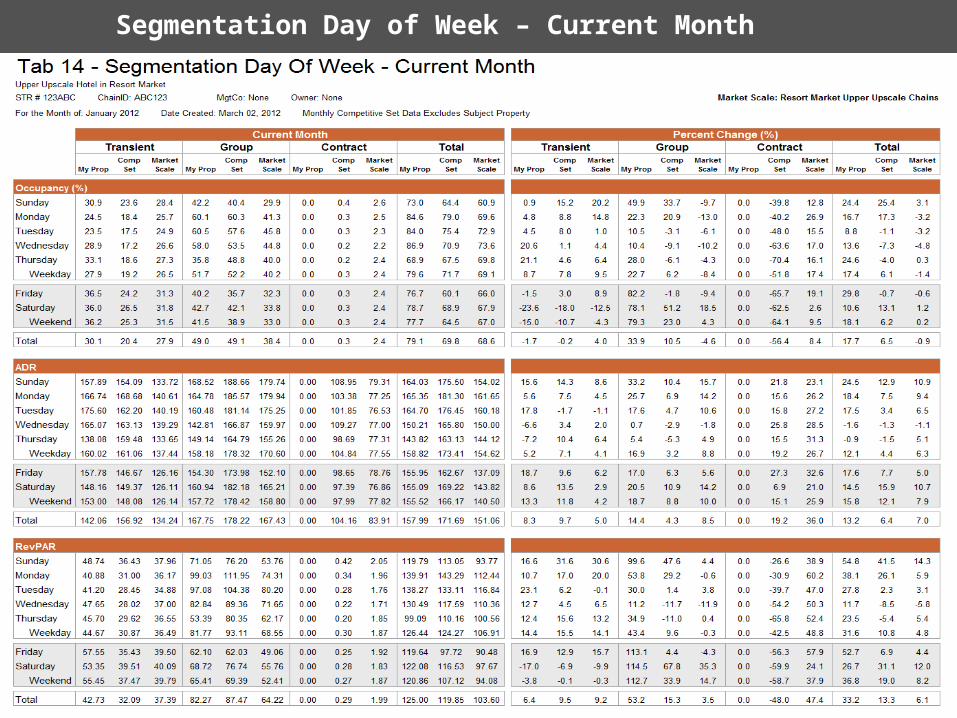
Segmentation Day of Week – Current Month

Segmentation Day of Week – Year to Date

Segmentation - Questions
• How do I compare to my comp set and market scale when it comes to separate Group and Transient Occupancy and ADR?
• How do the Group and Transient numbers differ on the Weekday versus the Weekend, or on individual days of the week?
• How many of the hotels in my comp set submit Segmentation data? If all hotels do not participate, how does this affect the numbers?

Additional Revenue pages
• The Additional Revenue RevPAR Analysis page displays Revenue Per Available Room for Rooms, Food & Beverage, Other Revenue, and Total Revenue.
• The format is the same as the Analysis pages. It displays 18 months of monthly data and 3 years of YTD, Running 3 and 12-month data and Percent Changes
• The page also displays Ranking numbers that compare the subject property to the comp set
• See the prior definitions for the Additional Revenue segments

Additional Revenue RevPAR Analysis

Segmentation Response• Provides monthly calendars for this year and last year,
including special events
• Lists your hotel and every property in your comp set with basic information and segmentation participation detail for the last three years, using the following codes:– “s” – hotel has submitted Segmentation data– “r” – hotel has submitted Additional Revenue data– “B” – hotel has submitted both Segmentation and Additional
Revenue data
• Check which properties in the comp set are participating, and if so, how consistently

Segmentation Response Report
Segmentation participation info is displayed for each hotel in the comp set

Additional Revenue - Questions
• How do I compare to my comp set and market scale when it comes to Food and Beverage and Other Revenue?
• How do the Additional Revenue numbers differ during prior months and seasons?
• What do the ranking numbers show me about my F&B and Other Revenue numbers compared to my Room Revenue numbers?

Weekly STAR Reports

Intro to the Weekly STAR Reports
• Almost all hotels that receive Monthly STAR Reports also obtain Weekly reports
• Weekly STAR reports originally started in the late 1990’s as the industry saw the need for a more timely/dynamic look at performance benchmarking
• These reports are generated on Tuesday evenings and provide data for the prior week, Sunday through Saturday
• If Monday is a holiday, the reports are postponed a day

Table of Contents
• First tab of the workbook
• Lists all the pages/tabs that are included
• Will list five additional pages for Segmentation participants (light grey)
• Would include additional pages for hotels with 2nd, 3rd, or 4th comp sets
• Displays the start and end date of the current week, STR number, and date created

Weekly Table of Contents
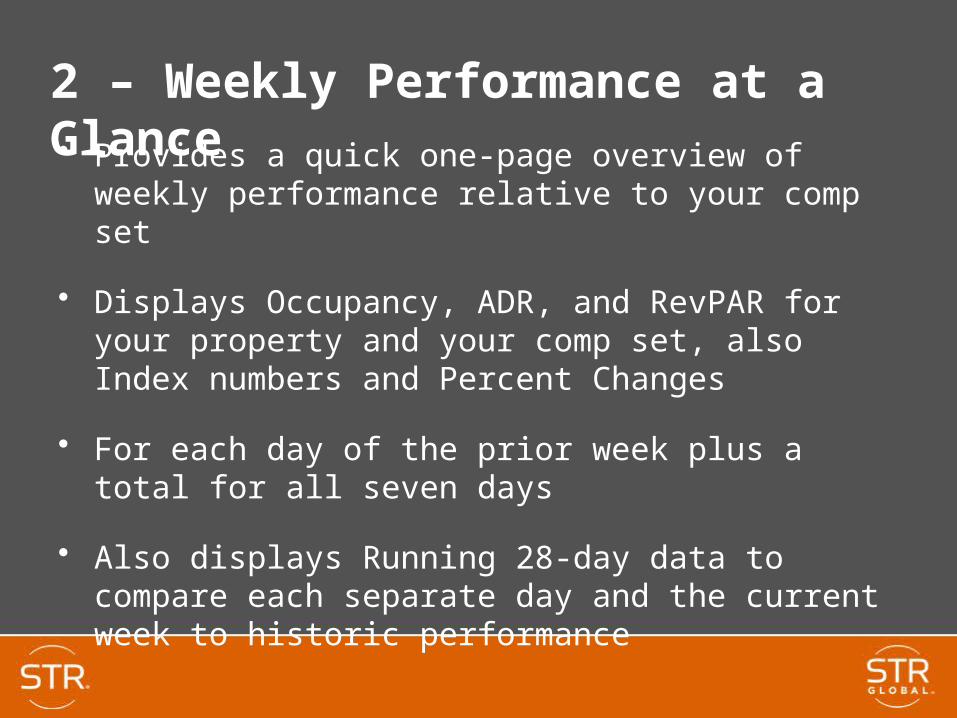
2 – Weekly Performance at a Glance• Provides a quick one-page overview of weekly
performance relative to your comp set
• Displays Occupancy, ADR, and RevPAR for your property and your comp set, also Index numbers and Percent Changes
• For each day of the prior week plus a total for all seven days
• Also displays Running 28-day data to compare each separate day and the current week to historic performance

Weekly Performance at a Glance – My Property vs. Comp Set

Tab 4 – Daily Data for the Month • Provides a recap of all the daily data for the current
month so far, as of last week. If the week includes days from two months, it will always show the prior month.
• The page also graphs daily index values
• Includes a Running Month-to-Date subtotal which can serve as a “preliminary” indication of monthly results.
• The Month-to-Date results can still differ from the “final” monthly data due to adjustments and if there are participation differences
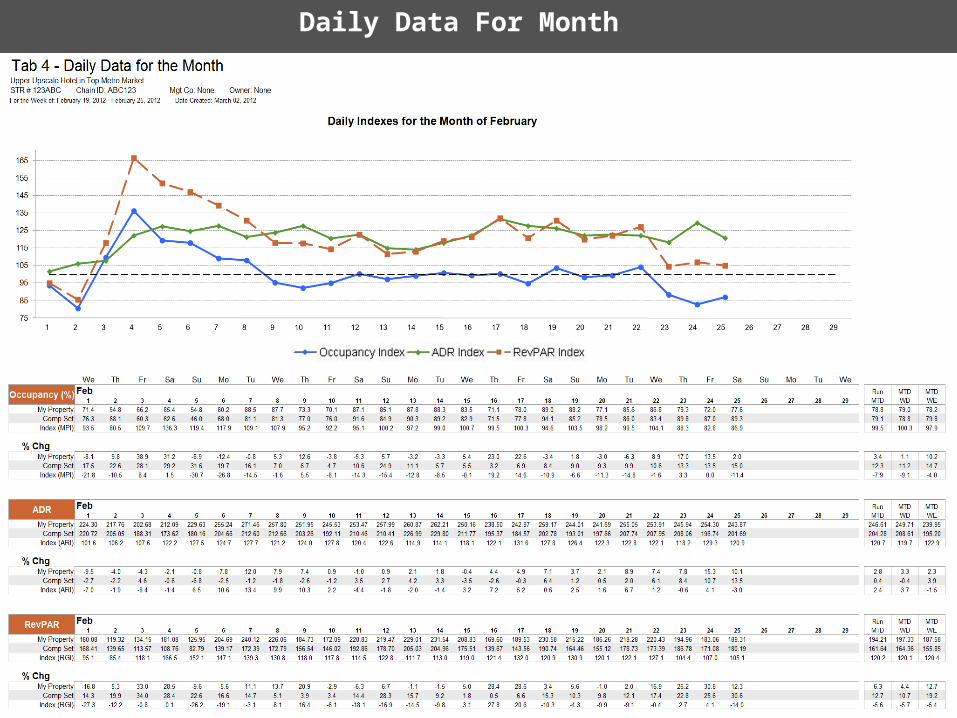
Daily Data For Month
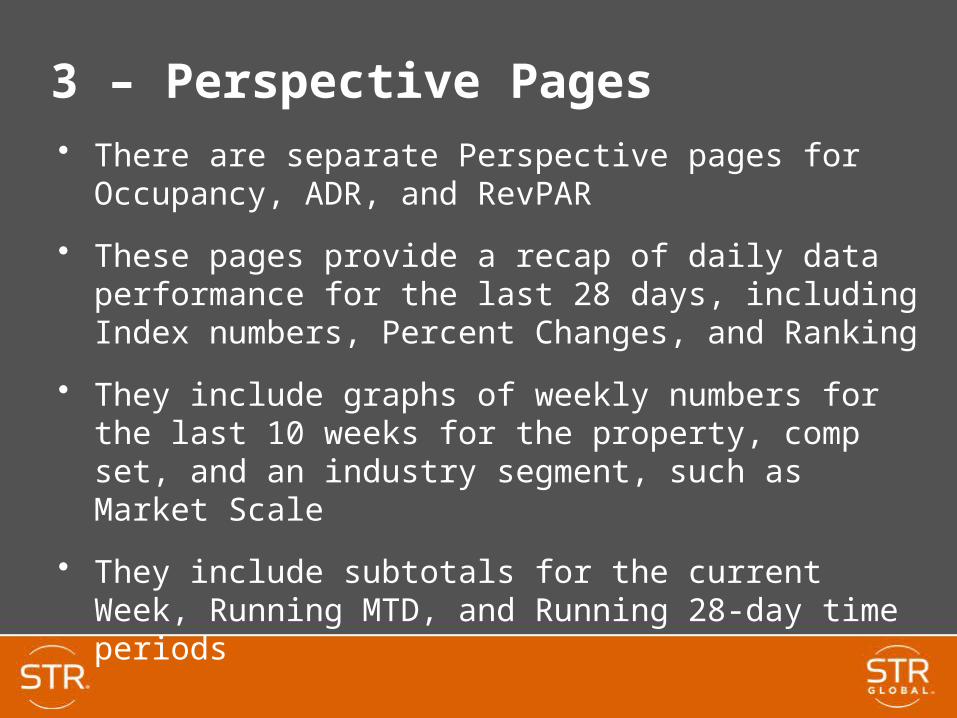
3 – Perspective Pages • There are separate Perspective pages for Occupancy,
ADR, and RevPAR
• These pages provide a recap of daily data performance for the last 28 days, including Index numbers, Percent Changes, and Ranking
• They include graphs of weekly numbers for the last 10 weeks for the property, comp set, and an industry segment, such as Market Scale
• They include subtotals for the current Week, Running MTD, and Running 28-day time periods

Perspective Pages

12 – Weekly STAR Response Report• Provides calendars for this year and last year, including
special events
• Lists your hotel and every property in your comp set with basic information and data participation detail, using the following codes:– “X” = both years– “T” = this year– “L” = last year
• Segmentation versions shows prior week participation for three different types of data. Non-segmentation version shows STAR participation for prior 28 days
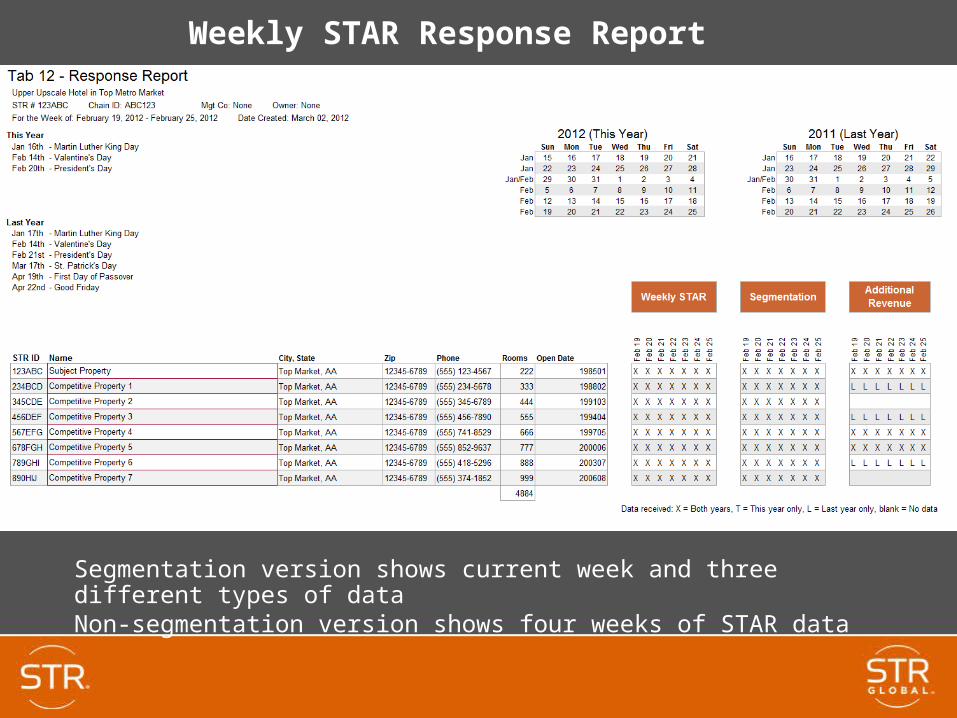
Weekly STAR Response Report
Segmentation version shows current week and three different types of dataNon-segmentation version shows four weeks of STAR data

Weekly Segmentation pages• A Weekly Segmentation at a Glance page summarizes the
daily metrics by Group, Transient, and Contract
• There are separate Analysis pages for Occupancy, ADR, and RevPAR that display Group, Transient, and Contract metrics for the subject property, comp set and Market Scale for the last 28 days. They include subtotals by day of week, current week, running 28-day, and MTD.
• There is an Additional Revenue page that displays Revenue Per Available Room for Rooms, Food & Beverage, Other Revenue, and Total Revenue. The format is the same as the Analysis pages

Weekly Segmentation at a Glance

Weekly Segmentation Analysis Pages

Weekly Additional Revenue – F&B, Other, and Total
Weekly Report - Questions
• How do I compare performance for each day of last week to typical performance on that day of the week?
• What different time periods do the Perspective pages show me?
• What can I learn from the Segmentation and Additional Revenue pages?
• Why do I need to check the Weekly Response report?
• How dependable are the monthly numbers on a Weekly report?
Additional Property Reports

Daily STAR Reports
• Daily STAR Reports are received by most Non-North American hotels and by North American hotels in approximately 20 major markets
• Daily reports are emailed to hotels by the middle of each weekday in all different time zones
• Reports display performance from the prior day or from the weekend on Mondays

Daily STAR Report Pages
• There is Table of Contents page similar to other reports
• There is an “At a Glance” page for just the prior day
• There is a Running Month to Date page that displays Occupancy, ADR, and RevPAR metrics and percent changes for the subject hotel, the comp set and the Market Scale. This page also displays index and ranking information for the subject property versus the comp set
• When the day falls early in the month, the report includes a “Last Month” page which displays numbers for the prior month

Daily STAR Property Report – Table of Contents

Daily STAR Property Report – At a Glance

Daily STAR Property Report – Running Month-to-Date

Daily STAR Property Report – Last Month

New Developments for STAR Reports
• Bandwidth reports – shows range of metrics
• RPM - RevPAR Positioning Matrix reports
• Spa STAR – special report for Spas
• Casino STAR – special report for casinos
• MComp – assistance with comp sets
• Online Create Report Tool (used by WW hotels)
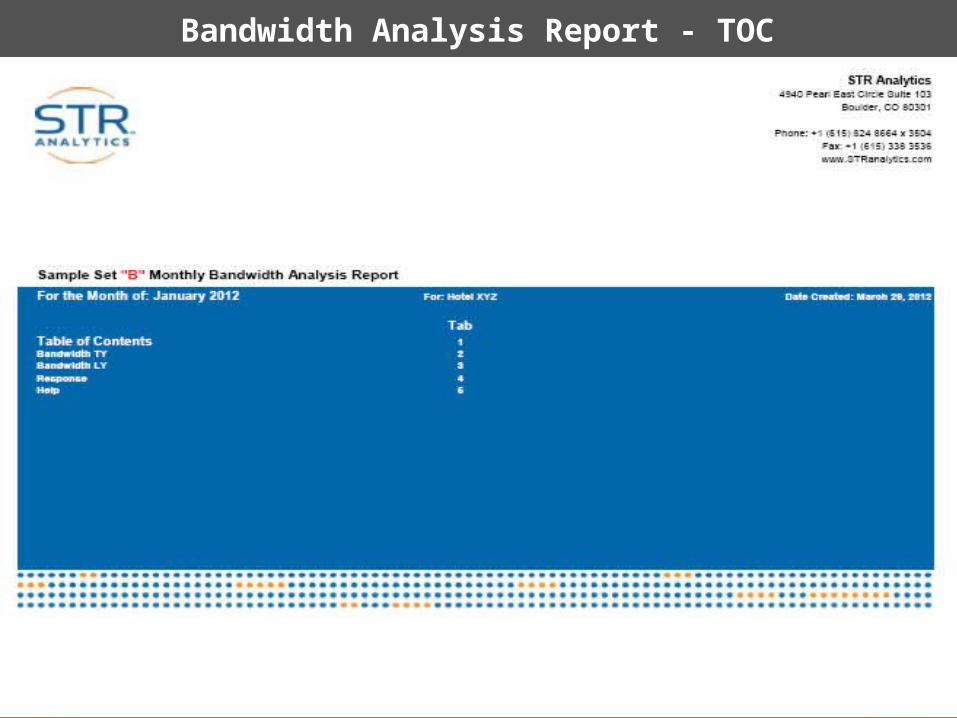
Bandwidth Analysis Report - TOC

Bandwidth Analysis Report – Tab 2
RPM (RevPAR Positioning Matrix) Report - TOC

RPM (RevPAR Positioning Matrix) Report – Tab 2

STAR Spa Report
New - Spa related performance data


