13
Start Audio Lecture! FOR462: Watershed Science & Management 1 Streamflow Analysis Module 8.7
| Date post: | 19-Dec-2015 |
| Category: |
Documents |
| View: | 213 times |
| Download: | 0 times |

Start Audio Lecture!
FOR462: Watershed Science & Management FOR462: Watershed Science & Management
1
Streamflow AnalysisStreamflow Analysis
Module 8.7
2
FOR462: Watershed Science & Management
Frequency Analysis – Why?
• Common dialog to describe events• Quantify extreme events• Flood flow return periods
• Engineering design• Watershed planning• Zoning• Geomorphic processes
• Water resources management• What is the probability of a given flow being
available?

3
FOR462: Watershed Science & Management
How is Flow Variability Quantified?
2 Methods:1. Recurrence interval / Flow probability
• General technique to describe the probability of an event occurring
• Frequently used for flood peaks• Just like we did for precipitation
2. Flow duration• Indicates the amount of time a given flow is
equaled or exceeded• Describes availability of water resources
4
FOR462: Watershed Science & Management
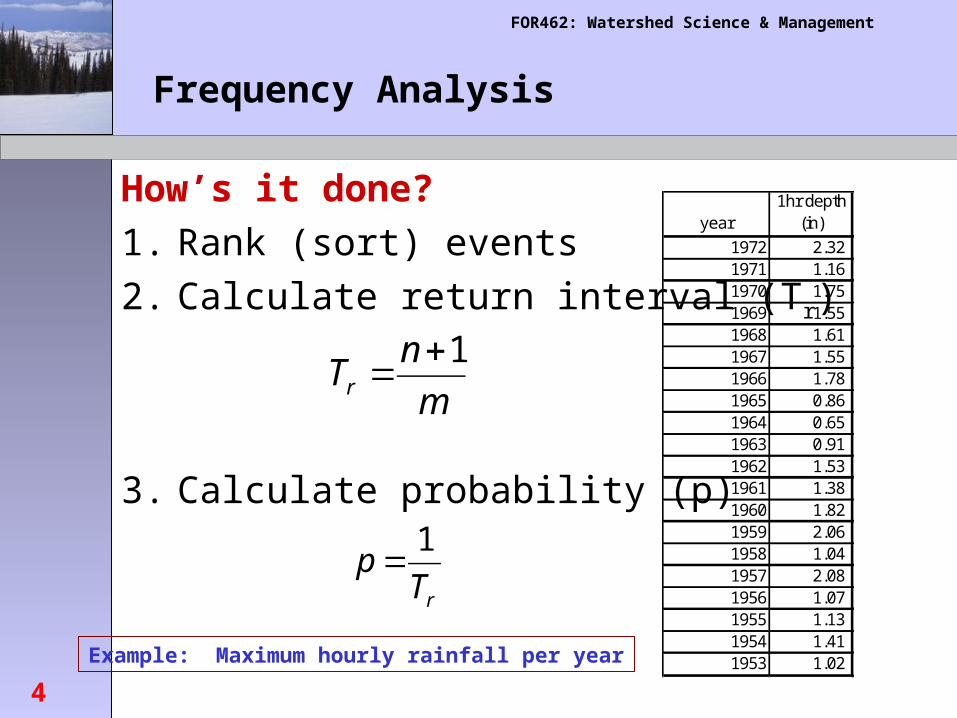
Frequency Analysis
How’s it done?
1. Rank (sort) events
2. Calculate return interval (Tr)
3. Calculate probability (p)
m
nTr
1+=
rTp
1=
year1hr depth
(in)
1972 2.321971 1.161970 1.751969 1.551968 1.611967 1.551966 1.781965 0.861964 0.651963 0.911962 1.531961 1.381960 1.821959 2.061958 1.041957 2.081956 1.071955 1.131954 1.411953 1.02Example: Maximum hourly rainfall per year
5
FOR462: Watershed Science & Management
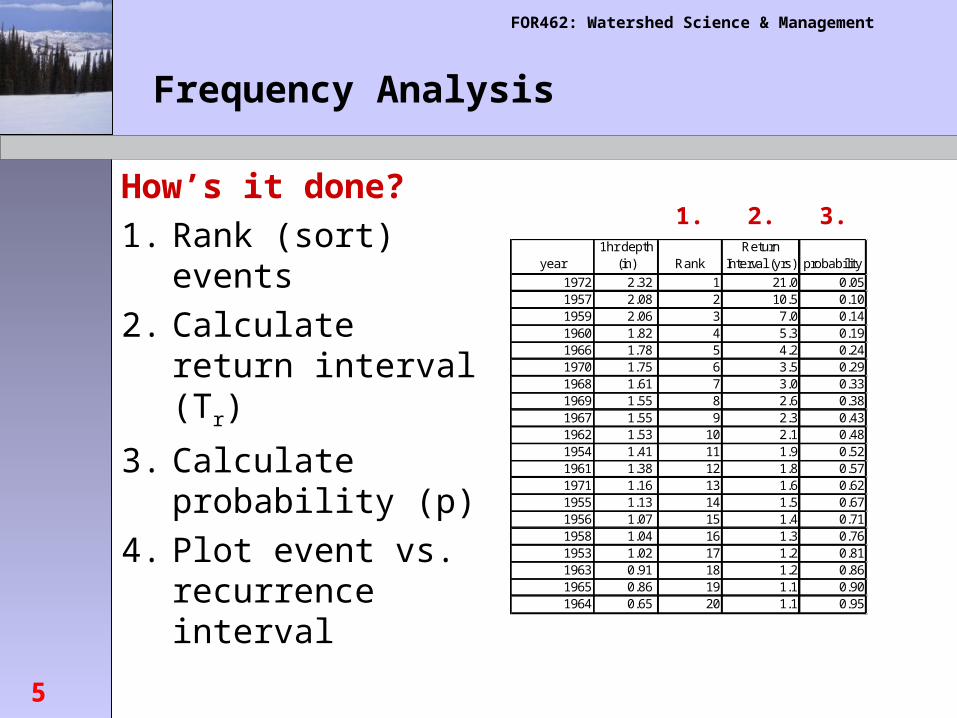
Frequency Analysis
How’s it done?
1. Rank (sort) events
2. Calculate return interval (Tr)
3. Calculate probability (p)
4. Plot event vs. recurrence interval
year1hr depth
(in) RankReturn
Interval (yrs) probability
1972 2.32 1 21.0 0.051957 2.08 2 10.5 0.101959 2.06 3 7.0 0.141960 1.82 4 5.3 0.191966 1.78 5 4.2 0.241970 1.75 6 3.5 0.291968 1.61 7 3.0 0.331969 1.55 8 2.6 0.381967 1.55 9 2.3 0.431962 1.53 10 2.1 0.481954 1.41 11 1.9 0.521961 1.38 12 1.8 0.571971 1.16 13 1.6 0.621955 1.13 14 1.5 0.671956 1.07 15 1.4 0.711958 1.04 16 1.3 0.761953 1.02 17 1.2 0.811963 0.91 18 1.2 0.861965 0.86 19 1.1 0.901964 0.65 20 1.1 0.95
1. 2. 3.
6
FOR462: Watershed Science & Management
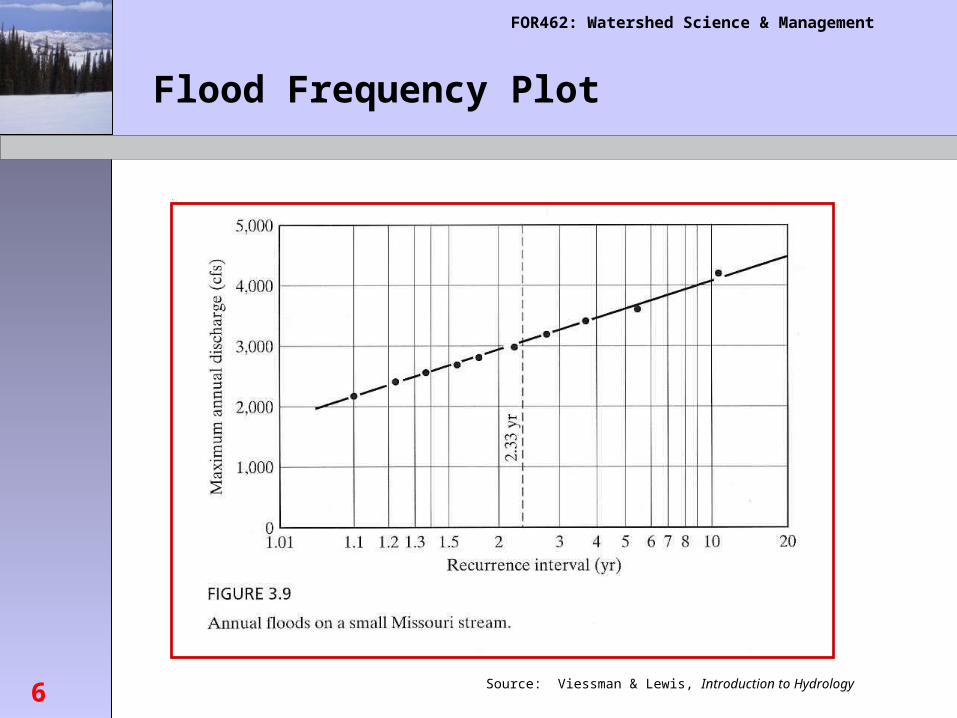
Flood Frequency Plot
Viessman Fig. 3.9
Source: Viessman & Lewis, Introduction to Hydrology

7
FOR462: Watershed Science & Management
Flow Duration Analysis
Variant of Flow Frequency Analysis• Probability presented as:
percent of time a given flow is equaled or exceeded
• Often constructed for a complete series of flows• e.g. daily average streamflow

8
FOR462: Watershed Science & Management
Flow Duration Curve
Source: Viessman & Lewis, Introduction to Hydrology
James River at Cartersville, VA
Viessman Fig. 3.14
9
FOR462: Watershed Science & Management
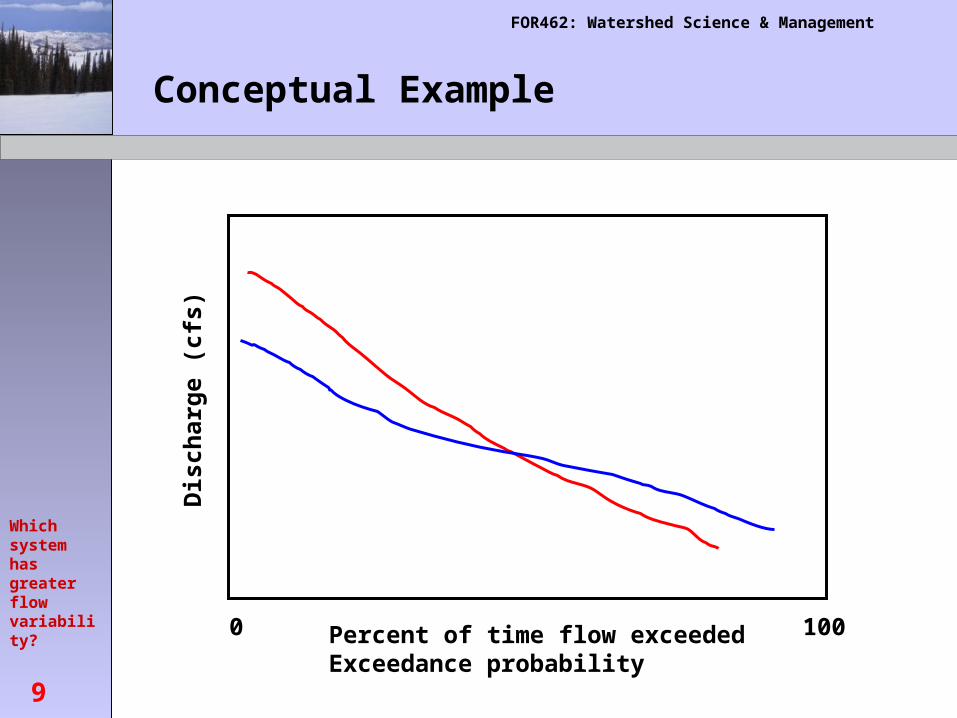
Conceptual Example
Dis
char
ge
(cfs
)
Percent of time flow exceededExceedance probability
0 100
Which system has greater flow variability?

10
FOR462: Watershed Science & Management
Oct 1 Dec 1 Feb 1 Apr 1 Jun 1 Aug 1 Oct 1 Dec 1 Feb 1 Apr 1 Jun 1 Aug 10
20
40
60
80
100
120
140
160
180
200
Discharge (cfs mi
-2
)
Metolius Siletz
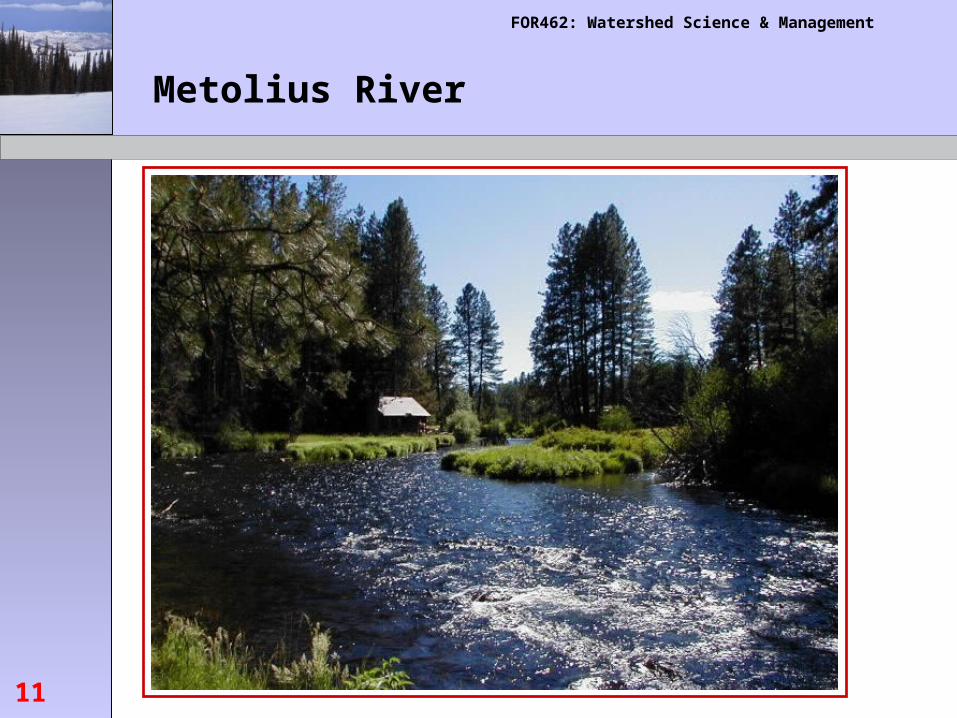
Drainage area:Metolius OR = 316 mi2
Siletz OR = 202 mi2
Oregon Hydrographs
Relation of Flow Variability to Riparian Zones
11
FOR462: Watershed Science & Management
Metolius River

12
FOR462: Watershed Science & Management
Siletz River
How do disturbance regimes differ?

13
FOR462: Watershed Science & Management
Runoff Distribution


