Page 1
STAT 5200 Fall 2018 Midterm Exam
Do not open the exam until you are instructed to do so.
Directions: You have 70 minutes to complete the exam. You may use your calculator
and a single page (both sides) of handwritten notes, but no laptops or wireless-capable
devices are allowed. Be concise with all your responses (no more than 1-2 sentences are
needed for each question). You may use 2 or 3 decimal places in all calculations. The
point-worth of each question is given, and the total points sum to 100.
Student Name: _________________________________________
SAS Output: Partial SAS code, output, and graphics (all clearly identified by title or
output number) from certain models are provided in a separate handout, and are
necessary for some of the questions on the exam.
Statistical Significance: For all significance tests on this exam, use significance level
α = 0.05. Where multiple hypotheses are concerned, control the strong family-wise error
rate at α = 0.05.
Study: 96 elderly American male subjects with the same brand of hearing aid (and
approximately the same degree of hearing loss) were recruited by the hearing aid
manufacturer in a study of their product’s performance under various conditions. There were
4 recordings of the same male speaker reading the same list of 50 words under various
conditions (SAS variable ‘recording’), and 24 subjects were randomly assigned to each
of the recordings. The recordings were arbitrarily numbered 1-4. While listening to their
assigned recording, each subject repeated back each word as they heard it. An observer
marked each word on the list as correctly or incorrectly identified by the subject, and the
subject’s score (SAS variable ‘score’) was their total number of correctly identified words.
Page 2
Question 1: (4 points) Identify the key feature of this study that makes it a good
experiment.
Question 2: Refer to the code and output for SAS Output 1.
a) (10 points) Write out an appropriate model corresponding to this SAS code, using
the means model parameterization. Define any symbols (parameters or letters)
you use, and specify the range of any subscripts you use.
b) (10 points) Identify two assumptions made by this model (in Question 2a above),
referring to a specific component of the model. For each assumption, comment
briefly on what the evidence in SAS Output 1 suggests regarding the
appropriateness of the assumption. (The code and output for SAS Output 2 may
also be helpful.)
i) Assumption:
Piece of evidence:
What evidence suggests:
ii) Assumption:
Piece of evidence:
What evidence suggests:
Page 3
Question 3: (6 points) Why must the assumptions you mention in Question 2b above be
addressed before proceeding with statistical inference?
Question 4: Refer again to the code and output for SAS Output 1. Report the following:
a) (6 points) The numeric value of the test statistic for the null hypothesis ‘mean
score is the same for all four recordings.’
b) (3 points) The sampling distribution for this test statistic.
c) (1 point) The p-value for the null in part (a) above.
d) (5 points) The conclusion of this test of significance, in the context of this
application.
e) (4 points) The percentage of variation in subject score explained by the
differences among the four recordings.
Page 4
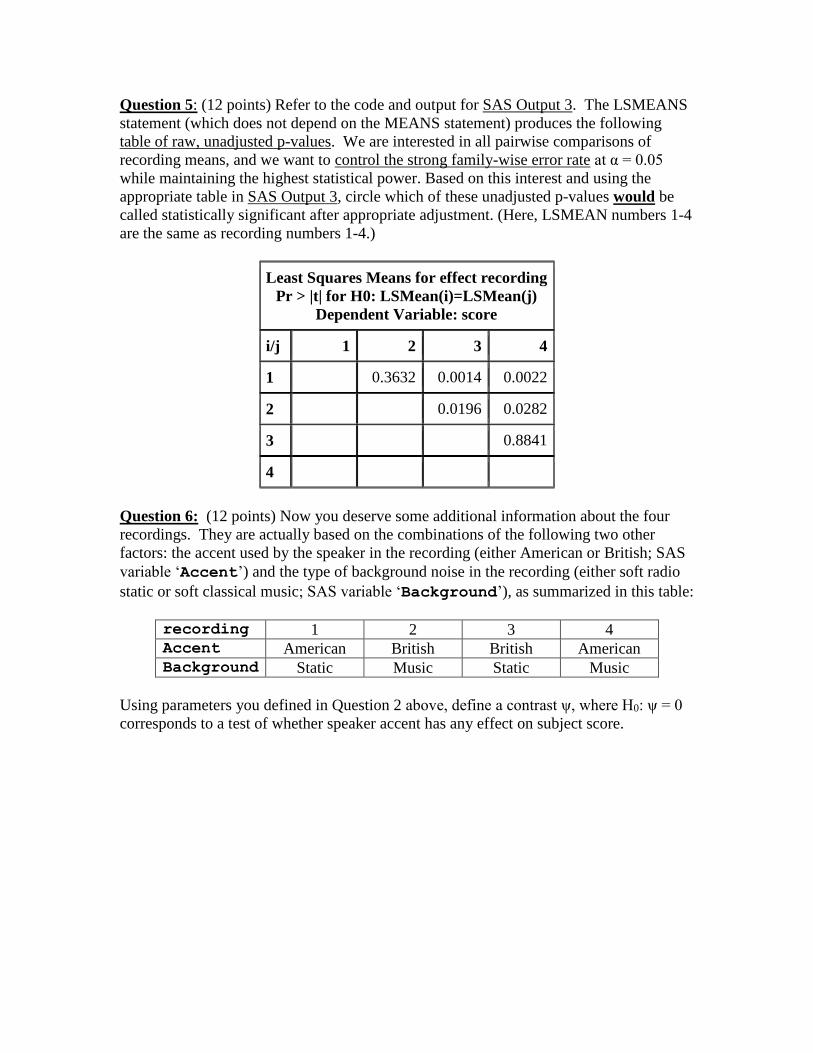
Question 5: (12 points) Refer to the code and output for SAS Output 3. The LSMEANS
statement (which does not depend on the MEANS statement) produces the following
table of raw, unadjusted p-values. We are interested in all pairwise comparisons of
recording means, and we want to control the strong family-wise error rate at α = 0.05
while maintaining the highest statistical power. Based on this interest and using the
appropriate table in SAS Output 3, circle which of these unadjusted p-values would be
called statistically significant after appropriate adjustment. (Here, LSMEAN numbers 1-4
are the same as recording numbers 1-4.)
Least Squares Means for effect recording
Pr > |t| for H0: LSMean(i)=LSMean(j)
Dependent Variable: score
i/j 1 2 3 4
1 0.3632 0.0014 0.0022
2 0.3632 0.0196 0.0282
3 0.8841
4
Question 6: (12 points) Now you deserve some additional information about the four
recordings. They are actually based on the combinations of the following two other
factors: the accent used by the speaker in the recording (either American or British; SAS
variable ‘Accent’) and the type of background noise in the recording (either soft radio
static or soft classical music; SAS variable ‘Background’), as summarized in this table:
recording 1 2 3 4 Accent American British British American Background Static Music Static Music
Using parameters you defined in Question 2 above, define a contrast ψ, where H0: ψ = 0
corresponds to a test of whether speaker accent has any effect on subject score.
Page 5
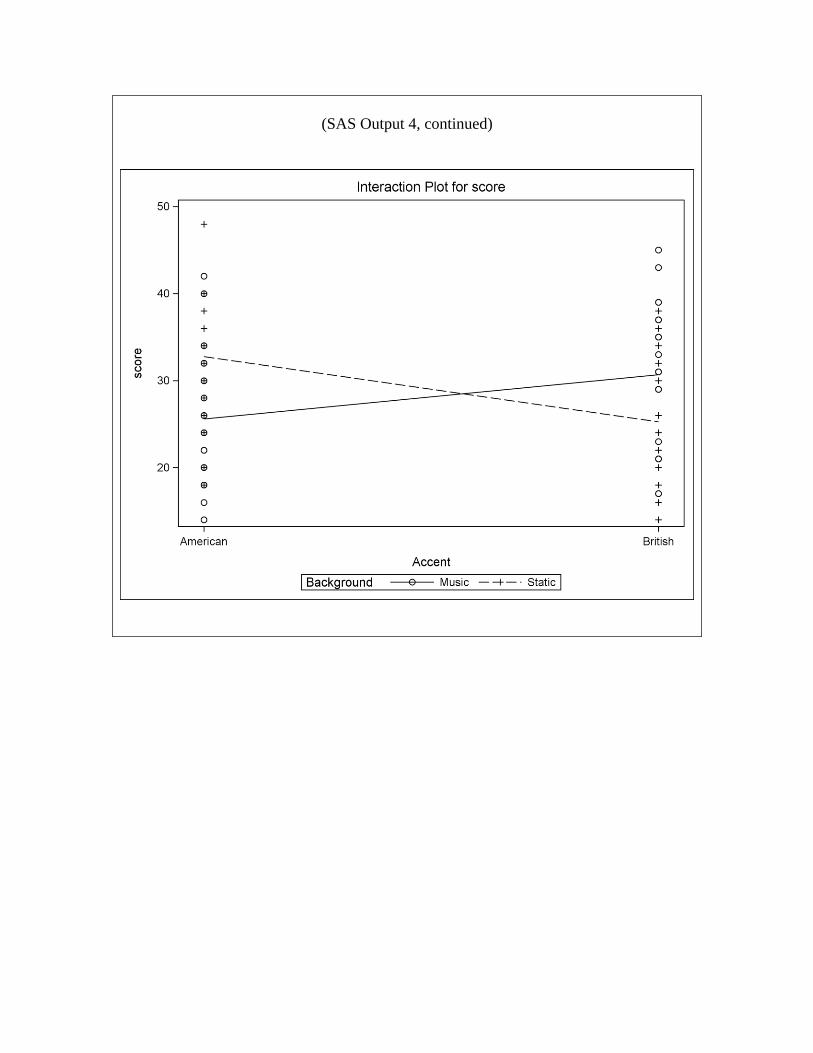
Question 7: With the additional information about factors Accent and Background
from Question 6 above, refer to the code and output for SAS Output 4, as well as the
initial description of the study (on the first page of this exam).
a) (4 points) This is a _____ by _____ factorial design with _____ replicates at each
factor level combination. (Fill in the blanks.)
b) (4 points) What is the experimental unit in this design?
c) (4 points) The measurement unit in this design is not the same as the experimental
unit. What is the measurement unit in this design?
d) (7 points) The interaction term is significant here (P-value 0.0002). Without
referring to the interaction plot, what does it mean to say there is an interaction
here?
e) (7 points) An observer sees that the P-value for Accent (0.4554) is not
significant, and says that you can conclude that speaker accent does not affect
score. Referring to specific evidence in SAS Output 4, explain clearly why the
observer’s conclusion is wrong, and how speaker accent does affect score.
Question 8: (1 point) What topic(s) did you study most that did not appear on this exam?
Page 6
SAS Code & Output for STAT 5200 Fall 2018 Midterm Exam
proc glm data=hearing plots=diagnostic;
class recording;
model score = recording;
title1 'SAS Output 1';
run;
SAS Output 1
The GLM Procedure
Class Level Information
Class Levels Values
recording 4 1 2 3 4
Dependent Variable: score
Source DF Sum of Squares Mean Square F Value Pr > F
Model 3 1003.458333 334.486111 5.36 0.0019
Error 92 5738.166667 62.371377
Corrected Total 95 6741.625000
Source DF Type I SS Mean Square F Value Pr > F
recording 3 1003.458333 334.486111 5.36 0.0019
Source DF Type III SS Mean Square F Value Pr > F
recording 3 1003.458333 334.486111 5.36 0.0019
(SAS Output 1 continues on next page)
Page 7
(SAS Output 1, continued)
Page 8
proc transreg data=hearing;
model boxcox(score / lambda=0 to 1.5 by 0.05)
= class(recording);
title1 'SAS Output 2';
run;
SAS Output 2
Page 9
proc glm data=hearing;
class recording;
model score = recording;
means recording / LSD DUNNETT('3') REGWQ;
lsmeans recording / pdiff;
title1 'SAS Output 3';
run;
SAS Output 3
t Tests (LSD) for score
Note: This test controls the Type I comparisonwise error rate, not the experimentwise error rate.
Alpha 0.05
Error Degrees of Freedom 92
Error Mean Square 62.37138
Critical Value of t 1.98609
Least Significant Difference 4.5279
Means with the same letter
are not significantly different.
t Grouping Mean N recording
A 32.750 24 1
A
A 30.667 24 2
B 25.583 24 4
B
B 25.250 24 3
(SAS Output 3 continues on next page)
Page 10
(SAS Output 3, continued)
Dunnett's t Tests for score
Note: This test controls the Type I experimentwise error for comparisons of all treatments against a control.
Alpha 0.05
Error Degrees of Freedom 92
Error Mean Square 62.37138
Critical Value of Dunnett's t 2.38842
Minimum Significant Difference 5.4452
Comparisons significant at the 0.05 level
are indicated by ***.
recording
Comparison
Difference
Between
Means
Simultaneous 95% Confidence
Limits
1 - 3 7.500 2.055 12.945 ***
2 - 3 5.417 -0.029 10.862
4 - 3 0.333 -5.112 5.779
(SAS Output 3 continues on next page)
Page 11
(SAS Output 3, continued)
Ryan-Einot-Gabriel-Welsch Multiple Range Test for score
Note: This test controls the Type I experimentwise error rate.
Alpha 0.05
Error Degrees of Freedom 92
Error Mean Square 62.37138
Number of Means 2 3 4
Critical Range 5.1831876 5.4310815 5.9654322
Means with the same letter
are not significantly different.
REGWQ Grouping Mean N recording
A 32.750 24 1
A
B A 30.667 24 2
B
B 25.583 24 4
B
B 25.250 24 3
Page 12
proc glm data=hearing;
class Accent Background;
model score = Accent|Background;
title1 'SAS Output 4';
run;
SAS Output 4
Class Level Information
Class Levels Values
Accent 2 American British
Background 2 Music Static
Number of Observations Read 96
Number of Observations Used 96
Dependent Variable: score
Source DF Sum of Squares Mean Square F Value Pr > F
Model 3 1003.458333 334.486111 5.36 0.0019
Error 92 5738.166667 62.371377
Corrected Total 95 6741.625000
R-Square Coeff Var Root MSE score Mean
0.148845 27.65008 7.897555 28.56250
Source DF Type III SS Mean Square F Value Pr > F
Accent 1 35.0416667 35.0416667 0.56 0.4554
Background 1 18.3750000 18.3750000 0.29 0.5886
Accent*Background 1 950.0416667 950.0416667 15.23 0.0002
(SAS Output 4 continues on next page)
Page 13
(SAS Output 4, continued)