22
Statistical Report 2012

Sta
tistical R
eport 2
012

2012 Statistical Report
Page 1
2012 Statistical Report E X P O R T S – U K – P R O D U C T I O N – S T O C K - E M P L O Y M E N T
Many of the tables summarise information sent to members of the Scotch Whisky Association (SWA) during the
year. The source of such information is HM Revenue & Customs and the SWA Databank. HMRC export figures
record direct shipments from the UK. Some shipments may be subject to further transfer to third countries.
Where information received is subject to subsequent amendment, the latest possible corrected figures have been
used in this report. Thus, a small number of figures may have altered from earlier reports.
2012 grain production data is not included in the report because of the limited number of operators contributing
to the data and the need to preserve producer confidentiality. The SWA may be able to resume the publication
of grain production data if circumstances change.
Comparative figures for the previous year or years are provided where appropriate. All figures are given for
calendar years unless stated.
New Combined Nomenclature (CN) Codes were introduced on 1 January 2010 to reflect the new Scotch Whisky
categories as defined by The Scotch Whisky Regulations 2009. The codes do not include Northern Ireland
whiskies or imported whiskies.
2208.30.30 Bottled Single Malt
2208.30.41 Bottled Blended Malt 2208.30.49 Bulk Blended Malt
2208.30.61 Bottled Single/Blended Grain 2208.30.69 Bulk Single/Blended Grain
2208.30.71 Bottled Blended 2208.30.79 Bulk Blended

2012 Statistical Report
Page 2
Table of Contents
PRODUCTION ..................................................................................................................................................... 3
1 Scotch Whisky Production 1981 to 2012 ....................................................................................................................... 3
EMPLOYMENT ..................................................................................................................................................... 3
2 Numbers employed by member companies by region as at September 2012 ..................................................... 3
STOCK ................................................................................................................................................................ 4
3 Stocks of whisky in bonded warehouses as at 31 December 1981 to 2012 .......................................................... 4
4 Stocks of maturing Scotch Whisky 1980 to 2012......................................................................................................... 4
5 Changes in bulk stock by type and year produced ..................................................................................................... 5
UK MARKET ........................................................................................................................................................ 6
6 Monthly totals of Scotch Whisky released for consumption in the UK for 2012 and 2011 ................................. 6
7 Annual totals of Scotch Whisky released for consumption in the UK for the years ending 31 March and 31
December 1981 to 2012................................................................................................................................................... 6
EXPORT MARKETS ............................................................................................................................................. 7
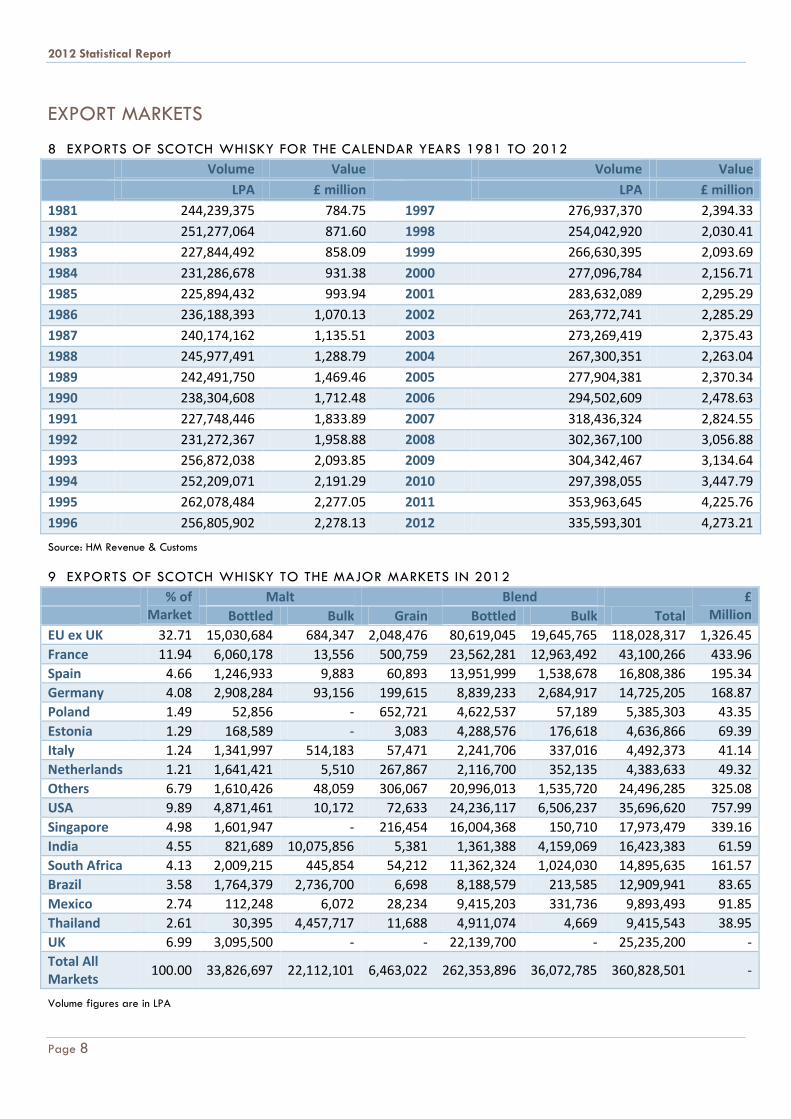
8 Exports of Scotch Whisky for the calendar years 1981 to 2012 ............................................................................. 8
9 Exports of Scotch Whisky to the major markets in 2012 ............................................................................................. 8
10 Summary of 2012 exports of Scotch Whisky by market groups ............................................................................... 9
11 Exports of Scotch Whisky for 2012 and 2011 .......................................................................................................... 10
12 Top 20 markets for Scotch Whisky in 2012 ................................................................................................................ 10
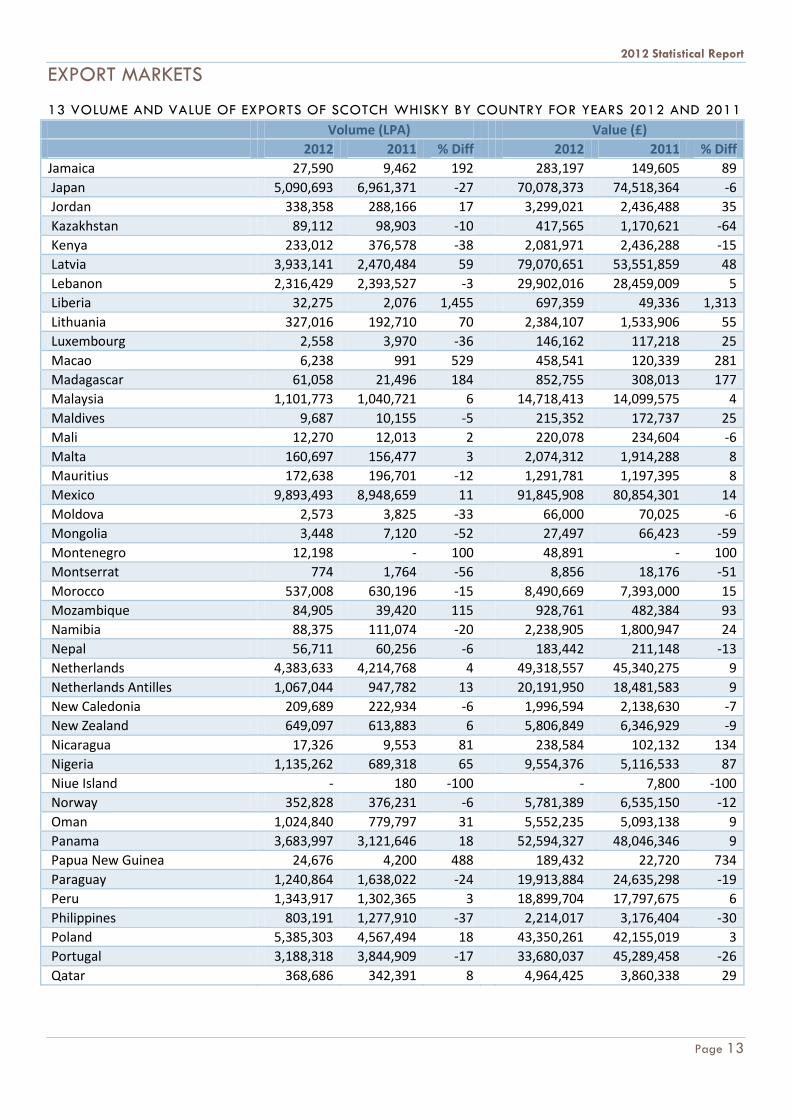
13 Volume and value of Scotch Whisky exports by country for years ending 31 December 2012 and 2011.. 11
14 Global Scotch Whisky by category for the year ending 2012.............................................................................. 15
15 Geographic distribution of 2012 world sales of Blended Scotch Whisky ............................................................ 16
16 Market distribution of 2012 sales of Blended Scotch Whisky in continental Europe .......................................... 17
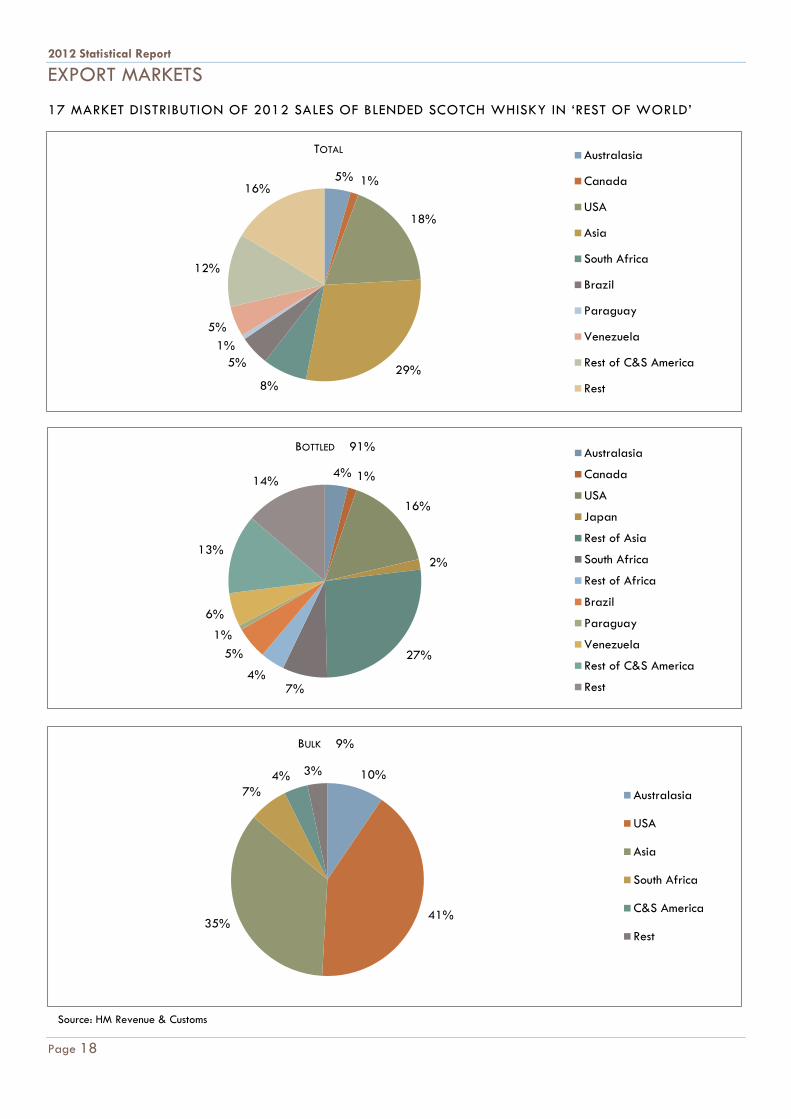
17 Market distribution of 2012 sales of Blended Scotch Whisky in ‘rest of world’ .................................................. 18
18 Market distribution of 2012 sales of Malt Scotch Whisky ....................................................................................... 19
UK MARKET ...................................................................................................................................................... 20
19 Scotch Whisky – incidence of duty ................................................................................................................................ 20
20 Duty ratios per centilitre of alcohol between other alcoholic drinks and Scotch Whisky ................................... 20
21 Approximate amount of duty on a normal measure of three kinds of alcoholic drink, each containing
approximately the same amount of alcohol................................................................................................................ 20
APPENDIX ........................................................................................................................................................ 21
22 Country listing per region ............................................................................................................................................... 21

2012 Statistical Report
Page 3
PRODUCTION
1 SCOTCH WHISKY PRODUCTION 1981 TO 2012
Year Ending 31 Dec Malt Grain Total LPA
Year Ending 31 Dec Malt Grain Total LPA
1981 110,083,000 157,898,000 267,981,000
1997 192,980,001 277,886,386 470,866,387
1982 96,649,000 151,021,000 247,670,000
1998 184,615,185 257,535,732 442,150,917
1983 93,398,000 145,683,000 239,081,000
1999 159,553,570 235,493,607 395,047,177
1984 99,540,000 153,908,000 253,448,000
2000 140,600,602 205,299,263 345,899,865
1985 104,803,000 155,777,000 260,580,000
2001 139,661,253 207,671,006 347,332,259
1986 103,823,000 161,124,000 264,947,000
2002 151,346,366 219,450,288 370,796,654
1987 115,974,000 173,719,000 289,693,000
2003 146,691,064 228,722,226 375,413,290
1988 138,041,000 191,897,000 329,938,000
2004 143,809,718 214,189,839 357,999,557
1989 167,187,000 218,294,000 385,481,000
2005 156,184,682 232,642,260 388,826,942
1990 192,823,000 235,939,000 428,762,000
2006 167,908,141 261,544,767 429,452,908
1991 186,265,957 230,534,943 416,800,900
2007 201,029,856 294,245,497 495,275,353
1992 166,491,138 216,975,189 383,466,327
2008 225,198,949 298,810,242 524,009,191
1993 140,942,181 210,235,959 351,178,140
2009 208,836,536 249,318,389 458,154,925
1994 146,424,242 208,489,770 354,914,012
2010 191,451,693 237,687,660 429,139,353
1995 158,079,324 236,159,123 394,238,447
2011 227,492,175 290,430,031 517,922,206
1996 170,135,855 258,965,585 429,101,440
2012 254,760,501 - 254,760,501
EMPLOYMENT
2 NUMBERS EMPLOYED BY SWA MEMBER COMPANIES BY REGION AS AT SEPTEMBER 2012
1,830
1,230
389
785 227
4,263
139
Central & Fife
Grampian
Highland
Lothian
Rest of UK
Strathclyde
Tayside
Figures for 1991 to 2012 are compiled from the SWA Databank. 2012 grain production data is not included in the report because of the limited
number of operators contributing to the data and the need to preserve producer confidentiality. The SWA may be able to resume the publication of
grain production data if circumstances change.
Figures are compiled from the SWA Databank and relate only to those member company employees directly employed within the Scotch Whisky
industry.

2012 Statistical Report
Page 4
STOCK
3 STOCKS OF SCOTCH WHISKY IN BONDED WAREHOUSES AS AT 31 DECEMBER 1981 AND 2012
Year Million LPA
Year Million LPA
1981 2,933.64
1997 2,848.16
1982 2,830.46
1998 2,904.60
1983 2,743.62
1999 2,945.58
1984 2,661.97
2000 2,938.78
1985 2,598.26
2001 2,926.39
1986 2,453.01
2002 2,935.16
1987 2,438.32
2003 2,947.75
1988 2,433.20
2004 2,927.27
1989 2,473.10
2005 2,899.32
1990 2,543.20
2006 2,889.35
1991 2,604.40
2007 2,996.02
1992 2,628.76
2008 3,073.21
1993 2,655.39
2009 3,179.75
1994 2,661.67
2010 3,208.96
1995 2,647.38
2011 3,244.86
1996 2,722.28
2012 3,381.27
4 STOCKS OF MATURING SCOTCH WHISKY 1981 TO 2012
Stock for 1991 to 2012 are compiled from the SWA Databank.
-
500.00
1,000.00
1,500.00
2,000.00
2,500.00
3,000.00
3,500.00
19
81
19
82
19
83
19
84
19
85
19
86
19
87
19
88
19
89
19
90
19
91
19
92
19
93
19
94
19
95
19
96
19
97
19
98
19
99
20
00
20
01
20
02
20
03
20
04
20
05
20
06
20
07
20
08
20
09
20
10
20
11
20
12
mLPA
Stock for 1991 to 2012 are compiled from the SWA Databank.

2012 Statistical Report
Page 5
STOCK
5 CHANGES IN BULK STOCKS BY TYPE AND YEAR PRODUCED
Stocks as at Dec 2012
Stocks as at Dec 2011
+/-
Bulk Malt Whisky
Produced in 2012 255,222,244
-
255,222,244
Produced in 2011 223,125,644
228,512,405
-5,386,761
Produced in 2010 199,135,872
200,132,821
-996,949
Produced in 2009 174,010,323
208,717,673
-34,707,350
Produced in 2008 158,858,076
188,620,533
-29,762,457
Produced in 2007 112,615,518
139,981,381
-27,365,863
Produced in 2006 90,177,028
99,194,123
-9,017,095
Produced in 2005 80,715,393
81,347,944
-632,551
Produced in 2004 61,316,511
62,831,707
-1,515,196
Produced in 2003 54,459,098
54,809,200
-350,102
Produced in 2002 51,718,111
54,324,199
-2,606,088
Produced pre 2002 266,712,238
339,226,292
-72,514,054
Total 1,728,066,056
1,657,698,278
70,367,778
Bulk Grain Whisky
Produced in 2012 307,646,108
-
307,646,108
Produced in 2011 287,452,608
286,356,962
1,095,646
Produced in 2010 231,645,308
230,179,431
1,465,877
Produced in 2009 169,601,928
235,343,861
-65,741,933
Produced in 2008 129,005,595
196,657,666
-67,652,071
Produced in 2007 93,449,876
129,061,184
-35,611,308
Produced in 2006 79,984,270
93,995,313
-14,011,043
Produced in 2005 52,245,012
56,727,011
-4,481,999
Produced in 2004 39,653,033
40,478,033
-825,000
Produced in 2003 44,420,688
45,533,682
-1,112,994
Produced in 2002 35,999,279
36,102,166
-102,887
Produced pre 2002 182,095,440
236,722,589
-54,627,149
Total 1,653,199,145
1,587,157,898
66,041,247
Bulk Malt and Grain Whisky
Total Bulk Malt 1,728,066,056
1,657,698,278
70,367,778
Total Bulk Grain 1,653,199,145
1,587,157,898
66,041,247
Total 3,381,265,201
3,244,856,176
136,409,025 .
1. The criterion for gathering stock figures changed in 1994. From 1994, figures now include stock owned by non-members of the SWA but
stored in SWA members’ warehouses.
2. Stock data are compiled from the SWA Databank.

2012 Statistical Report
Page 6
UK MARKET
6 MONTHLY TOTALS OF SCOTCH WHISKY RELEASED FOR CONSUMPTION IN THE UK FOR 2012 AND
2011
2012 2011
Malt Grain Blended Total Malt Grain Blended Total
January 157,700 - 1,125,200 1,282,900 165,000 600 1,286,400 1,452,000
February 127,300 - 1,352,200 1,479,500 129,400 500 1,339,000 1,468,900
March 297,400 - 4,087,600 4,385,000 245,300 900 3,317,600 3,563,800
April 166,800 - 717,100 883,900 110,100 1,200 785,400 896,700
May 217,900 - 1,241,400 1,459,300 231,700 6,400 1,187,700 1,425,800
June 249,900 - 1,320,900 1,570,800 250,000 6,700 1,583,300 1,840,000
July 167,600 - 1,135,500 1,303,100 201,000 - 1,489,200 1,690,200
August 175,100 - 1,394,100 1,569,200 201,700 - 1,543,700 1,745,400
September 204,700 - 1,672,700 1,877,400 238,200 - 1,784,500 2,022,700
October 313,400 - 2,456,000 2,769,400 405,700 - 2,433,000 2,838,700
November 544,700 - 3,320,700 3,865,400 552,400 - 2,968,000 3,520,400
December 473,000 - 2,316,300 2,789,300 487,000 - 2,257,800 2,744,800
Total 3,095,500 - 22,139,700 25,235,200 3,217,500 16,300 21,975,600 25,209,400
7 ANNUAL TOTALS OF SCOTCH WHISKY RELEASED FOR UK CONSUMPTION FOR THE YEARS ENDING
31 MARCH AND 31 DECEMBER 1981 TO 2012
31 March 31 December % 31 March 31 December %
1981 49,727,800 47,710,800 -5 1997 31,936,100 31,198,400 -3
1982 45,601,200 44,751,100 -6 1998 29,899,000 28,863,800 -7
1983 43,137,400 44,479,800 -1 1999 30,368,700 32,276,100 12
1984 45,369,700 43,358,800 -3 2000 32,150,300 31,382,200 -3
1985 43,130,800 46,145,700 6 2001 31,732,000 32,079,300 2
1986 45,936,800 45,636,000 -1 2002 32,060,600 32,068,600 -0
1987 41,351,000 44,599,000 -2 2003 32,585,400 31,829,900 -1
1988 44,859,600 45,181,300 1 2004 31,906,400 31,929,500 0
1989 42,920,100 43,028,200 -5 2005 31,399,800 30,088,300 -6
1990 42,448,400 41,341,500 -4 2006 29,631,400 28,259,200 -6
1991 42,079,300 38,261,600 -7 2007 28,830,000 28,591,400 1
1992 32,273,400 35,785,800 -6 2008 29,633,800 28,937,500 1
1993 36,034,700 37,548,100 5 2009 26,761,100 25,809,500 -11
1994 35,925,800 38,344,600 2 2010 28,413,400 26,684,500 3
1995 36,988,100 31,007,100 -19 2011 26,067,000 25,209,400 -6
1996 32,113,900 32,065,300 3 2012 25,872,100 25,235,200 0
From April 2011, UK produced grain whisky clearances have been added to UK produced blended whisky clearances to preserve tax payer
confidentiality. Source: HM Revenue & Customs
Source: HM Revenue & Customs

2012 Statistical Report
Page 7
2012 EXPORT STATISTICS
Scotch Whisky exports grew in value for the eighth
consecutive year in 2012, confirming the industry as
one of the UK’s top exporting sectors
Exports increased by 1%
in value to £4.27 billion.
Scotch Whisky delivered
£135 a second in
exports.
The equivalent of 1.19bn
bottles was shipped
worldwide.
Higher export value for
both Single Malt and
Blended Scotch
Whiskies.
Around 31% of exports
are to EU countries.
The USA remains the
largest market, with
exports up to 16% to
£758m.
2012 Statistical Report
Page 8
EXPORT MARKETS
8 EXPORTS OF SCOTCH WHISKY FOR THE CALENDAR YEARS 1981 TO 2012
Volume Value Volume Value
LPA £ million LPA £ million
1981 244,239,375 784.75 1997 276,937,370 2,394.33
1982 251,277,064 871.60 1998 254,042,920 2,030.41
1983 227,844,492 858.09 1999 266,630,395 2,093.69
1984 231,286,678 931.38 2000 277,096,784 2,156.71
1985 225,894,432 993.94 2001 283,632,089 2,295.29
1986 236,188,393 1,070.13 2002 263,772,741 2,285.29
1987 240,174,162 1,135.51 2003 273,269,419 2,375.43
1988 245,977,491 1,288.79 2004 267,300,351 2,263.04
1989 242,491,750 1,469.46 2005 277,904,381 2,370.34
1990 238,304,608 1,712.48 2006 294,502,609 2,478.63
1991 227,748,446 1,833.89 2007 318,436,324 2,824.55
1992 231,272,367 1,958.88 2008 302,367,100 3,056.88
1993 256,872,038 2,093.85 2009 304,342,467 3,134.64
1994 252,209,071 2,191.29 2010 297,398,055 3,447.79
1995 262,078,484 2,277.05 2011 353,963,645 4,225.76
1996 256,805,902 2,278.13 2012 335,593,301 4,273.21
9 EXPORTS OF SCOTCH WHISKY TO THE MAJOR MARKETS IN 2012
% of Market
Malt Blend
Total
£ Million Bottled Bulk Grain Bottled Bulk
EU ex UK 32.71 15,030,684 684,347 2,048,476 80,619,045 19,645,765 118,028,317 1,326.45
France 11.94 6,060,178 13,556 500,759 23,562,281 12,963,492 43,100,266 433.96
Spain 4.66 1,246,933 9,883 60,893 13,951,999 1,538,678 16,808,386 195.34
Germany 4.08 2,908,284 93,156 199,615 8,839,233 2,684,917 14,725,205 168.87
Poland 1.49 52,856 - 652,721 4,622,537 57,189 5,385,303 43.35
Estonia 1.29 168,589 - 3,083 4,288,576 176,618 4,636,866 69.39
Italy 1.24 1,341,997 514,183 57,471 2,241,706 337,016 4,492,373 41.14
Netherlands 1.21 1,641,421 5,510 267,867 2,116,700 352,135 4,383,633 49.32
Others 6.79 1,610,426 48,059 306,067 20,996,013 1,535,720 24,496,285 325.08
USA 9.89 4,871,461 10,172 72,633 24,236,117 6,506,237 35,696,620 757.99
Singapore 4.98 1,601,947 - 216,454 16,004,368 150,710 17,973,479 339.16
India 4.55 821,689 10,075,856 5,381 1,361,388 4,159,069 16,423,383 61.59
South Africa 4.13 2,009,215 445,854 54,212 11,362,324 1,024,030 14,895,635 161.57
Brazil 3.58 1,764,379 2,736,700 6,698 8,188,579 213,585 12,909,941 83.65
Mexico 2.74 112,248 6,072 28,234 9,415,203 331,736 9,893,493 91.85
Thailand 2.61 30,395 4,457,717 11,688 4,911,074 4,669 9,415,543 38.95
UK 6.99 3,095,500 - - 22,139,700 - 25,235,200 -
Total All Markets
100.00 33,826,697 22,112,101 6,463,022 262,353,896 36,072,785 360,828,501 -
Source: HM Revenue & Customs
Volume figures are in LPA

2012 Statistical Report
Page 9
EXPORT MARKETS
10 SUMMARY OF 2012 EXPORTS OF SCOTCH WHISKY BY MARKET GROUPS
Volume Value
2012 2011 % Diff
2012 2011 % Diff
1. Europe
EUƗ 118,028,317 132,303,170 -11 1,326,452,691 1,448,326,333 -8
Eastern Europe 3,400,605 3,956,298 -14 39,314,962 48,982,325 -20
Other 6,095,295 6,905,534 -12 86,313,046 77,164,062 12
Total 127,524,217 143,165,002 -11 1,452,080,699 1,574,472,720 -8
2. Americas
a. North America
Canada & St Pierre-Miquelon 3,108,654 3,219,770 -3 63,422,370 60,493,574 5
USA 35,696,620 36,398,458 -2 757,985,401 654,899,296 16
Mexico 9,893,493 8,948,659 11 91,845,908 80,854,301 14
Sub-total 48,698,767 48,566,887 0 913,253,679 796,247,171 15
b. Central & South America 44,869,554 45,407,648 -1 505,376,527 489,279,849 3
Total 93,568,321 93,974,535 -0 1,418,630,206 1,285,527,020 10
3. Australasia
Australia 7,410,375 7,436,064 -0 78,593,608 69,288,231 13
New Zealand 649,097 613,883 6 5,806,849 6,346,929 -9
Other 271,047 271,496 -0 2,645,143 2,836,588 -7
Total 8,330,519 8,321,443 0 87,045,600 78,471,748 11
4. Asia
Singapore 17,973,479 17,664,674 2 339,160,652 317,870,880 7
South Korea 7,496,514 8,799,650 -15 135,729,290 142,592,838 -5
Thailand 9,415,543 10,163,247 -7 38,950,349 50,253,381 -22
Other 38,110,565 40,038,892 -5 415,578,586 401,154,979 4
Total 72,996,101 76,666,463 -5 929,418,877 911,872,078 2
5. Africa
South Africa 14,895,635 13,765,856 8 161,570,751 165,507,244 -2
Other 6,359,722 5,291,921 20 77,096,442 58,591,589 32
Total 21,255,357 19,057,777 12 238,667,193 224,098,833 7
6. Middle East 11,918,786 12,778,425 -7 147,366,007 151,318,182 -3
Total Exports 335,593,301 353,963,645 -5 4,273,208,582 4,225,760,581 1
Ɨ Excludes United Kingdom Releases (see table 6)

2012 Statistical Report
Page 10
EXPORT MARKETS
11 EXPORTS OF SCOTCH WHISKY FOR 2012 AND 2011
Volume mlpa Value £m
2012 2011 +/- % 2012 2011 +/- %
Blended
- bottled 240.21 252.77 -12.55 -5 3,223.77 3,224.37 -0.60 -0
- shipped in bulk 36.07 39.02 -2.95 -8 124.71 111.82 12.89 12
Total Blended 276.29 291.79 -15.50 -5 3,348.48 3,336.20 12.29 0
Malt
- single 27.17 28.05 -0.89 -3 778.10 744.61 33.49 4
- blended bottled 3.57 3.47 0.10 3 54.31 41.21 13.11 32
- blended shipped in bulk
22.11 22.54 -0.43 -2 72.48 70.24 2.24 3
Total Malt 52.84 54.06 -1.22 -2 904.90 856.06 48.84 6
Single/Blended Grain
- bottled 0.18 1.07 -0.90 -83 1.90 8.77 -6.87 -78
- shipped in bulk 6.29 7.04 -0.76 -11 17.93 24.74 -6.81 -28
Total Grain 6.46 8.12 -1.65 -20 19.83 33.51 -13.68 -41
Total Exports 335.59 353.96 -18.37 -5 4,273.21 4,225.76 47.45 1
12 TOP 20 EXPORT MARKETS FOR SCOTCH WHISKY IN 2012
Volume Value
Rank Country LPA Rank Country £ Sterling
1 France 43,100,266 1 USA 757,985,401
2 USA 35,696,620 2 France 433,963,881
3 Singapore 17,973,479 3 Singapore 339,160,652
4 Spain 16,808,386 4 Spain 195,339,341
5 India 16,423,383 5 Germany 168,865,341
6 South Africa 14,895,635 6 Taiwan 165,407,673
7 Germany 14,725,205 7 South Africa 161,570,751
8 Brazil 12,909,941 8 South Korea 135,729,290
9 Mexico 9,893,493 9 Venezuela 102,263,495
10 Thailand 9,415,543 10 Mexico 91,845,908
11 Venezuela 8,862,428 11 Brazil 83,649,175
12 South Korea 7,496,514 12 United Arab Emirates 80,357,018
13 Australia 7,410,375 13 Latvia 79,070,651
14 China 6,422,228 14 Australia 78,593,608
15 Taiwan 6,236,553 15 China 71,515,325
16 Poland 5,385,303 16 Japan 70,078,373
17 United Arab Emirates 5,365,767 17 Estonia 69,390,195
18 Japan 5,090,693 18 Canada 63,422,370
19 Estonia 4,636,866 19 India 61,592,090
20 Italy 4,492,373 20 Panama 52,594,327
Source: HM Revenue & Customs
Source: HM Revenue & Customs

2012 Statistical Report
Page 11
EXPORT MARKETS
13 VOLUME AND VALUE OF EXPORTS OF SCOTCH WHISKY BY COUNTRY FOR YEARS 2012 AND 2011
Volume (LPA) Value (£)
2012 2011 % Diff 2012 2011 % Diff
Albania 4,618 1,096 321 65,223 28,130 132
Algeria 107,009 182,170 -41 2,242,676 2,801,968 -20
Andorra 416,471 452,175 -8 3,769,981 4,008,570 -6
Angola 1,754,022 923,094 90 19,258,130 10,492,479 84
Anguilla 663 2,253 -71 11,987 56,044 -79
Antarctica - 4,082 -100 - 42,237 -100
Antigua & Barbuda 47,493 69,798 -32 928,151 989,665 -6
Argentina 1,574,689 1,720,332 -8 13,932,793 13,315,841 5
Armenia 34,508 26,804 29 596,278 336,707 77
Aruba 2,012,170 1,742,640 15 46,504,234 35,851,740 30
Australia 7,410,375 7,436,064 -0 78,593,608 69,288,231 13
Austria 310,460 260,235 19 4,675,079 4,325,522 8
Azerbaijan 36,515 16,584 120 1,144,285 648,245 77
Bahamas 14,386 16,409 -12 295,886 410,061 -28
Bahrain 717,536 831,248 -14 5,742,506 5,480,596 5
Bangladesh 37,856 74,630 -49 231,419 421,805 -45
Barbados 9,344 26,966 -65 276,394 742,250 -63
Belarus 205,258 105,348 95 974,551 887,942 10
Belgium 1,803,911 1,443,434 25 24,426,505 20,619,871 18
Belize 67,092 46,230 45 1,974,707 1,473,909 34
Benin 16,830 52,663 -68 518,582 611,971 -15
Bermuda 12,416 17,054 -27 227,288 304,466 -25
Bhutan 10,719 28,628 -63 78,987 328,039 -76
Bolivia 231,170 335,082 -31 5,027,413 5,527,424 -9
Bosnia & Herzegovina 33,064 40,747 -19 342,325 633,313 -46
Brazil 12,909,941 13,145,354 -2 83,649,175 99,189,665 -16
Brunei Darussalam 4,044 2,955 37 21,106 22,183 -5
Bulgaria 2,217,928 1,817,159 22 20,121,399 18,893,649 6
Burkina Faso 41,539 29,272 42 1,070,670 466,206 130
Burma (Myanmar) 201,598 122,703 64 883,734 534,097 65
Cambodia 368 5,168 -93 37,706 50,293 -25
Cameroon 268,076 263,286 2 2,671,769 2,415,701 -11
Canada 3,108,654 3,219,770 -3 63,422,370 60,493,574 5
Cape Verde 42,585 48,068 11 546,148 582,949 -6
Cayman Islands 7,930 3,452 130 230,049 98,020 135
Central African Republic - 16,324 -100 - 113,983 -100
Ceuta 4 - 100 1,769 - 100
Chile 2,457,135 2,078,210 18 27,861,379 21,897,790 27
China 6,422,228 6,168,060 4 71,515,325 66,075,590 8
Colombia 1,930,775 1,828,414 6 22,703,080 23,627,713 -4
Congo 80,166 79,127 1 1,115,479 1,216,955 -8
Congo Democratic Republic 87,236 94,875 -8 1,917,703 1,724,007 -11

2012 Statistical Report
Page 12
EXPORT MARKETS
13 VOLUME AND VALUE OF EXPORTS OF SCOTCH WHISKY BY COUNTRY FOR YEARS 2012 AND 2011
Volume (LPA) Value (£)
2012 2011 % Diff 2012 2011 % Diff
Costa Rica 719,833 648,025 11 8,094,521 6,631,569 22
Croatia 253,926 192,737 32 2,831,146 2,161,344 31
Cuba 93,268 69,122 35 868,661 722,513 20
Cyprus 930,448 779,855 19 13,162,178 10,255,077 28
Czech Republic 848,424 354,305 139 8,108,181 3,691,094 120
Denmark 1,249,700 1,080,392 16 15,138,800 13,730,696 10
Djibouti 109,537 103,790 6 1,076,619 958,910 12
Dominica 15,783 9,906 59 187,036 161,755 16
Dominican Republic 1,774,924 2,417,520 -27 24,719,373 23,831,235 4
Ecuador 828,681 1,702,782 -51 5,732,296 9,841,090 -42
Egypt 332,331 239,136 39 5,407,675 4,594,452 18
El Salvador 45,155 60,722 -26 695,160 961,738 -28
Equatorial Guinea 86,443 107,851 -20 1,952,465 1,518,996 29
Estonia 4,636,866 4,208,408 10 69,390,195 54,078,786 28
Ethiopia 141,049 147,315 -4 2,925,827 3,074,856 -5
Falkland Islands 1,627 991 64 25,115 12,088 108
Fiji 5,002 4,634 8 28,867 53,465 -46
Finland 849,257 570,583 49 10,843,412 7,578,410 43
France 43,100,266 57,473,661 -25 433,963,881 535,424,982 -19
French Polynesia 24,171 27,603 -12 218,021 254,765 -14
Gabon 208,289 177,938 17 2,749,861 2,222,839 24
Gambia 1,483 1,003 48 13,819 13,237 4
Georgia 196,683 180,108 9 2,996,277 2,551,351 17
Germany 14,725,205 13,973,824 5 168,865,341 149,559,681 13
Ghana 160,642 126,690 27 1,169,986 823,102 42
Gibraltar 36,561 47,109 -22 442,262 615,960 -28
Greece 3,680,337 4,664,501 -21 49,614,151 70,485,066 -30
Grenada 6,908 6,824 1 118,718 111,125 7
Guam 6,485 11,608 -44 202,183 356,074 -43
Guatemala 259,117 300,223 -14 3,840,389 3,826,221 0
Guinea 7,357 3,804 93 196,143 58,936 233
Haiti 38,666 137,855 -72 331,933 1,259,968 -74
Honduras 16,611 53,959 -69 432,316 1,231,905 - 65
Hong Kong 1,069,828 1,201,960 -11 20,709,307 22,459,155 -8
Hungary 543,061 505,134 8 4,762,634 5,369,037 -11
Iceland 22,278 20,390 9 335,767 344,652 -3
India 16,423,383 15,669,319 5 61,592,090 52,739,959 17
Indonesia 2,946 - 100 126,333 - 100
Iran 3,078 - 100 14,041 - 100
Iraq 895,920 1,112,466 -19 8,125,347 10,351,791 -22
Irish Republic 488,982 355,450 38 4,790,777 3,454,512 39
Israel 857,762 965,013 -11 9,053,256 12,356,455 -27
Italy 4,492,373 4,438,579 1 41,140,370 46,106,072 -11
Ivory Coast 47,349 32,746 45 667,641 415,043 61
2012 Statistical Report
Page 13
EXPORT MARKETS
13 VOLUME AND VALUE OF EXPORTS OF SCOTCH WHISKY BY COUNTRY FOR YEARS 2012 AND 2011
Volume (LPA) Value (£)
2012 2011 % Diff 2012 2011 % Diff
Jamaica 27,590 9,462 192 283,197 149,605 89
Japan 5,090,693 6,961,371 -27 70,078,373 74,518,364 -6
Jordan 338,358 288,166 17 3,299,021 2,436,488 35
Kazakhstan 89,112 98,903 -10 417,565 1,170,621 -64
Kenya 233,012 376,578 -38 2,081,971 2,436,288 -15
Latvia 3,933,141 2,470,484 59 79,070,651 53,551,859 48
Lebanon 2,316,429 2,393,527 -3 29,902,016 28,459,009 5
Liberia 32,275 2,076 1,455 697,359 49,336 1,313
Lithuania 327,016 192,710 70 2,384,107 1,533,906 55
Luxembourg 2,558 3,970 -36 146,162 117,218 25
Macao 6,238 991 529 458,541 120,339 281
Madagascar 61,058 21,496 184 852,755 308,013 177
Malaysia 1,101,773 1,040,721 6 14,718,413 14,099,575 4
Maldives 9,687 10,155 -5 215,352 172,737 25
Mali 12,270 12,013 2 220,078 234,604 -6
Malta 160,697 156,477 3 2,074,312 1,914,288 8
Mauritius 172,638 196,701 -12 1,291,781 1,197,395 8
Mexico 9,893,493 8,948,659 11 91,845,908 80,854,301 14
Moldova 2,573 3,825 -33 66,000 70,025 -6
Mongolia 3,448 7,120 -52 27,497 66,423 -59
Montenegro 12,198 - 100 48,891 - 100
Montserrat 774 1,764 -56 8,856 18,176 -51
Morocco 537,008 630,196 -15 8,490,669 7,393,000 15
Mozambique 84,905 39,420 115 928,761 482,384 93
Namibia 88,375 111,074 -20 2,238,905 1,800,947 24
Nepal 56,711 60,256 -6 183,442 211,148 -13
Netherlands 4,383,633 4,214,768 4 49,318,557 45,340,275 9
Netherlands Antilles 1,067,044 947,782 13 20,191,950 18,481,583 9
New Caledonia 209,689 222,934 -6 1,996,594 2,138,630 -7
New Zealand 649,097 613,883 6 5,806,849 6,346,929 -9
Nicaragua 17,326 9,553 81 238,584 102,132 134
Nigeria 1,135,262 689,318 65 9,554,376 5,116,533 87
Niue Island - 180 -100 - 7,800 -100
Norway 352,828 376,231 -6 5,781,389 6,535,150 -12
Oman 1,024,840 779,797 31 5,552,235 5,093,138 9
Panama 3,683,997 3,121,646 18 52,594,327 48,046,346 9
Papua New Guinea 24,676 4,200 488 189,432 22,720 734
Paraguay 1,240,864 1,638,022 -24 19,913,884 24,635,298 -19
Peru 1,343,917 1,302,365 3 18,899,704 17,797,675 6
Philippines 803,191 1,277,910 -37 2,214,017 3,176,404 -30
Poland 5,385,303 4,567,494 18 43,350,261 42,155,019 3
Portugal 3,188,318 3,844,909 -17 33,680,037 45,289,458 -26
Qatar 368,686 342,391 8 4,964,425 3,860,338 29

2012 Statistical Report
Page 14
EXPORT MARKETS
13 VOLUME AND VALUE OF EXPORTS OF SCOTCH WHISKY BY COUNTRY FOR YEARS 2012 AND 2011
Volume (LPA) Value (£) 2012 2011 % Diff 2012 2011 % Diff Romania 1,198,412 1,232,508 -3 13,449,420 14,369,789 -6 Russia 2,117,353 2,969,370 -29 23,139,410 35,731,780 -35 San Marino 112 - 100 2,546 - 100 Sao Tome & Principe 2,712 72 3,667 38,486 18,745 105 Saudi Arabia 803 4,918 -84 6,939 25,270 -73 Senegal 16,132 30,959 -48 311,703 619,796 -50 Serbia 171,499 176,334 -3 1,809,162 1,699,285 6 Seychelles 41,242 42,415 -3 541,344 559,765 -3 Sierra Leone 12,604 8,356 51 157,190 156,126 1 Singapore 17,973,479 17,664,674 2 339,160,652 317,870,880 7 Slovakia 69,428 76,303 -9 777,573 651,654 19 Slovenia 220,597 226,948 -3 2,180,371 2,591,730 -16 South Africa 14,895,635 13,765,856 8 161,570,751 165,507,244 -2 South Georgia & Southern Sandwich
- 1,980 -100 - 18,925 -100 South Korea 7,496,514 8,799,650 -15 135,729,290 142,592,838 -5 Spain 16,808,386 20,947,576 -20 195,339,341 259,214,348 -25 Sri Lanka 344,563 517,285 -33 4,781,033 7,092,379 -33 St Christopher (St Kitts) & Nevis
14,299 10,537 36 158,957 132,660 20 St Helena 126 - 100 4,455 - 100 St Lucia 36,146 70,140 -48 192,431 603,106 -68 St Vincent 4,341 3,551 22 122,604 83,556 47 Surinam 338,980 378,877 -11 6,863,567 6,593,115 4 Swaziland 55,433 92,330 -40 343,451 433,497 -21 Sweden 2,473,610 2,443,503 1 35,678,996 38,024,334 -6 Switzerland 1,980,264 1,894,278 5 31,446,669 29,217,137 8 Syria 29,607 110,381 -73 349,203 1,255,317 -72 Taiwan 6,236,553 6,366,644 -2 165,407,673 155,156,832 7 Tanzania 217,521 213,359 2 1,632,246 1,564,433 4 Thailand 9,415,543 10,163,247 -7 38,950,349 50,253,381 -22 Togo 47,444 38,604 23 661,033 520,901 27 Trinidad & Tobago 298,632 487,027 -39 6,758,133 8,319,855 -19 Tunisia 20,057 21,551 -7 394,514 408,804 -3 Turkey 3,286,622 4,115,351 -20 44,515,931 36,442,593 22 Turks & Caicos Islands 2,562 2,333 10 105,057 93,722 12 Uganda 67,673 108,741 -38 422,022 594,011 -29 Ukraine 237,444 140,952 68 4,785,200 3,008,036 59 United Arab Emirates 5,365,767 5,950,518 -10 80,357,018 81,999,780 -2 Uruguay 2,809,662 3,008,587 -7 27,402,808 27,399,601 0 US Virgin Islands 41,816 56,547 -26 619,188 1,148,079 -46 USA 35,696,620 36,398,458 -2 757,985,401 654,899,296 16 Uzbekistan 5,854 3,490 68 98,649 55,546 78 Vatican City 155 - 100 16,732 - 100 Venezuela 8,862,428 7,908,031 12 102,263,495 83,398,587 23 Vietnam 284,738 523,016 -46 2,298,238 3,909,657 -41 Virgin Islands (British) 3,399 5,239 -35 91,731 139,796 -34 Wallis & Futuna Islands 1,024 337 204 10,046 3,134 221 Zambia 21,014 19,731 7 639,583 471,737 36 Zimbabwe 9,018 7,779 16 92,567 118,684 -22 Total 335,593,301 353,963,645 -5 4,273,208,582 4,225,760,581 1 Source: HM Revenue & Customs

2012 Statistical Report
Page 15
EXPORT MARKETS
14 GLOBAL SCOTCH WHISKY BY CATEGORY FOR THE YEAR ENDING 2012
8% 1%
7%
71%
11% 0% 2%
LPA
Single Malt
Bottled Blended Malt
Bulk Blended Malt
Bottled Blend
Bulk Blend
Bottled Single/Blended Grain
Bulk Single/Blended Grain
Source: HM Revenue & Customs
18%
1%
2%
76%
3% 0% 0%
£ STERLING
Single Malt
Bottled Blended Malt
Bulk Blended Malt
Bottled Blend
Bulk Blend
Bottled Single/Blended Grain
Bulk Single/Blended Grain

2012 Statistical Report
Page 16
EXPORT MARKETS 15 GEOGRAPHIC DISTRIBUTION OF 2012 WORLD EXPORTS OF BLENDED SCOTCH WHISKY
Source: HM Revenue & Customs
6%
16%
3%
13%
34%
10%
7%
11%
TOTAL
Africa
Asia
Australasia
C&S America
EU
USA
UK
Rest
7%
16%
2%
15%
31%
9%
8%
12%
BOTTLED 88%
Africa
Asia
Australasia
C&S America
EU
USA
UK
Rest
3%
15%
4%
2%
55%
18%
0% 3%
BULK 12%
Africa
Asia
Australasia
C&S America
EU
USA
UK
Rest

2012 Statistical Report
Page 17
EXPORT MARKETS
16 MARKET DISTRIBUTION OF 2012 EXPORTS OF BLENDED SCOTCH WHISKY IN CONTINENTAL
EUROPE
Source: HM Revenue & Customs
33%
14%
11%
4%
4%
2%
2%
4%
3%
14%
4% 5%
TOTAL France
Spain
Germany
Poland
Estonia
Italy
Netherlands
Latvia
Greece
Rest of EU
Eastern Europe
Other Markets
26%
16%
10% 5% 5%
3%
2%
4%
4%
15%
4% 6%
BOTTLED 82% France
Spain
Germany
Poland
Estonia
Italy
Netherlands
Latvia
Greece
Rest of EU
Eastern Europe
Other Markets
64%
8%
13% 0%
1%
2%
2%
0%
0%
7%
1% 2%
BULK 18% France
Spain
Germany
Poland
Estonia
Italy
Netherlands
Latvia
Greece
Rest of EU
Eastern Europe
Other Markets
2012 Statistical Report
Page 18
EXPORT MARKETS
17 MARKET DISTRIBUTION OF 2012 SALES OF BLENDED SCOTCH WHISKY IN ‘REST OF WORLD’
Source: HM Revenue & Customs
5% 1%
18%
29%
8%
5%
1%
5%
12%
16%
TOTAL Australasia
Canada
USA
Asia
South Africa
Brazil
Paraguay
Venezuela
Rest of C&S America
Rest
4% 1%
16%
2%
27%
7% 4%
5%
1%
6%
13%
14%
BOTTLED 91% Australasia
Canada
USA
Japan
Rest of Asia
South Africa
Rest of Africa
Brazil
Paraguay
Venezuela
Rest of C&S America
Rest
10%
41% 35%
7%
4% 3%
BULK 9%
Australasia
USA
Asia
South Africa
C&S America
Rest

2012 Statistical Report
Page 19
EXPORT MARKETS
18 MARKET DISTRIBUTION OF 2012 SALES OF MALT SCOTCH WHISKY
Source: HM Revenue & Customs
6%
11%
9%
2%
3%
2%
8%
18%
14%
27%
TOTAL United Kingdom
France
USA
Spain
Italy
Japan
C&S America
India
Rest of Europe
Rest of World
6%
11%
9%
2%
3%
14%
55%
BOTTLED 61%
United Kingdom
France
USA
Spain
Italy
Rest of Europe
Rest of World
12%
2%
8%
18% 60%
BULK 39%
France
Japan
C&S America
India
Rest of World

2012 Statistical Report
Page 20
UK DUTY
19 SCOTCH WHISKY – INCIDENCE OF DUTY
Duty per
75cl bottle
Duty per litre of
pure alcohol
Duty per
70cl bottle
Duty per
75cl bottle
Duty per litre of
pure alcohol
£ £ £ £ £
1947 13 November 1.11 3.68 1985 19 March 0 4.73 15.77
1948 12 April 1.23 4.06 1990 20 March 0 5.21 17.35
1961 26 July (10% Regulator) 1.35 4.47 1991 19 March 0 5.69 18.96
1964 15 April 1.5 4.96 1992 10 March 5.55 5.94 19.81
1965 7 April 1.7 5.63 1993 30 November 5.55 19.81
1966 21 July (10% Regulator) 1.87 6.19 1994 8 December 5.77 20.60
1968 20 March 2 6.61 1995 25 November 5.54 19.78
1968 22 November (10% Regulator) 2.2 7.26 1996 26 November 5.32 18.99
1973 1 April 1.8 5.95 1997 2 July 5.48 19.56
1974 27 March 1.98 6.55 1998 17 March 5.48 19.56
1975 15 April 2.57 8.51 2006 22 March 5.48 19.56
1976 6 April 2.87 9.49 2007 21 March 5.48 19.56
1977 1 January 3.16 10.44 2008 12 March 5.98 21.35
1980 27 March 3.56 11.87 2009 22 April 6.34 22.64
1981 10 March 4.08 13.6 2010 24 March 6.66 23.80
1982 9 March 4.34 14.47 2011 23 March 7.15 25.52
1983 15 March 4.56 15.19 2012 21 March 7.51 26.81
1984 13 March 4.64 15.48 2013 20 March 7.90 28.22
20 DUTY RATIOS PER UNIT OF ALCOHOL BETWEEN SCOTCH WHISKY AND OTHER ALCOHOLIC DRINKS
ABV 1998 1999 2000/1/2 2003 2004 2005 2006 2007 2008 2009 2010 2011 2012 2013
Beer 3.52% 1:1.76 1:1.70 1:1.65 1:1.60 1:1.55 1:1.51 1:1.48 1:1.43 1:1.32 1:1.38 1:1.37 1:1.38 1:1.38 1:1.48
Table Wine 12.50% 1:1.69 1:1.64 1:1.58 1:1.54 1:1.50 1:1.46 1:1.42 1:1.37 1:1.37 1:1.32 1:1.32 1:1.32 1:1.32 1:1.32
21 APPROX. AMOUNT OF DUTY ON A NORMAL MEASURE OF 3 KINDS OF ALCOHOLIC DRINK, EACH
CONTAINING APPROX. THE SAME AMOUNT OF ALCOHOL
ABV 2009 2010 2011 2012 2013
284ml (½ pint) Beer 3.52% 16.46 17.31p 18.56p 19.51p 19.12p
125ml Table Wine 12.50% 17.12 18.00p 19.34p 20.27p 21.34p
25ml Scotch Whisky 40.00% 22.64 23.80p 25.52p 26.81p 28.22p
Notes:
1. The 10% increase in the Spirits Duty in 1961, 1966, and 1968 were consolidated into the Spirit Duty by the Finance Act in the following years.
2. 70cl bottle mandatory from 1 January 1992 under EC Directive 75/106 (as subsequently amended).
3. The duty increase announced on 8 December 1994 came into effect from 1 January 1995.
4. The duty increase announced on 2 July 1997 came into effect from 1 January 1998.
5. The duty increase announced on 12 March 2008 came into effect from 17 March 2008.
6. VAT The duty was subject to Value Added Tax at 10% from 1 April 1973, 8% from 29 July 1975, 15% from 12 June 1979, 17.5% from 1 April 1991 and
20% from 4 January 2011.
7. The duty increase announced on: 24 March 2010 came into effect from 29 March 2010; 23 March 2011 from 28 March 2011; 21 March 2012 from 26
March 2012 and 20 March from 25 March 2013.

2012 Statistical Report
Page 21
EXPORT MARKETS
22 COUNTRY LISTING BY REGION
AFRICA
Algeria, Angola, Benin, Botswana, British Indian Ocean Territory, Burkina Faso, Burundi, Cameroon, Cape Verde, Central African
Republic, Chad, Comoros, Congo, Congo Democratic Republic, Djibouti, Egypt, Equatorial Guinea, Eritrea, Ethiopia, Gabon,
Gambia, Ghana, Guinea, Guinea-Bissau, Ivory Coast (Cote d’Ivoire), Kenya, Lesotho, Liberia, Libya, Madagascar, Malawi, Mali,
Mauritania, Mauritius, Mayotte, Morocco, Mozambique, Namibia, Niger, Nigeria, Reunion, Rwanda, Sao Tome & Principe, Senegal,
Seychelles, Sierra Leone, Somalia, South Africa, St Helena, Sudan, Swaziland, Tanzania, Togo, Tunisia, Uganda, Zambia,
Zimbabwe
ASIA
Afghanistan, Bangladesh, Bhutan, Brunei Darussalam, Burma (Myanmar), Cambodia, China, East Timor, Hong Kong, India, Indonesia,
Japan, Laos, Macao, Malaysia, Maldives, Mongolia, Nepal, North Korea, Pakistan, Philippines, Singapore, South Korea, Sri Lanka,
Taiwan, Thailand, Vietnam
AUSTRALIA
Australia, Christmas Islands, Cocos Islands, Cook Islands, Fiji, French Polynesia, Guam, Heard Island & McDonald Islands, Kiribati,
Marshall Islands, Micronesia, Nauru, New Caledonia, New Zealand, Niue Island, Norfolk Island, Palau, Papua New Guinea,
Pitcairn, Samoa, Solomon Islands, Tokelau Islands, Tonga, Tuvalu, US Minor Islands, Vanuatu, Wallis & Futuna Islands
CENTRAL & SOUTH AMERICAS
Anguilla, Antarctica, Antigua & Barbuda, Argentina, Aruba, Bahamas, Barbados, Belize, Bermuda, Bolivia, Bouvet Island, Brazil,
Cayman Islands, Chile, Colombia, Costa Rica, Cuba, Dominica, Dominican Republic, Ecuador, El Salvador, Falkland Islands, French
Guiana, French Southern Territories, Grenada, Guadeloupe, Guatemala, Guyana, Haiti, Honduras, Jamaica, Martinique,
Montserrat, Netherlands Antilles, Nicaragua, Panama, Paraguay, Peru, South Georgia & Southern Sandwich Islands, St Christopher
(St Kitts) & Nevis, St Lucia, St Vincent, Surinam, Trinidad & Tobago, Turks & Caicos Islands, Uruguay, US Virgin Islands, Venezuela,
Virgin Islands (British)
EASTERN EUROPE
Albania, Armenia, Azerbaijan, Belarus, Bosnia & Herzegovina, Croatia, Georgia, Kazakhstan, Kosovo, Kyrgyzstan, FYR Macedonia,
Moldova, Montenegro, Russia, Serbia, Tajikistan, Turkmenistan, Ukraine, Uzbekistan
EUROPE – OTHER
Andorra, Ceuta, Faroe Islands, Gibraltar, Greenland, Iceland, Liechtenstein, Melilla, Norway, San Marino, Svalbard Archipelago,
Switzerland, Turkey, Vatican City
EUROPEAN UNION (EXC UK)
Austria, Belgium, Bulgaria, Cyprus, Czech Republic, Denmark, Estonia, Finland, France, Germany, Greece, Hungary, Irish Republic,
Italy, Latvia, Lithuania, Luxembourg, Malta, Netherlands, Poland, Portugal, Romania, Slovakia, Slovenia, Spain, Sweden
MIDDLE EAST
Bahrain, Iran, Iraq, Israel, Jordan, Kuwait, Lebanon, Occupied Palestinian Territory, Oman, Qatar, Saudi Arabia, Syria, United
Arab Emirates, Yemen
NORTH AMERICA
Canada, Mexico, St Pierre & Miquelon, USA


![o o Ç v o t ' } Z v ] o / v À ] P ] } v r t } l W } P](https://static.documents.pub/doc/80x56/617285f98b6e611eb5339539/o-o-v-o-t-z-v-o-v-p-v-r-t-l-w-p.jpg)


