AERC STUDY No. 43 STATE AGRICULTURAL PROFILE – PUNJAB D K GROVER J M SINGH JASDEV SINGH SANJAY KUMAR Agro-Economic Research Centre Department of Economics and Sociology Punjab Agricultural University Ludhiana December, 2016
Transcript
AERC STUDY No. 43
STATE AGRICULTURAL PROFILE – PUNJAB
D K GROVER J M SINGH
JASDEV SINGH SANJAY KUMAR
Agro-Economic Research Centre Department of Economics and Sociology
Punjab Agricultural University Ludhiana
December, 2016
TABLE OF CONTENTS
Sr. No Chapter Page No.
1 Population Demography and Economy 1-10
1.1 Introduction 1
1.2 Population 2
1.3 Work force structure 4
1.4 Overview of state economy 5
2 Structure and Performance of Punjab Agriculture 11-27
2.1 Agrarian structure 11
2.1.1 Operational holdings 11
2.1.2 Cropping pattern 12
2.1.3 Relative share of different agricultural activities in primary sector 16
2.2 Growth performance of Punjab agriculture 17
2.3 Drivers of agricultural growth 20
2.4 Marketing and warehouse facilities 22
2.5 Emerging demand-supply mechanics 24
3 Natural Resources Management 28-38
3.1 Land use 28
3.2 Soil management 30
3.3 Cropping intensity 31
3.4 Land ceiling limit 32
3.5 Water management 32
3.6 Weather and climate 37
4 Farm Input Management 39-51
4.1 Seeds 39
4.2 Fertilizers and manures 40
4.3 Pesticides/weedicides 42
4.4 Farm machinery and equipments 43
4.5 Irrigation 45
4.6 Labour and agricultural wages 47
4.7 Credit 49
5 Major Crops: Area, Production and Yield 52-56
6 Agricultural Research, Education and Extension 57-60
7 Animal Husbandry, Dairying and Fisheries 61-65
8 Post harvest Management and Value Addition 66-72
References 73
LIST OF TABLES
Table No. Title Page No.
1.1 Population statistics of Punjab state 3 1.2 Description of rural and urban population in Punjab 4 1.3 Distribution of work force in Punjab 5
1.4 Gross State Value Added by sectors in Punjab at constant prices (base 2011-12) 6
1.5 Percentage distribution of Gross State Value Added by sectors in Punjab at constant prices (base 2011-12) 7
1.6 Gross State Value Added by sectors in Punjab at current prices (Rs. Lakh) 8
1.7 Percentage distribution of Gross State Value Added by sectors in Punjab at current prices 9
1.8 Per capita income in Punjab 10 2.1 Distribution of operational holdings in Punjab 12 2.2 Shift in cropping pattern in Punjab (1970-71 to 2013-14) 14
2.3 Share of different primary sub-sectors in total primary sector (at constant prices), Punjab 16
2.4 Share of different primary sub-sectors in total primary sector (at current prices), Punjab 17
2.5 Area, production and yield of different crops and milk production, 1971-72 to 2013-14, Punjab 18
2.6 Compound growth rates (CGR) of major crops and milk production in Punjab 19
2.7 Growth drivers in Punjab agriculture 21 2.8 Market and warehouse infrastructure in Punjab 23 2.9 Agency-wise state owned storage capacity in Punjab 24 2.10 Market arrivals of major crops in Punjab 25 2.11 Contribution of Punjab towards the central pool of food grains 25 2.12 Procurement of paddy and wheat by different agencies in Punjab 26 2.13 Purchase of cotton by cotton corporation of India 27 2.14 Area under different crops under contract farming scheme in Punjab 27 3.1 Land use pattern in Punjab 29 3.2 Land reclaimed through gypsum application, Punjab 30 3.3 Cropping intensity in Punjab State 32 3.4 Permissible land ceiling limit under Punjab Land Reforms Act, 1972 32 3.5 Source-wise net area irrigated in Punjab 33 3.6 Pre and post monsoon ground water level in Punjab 34
3.7 Distribution of blocks in different categories on basis of underground water resources in Punjab 35
3.8 Annual average rainfalls in Punjab 37 3.9 Important characteristics of agro-eco sub-regions of Punjab 38 4.1 Use of seed for major crops in Punjab 40
4.2 Seed prices of important crops in Punjab 40 4.3 Consumption of fertilizers in Punjab 41 4.4 Fertilizer prices in Punjab 41 4.5 Consumption of insecticides/pesticides in Punjab 42 4.6 Prices of important insecticides/weedicides/fungicides in Punjab 43 4.7 Agricultural machinery and implements in Punjab 44 4.8 Prices of selected agricultural machinery in Punjab 45 4.9 Gross cropped and irrigated area in Punjab 46 4.10 Status of water resources in Punjab 46 4.11 Crop wise gross irrigated area in Punjab 47 4.12 Labour use (per ha) for major crops in Punjab 49 4.13 Wages paid to agricultural and skilled labour in Punjab 49
4.14 Disbursement of institutional loans under agricultural and allied activities in Punjab 50
4.15 Number of kisan credit cards and amount sanctioned, distributed under KCC scheme 51
5.1 Area, production and yield (plan-wise) of major crops, Punjab 54 5.2 Plan-wise compound annual growth rates of major crops in Punjab 56
6.1 List of crop varieties/hybrids released by Punjab Agricultural University 58
6.2 Major agricultural extension activities by Punjab Agricultural University 60
7.1 Number of livestock, Punjab, 2003 - 2012 62 7.2 Production of important livestock products in Punjab 63 7.3 Fisheries statistics in Punjab 64
7.4 Average no. of livestock units, area and units served per veterinary institution and per veterinarian in Punjab 64
7.5 Livestock and artificial insemination development centers and frozen semen straw produced in Punjab 65
8.1 Number of rice mills in Punjab 67 8.2 District wise number of modern rice mills, Punjab, 2012-13 69 8.3 Cane crushed and sugar produced by sugar mills in Punjab 69 8.4 Cotton textile mills, spindles and looms in Punjab 70
8.5 Production of yarn, cloth in cotton textile mills and production of traditional khadi in Punjab 70
8.6 Numbers of milk plants and milk processing capacity in Punjab 71
PREFACE
The present report has been prepared by Agro Economic Research Centre, Ludhiana to
update the information on various performance related indicators of agricultural sector in Punjab,
encompassing state population, demography, structure, performance, natural resources
management, farm input management, area, production and yield of major crops, status of
agricultural research, education and extension, animal husbandry, dairying, fisheries, post
harvest management and value addition etc. The Uniqueness of this report is that it contains
recent updated trends based on time series data on various socio-economic parameters in the
state. This document would serves as a ready - reckener as well as an effective quantitative tool
for reaching to logical conclusions in the context of planning and public policy making.
We express our gratitude to the Directorate of Economics and Statistics, Ministry of
Agriculture, Government of India, New Delhi for their financial support for preparation of this
document.
Authors
1
Chapter 1
POPULATION DEMOGRAPHY AND ECONOMY 1.1 Introduction
Punjab is situated in the northwest of India. It is one of the smallest states of the country,
encompassing an area of 50,362 sq. km i.e. 1.5% of India’s geographical area but nourishing
about 2.5% of India's population. The state is edged by Pakistan on the west, Jammu and
Kashmir on the north, Himachal Pradesh on its northeast and Haryana and Rajasthan on the
south. The word Punjab derives from an Indo-Iranian word suggesting the land of five rivers
Ravi, Beas, Satluj, Jhelam and Chenab, but the fragmentation of 1947 left Indian Punjab with
only two of these rivers viz Beas and Sultej. The state was further fragmented in 1966 with the
formation of Haryana and Himachal Pradesh. There are 22 districts in the state, which are again
subdivided into three cultural zones; Majha, Malwa and Doaba and five agro-climatic zones;
sub-mountain undulating zone, undulating plain zone, central plain zone, western plain zone and
western zone.
Punjab holds place of pride among the Indian States for its outstanding achievements in
agricultural development. The state has witnessed tremendous increase in the agricultural
production during the Green Revolution period, mainly due to healthy mix of institutional and
technological factors. Agrarian economy, consolidation of landholdings, reclamation of new
agricultural lands, development of irrigation, use of biochemical inputs comprising high yielding
variety seeds, chemical fertilizers, insecticides and mechanical inputs were among the important
factors which helped Punjab agriculture in making rapid strides. Dominating rural based political
power with agricultural background provided favorable environment through thrust on rural and
agricultural development. In this context, extension of irrigation network, rural link roads, rural
electrification, establishment of focal points and agricultural market centers, efficient delivery
system of credit and other agricultural inputs along with effective implementation of agricultural
price policy for wheat and paddy played significant role in agriculture and rural development of
state. Consequently, the Punjab state comprising only 1.5 percent of the total geographical area
of country now contributes 13-14 percent towards the total food grain production of the country.
State has earned a name of granary of India and during 2015-16 contributed about 27.33 per cent
of rice and 46.22 per cent of wheat to the central pool.
2
Green Revolution sustained till the eighties, after which the agricultural production in the
state showed the signs of stagnation. In nineties, the exalting cost of cultivation of major crops
further aggravated the situation through squeezing the profitability of agriculture adversely
affecting the socio-economic condition of farmers in the state. Thus, the agriculture in state has
reached a plateau making it very hard to make further progress under available technologies and
natural resource base. Its relative contribution in central pool of food grains both for wheat and
paddy has also been declining during last few years, though, still being the largest contributor of
wheat and second largest of paddy after Andhra Pradesh to central pool of the country.
The emerging scene of Punjab agriculture is not free from some serious concerns. The
state cropping pattern dominated by wheat-rice rotation is causing a serious damage to the state’s
natural resource base. Paddy in particular, a water-intensive crop is blamed for water-table
depletion in tube-well irrigated areas and water-logging in canal irrigated areas. Increasing
incidence of nutrient deficiency in the soils, including micronutrients and insect-pest attacks on
the crops are also posing major threats to productivity, food grain production and sustainability
of agriculture in the long run. Diversification of cropping pattern towards environment friendly
high value crops with emphasis on quality output and promotion of agro-processing industry is
the need of hour.
The present study has been an attempt to update the information of the agricultural sector
in Punjab state. For this available recent secondary data have been taken from various sources
and interpreted.
1.2 Population
Total population of Punjab as per 2011 census is 27,743,338 of which male and female
are 14,639,465 and 13,103,873 respectively (Table 1.1). In 2001, total population was
24,358,999 in which males were 12,985,045 while females were 11,373,954. The total
population growth in this decade was 13.90 percent while in previous decade it was 20.10
percent. The population of Punjab forms 2.29 percent of India in 2011. In 2001, the figure was
2.37 percent. Literacy rate in Punjab has seen upward trend and is 75.80 percent as per 2011
population census. Of that, male literacy stands at 80.40 percent while female literacy is at 70.70
percent. In 2001, literacy rate in Punjab stood at 69.65 percent of which male and female were
75.23 percent and 63.36 percent literate, respectively. With total geographical area of Punjab at
50,362 sq. km the population density of Punjab during 2011 was 551 per sq km which is higher
3
than national average of 382 per sq km. In 2001, density of Punjab was 484 per sq km, while
national average at that time was 324 per sq km. Number of females in Punjab during 2011 was
895 for each 1000 male, which is below national average of 943. In 2001, the sex ratio of female
was 876 per 1000 males in Punjab. From 2001 to 2011, the share of rural population in the total
population of state declined from 66.08 percent to 62.52 percent where as that of urban
population increased from 33.92 percent to 37.48 percent (Table 1.2). During this time period the
rural literacy rate increased from 64.7 percent to 71.40 percent and that of urban literacy from
79.1 percent to 83.20 percent (Population census, 2011).
Table 1.1: Population statistics of Punjab state (Number)
Population 2001 2011
Total state population 24358999 27743338
Male population 12985045 (53.31)
14639465 (52.77)
Female population 11373954 (46.69)
13103873 (47.23)
Population density/sq. km 484 551
Decennial population growth (%) 20.10 13.90
Sex ratio (no. of female per 1000 male) 876 895
Percentage to the total population of India 2.37 2.29
Total literates 14756970 18707137
Male literates 8442293 10436056
Female literates 6314677 8271081
Literacy rate (%) 69.65 75.80
Male literacy rate (%) 75.23 80.40
Female literacy rate (%) 63.36 70.70
Child sex ratio (no. of female per 1000 male) 798 846
Total child population (0-6 age) 3171829 3076219
Male child population 1763801 1665994
Female child population 1408028 1410225 *Literacy has been calculated after excluding 0-6 age group Figures in the parenthesis are percentages to the total population Source: Statistical Abstract, Punjab
4
Table 1.2: Description of rural and urban population in Punjab (Number)
Population 2001 2011
Rural Urban Rural Urban
Percentage to total population of the state 66.08 33.92 62.52 37.48
Rural/urban population 16096488 8262511 17344192 10399146
Male population 8516596 4468449 9093476 5545989
Female population 7579592 3794062 8250716 4853157
Sex ratio (no. of female per 1000 male) 890 849 907 875
Total literates 9008631 5748239 10997657 7709480
Literacy rate of the state (%) 64.7 79.1 71.4 83.2
Male literacy rate (%) 71.0 83.0 76.6 86.7
Female literacy rate (%) 57.5 75.5 65.7 79.2
Child population (0-6 age) 2176726 995103 1945502 1130717
Percentage child population 13.52 12.04 11.22 10.87
Child sex ratio(no. of female per 1000 male) 799 796 843 851 Source: Statistical Abstract, Punjab
1.3 Work force structure
With the advent of Green Revolution, Punjab has emerged as the most advanced state in
agricultural development. Overtime, though agricultural sector experienced a decline in the
importance in terms of its share in GSDP and work force, yet it remains the single most
important sector of the state economy. As per 2011 census data, total workforce of state was
9897362, out of which 3522966 were dependent on agriculture and allied activities (Table 1.3).
Cultivators and agricultural labours directly dependent on agriculture accounted for about 36
percent of the total workforce of state. Out of the total agricultural work force, cultivators and
agricultural labours accounted for 54.92 and 45.08 percent, respectively. Agriculture being the
backbone of state economy, other major activities like agro-processing, transportation, trade,
storage, etc. are directly or indirectly dependent on it. Thus, performance of agriculture sector
determines the scope and rate of development and employment in other sectors as well as overall
state economy.
5
Table 1.3: Distribution of work force in Punjab (Number)
Particulars 1961 1971 1981 1991 2001 2011
Total cultivators 1602666 1665153 1767286 1917210 2065067 1935000
Total agri. Labour 334610 786705 1092225 1452828 1489861 1588000
Total agri. work force* 1937276 2451858 2859511 3370038 3554928 3522966
Total work force 3466269 3912592 4927759 6098374 9127474 9897362
Share of workers engaged in agri. in total work force
55.89 62.67 58.02 55.26 38.95 35.59
Share of agri. labour in total agri. work force
17.27 32.09 38.20 43.11 41.61 45.08
Share of cultivators in total agri. work force
82.73 67.91 61.80 56.89 58.09 54.93
Share of agri. labour in total work force
9.65 20.11 22.16 23.82 16.32 16.04
Share of cultivators in total work force
46.24 42.56 35.86 31.44 22.96 19.55
*includes main and marginal workers Source: Statistical Abstract, Punjab
1.4 Overview of the state economy
Economic activities in state are showing structural changes over a period of time and
primary sector is experiencing a decline in terms of share in Gross State Value Added (GSVA).
Sectoral distribution of GSVA of Punjab state at constant prices (2011-12) and current prices
along with percent distribution is presented through Tables 1.4 to 1.7. Table 1.4 revealed that
GSVA of Punjab at constant prices (2011-12) has increased from Rs 25377429 lakhs in 2011-12
to Rs 2931671 lakhs in 2014-15. Overall economy of Punjab state has witnessed a growth rate of
4.58, 5.17 and 4.02 percent during 2012-13, 2013-14 and 2014-15, respectively. At constant
prices (2011-12), the contribution of primary sector consisting of agricultural and allied activities
towards GSVA has increased from Rs 7820507 lakhs in 2011-12 to Rs 7903285 lakhs in 2014-
15. This sector had shown growth of 0.87 and 3.71 percent during 2012-13 and 2013-14
respectively. However, during 2014-15, the primary sector had shown a negative growth of 3.40
per cent.
6
Table 1.4: Gross State Value Added by sectors in Punjab at constant prices (base 2011-12) (Rs. Lakh)
Source: Statistical Abstract, Punjab; Figures in parenthesis are percent change over the previous year
Manufacturing 3750728 3892533 4072839 4261467 Electricity, Gas & water supply and other utility services 71403 752950 781504 829800
Construction 1978423 1942098 1974967 1983526
Sub-total : Secondary 6444054 6587582 (2.23)
6829311 (3.67)
7074793 (3.59)
Trade, Hotel & restaurants 2532467 2758214 3007122 3336614 Trade and repair services 2532467 2590152 2831263 3152331 Hotel & restaurants 2371685 168062 175859 184282 Transport, storage & communication related to broadcasting 160781 1463689 1544319 1656384
Road transport 625062 668665 727773 790467 Air Transport 2464 4344 3520 3823 Services incidental to transport 32147 34791 37075 41137 Storage 48043 86001 59263 63983 Communication & services related to broadcasting 423205 441087 500384 540470
Financial services 1464304 1552557 1642959 1750302 Real estate, ownership of dwelling & business services 2274674 2448099 2586753 2784397
Public administration 1269455 1396131 1448010 1555265 Other services 2250644 2445027 2671396 2970631
Sub-total : Tertiary 11112868 12063717 (8.56)
12900559 (6.94)
14053593 (8.94)
1.Gross State Value Added 25377429 26540117 (4.58)
27910993 (5.17)
29031671 (4.02)
2.Product Taxes 2192500 2488956 2737963 3022224
3.Product Subsidies 907100 946787 790825 726302
Gross State Domestic Product (At market prices) (1+2+3) 26662829 28082285
(5.33) 29858131
(6.28) 31327592
(4.92)
7
Table 1.5: Percentage distribution of Gross State Value Added by sectors in Punjab at constant prices (base 2011-12)
Source: Statistical Abstract, Punjab,
Secondary sector mainly consisting of manufacturing, construction and power sectors has
increased at rate of 2.23, 3.67 and 3.59 percent at constant prices during 2012-13, 2013-14 and
2014-15, respectively. In absolute terms, contribution of this sector in GSVA increased from Rs
6444054 lakhs in 2011-12 to Rs 7074793 lakhs in 2014-15. The contribution of tertiary sector of
state comprising trade, transport, banking, insurance and public administration towards GSVA
Electricity, Gas & water supply and other utility sevices 2.82 2.84 2.80 2.86
Construction 7.80 7.32 7.08 6.84 Sub-total : Secondary 25.40 24.83 24.47 24.38 Trade, Hotel & restaurants 9.98 10.39 10.77 11.49 Trade and repair services 9.35 9.76 10.14 10.86
Hotel & restaurants 0.63 0.63 0.63 0.63
Transport, storage & communication related to broadcasting
5.21 5.51 5.53 5.70
Road transport 2.46 2.52 2.61 2.72 Air Transport 0.01 0.02 0.01 0.01 Services incidental to transport 0.13 0.13 0.14 0.14 Storage 0.19 0.32 0.21 0.22 Communication & services related to broadcasting 1.67 1.66 1.79 1.86
Financial services 5.77 5.85 5.89 6.03 Real estate, ownership of dwelling & business services 8.96 9.22 9.27 9.59
Public administration 5.00 5.26 5.19 5.36 Other services 8.87 9.22 9.57 10.3 Sub-total : Tertiary 43.79 45.45 46.22 48.40 Gross State Value Added 100.00 100.00 100.00 100.00
8
had increased from Rs 11112868 lakhs in 2011-12 to Rs 1405359 lakhs in 2014-15. Per annum
increase in this sector was recorded at 8.56, 6.94 and 8.94 percent during 2012-13, 2013-14 and
2014-15 respectively.
Table 1.6: Gross State Value Added by sectors in Punjab at current prices (Rs. Lakh)
Source: Statistical Abstract, Punjab; Figures in parenthesis are percent change over the previous year
Manufacturing 3750728 4067078 4419233 4790341 Electricity, Gas & water supply and other utility sevices
714903 816016 856238 911611
Construction 1978423 2054740 2129015 2202962
Sub-total : Secondary 6444054 6937833 (7.66)
7404486 (6.73)
7904914 (6.76)
Trade, Hotel & restaurants 2532467 2999141 3752484 4419919 Trade and repair services 2317685 2815726 3555016 4201252 Hotel & restaurants 160781 177415 197468 218667 Transport, storage & communication related to broadcasting
1321324 1540246 1736148 1951809
Road transport 625002 708851 823630 928575 Air Transport 2464 4658 3967 4473 Services incidental to transport 32147 36862 42676 48124 Storage 48043 91143 64027 76429 Communication & services related to broadcasting
42305 469800 586969 660819
Financial services 1464304 1655979 1836932 2057520 Real estate, ownership of dwelling & business services
2274674 2574058 2849529 3142786
Public administration 1269455 1486914 1629661 1842730 Other services 2250644 2520089 2909626 3303041 Sub-total : Tertiary 11112868 12770426
(14.92) 14714380
(15.22) 16717805
(13.62) 1.Gross State Value Added 25377429 28083782
Gross State Domestic Product (At market prices) (1+2+3)
26662829 29773382 (11.67)
33471429 (12.42)
36801089 (9.95)
9
The share of crops in GSVA at constant prices (2011-12), which was 19.73 percent
during 2011-12 declined to 16.76 percent during 2014-15. During the same period, the share of
overall primary sector including livestock, forestry, fishing and mining activities along with
crops declined from 30.81 percent to 27.22 percent (Table 1.5). On the other hand, over this
period while the share of secondary sector in GSVA declined marginally from 25.40 per cent to
24.38 percent; that of tertiary sector increased from 43.79 percent to 48.40 percent. Thus, in
Punjab state the tertiary sector is playing the leading role in contribution towards GSDP followed
by secondary and primary sector.
Table 1.7: Percentage distribution of Gross State Value Added by sectors in Punjab at current prices
Source: Statistical Abstract, Punjab,
Sector 2011-12(P) 2012-13(P) 2013-14(P) 2014-15(P) Agriculture, forestry and fishing 30.80 29.81 28.99 27.38 Crops 19.73 18.92 18.40 16.78 Livestock 8.02 7.91 7.85 7.78 Forestry and logging 2.82 2.74 2.44 2.50 Fishing 0.23 0.24 0.30 0.32 Mining and quarrying 0.01 0.01 0.03 0.03 Sub-total : Primary 30.81 29.82 29.02 27.41 Manufacturing 14.78 14.48 14.18 14.12 Electricity, Gas & water supply and other utility services 2.82 2.91 2.75 2.69
Construction 7.80 7.32 6.83 6.49 Sub-total : Secondary 25.40 24.71 23.76 23.30 Trade, Hotel & restaurants 9.98 10.66 12.04 13.03 Trade and repair services 9.35 10.03 11.41 12.39 Hotel & restaurants 0.63 0.63 0.63 0.64 Transport, storage & communication related to broadcasting 5.21 5.48 5.57 5.76
Road transport 2.46 2.52 2.64 2.74 Air Transport 0.01 0.02 0.01 0.01 Services incidental to transport 0.13 0.13 0.14 .014 Storage 0.19 0.32 0.21 0.23 Communication & services related to broadcasting 1.67 1.62 1.88 1.95
Financial services 5.77 5.90 5.90 6.07 Real estate, ownership of dwelling & business services 8.96 9.17 9.15 9.27
Public administration 5.00 5.29 5.23 5.43 Other services 8.87 8.97 9.33 9.73 Sub-total : Tertiary 43.79 45.47 47.22 49.28 Gross State Value Added 100.00 100.00 100.00 100.00
10
The Per capita income is an indicator of standard of living of the population. At current
prices the per capita income in Punjab state increased from Rs. 49380 in 2007-08 to Rs. 92350 in
2013-14 (Table 1.8, figure II). Though in absolute terms the state per capita figures sound to be
higher than that of national level (Rs. 74380 at current prices in 2013-14); performance of state
among different states of country had slipped down from its first rank in early 2000s to 10th rank
in recent times.
At constant prices (base 2004-05) the per capita income of state had shown an increase of
about 25 per cent viz. from Rs. 39567 in 2007-08 to Rs. 49529 in 2013-14.
At current prices At constant prices (Base 2004-05)
11
Chapter 2
STRUCTURE AND PERFORMANCE OF PUNJAB AGRICULTURE In the wake of new technology, Punjab agriculture made a rapid progress since mid
sixties. This progress has been made possible by speedy adoption of improved seeds, irrigation
and increased use of non-conventional inputs like fertilizers, machinery and pesticides supported
by the natural resource base of the state. The progress was spectacular in early phase due to
rising agricultural productivity and expansion in gross cropped area. However, of late the
progress in agricultural production has slowed down and signs of stagnation are visible. The
changes in agrarian structure and agricultural growth performance of state are presented in this
chapter.
2.1 Agrarian structure
Distribution of operational holdings, cropping patterns and proportionate share of each
sub-sector in primary sector’s contribution towards Gross State Domestic Product (GSDP)
determines the agrarian structure. The agrarian structure of Punjab state revealed by above said
factors is discussed in this section as follows:
2.1.1 Operational holdings
The information on distribution of operational holdings in state of Punjab at two points of
time viz. 2005-06 and 2010-11 is depicted in Table 2.1. The figure shows that the total
operational holdings in state during the last six years period increased by 50 thousands from
10.03 lakh to 10.53 lakh. Point worth noting is the marginalization of holdings with
proportionate increase in marginal and small farmers. The proportion of marginal and small
holdings which was 13.36 percent and 18.25 percent in 2005-06 increased to 15.57 percent and
18.82 percent in 2010-11, respectively. On the other hand, the proportion of holdings in all other
categories viz. semi-medium, medium and large had been declined during this period. Over this
period the average holding size in state also went down from 3.95 hectares to 3.77 hectares.
12
Table 2.1: Distribution of operational holdings in Punjab
Size category
2005-06 2010-11
Number (000)
Area (000,ha)
Average size of
holding
Number (000)
Area (000,ha)
Average size of
holding Marginal (Below 1 ha)
134 (13.36)
83 (2.09) 0.62 164
(15.57) 101
(2.55) 0.61
Small (1-2 ha) 183 (18.25)
258 (6.51) 1.41 195
(18.82) 269
(6.78) 1.38
Semi-medium (2-4 ha)
319 (31.80)
855 (21.57) 2.68 325
(30.86) 855
(21.55) 2.64
Medium (4-10 ha)
296 (29.51)
1701 (42.91) 5.75 299
(28.40) 1713
(43.18) 5.75
Large (10 ha and above)
71 (7.08)
1067 (26.92) 15.03 70
(6.65) 1029
(25.94) 14.75
All holdings 1003 (100.00)
3964 (100.00) 3.95 1053
(100.00) 3967
(100.00) 3.77 Note: P-Provisional Figures in parentheses indicate percentage of total holdings Source: Agriculture at a Glance, Directorate of Agriculture, Punjab
2.1.2 Cropping pattern
Cropping pattern refers to the proportionate area under different crops during a crop year.
Kharif and rabi are two main cropping seasons in the state. In the post green revolution era, the
state of Punjab has witnessed a considerable change in its cropping pattern. Traditionally, Punjab
has been predominantly a wheat growing area. Rice stormed in the cropping pattern since mid
1970’s as a commercial crop and made a major impact on the Punjab agriculture. The area under
wheat has increased two and a half times since 70’s. During, 1970-71, about 40.49 percent of
the gross cropped area (GCA) was under wheat which increased to 44.31 percent in 2007-08 and
to 44.72 percent in 2013-14 (Table 2.2, figure III and IV). The increase in wheat cultivation has
been at the cost of gram, rapeseed and mustard. The area under paddy has increased ten folds
during last five decades by replacing crops like cotton, kharif pulses, maize, jowar, Bajra and
kharif oilseeds. The area under rice which occupied only 6.87 percent of gross cropped area
during 1970-71 jumped up to 33.15 percent in 2007-08, and then rose further to around 36.30
percent in 2013-14. The state has extreme specialization of paddy-wheat cropping system which
may be attributed to effective implementation of agricultural price policy with minimum support
price (MSP) and relative profitability of these crops as compared to other crops. As a result at
13
present about 81 percent of the gross cropped area of the state has been encroached by paddy and
wheat. Cotton is ranked third in the cropping pattern of the state. The area under this crop in
1970-71 was about 7 percent of gross cropped area, increased to 9.34 percent in 1990-91. After
mid -1990s the area under cotton had adversely affected due to inclement weather and pest attack
and its share in GCA went down to 5.97 percent in 2000-01. With the introduction of Bt varieties
area under cotton again rose to 7.69 percent in 2007-08. During 2013-14 it accounted for 6.13
percent of the GCA in state. The proportionate area under maize kept on declining since 1970-71
from 9.77 percent to 1.66 percent in 2013-14. Area under sugarcane and potato has not remained
stable over time and accounted for 1.04 per cent and 1.01 per cent of GCA during 2013-14
respectively. Respective share of pulses and oilseeds in GCA has recorded a sharp decline from
7.29 and 5.20 percent in 1970-71 to 0.25 and 0.60 percent in 2013-14. It can be concluded that
imbalance in favour of two main cereals viz. rice and wheat in the cropping pattern has further
sharpened despite all efforts of diversification in the state agriculture.
14
Table 2.2: Shift in cropping pattern in Punjab (1970-71 to 2012-13) (Percent to Gross cropped area)
2.1.3 Relative share of different agricultural activities in primary sector
Sub-sectoral distribution of GSVA from primary sector of state at constant prices (2011-
12) and current prices along with percent contribution of each component from year 2011-12
onwards is presented through Tables 2.3 and 2.4. Table 2.3 revealed that during 2011-12, at
constant prices, out of total share of primary sector in GSVA at Rs 7820507 lakhs, crops,
livestock, forestry & lodging and fishing accounted for about Rs 5007937, Rs 2034580, Rs
715707 and Rs 58601 lakhs, respectively. During 2014-15, out of total primary sector’s
contribution to GSVA at Rs 7903285 lakhs, the respective contribution of above sub-sectors was
at Rs 4865022, Rs 2286318, Rs 674784 and Rs 68903 lakhs.
Table 2.3: Share of different primary sub-sectors in total primary sector at constant (2011-12), Punjab (Rs. Lakh)
Note: P-Provisional, Q-Quick estimates Figures in parentheses indicates percent share in total primary sector Source: Statistical Abstract, Punjab
The collective percent share of agriculture, forestry and fishing sub-sector in GSVA from
primary sector at constant prices (2011-12), which was 99.95 percent during 2011-12, remained
almost at same level (99.90 %) during 2014-15. While, during this period the contribution of
crops in primary sector declined from 64.04 to 61.56 percent, the contribution of livestock
increased from 26.02 to 28.93 percent. Over this period, the respective share of forestry sub-
sector in overall primary sector of state declined marginally from 9.15 to 8.54 percent. On the
other hand, during this time period the share of fishing had increased marginally from 0.75
Sector 2011-12(P) 2012-13(P) 2013-14(P) 2014-15(P) Agriculture, forestry and fishing 7816825
(99.95) 7886831 (99.97)
8173474 (99.91)
7895027 (99.90)
Crops 5007937 (64.04)
5014188 (63.56)
5199614 (63.56)
4865022 (61.56)
Livestock 2034580 (26.02)
2109779 (26.74)
2221316 (27.15)
2286318 (28.93)
Forestry and logging 715707 (9.15)
703349 (8.92)
690100 (8.44)
674784 (8.54)
Fishing 58601 (0.75)
59514 (0.75)
62444 (0.76)
68903 (0.87)
Mining and quarrying 3682 (0.05)
1988 (0.03)
7651 (0.09)
8259 (0.10)
Primary 7820507 (100.00)
7888818 (100.00)
8181124 (100.00)
7903285 (100.00)
17
percent to 0.87 per cent. Thus, within agriculture sector there were only marginal changes in
respective share of different components over this time period.
Table 2.4: Share of different primary sub-sectors in total primary sector at current prices, Punjab
(Rs. Lakh))
Note: P-Provisional, Q-Quick estimates Figures in parentheses indicates percent share in total primary sector Source: Statistical Abstract, Punjab
2.2 Growth performance of Punjab agriculture
The progress made by agriculture in Punjab state is unparalleled in the history of the
world agriculture. The state which was deficit in food at the time of independence has made
rapid strides in agricultural development and contribution to the central pool towards
strengthening India’s self sufficiency. Dominating agrarian structure, consolidation of holdings,
development of irrigation infrastructure and hard working peasantry led to the early progress.
With adoption of new agricultural technology in mid sixties backed with adequate agricultural
policies, the state turned surplus in food grains and became a model of India’s successful green
revolution strategy. Selected agricultural growth indicators of the state are presented in Table 2.5
and 2.6. Overtime, the production of wheat in the state significantly grew at the CAGR of 2.83
percent per annum from 5.62 million tones in 1971-72 to 15.09 million tones in 2014-15.
Sector 2011-12(P) 2012-13(P) 2013-14(P) 2014-15(P) Agriculture, forestry and fishing 7816825
(99.95) 8373465 (99.98)
9030656 (99.90)
9285716 (99.89)
Crops 5007937 (64.04)
5314252 (63.45)
5734357 (63.44)
5690972 (61.22)
Livestock 2034580 (26.02)
2222010 (26.53)
2445208 (27.05)
2638842 (28.39)
Forestry and logging 715707 (9.15)
769611 (9.19)
758874 (8.40)
848245 (9.12)
Fishing 58601 (0.75)
67592 (0.81)
92217 (1.02)
107657 (1.16)
Mining and quarrying 3682 (0.05)
2057 (0.02)
8707 (0.10)
10354 (0.11)
Primary 7820507 (100.00)
8375522 (100.00)
9039363 (100.00)
9296070 (100.00)
18
Table 2.5: Area, production and yield of different crops and milk production, 1971-72 to 2013-14, Punjab
A: Area in 000’ha, P: production in 000 metric tones and Y: Yield in kg/ha Note: Production of sugarcane is in terms of gur
Cotton production is cleaned cotton and is in terms of thousand bales of 170 kgs each, Yield (lint kg/ha) Oilseeds does not include figure relating to non-edible oil seed e.g. Castor seeds
Gross cropped area (000’ha) 5678 6763 7502 7941 7912 7876 7882 7902 7870 7848 - % of net irrigated area to net area sown 71 81 93 95 97.4 97.9 97.9 98.8 99.2 99.9
Note: NA – Not available. Source: Statistical Abstract, Punjab
The Punjab Mandi Board provided all weather metalled roads to all the villages so that
the farmers could sell their output throughout the year. It is very encouraging that hundred
percent villages of Punjab are linked with the all weather metalled roads which helped in
efficient marketing of farm output in the state.
24
With large scale state procurement of food grains which takes time to be dispatched to
the deficit states; state owned storage capacity remained a major issue. In the recent years many
steps have been taken in this regard and the total state owned storage capacity increased from
176.39 lakh tons in 2007-08 to 220.95 lakh tones in 2014-15 (Table 2.9). During 2014-15, Food
Corporation of India (FCI) owned the maximum storage capacity to the tune of 50.60 percent
followed by Punjab State Civil Supply Corporation (13.94%), Food Supply Department
(13.27%) and Punjab Agro Industries Corporation (9.16%).
Table 2.9: Agency-wise state owned storage capacity in Punjab (Lakh tones)
Figures in parentheses are percentages to total, Storage capacity includes hired and open storage capacity. Information relates to 31st March. Source: Statistical Abstract, Punjab
2.5 Emerging demand-supply mechanics
To meet the increasing demand of food grains, the country is heavily dependent on the
availability of adequate local supplies particularly from the Punjab state. To maintain the tempo
of food grains production, the production incentive oriented procurement prices to the farmers
are provided by the government. As a result of the assured market at remunerative prices coupled
with market infrastructure and available production technology, the Punjab farmer countered
country’s demand for foodgrains through pushing up the wheat and paddy production
Table 2.11: Contribution of Punjab towards the central pool of food grains (Lakh tones)
Year Rice Wheat 2007-08 79.8 (27.80) 67.8 (60.90) 2008-09 85.5 (25.10) 99.4 (43.80) 2009-10 92.8 (28.90) 107.3 (42.20) 2010-11 86.3 (25.30) 102.1 (45.40) 2011-12 77.3 (22.10) 109.6 (38.70) 2012-13 85.6(25.10) 128.3(33.60) 2013-14 81.06(25.46) 108.97(43.40) 2014-15(P) 77.86(24.20) 116.41(41.54) Information of wheat pertains to marketing year whereas that of rice pertains to crop year Figures in parentheses are percentage contribution in central pool, P-Provisional Source: Statistical Abstract, Punjab
Observing the agency-wise procurement, it can be seen from Table 2.12 that since 2007-
08 the role of government agencies in procurement has been increased in a major way which
pushed the private traders nearly out of paddy and wheat trade in the state. During 2013-14, the
government agencies procured 98.13 percent of the total market arrivals of wheat in the state.
26
Similarly, a giant share (97.57%) of market arrivals of paddy during 2013-14 has been procured
by the government agencies. As the government is the major player in rice and wheat trade in the
state, private traders are reluctant to enter the market for the same. For cotton, the third most
important crop of state, demand mainly comes from private mills and traders. However in some
years significant quantities were also purchased by state owned Cotton Corporation of India
(Table 2.13).
Table 2.12: Procurement of paddy and wheat by different agencies in Punjab, (000, tones) Agency 2007-08 2008-09 2009-10 2010-11 2011-12 2012-13 2013-14(P) Paddy
State government 2674 (20.89)
3627 (27.41)
4155 (29.18)
4073 (31.01)
3375 (28.30)
3796 (28.34)
3696 (31.21)
FCI 132 (1.03)
205 (1.55)
671 (4.71)
517 (3.94)
182 (1.53)
579 (4.32)
288 (2.43)
Markfed 2426 (18.95)
2775 (20.97)
2864 (20.12)
2707 (20.61)
2597 (21.78)
2906 (21.69)
2689 (22.71)
PUNSUP 2611 (20.40)
2714 (20.51)
3171 (22.27)
3021 (23.00)
2837 (23.79)
2909 (21.72)
2607 (22.02)
PSWC 1356 (10.59)
1502 (11.350
1687 (1.85)
1488 (11.33)
1303 (10.93)
1268 (9.47)
1122 (9.48)
Traders 2470 (19.29)
1133 (8.56)
371 (2.61)
209 (1.59)
483 (4.05)
623 (4.65)
222 (1.87)
Punjab Agro Industries Corporation (PAIC)
1133 (8.85)
127 (89.66)
1318 (9.26)
1121 (8.53)
1149 (9.63)
1314 (9.81)
1217 (10.28)
Total 12802 (100.00)
13234 (100.00)
14237 (100.00)
13136 (100.00)
11926 (100.00)
13395 (100.00)
11841 (100.00)
Wheat
State government 1279 (16.17)
1847 (17.45)
1682 (15.30)
1707 (16.61)
1760 (15.86)
2213 (17.24)
2292 (19.21)
FCI 726 (9.18)
1074 (10.15)
1716 (15.61)
1654 (16.09)
1664 (15.00)
1933 (15.06)
1838 (15.40)
Markfed 1886 (23.84)
2481 (23.44)
2557 (23.26)
2382 (23.18)
2623 (23.64)
2841 (22.14)
2556 (21.42)
PUNSUP 1781 (22.51)
2369 (22.38)
2392 (21.76)
2301 (22.39)
2492 (22.46)
2921 (22.76)
2450 (20.53)
PSWC 771 (9.75)
1279 (12.08)
1403 (12.76)
1122 (10.92)
1284 (11.57)
1465 (11.41)
1334 (11.18)
Traders 704 (8.90)
334 (3.16)
22 (0.20)
61 (0.59)
37 (0.33)
- 290 (2.43)
Punjab Agro Industries Corporation (PAIC)
764 (9.66)
1200 (11.34)
1222 (11.12)
1051 (10.23)
1234 (11.12)
1461 (11.38)
1172 (9.82)
Total 7911 (100.00)
10584 (100.00)
10994 (100.00)
10278 (100.00)
11094 (100.00)
12834 (100.00)
11932 (100.00)
Note:P-Provisional Figures in parentheses are percentage to the total, Source: Statistical Abstract, Punjab
27
Table 2.13: Purchase of cotton by Cotton Corporation of India (CCI) in Punjab (000’ bales of 170 kg each) Year At MSP Commercial Total
2007-08 0 78.98 (100.00) 78.98
2008-09 1043.81 (99.85)
1.60 (0.15) 1045.42
2009-10 86.60 (89.90)
9.73 (10.10) 96.33
2010-11 0 100.78 (100.00) 100.78
2011-12 0 11.76
(100.00) 11.76
2012-13 0 18.44
(100.00) 18.44
2013-14 0 70.27 (100.00) 70.27
2014-15 (as on 28/5/2016)
127.72 (100.00) 0 127.72
Figures in parenthesis are percentage to total Source: Agricultural Statistics at a Glance
Under contract farming scheme, some companies have entered to the Punjab market to
buy the farm output. For this, these companies make the contract with farmers to purchase the
specific quantity of specific quality produce at some pre decided price. Basmati, maize, hyola
and malting barley were the main crops grown under this scheme (Table 2.14). However, area
under contract farming in state went down drastically over time from 95312 hectares in 2007-08
to only 2354 hectares during 2014-15. It was only malting barley which had been grown under
contract farming scheme during 2014-15. Thus, there is need to explore and address the poor
performance of contract farming initiative in state.
Table 2.14: Area under different crops under contract farming scheme in Punjab (Hectares)
In state the ceiling on land is as per the Punjab Land Reforms Act, 1972. Subject to the
provisions of section 5 of this act, no person shall own or hold as landowner or mortgagee with
the possession or tenant or partly in one capacity and partly in another in excess of the
permissible area. Limits of the permissible area are described in Table 3.4.
Table 3.4: Permissible land ceiling limit under Punjab land reforms act, 1972 S No Particulars Permissible
area (ha) 1 Land under assured irrigation and capable of yielding at least two crops in a
year (in this Act referred to as the first quality land) 7
2 Land under assured irrigation for only one crop in a year 11 3 Barani land 20.5 4 Land of other classes including banjar land, and area is to be determined
accordingly to the prescribed scale with reference to the intensity of irrigation, productivity and soil classification of such classes having regard to the respective valuation and the permissible area of the classes of land mentioned at (1), (2) and (3) Provided that:
a) Where land consists of two or more classes, the permissible area shall be determined on the basis of relative valuation of sub class of land, subject to the condition that it does not exceed 21.8 hectares
b) Where the number of member of a family exceeds five, the permissible area shall be increased by one-fifth of the permissible area for each member in excess of five, subject to the condition that additional land shall be allowed for not more than three such members.
< 21.8
Source: Agricultural Statistics at a Glance 3.5 Water management
In Punjab about 99 percent of the net sown area is irrigated. The state has excellent
surface and groundwater irrigation infrastructure. Surface irrigation distribution network
33
comprises of 1, 45,000 kilometers of canals including branch canals and minor distributaries, and
one lakh kilometers of field channels or water courses. The canal irrigation system irrigated 1160
thousand hectare in 2013-14 accounting for 27.99 per cent of the net irrigated area in state (Table
3.5). While canal irrigation has been almost stable over the years with some variations, tube well
irrigation, particularly in the central and northern region of Punjab has been on the increase and
during 2013-14, there were about 14.05 lakh tube wells providing irrigation to about 2981
thousand hectares of land accounting for 71.92 per cent of the net irrigated area in state.
Table 3.5: Source-wise net area irrigated in Punjab (000, ha)
Year Govt.
canals
Private
canals
Tube well
& wells
Other
sources Total
% of net irrigated area
to net area sown
2007-08 1142 - 2922 4 4068 97.2
2008-09 1110 3 2950 1 4064 97.4
2009-10 1111 3 2955 2 4071 97.9
2010-11 1113 3 2954 - 4070 97.9
2011-12 1113 3 2970 4 4086 98.8
2012-13 1133 - 2982 - 4115 99.2
2013-14(P) 1160 - 2981 - 4141 99.9 Source: Statistical Abstract, Punjab, Data for 2012-13 has been collected from Agriculture at a Glance, Directorate of Agriculture, Punjab
According to estimates the total annual demand for irrigation water in the state is 4.76
million hectare meters (mhm) against a total annual supply of 3.48 mhm from both canal and
ground-water resources. This excessive demand leaves an annual net deficit of 1.28 mhm (Jain,
A K) which is met from over-exploitation of groundwater reserves through tube wells. In many
areas, excessive exploitation has pushed the groundwater table below the critical depth of 10
meters. Deep tube wells are being used even in the southern region, where the underground
water is brackish. Existing cropping pattern, cheap credit and free supply of electricity are the
main factors behind steep increase in the use of tube wells for irrigation in the state. The data on
pre-monsoon and post-monsoon water table in state for recent years is presented in Table 3.6.
Extensive use of groundwater through tube wells have led to lowering of the ground-
water table in most parts of the state. The water table in the central districts of Punjab has been
going down whereas in south western parts it is going up resulting into the problem of water
34
logging. Most of the centrifugal pumps have been replaced by the submersible pumps leading to
additional expenditure along with tremendous increase in energy consumption.
Table 3.6: Pre and post monsoon ground water level in Punjab Period Season Level Meters
June 2007 Pre monsoon Minimum 5.22 Max 25.06
October 2007 Post monsoon Minimum 5.13 Max 25.24
June 2008 Pre monsoon Minimum 5.92 Max 23.53
October 2008 Post monsoon Minimum 6.93 Max 22.92
June 2009 Pre monsoon Minimum 5.52 Max 22.59
October 2009 Post monsoon Minimum 5.41 Max 22.28
June 2010 Pre monsoon Minimum 6.23 Max 23.57
October 2010 Post monsoon Minimum 5.53 Max 23.01
June 2011 Pre monsoon
Minimum 6.07 Max 23.03
October 2011 Post monsoon Minimum 5.53 Max 23.17
June 2012 Pre monsoon Minimum 6.57 Max 23.61
October 2012 Post monsoon Minimum 6.39 Max 24.07`
June 2013 Pre monsoon Minimum 7.06 Max 23.04
October 2013 Post monsoon Minimum 6.45 Max 23.02
June 2014 Pre monsoon Minimum 6.74 Max 23.37
October 2014 Post monsoon Minimum 6.69 Max 23.71
June 2015 Pre monsoon Minimum 138.3 Max 469.3 October 2015 Post monsoon Minimum 144.42 Max 475.45
Source: Statistical Abstract, Punjab
35
The distribution of blocks in different categories on the basis of underground water
resources in past decade is given in Table 3.7. During 2010, out of 138 blocks of state 110 blocks
were over exploited where exploitation was more than 100 percent of annual net recharge of
water, 2 blocks were in critical category (exploitation above 85 percent) and 3 blocks felled in
semi critical-category (exploitation of 65-85 percent). Thus there were only 23 blocks which
were considered safe. In other words ground water in 80 percent of the total geographical area of
state has been over exploited, with another 4 percent in critical or semi-critical category. Part of
about 16 percent geographical area which is considered to be safe for ground water development
falls in kandi area where as rest of it falls in south-western parts of state where ground water is
brackish and unfit for irrigation use.
Table 3.7: Distribution of blocks in different categories on basis of underground water resources in Punjab
Category 2000 2005 2010
Over-exploited (Dark) 73 (52.90)
103 (75.18)
110 (79.71)
Critical 11 (7.97)
5 (3.65)
3 (2.17)
Semi critical 16 (11.59)
4 (2.92)
2 (1.45)
Safe 38 (27.54)
25 (18.25)
23 (16.67)
Source: Jain A K, Department of Soil & Water Engineering, PAU, Ludhiana
Various steps have taken to work out methods for optimum water-use efficiency for
different crops in different regions. Implementation of Punjab preservation of sub-soil water act,
2009 is a major breakthrough in managing dwindling ground water resources of the state.
36
THE PUNJAB PRESERVATION OF SUBSOIL WATER ACT, 2009
(Punjab Act No. 6 of 2009)AN ACT to provide for prohibition of sowing nursery of paddy and transplanting paddy before the notified dates, and for the matters connected therewith or incidental thereto BE it enacted by the Legislature of the State of Punjab in the Sixtieth Year of the Republic of India as follows:- 1.(1) This Act may be called Punjab Preservation of Subsoil Water Act, 2009 (2) It shall come into force at once. 2. In this Act, unless the context otherwise requires,- (a) “authorised officer” means an officer, authorised by State Government by notification in the Official Gazette; (b) “Collector” shall have the meaning, as has been assigned to it in the Punjab Land Revenue Act, 1887, and includes any other officer, as may be appointed under this Act by the State Government by notification in the Official Gazette to exercise the powers of Collector; (c) “farmer” means any person, cultivating land either as an owner or as tenant or as a share cropper for the purpose of agriculture, horticulture, agro forestry and the like; (d) “notified date” means the date as notified under sub-sections (1) and (2) of section 3; and (e) “State Government” means the Government of the State of Punjab. 3. (1) No farmer shall sow nursery of paddy before 10th Day of May of the agricultural year or such other date as may be notified by the State Government by notification in the Official Gazette for any local area. Explanation – For the purpose of this section, „agricultural year‟ means the year commencing on the 16th day of June or on such other date, as may be appointed by the State Government by notification in the Official Gazette for any local area. (2) No farmer shall transplant paddy before such date, as may be notified in this regard by the State Government by notification in the Official Gazette. (3) Notwithstanding anything contained in sub-sections (1) and (2), the provisions of this section, shall not be applicable to- (a) any research project of the Punjab Agricultural University, Ludhiana; (b) any other Research Institute, as may be declared by the State Government by notification in the Official Gazette; (c) any water logged area, as may be declared by the State Government by notification in the Official Gazette; Explanation – For the purpose of this clause, the term „water logged area‟ means an area, having depth to water table less than one metre below the ground level; and (d) any other method of paddy crop, as may be declared by the State Government by notification in the Official Gazette. 4. The authorised officer or his subordinate, servant or workman shall have the power to enter into the estate of any farmer for the purpose of surveying the area to assess the violation of the provisions of this Act. Explanation- The term „estate‟ shall have the same meaning as has been assigned to it under the Punjab Land Revenue Act, 1887. 5. The authorised officer, either suo motto or on the information brought to his notice regarding the violation of any provision of this Act, shall be competent to issue directions to the farmer, who has violated any provision of this Act to destroy the nursery of paddy or sown or transplanted before the notified date. 6. In case, a farmer does not act as per the directions of the authorised officer given under the section 5, the authorised shall cause such nursery of paddy, or sown or transplanted paddy, as the case may be, to be destroyed at the expenses of such farmer. 7. (1) Any farmer, who contravenes the provision the provisions of this Act, shall be liable of penalty of rupees ten thousand for every month or part thereof, per hectare of the land till the period, such contravention continues. (2) The penalty referred to in sub-section (1), shall be in addition to the recovery of the expenses, incurred for destroying the nursery of paddy, or sown or transplanted paddy before the notified date. (3) Before passing an order for imposing any penalty under sub section (1), the authorised officer shall make such enquiry, as he may deem necessary and shall give an opportunity of being heard to the concerned farmer. 8. Any farmer, aggrieved by an order of the authorised officer, passed under sub section (3) of section 7, may prefer an appeal to the Collector within a period of thirty days from the date of passing the order. 9. The penalty and the expenses referred to in section 7, shall be recoverable as arrears of land revenue. 10. No suit, prosecution or legal proceedings shall lie against the State Government or its officer or employee for anything, which is done or intended to be done in good faith under this Act. 11. No Civil court shall have jurisdiction to entertain any suit or proceeding in respect of any matter arising under or connected with this Act. 12. Notwithstanding anything to the contrary contained in any other law, enacted by the Punjab State Legislature for the time being in force, the provisions of this Act shall have effect.
37
Promotion of adoption of tensiometers, laser leveling of fields, ridge planting and
emphasis on growing water saving crops are some of the other steps taken in this regard. Time
has come to use rainwater harvesting technologies for conserving water and for recharging the
underground water, both in rural and urban areas.
3.6 Weather and climate
The land use pattern and crop production depends on the climate to a much greater extent
than any other factor of production. The effects of weather on agriculture are far reaching,
affecting the crop plants right from germination till maturity. The effects of weather continue to
affect the agricultural output in the markets and during storage. Important factors that make
environment are the temperature, moisture/rainfall, solar radiation and wind. Plants do best under
certain inter-related conditions of these factors and there are also extremes beyond which
significant losses to vegetation occurs. The climate of Punjab is mainly influenced by the
Himalayas in the North and the 'thar' desert of Rajasthan in the south and south west. The mean
annual rainfall varies from less than 300 mm to about 1400 mm. A major portion of the rainfall
(70%) is received during monsoon season (July to September). The information on average
annual rainfall from year 2007 onwards is presented in Table 3.8.
* Calculated by multiplying per hectare requirement (recommended) of seed with area under respective crops E- Based on final estimate of crop area by Directorate of Agriculture, Punjab
Table 4.2: Seed prices of important crops in Punjab
Strip till drill 215 195 NA NA NA NA Zero till drill 9083 10141 10300 10465 11517 13142 Rotavator 3309 6419 6720 8691 12346 22004 Laser land leveller NA NA NA 4500 - 5034 Source: Agriculture at a Glance, Directorate of Agriculture, Punjab, Chandigarh
Different types of farm machinery utilized in Punjab agriculture and their number are
presented in Table 4.7. As being indicated by marginal increase in number of various machines
during the recent years, the mechanization of state agricultural has now almost reached at a
saturation point. As per estimates of Punjab State Farmers Commission, the state has double the
number of tractors than it requires. The average use of tractors per annum in the state is barely
450 hours, which is much below the prescribed efficient usage of 1000 hours, in agriculture.
45
The over capitalization in form of mechanization coupled with its under utilization
pattern leads to disproportionate hike in cost of production or lowers the net returns to the
farmers and makes farming an unviable venture.
Along with under utilization of the farm machinery the increase in their prices is also
another factor behind increase in cost of production. As, Table 4.8 reflected that since 2007-08
the price of tractor (35 HP) has jumped from 3.70 lakh in 2007-08 to Rs. 5.00 lakh in 2014-15,
during the same period the price electrical motor has gone up from Rs. 23000 to Rs. 34000.
Table 4.8: Prices of selected agricultural machinery in Punjab (Rs/ unit)
Electrical motor 23000 23000 23500 28500 32500# 33000# 34000#
Prices are approximate only. Source: Department of Economics & Sociology, Punjab Agricultural University, Ludhiana * Information collected through personal correspondence with dealers; ** Price of Mahindra 265 Model; *** Price of submersible EM of 10 HP 4.5 Irrigation
Agriculture in Punjab has a heavy requirement of water for irrigation and there is an
excellent network of surface and ground irrigation facilities serving this purpose. About 99
percent of net sown area in state is irrigated (Table 4.9). Punjab has an organised irrigation
distribution set up through canals, branch canals and minor distributaries and field channels or
water courses. The cultivation of high water demanding crops particularly paddy is an important
factor accountable for decline in underground water levels in Punjab. Annual availability of
surface and ground water in state is 3.48 million hectare meters (mhm). However, the annual
demand for state agriculture is 4.76 mhm (Table 4.10). The annual deficit to the tune of 1.28
mhm every year is met through the overexploitation of underground water by tube wells leading
to serious problem of deteriorating underground water resources. Overtime, tube well irrigation
has been increased and about 73 percent of the total irrigated area is irrigated by underground
water pumped out by about 14.05 lakh tube wells in the state. This is mainly due to availability
of cheap credit and free supply of electricity in the state. As, for the last many years, the Punjab
farmers are getting free electricity supply for the use of tube wells as well as canal water
irrigation.
46
Table 4.9: Gross cropped and irrigated area in Punjab (000’ ha)
Year Gross cropped area
Irrigated area % of gross irrigated area to gross cropped area
2007-08 7870 7689.3 97.7
2008-09 7912 7723.6 97.6
2009-10 7876 7714.2 97.9
2010-11 7882 7723.8 98.0
2011-12 7902 7770.6 98.3
2013-14 7870 7744 98.4
2013-14 7848 7728 98.5 Source: Statistical Abstract, Punjab; P
Table 4.10: Status of water resources in Punjab Annual canal water available at H/w 1.79 M ha-m
Annual canal water available at outlets 1.45 M ha-m
Annual canal water available 2.03 M ha-m
Total annual available water resources 3.48 M ha-m
Annual water demand 4.76 M ha-m
Annual water deficit 1.28 M ha-m Source: Jain A K, Department of Soil & Water Engineering, PAU, Ludhiana Wheat and paddy being the major crops of the state, maximum area irrigated is under
these two crops. Table 4.11 shows that during 2013-14, wheat and paddy accounted for 44.95 per
cent and 36.73 per cent of the gross irrigated area in Punjab State.
47
Table 4.11: Crop wise gross irrigated area in Punjab
Total since inception 3980860 109981.31 3903261 107196.26 1963358 111689.91 Source: Agenda papers, 136th meeting of State Level Bankers’ Committee (Punjab)
52
Chapter 5
MAJOR CROPS: AREA, PRODUCTION AND YIELD Punjab agriculture has shown the signs of slowdown in growth during the recent period.
The changes in the area, production and productivity of major crops in the Punjab state over a
period since 1992-93 to 2014-15 are presented in Table 5.1. These changes were also observed
plan-wise for the plan periods viz. 8th plan (1992-93 to 1996-97); 9th plan (1997-98 to 2001-02);
10th plan (2002-03 to 2006-07) and 11th plan (2007-08 to 2011-12). The plan wise compound
annual growth rates (CAGR) of major crops with respect area, production and yield were also
worked out.
The area, production and yield of rice over the study period (1992-93 to 2014-15) went
up tremendously in Punjab by 39.67 percent, 58.08 percent and 13.18 percent, respectively. This
tremendous increase in rice production happened despite it was not traditional rice growing state.
Plan-wise the area expansion under rice was largest during 9th plan (9.03 %) and lowest during
10th plan (3.60 %) whereas, the production and yield increase was observed to be highest in 10th
plan by 14.17 percent and 10.20 percent, respectively. The lowest increase in rice production
(0.53 %) due to decline in yield by 6.92 percent was observed during the period of 11th plan. In
case of wheat area, production and yield during the study period went up by 6.76 percent, 21.69
percent and 13.95 percent, respectively. Plan-wise highest (3.64%) area increase under wheat
was observed during 9th plan. While the maximum increase in wheat production (21.90%) and
productivity (17.62%) was observed during 9th plan, the lowest increase in yield (0.24%) was
recorded during the 10th plan. It is worth noticing that since 1992-93 except potato the area
under other crops like maize, gram, sugarcane, total pulses, total oilseeds and cotton in the state
had declined, and the same has been encroached by wheat and paddy crops.
The area under cotton, the third most important crop of state went down drastically
during the 9th plan (16.30%), reason being the uncontrollable pest problems in late nineties.
However, with introduction of Bt cotton during the 10th plan, its yield and production picked up
remarkably by 82.93 percent and 146.82 percent, respectively. Despite the area under maize crop
went down by 33.68 per cent over the study period, due to tremendous increase in productivity
(58.99%), its production in state increased by 5.50 per cent.
Compound annual growth rates (CAGR) for major crops of state in 8th to 11th five year
plans and for overall study period (1992-93 to 2014-15) are presented in Table 5.2. The figures
53
revealed that rice area, production and productivity over the study period increased significantly
at the CAGR of 1.41, 2.39 and 0.97 percent, respectively. Thus, over the study period the
increase in area under rice contributed relatively more towards production increase as compared
to the contribution of yield. Plan-wise, while the significant increase in area (1.89% per annum)
was observed only during 11th plan, the production of rice increased significantly during 9th
(3.68% per annum) and 10th (3.26% per annum) plan periods. The rice productivity increased
significantly at CAGR 2.40 percent during 10th plan, whereas it declined during 11th plan period
by CAGR of 1.91 percent. The production of wheat during the study period increased at CAGR
of 1.20 percent while its area and yield increased at the rate of 0.31 and 0.89 percent,
respectively. Thus major contributor towards wheat production over this period was the increase
in yield. Plan-wise major increase in wheat area, production and yield was observed during 9th
plan. With the exception of potato CAGR of area of all other major crops in state viz. cotton,
maize, total pulses, total oilseeds and sugarcane during this period were found to be negative.
Thus, paddy and wheat crop rotation became predominant in the state at the cost of
cotton, maize, other cereals, oilseed and pulses. However, the productivity of these crops during
study period went up significantly with the exception of sugarcane.
54
Table 5.1: Area, production and yield (plan-wise) of major crops, Punjab
Figures in parentheses indicate percentage change. A : Area (000 ha), P: Production (000 metric tones) and Y: Yield (Kg/ha) # Production of cotton in 000 bales (cleaned lint); Productivity of cotton is in form of lint
56
Table 5.2: Plan-wise compound annual growth rates (CAGR) of major crops in Punjab
Crop
8th Plan
9th Plan
10th Plan
11th Plan
Overall (1992-93 to
2014-15)
Rice A 0.85ns 2.11ns 0.84ns 1.89** 1.41***
P -0.25ns 3.68** 3.26* 0.06ns 2.39***
Y -1.09ns 1.53ns 2.40* -1.91** 0.97***
Wheat A -0.68ns 0.93*** 0.60ns 0.19ns 0.31***
P 1.29ns 4.81* 0.58ns 3.20ns 1.20***
Y 1.98ns 3.84 -0.02ns 3.01ns 0.89***
Maize A -3.89** 0.69ns -0.27ns -5.15*** -1.65***
P -5.70ns 8.29** 7.63ns -1.34ns 1.88***
Y -1.95ns 7.55** 7.92ns 4.00** 3.58***
Gram A -9.25** -15.83* -14.14*** -3.11ns -11.86***
P -1.32ns -13.37* -12.56** 0.93ns -10.16***
Y 7.31ns 3.10ns 0.77ns 4.56ns 1.95**
Sugarcane A 15.47ns 4.08ns -11.77* -7.19ns -1.83*
P 15.40ns 7.81ns -10.58ns -7.65ns -1.94*
Y -0.001ns 3.57*** 1.36ns -0.53ns -0.13ns
Cotton A 3.66ns -5.13ns 8.41** -4.01ns -1.67**
P -1.65ns 14.61ns 25.69*** -9.31*** 1.02ns
Y -5.15ns 20.79* 15.94** -5.53ns 2.74*
Potato A 19.07* -2.02ns 3.00** -3.71ns 4.96**
P 19.15* 4.25ns -2.29ns -19.11ns 6.68***
Y 0.57ns 6.26* -5.14ns 5.73ns 1.66**
Total cereals
A -0.31ns 1.24ns 0.05ns 0.76* 0.71***
P 0.61ns 3.55ns 0.48ns 1.84* 1.64***
Y 0.93ns 2.16ns 0.43ns 1.08ns 0.92***
Total Pulses
A -1.88*** -13.00*** -9.97** -10.79** -9.74***
P 0.53ns -13.37*** -9.15* -9.27** -9.70***
Y 2.45ns -0.44ns 0.94ns 1.69ns 0.05ns
Total foodgrains
A -0.28ns 1.18ns -0.01ns 0.72* 0.64***
P 0.61ns 3.50ns 0.28ns 1.84* 1.62***
Y 0.89ns 2.29* 0.29ns 1.11ns 0.97***
Total oilseeds
A 6.15ns -16.12*** -7.18** -4.24* -6.73***
P 8.22ns -16.55*** -3.35ns -2.71ns -6.10***
Y 1.97ns -0.52ns 4.13ns 1.61ns 0.69ns ***, ** and * Significant at one, five and ten percent level of probability, respectively
57
Chapter 6
AGRICULTURAL RESEARCH, EDUCATION AND EXTENSION Agricultural research and technological improvements are prerequisites for growth of
agricultural productivity and income of the rural workforce. This in turn helps to alleviate
poverty, which is a primary rural phenomenon. Indian Council of Agricultural Research (ICAR)
being an apex scientific organization at national level, at the state level Punjab has an excellent
infrastructure for agricultural research and education at Punjab Agricultural University (PAU).
Established in 1962 at Ludhiana on the pattern of land grant colleges of USA with integrated
teaching research and extension programme, PAU is committed to continue improvement in the
productivity and profitability of agriculture and allied sectors. It played a crucial role in
promoting and accelerating the use of science and technology programmes relating to
agricultural research and education. It also provides assistance and support in demonstrating the
use of new technologies in agriculture. PAU did a commendable job in adapting/developing
wheat and rice varieties to suit the regional conditions leading to manifold increase in
productivity. It has also made notable contributions in increasing livestock and poultry
production. In 2006 the College of Veterinary Science of PAU, Ludhiana was upgraded to
become Guru Angad Dev Veterinary and Animal Science University (GADVASU) which is now
looking after the research, teaching and extension regarding livestock and veterinary sciences.
PAU is engaged in carrying out research in Agriculture, Agricultural Engineering, Basic
Sciences and Home Science. Since its inception, PAU has evolved a strong crop improvement
programme and released 789 crop varieties and hybrids till August, 2016 (Table 6.1). Among
these several have gained national and international acceptability.
58
Table 6.1: List of crop varieties/hybrids released by Punjab Agricultural University (Up to August, 2016)
S. No. Name of crop Number of varieties 1 Wheat 64 2 Barley 11 3 Rice 39 4 Maize 36 5 Cotton 45 6 Pulses 57 7 Soybean 9 8 Oilseeds 63 9 Pearl millet 15 10 Fodder 42 11 Sugarcane 24 12 Vegetables 176 13 Horticulture 139 14 Flowers 39 15 Mushrooms 9 16 Forest crops 14 17 New crops 4 18 Green manuring crops 3 Total 789 Source: Directorate of Research, Punjab Agricultural University, Ludhiana
PAU introduced cultivation of many new crops and developed/recommended resource
conservation/crop production technologies. Important one are as following:
Ø Zero tillage/minimum tillage
Ø Bed planting/ridge planting
Ø Leaf colour charts (LCC)
Ø Direct seeding of paddy (DSR)
Ø Laser leveling of fields
Ø Tensiometer (for optimum irrigation)
Ø Crop residue management
Ø Technology for reclamation of problem soils (saline and water logged)
Ø Timely sowing/transplantation of crops
Ø Net-house cultivation of vegetables
Ø Integrated nutrient management
Ø Soil testing based fertilizer application
59
PAU also worked out on crop disease/fungus management and integrated pest
management/insect resistance management technologies. Besides, it has strong machinery
development and testing programme. Italian honeybee was introduced in Punjab and
technologies in honey production, extraction and processing were developed.
The State Department of Agriculture as well as extension services of PAU and
GADVASU play a lead role in dissemination of research findings and recommendations among
the farming community of Punjab, who quickly respond through adoption of the same. The State
Department of Agriculture has district level training centers which are instrumental in imparting
training to the farmers and farm-women in day to day agricultural technological developments
with regards to crop production and allied activities. District level camps are organized both in
Kharif and Rabi season by the department where experts/scientists educate the field staff as well
as progressive farmers about the latest scientific crop production/management technologies.
Field staff of the department has been organizing farmers training camps at block and village
level. Extension wings of the PAU and GADVASU are the vital links between scientists and
different state departments, other development agencies and farmers. Directorate of Agricultural
Source: Agricultural Statistics at a Glance Meat production is from commercial poultry has been included from 2009-10 onwards
After the green and white revolution, Punjab is now on the threshold of a blue revolution
as the state has a great potential of diversification of agriculture in favour of fish farming. The
farmers are already engaged in the intensive fish culture in ponds and tanks on modern scientific
lines through composite fish culture of fast growing resources. Fisheries resources of Punjab
comprise 868 kilometers of rivers, 11,200 kilometers of canals, 5084 hectares of small water
reservoirs and lakes. In addition to this, there are 7135 village ponds covering an area of 4378
hectares, which can be made suitable for fish culture after minor renovation. Another 5228
village ponds covering an area of 2668 hectares, which requires major renovation work, can also
be made fit for fish culture (Grover and Kumar, 2011). The relevant statistics regarding fish
culture and production in the state is presented in Table 7.3.
64
Table 7.3: Fisheries statistics in Punjab
Source: Statistical Abstract, Punjab and Agricultural Statistics at a Glance
The area where fish has been stocked in the state increased from 9941 hectare in 2007-08
to 14851 hectare in 2014-15. During this period the production of fish seed and nurseries
increased from 465.62 lakh to 514.76 lakh. Fish production observed at 78.73 thousand tones in
2007-08 increased to 114.77 thousand tones during 2014-15.
Growth in any sector or sub sector is not possible without back up of adequate
infrastructure and related services. However, in Punjab the area served per institution and
veterinarian has not been improved since 2007-08 (Table 7.4).
Table 7.4: Average no. of livestock units, area and units served per veterinary institution and per veterinarian in Punjab Year Unit No* Livestock units per Area served per sq. km.
Institution Veterinarian Institution Veterinarian 2007-08 7052908 2473 5159 17.66 36.84 2008-09 7052908 2473 5159 17.66 36.84 2009-10 7052908 2473 5159 17.66 36.84 2010-11 7052908 2473 5159 17.66 36.84 2011-12 7052908 2452 5159 17.66 36.84 2012-13 7052908 2752 5159 17.66 36.84 2013-14 8117101 2852 5938 17.66 36.84 2014-15 7681100 2852 5619 17.66 36.84 Estimated on the growth rate of 1977 and 1990, 1990-1997 and 2003 livestock census by using modified geometric method Note: Total livestock has been converted into livestock units-One livestock unit=one cattle=one buffalo=one horse/pony=one donkey=one camel=10 goats=10 sheep= 5pigs= 100 poultry Source: Statistical Abstract, Punjab
Information on number of breed-wise froze semen straw produced in semen banks
reveals that in case of Sahiwal it increased from 71745 during 2007-08 to a record high at
219045 in 2014-15 (Table 7.5). However, during the same period, the production of Crossbred
Source: Department of Food and Civil Supplies, Punjab, Chandigarh Table 8.3: Cane crushed by sugar mills in Punjab
Year Crushing capacity* (000’ tones)
Cane crushed (000’ tones)
% of capacity utilization
2007-08 9377.40 5760.5 61.42 2008-09 9377.40 2603.5 27.76 2009-10 9377.40 2112.0 22.52 2010-11 10502.40 3433.2 32.69 2011-12 10502.40 4270.5 40.66 2012-13 9864.90 4739.2 48.04 2013-14 9864.90 4972.5 50.41 2014-15 9864.90 5695.0 50.41 Source: Statistical Abstract, Punjab; * Number of working days of sugar mills assumed to be 150 in a year
70
Table 8.4: Cotton textile mills, spindles and looms in Punjab (Number)
Source: Statistical Abstract, Punjab. Data includes small scale industries Table 8.5: Production of yarn, cloth in cotton textile mills and production of traditional khadi in Punjab
Year Total yarn (000 kg.)*
Total cloth/ M.sq.mtr
Production of traditional khadi
(000’ meter)** 2007-08 489617 206.51 913
2008-09 545482 220.30 740
2009-10 589516 221.29 627
2010-11 651065 239.56 296
2011-12 655582 149.76 933
2012-13 761117 221.77 940
2013-14 818424 226.04 1128
2014-15 843617 192.90 1410 Total cloth includes cloth production by mill sector and exclusive weaving units;*Includes production of yarn by SSI units;** Includes khadi Sewa Sangh Jalandhar also Source: Statistical Abstract, Punjab
2014-15 Milkfed 11(16.67) 1775(22.83) Joint sector 3(4.55) 500(6.43) Private sector 52(78.78) 5501(70.74) Total 66(100.00) 7776(100.00) Figures in the parentheses are percentage to the total Source: Statistical Abstract, Punjab
72
Processing of fruits and vegetables is very limited in Punjab. Specific processed products
that are produced from horticulture sector in state include tomato paste, potato chips, juices,
jams, chutney, pickles, murabbas, frozen vegetables, etc. Due to climatic conditions the fruits
and vegetables production in state is characterized by short harvesting seasons and high
productivity. Hence the viability of processing plants handling only one type of fruits/vegetables
becomes limited and ultimately becomes uneconomical. Punjab Agro Juices Limited (PAJL) was
established in 2006 with aim to add value to horticultural crops and provide opportunity to
farmers for selling their produce at competitive basis. Two major plants (Hoshiarpur and
Abohar) which can handle processing of various fruits and vegetables, commissioned by PAJL
had started commercial production during 2008. These processing plants can handle pulp as well
as store all the concentrates and single strength juices at the facility. In addition both of the plants
are equipped with facilities of normal cold storage and deep freezer. Other notable high tech
agro/food industries involved in value addition to agricultural production in state are Glaxo
Smithkleim at Nabha (Patiala), Nestle at Moga, Nijjar Agro Foods at Jandiala and Pepsico agro
Foods at Zahoora (Hoshiarpur).
Overall, despite being the leading agrarian state of the country, Punjab is way behind in
food processing/value addition industry. The agro industry in state is limited to grain processing
like rice milling, flour mills, oil mills and cotton ginning.
73
REFERENCES
Chadha G K and Sahu P P (2003) Small scale agro-industry in India: Low productivity is its Achilles heel. Indian Journal of Agricultural Economics 58(3):518-543.
Chengappa P G (2004) Emerging trends in agro-processing sector, Indian Journal of Agricultural Economics. 59(1):55-74.
Deshpande R S, Mehta P and Shah K (2007) Crop diversification and agricultural labour in India. Indian Journal of Labour Economics 50(4):597-610.
Government of India, Agricultural Statistics at a Glance, Various Issues. Ministry of Agriculture, New Delhi.
Government of Punjab, Statistical Abstract, Various Issues. Economic Advisor to Government, Punjab, Chandigarh.
Government of Punjab, Agriculture at a Glance, Various Issues. Department of Agriculture, Chandigarh.
Grover D K and Kumar S (2011) State of Punjab Agriculture. Agro Economic Research Centre, PAU, Ludhiana. Grover D K and Kumar S (2011) Economics of Production, Processing and Marketing of Fodder Crops in Punjab. Agro Economic Research Centre, PAU, Ludhiana. Haque T and Sharma S (2004) Trends in crop output and employment in India. Agricultural
Situation in India 39(5):273-280. Sarkar S (1997) Growth of agro-industry in India and its inter-relationship with agriculture.
Artha Vijana 39(2). Shergill H S (2011) Role of Cooperative Institutions in Agricultural Credit in Punjab: Present
Position and Strategy for Further Improvement. Institute for Development and Communication (IDC), Chandigarh.
Sidhu H S (2002) Crisis in agrarian economy in Punjab-some urgent steps. Economic and Political Weekly 37(30): 3132-38.


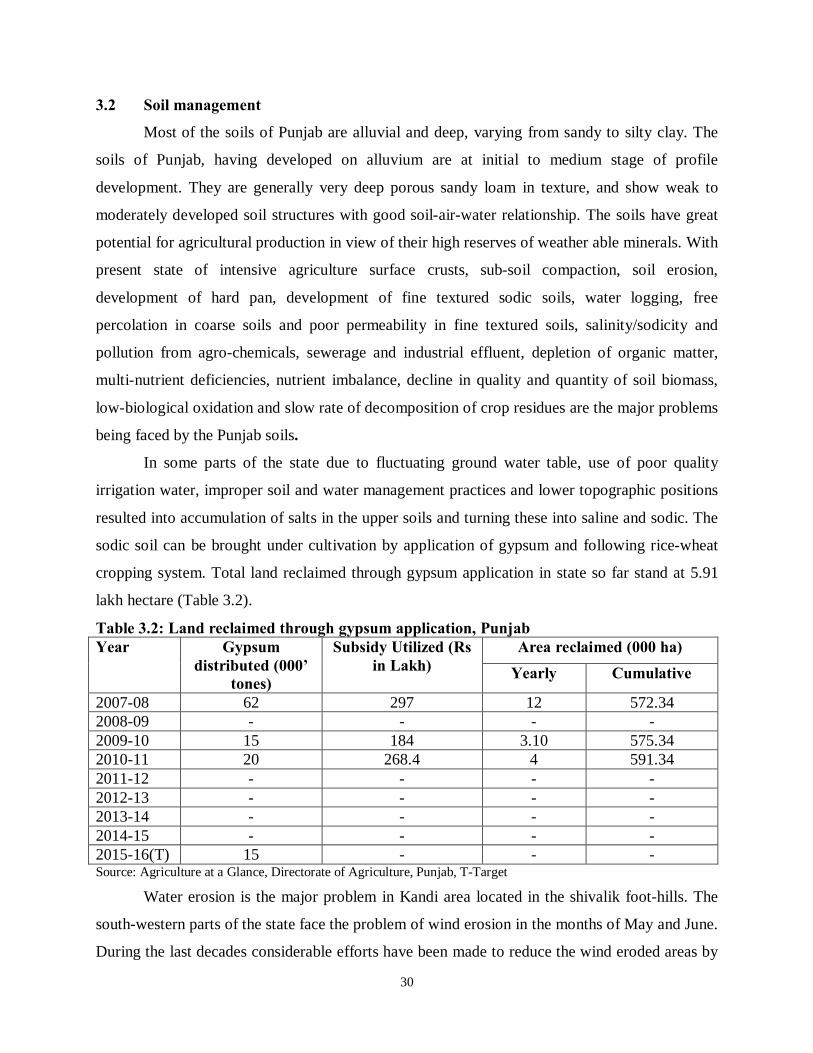


![INDEX [hrylabour.gov.in]€¦ · Web viewS. Tanneries and Leather Manufactory. 9. Rice Mills, Flour Mills and Dal Mills. 10. Rubber Industry. 11. Operation of Tubewell Industry. 12.](https://static.documents.pub/doc/80x56/5ec05484689565615e44642d/index-web-view-s-tanneries-and-leather-manufactory-9-rice-mills-flour-mills.jpg)


