12
STATE AND LOCAL PENSION REFORM SINCE THE FINANCIAL CRISIS 1 I ssue B rief December 2016 State and Local Pension Reform Since the Financial Crisis

STATE AND LOCAL PENSION REFORM SINCE THE FINANCIAL CRISIS 1
Issue Brief
December 2016
State and Local Pension Reform Since the Financial Crisis

2 STATE AND LOCAL PENSION REFORM SINCE THE FINANCIAL CRISIS
Pension reform has been widespread in state and local governments in the aftermath of the financial crisis. This issue brief examines the pattern of reforms, what changes have been the most common, legal
protections, and what factors are associated with the reforms.Authors Jean-Pierre Aubry and Caroline V. Crawford examined the data
from 2009-2014 from all 114 state plans and 46 local plans in the Public Plans Database (http://publicplansdata.org) and an additional 86 local plans. They found that:
• 74 percent of state plans and 57 percent of large local plans have cut benefits and/or raised employee contributions to curb rising costs.
• While the majority of state and local plans reduced benefits for new employees only, 25 percent also cut benefits for current employees.
• The two most common benefit reductions for current employees were increases in employee contributions and reductions to the COLA.
• New employees experienced the greatest reductions in core benefits, most commonly: (1) increases in the age and tenure required to claim benefits and (2) reductions in the benefit multiplier and lengthening the period used to calculate final average salary.
• Plans more likely to make cuts had the highest annual required contribution (ARC) as a percentage of revenue or had lower employee contributions.
The Center for State and Local Government Excellence gratefully acknowledges the financial support from the ICMA-RC to undertake this research project.
Elizabeth K. KellarPresident and CEOCenter for State and Local Government Excellence
2 THE FUNDING OF STATE AND LOCAL PENSIONS: 2014–2018
Most public pension plans have improved their funded status in 2014 with the ratio of assets to liabilities for the 150 plans in publicplansdata.org increasing from 72 percent in 2013 to 74 percent in 2014. If the stock market continues
to perform well, most plans will be over 80 percent funded in 2018, authors Alicia H. Munnell and Jean-Pierre Aubry estimate.
There are two reasons for the 2014 improvements, according to their analysis:
• Positive stock market performance for the last five years, allowing the year of negative equity returns in 2009 to be replaced in plans that smooth their market gains and losses over five years; and
• Higher payments of the required annual contribution by state and local governments increasing to 88 percent in 2014 compared to 82 percent in 2013
While plan sponsors continue to use traditional actuarial calculations to determine their annual funding requirements, all plans also are reporting the market valuation of assets as required by the Governmental Accounting Standards Board Statement 67. Because 2014 had strong stock market performance, plans show higher asset values with year-end market valuations than with the traditionally smoothed actuarial valuations.
Seven plans in the 150 plan sample adopted the GASB 67 blended rate in 2014. As none of the seven plans had been 100 percent funded, the new accounting calculations resulted in an overall ratio of assets to liabilities that is lower than would have been reported under GASB 25 accounting standards.
For state and local governments and their employees, the most important measure of progress is the trend in plan funding according to actuarial valuations. For a short summary of the differences in pension calculations used for accounting purposes, bond ratings, and budgets, see Understanding New Public Pension Funding Guidelines and Calculations.
The Center for State and Local Government Excellence gratefully acknowledges the financial support from ICMA-RC to undertake this research project.
Elizabeth K. KellarPresident and CEOCenter for State and Local Government Excellence

* Jean-Pierre Aubry is associate director of state and localresearch at the Center for Retirement Research at Boston College(CRR). Caroline V. Crawford is a research associate at the CRR.The authors thank David Blitzstein, Keith Brainard, StevenKreisberg, and Ian Lanoff for helpful comments.
IntroductionIn the wake of the financial crisis, many state and local pension plans have reduced benefits and increased required employee contributions to curb rising employer costs. While past research suggests that most state plans have made some changes, little information is available about reforms at the local level.1 This brief documents and compares the reform patterns for over 200 major state and local plans between 2009 and 2014 and investigates how and why the changes were made.
The discussion proceeds as follows. The first section describes the data and methodology. The second section provides background on legal protections that might impede changes in benefits for current employees. The third section catalogues and compares the benefit reforms made since the financial crisis – separately assessing reforms applied to current employees and to new hires. The fourth section introduces a regression analysis to better understand what factors have motivated both reforms overall and reforms aimed at current employees. The fifth section presents the regression results. The final section concludes that, unsurprisingly, the biggest factor related to reforms overall was the cost of the plan relative to the total revenue of its sponsoring government, while the main factor related to reforms for current employees was the strength of state legal protections for benefits.
Data and MethodologyThe sample for this study covers all 114 state plans and 46 local plans from the Public Plans Database (PPD) and an additional 86 local plans. In total, the sample includes the major plans for every state, as well as major local plans from 102 cities, 22 counties, and 8 school districts. To be geographically representative, the sample of local plans is designed to include the largest locally-run plans in each state. The sample represents about 97 percent of the assets in state-administered plans and 67 percent of the assets in locally-administered plans. The reason for the difference in coverage is that state plans are few and large, while local plans are many and often small.
Other data sources used in this study, in addition to the PPD, include plan actuarial valuations and financial reports. For the few local plans that did not publish a financial report, the reports of the sponsoring city, county, or school district are used. The analysis catalogues major changes to employee benefits for each year during 2009-2014. These include changes to employee contributions, COLAs, benefit factors, the period used to calculate final average salary, retirement age and tenure provisions, and plan type (defined benefit vs. defined contribution).2 Additionally, changes are categorized by whether they applied to current employees or only to new employees.
Legal ProtectionsBefore discussing the benefit changes, it is important to understand that many states have legal protections that constrain the ability to alter benefits for current employees. These protections vary significantly by state
State and Local Pension Reform Since
the Financial CrisisBy Jean-Pierre Aubry, and Caroline V. Crawford*

4 STATE AND LOCAL PENSION REFORM SINCE THE FINANCIAL CRISIS
(see Table 1). The strongest protections are in states that prohibit reductions in both past and future benefit accruals for current employees. Such protections involve either explicit language on pensions in a state’s constitution or the application of contract law. At the other extreme are states with no legal protections, which treat pension benefits as a gratuity provided by the employer. Importantly, no states protect the benefits of new employees, making it much easier to cut benefits for this group.
Benefit Reform PatternsReflecting the differences in benefit protections, Figure 1 shows the percentage of states and localities making
changes for both new and current employees. Two key points emerge. First, 74 percent of state plans made some type of reduction compared to 57 percent of local plans. Second, while the majority of plans reduced benefits only for new employees, about one-quarter also cut benefits for current employees. While the magnitude of the reforms varies substantially across plans, this brief focuses only on whether a reform was made.
Cuts for Current Employees The most common benefit reductions for current employees are increases to their pension contributions and reductions to the COLA (see Figure 2). While the increase in employee contributions does reduce an
Figure 2. Percentage of Plans Making Benefit Changes to Current Employees, by Type of Reform, 2009-2014
Source: Plan AVs and CAFRs (2009-2014).
48% 34%
26%
23%
0%
20%
40%
60%
80%
100%
State plans Local plans
New and current employees New employees only
57%
74%
Figure 1. Percentage of Plans Making Benefit Changes, by Type of Employee, 2009-2014
Source: Plan actuarial valuations (AVs) and comprehensive annual financial reports (CAFRs), (2009-2014).
Final avg.salary
Benefitfactor
Age/tenure
DC/hybrid
Employee contributions
COLA
17%
9%
6%
3%4%
1%
12% 13%
5%
6%
2%
1%
0%
5%
10%
15%
20%
State plansLocal plans
State Constituion AK, IL, NY AZ HI, LA, MI
Contract CA, GA, KS, MA, NE, NH, NV, OR, PA, TN, VT, WA, WV
CO, ID, MD, MS, NJ, RI, SC
AL, AR, DE, FL, IA, KY, MO, MT, NC, ND, OK, SD, UT, VA
Property ME, WY CT, NM WI, OH
Promissory estoppela MN
Gratuity IN, TXb
Table 1. Legal Basis for Protection of Public Pension Rights Under State Laws
a Promissory estoppel is the protection of a promise even where no contract has been explicitly stated.b In Texas, this gratuity approach applies only to state-administered plans. Accruals in many locally-administed plans are protected under the Texas Constitution.
Sources: Munnell and Quinby (2012); and subsequent communications with plan administrators and legal experts.
Legal Basis
NonePast onlyPast and maybe futurePast and future
Benefit accruals protected

STATE AND LOCAL PENSION REFORM SINCE THE FINANCIAL CRISIS 5
employee’s net pension benefit (the portion of the benefit that is paid for by the employer), the prevalence of the reform suggests that it is viewed differently than direct reductions to benefits. In terms of the COLA, prior research by CRR revealed that, in many states, COLAs are not viewed as “core” benefits and have less protection under the law. As a result, they appear easier to cut than the benefit factor, the final average salary period, or retirement age and tenure provisions.3
What is surprising is that a handful of state and local governments were able to make changes to current employee benefits beyond increases to employee contributions and cuts to COLAs. In these cases, the core benefits were reduced (see Appendix Table A1). Such reductions were sometimes achieved through advance negotiations or compromises reached after cuts were challenged in court. For example, the Vermont Teachers’ Retirement System enacted reform after negotiations with the National Education Association; and Rhode Island’s Employees’ Retirement System and Municipal Employees’ Retirement System, after years of litigation, were able to reach a settlement with unions representing virtually all of the affected employees. In other cases, benefit reductions passed legal muster because they applied only to future benefit accruals in states where protections were limited to past accruals.
Cuts for New EmployeesFor new employees, the pattern of reform is somewhat different – reductions to core benefits are much more common (see Figure 3). The most common change was to increase the age and tenure required to claim benefits. The next most common changes were to reduce the benefit factor, lengthen the period used to calculate final average salary, and increase employee contributions. Interestingly, local plans are much less likely to increase age and tenure requirements than state plans. A possible explanation is that most police and fire plans are administered at the local level, and their employee unions are particularly sensitive to altering retirement ages.
Regression AnalysisA 2013 analysis by CRR suggests that plans tend to tailor their reforms to the nature and size of their pension challenge.4 These initial findings highlight the importance of taking a closer look at what factors motivate and predict reform activity. To achieve this aim, the analysis used two probit regressions. The first regression investigates what motivates the decision to enact any benefit cuts at all. The second regression focuses – for the plans that have made reforms – on what motivates extending cuts to current employees, rather than limiting them to new hires.
The dependent variable for the first regression is whether the plan made any cuts between 2009 and 2014. If a plan reduced benefits in any way or raised employee contributions, it was flagged as making a reform. For the second regression, the sample is limited to only the plans that cut benefits. The dependent variable is the probability of making changes for current employees. As described below, the independent variables of
Figure 3. Percentage of State and Local Plans Making Benefit Changes to New Employees, by Type of Reform, 2009-2014
Source: Plan AVs and CAFRs (2009-2014).
33%
26%
42%
30%
60%
9%
29%24%
30%31%
36%
5%
0%
20%
40%
60%
80%State plansLocal plans
Final avg.salary
Benefitfactor
Age/tenure
DC/hybrid
Employee contributions
COLA

6 STATE AND LOCAL PENSION REFORM SINCE THE FINANCIAL CRISIS
interest for both regressions cover several 2009 plan characteristics to reflect the nature and size of the pension challenge faced prior to the reform period.
State or locally-run plan. As noted above, state-run plans appear to have greater reform activity than local plans. One reason may be that locally-run plans are much more likely to cover police and fire employees, so reform requires negotiating with unions that may have strong political influence.5 Also, in smaller cities where the government is among the largest employers, cutting benefits can significantly impact the local economy.
Annual required contribution (ARC). ARC payments cover the plan’s normal cost (the present value of benefits earned by employees for that year’s employment) and amortize the unfunded liability (the gap between existing plan assets and benefit promises). Plans with a higher ARC as a percentage of revenue put more pressure on the overall budgets of their government sponsors, so they may be more likely to make reforms than less expensive plans.
Employee contributions. Plans with lower employee contributions are expected to be more likely to take advantage of this reform option.
Generosity of benefits. Plan generosity is measured by the average benefit paid to each employee divided by average salary. The hypothesis is that plans offering more generous benefits are more likely to see benefit reductions during periods of financial stress.
Strength of benefit protections. In general, state and local benefits for current employees enjoy strong legal protections. Yet, some variation exists. A handful of states have constitutional provisions that explicitly prevent reducing the benefits of current employees, while others have little or no protection. This variable captures whether a state has explicit constitutional protections. Stronger protections are expected to reduce the likelihood of benefit reductions.
Regression ResultsFigure 4 reports the effects of the independent variables on the probability of reform (see Appendix Table A2 for full results). The values represent the marginal effect of a one-standard-deviation change in each variable. For the most part, the variables have the expected relationship. Overall, local plans are less likely to reduce benefits than state plans. Across both state and local plans, plans with a higher ARC as a percentage of revenue are more likely to make cuts, as are plans with lower employee contributions. The coefficient for plan generosity has the expected sign, but is not statistically significant.
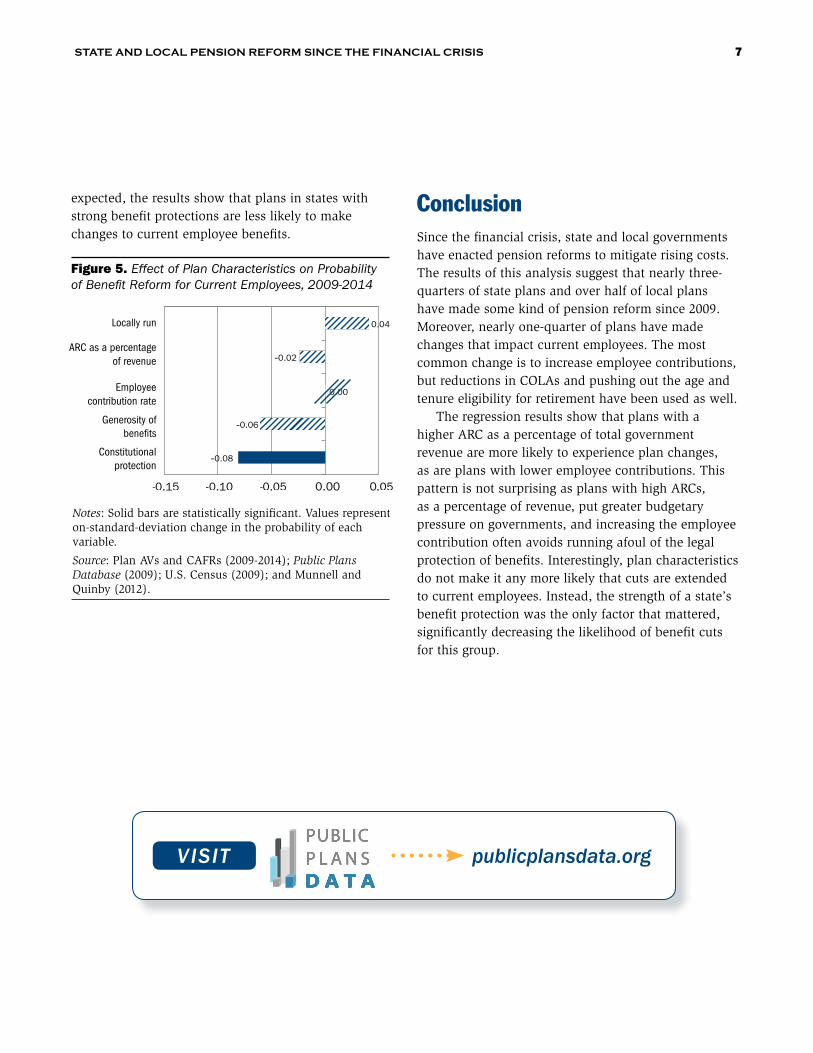
Figure 5 reports the effect of the independent variables on the probability of reform for current employees (see Appendix Table A3 for full results). None of the plan characteristics are statistically significant. The only statistically significant variable is the strength of the state’s benefit protection. As
Figure 4. Effect of Plan Characteristics on Probability of Benefit Reform, 2009-2014
Notes: Solid bars are statistically significant. Values represent on-standard-deviation change in the probability of each variable.
Source: Plan AVs and CAFRs (2009-2014); Public Plans Database (2009); U.S. Census (2009); and Munnell and Quinby (2012).
-0.10
0.21
-0.09
0.03
-0.20- 0.10 0.00 0.10 0.20 0.30
ARC as a percentageof revenue
Employeecontribution rate
Locally run
Generosity of benefits
STATE AND LOCAL PENSION REFORM SINCE THE FINANCIAL CRISIS 7
0.00
expected, the results show that plans in states with strong benefit protections are less likely to make changes to current employee benefits.
ConclusionSince the financial crisis, state and local governments have enacted pension reforms to mitigate rising costs. The results of this analysis suggest that nearly three-quarters of state plans and over half of local plans have made some kind of pension reform since 2009. Moreover, nearly one-quarter of plans have made changes that impact current employees. The most common change is to increase employee contributions, but reductions in COLAs and pushing out the age and tenure eligibility for retirement have been used as well.
The regression results show that plans with a higher ARC as a percentage of total government revenue are more likely to experience plan changes, as are plans with lower employee contributions. This pattern is not surprising as plans with high ARCs, as a percentage of revenue, put greater budgetary pressure on governments, and increasing the employee contribution often avoids running afoul of the legal protection of benefits. Interestingly, plan characteristics do not make it any more likely that cuts are extended to current employees. Instead, the strength of a state’s benefit protection was the only factor that mattered, significantly decreasing the likelihood of benefit cuts for this group.
Figure 5. Effect of Plan Characteristics on Probability of Benefit Reform for Current Employees, 2009-2014
Notes: Solid bars are statistically significant. Values represent on-standard-deviation change in the probability of each variable.
Source: Plan AVs and CAFRs (2009-2014); Public Plans Database (2009); U.S. Census (2009); and Munnell and Quinby (2012).
Locally run 0.04
-0.02
0.00
-0.06
-0.08
-0.15- 0.10 -0.050 .000 .05
ARC as a percentageof revenue
Employeecontribution rate
Constitutionalprotection
0.00
Generosity of benefits

8 STATE AND LOCAL PENSION REFORM SINCE THE FINANCIAL CRISIS
Endnotes
1 Munnell et al. (2013); Brainard and Brown (2016).
2 Employer actions – such as increasing their own contribu-tions, lowering the assumed return, or changing amortiza-tion methods – were outside the scope of this brief.
3 Munnell, Aubry, and Cafarelli (2016).
4 Munnell et al. (2013).
5 Ninety percent of police and fire employees are covered under a local plan.
References
Brainard, Keith and Alex Brown. 2016. “Significant Reforms to State Retirement Systems.” Washington, DC: National Association of State Retirement Administrators.
Munnell, Alicia H., Jean-Pierre Aubry, and Mark Cafarelli. 2016. “COLA Cuts in State-Local Pensions.” Journal of Pension Economics and Finance 15(3): 311-332.
Munnell, Alicia H., Jean-Pierre Aubry, Anek Belbase, and Joshua Hurwitz. 2013. “State and Local Pension Costs: Pre-Crisis, Post-Crisis, and Post-Reform.” State and Lo-cal Plans Issue in Brief 30. Chestnut Hill, MA: Center for Retirement Research at Boston College.
Munnell, Alicia H. and Laura Quinby. 2012. “Legal Con-straints on Changes in State and Local Pensions.” State and Local Plans Issue in Brief 25. Chestnut Hill, MA: Center for Retirement Research at Boston College.
Public Plans Data. 2001-2014. Center for Retirement Re-search at Boston College, Center for State and Local Government Excellence, and National Association of State Retirement Administrators.
U.S. Census Bureau. 2009. State and Local Government Finances. Washington, DC.

STATE AND LOCAL PENSION REFORM SINCE THE FINANCIAL CRISIS 9
Constitutional
Detroit Police and Fire Retirement System* Agreement reached after negotiations.
Detroit General Retirement System* City bankruptcy prompted vote by plan participants.
Fort Worth Employees’ Retirement Funda* Reforms apply to future service, ongoing litigation.
Contract: Past and future accruals
Vermont Teachers’ Retirement System Agreement reached after negotiations.
Contract: Past and maybe future accruals
Baltimore Fire and Police Employees’ Retirement System Passed after litigation.
Rhode Island Employees’ Retirement System* Reached settlement after litigation.b
Rhode Island Municipal Employees’ Retirement System* Reached settlement after litigation.b
Contract: Past accruals only
Arkansas Teacher Retirement System* Reforms apply to future service.
Lexington Policemen’s and Firefighters’ Retirement Fund* Accruals before retirement are not protected.
Miami Firefighters’ and Police Officers’ Retirement Trust Non-vested employees are not protected.
Newport News Employees’ Retirement Fund Reforms apply to future service.
North Dakota Teachers’ Retirement Fundc* No legal action.
Pensacola General Pension and Retirement Fund* Reforms apply to future service.
South Dakota Retirement System Reforms apply to future service.
Virginia Retirement Systemd Accruals before retirement are not protected.
Property-based approach: Past accruals only
Cincinnati Retirement System* Reached settlement after litigation.
Milwaukee County Employees’ Retirement System Reforms apply to future service.
Ohio Public Employees Retirement System* Accruals before retirement are not protected.
Table A1: Plans Making Changes to Current Employee Core Benefits, 2009–2014
Appendix
Strength of ProtectionPlan name Explanation
a While Texas views benefits provided by state-administered pension plans as a gratuity, the benefits provided by some locally-administered plans, such as Fort Worth Employees, are protected in the state constitution.
b A 2015 settlement was reached between the Rhode Island Employees’ Retirement System and Municipal Employees’ Retirement System and six of the nine unions, representing 99 percent of affected state employees.
c Some constitutional protection may be available, but the extent of that protection has not been tested in litigation.d Data from the National Conference on Public Employee Retirement Systems (NCPERS) states that retirement benefits
do not vest until a member qualifies for retirement. Based on existing case law, legal policy analysts at the Virginia Retirement System were unable to confirm or deny that its plan benefits are protected as NCPERS describes.
Sources: Plan AVs and CAFRs (2009-2014); Munnell and Quinby (2012).

10 STATE AND LOCAL PENSION REFORM SINCE THE FINANCIAL CRISIS
Table A2. Marginal Effects of Plan Characteristics of Benefit Reform, 2009–2014
Note: Marginal effects are significant at the 1-percent level (***) or 5-percent level (**). The sample was reduced from 246 to 208 after excluding state plans that had no state government ARC and plans with missing data.
Sources: Plan AVs and CAFRs (2009-2014); Public Plans Database (2009); U.S. Census (2009); and Munnell and Quinby (2012).
Marginal Effects
Locally run -0.21***
(0.07)
ARC as a percentage of revenue 5.10***
(1.18)
Employee contribution rate -2.31**
(0.97)
Generosity of benefits 0.19
(0.20)
Sample Size 208
R-squared 0.12
Table A3. Marginal Effects of Plan Characteristics & Constitutional Protection of Benefit Reforms for Current Employees, 2009–2014
Note: Marginal effects are significant at the 5-percent level (**). The sample was reduced from 246 to 139 after excluding state plans that had no state government ARC, and plans with missing data, and plans that made no reform during this time period.
Sources: Plan AVs and CAFRs (2009-2014); Public Plans Database (2009); U.S. Census (2009); and Munnell and Quinby (2012).
Marginal Effects
Locally run 0.08
(0.09)
ARC as a percentage of revenue -0.52
(1.01)
Employee contribution rate 0.02
(1.47)
Generosity of benefits -0.46
(0.35)
Constitutional protection -0.20**
(0.09)
Sample Size 139
R-squared 0.04

STATE AND LOCAL PENSION REFORM SINCE THE FINANCIAL CRISIS 11
Board Of Directors
Robert J. O’Neill, ChairExecutive Director, ICMA
Robert P. Schultze, Vice ChairPresident and Chief Executive Officer, ICMA-RC
Eric A. Anderson Retired city manager
Donald J. BorutFormer Executive Director, National League of Cities
Gregory J. DysonChief Operating Officer, ICMA-RC
Jeffrey L. EsserExecutive Director, Government Finance Officers Association
The Honorable William D. EuilleFounder, Principal, and CEO, The Euille Group;
Former Mayor, City of Alexandria, Virginia
Peter A. HarknessFounder and Publisher Emeritus, Governing Magazine
Scott D. PattisonExecutive Director and CEO, National Governors Association
William T. PoundExecutive Director, National Conference of State Legislatures
Antoinette A. SamuelDeputy Executive Director, National League of Cities
Raymond C. Scheppach, PhDProfessor, University of Virginia Frank Batten School of Leadership and Public Policy;
Former Executive Director, National Governors Association
SLGE Staff
Elizabeth K. KellarPresident and CEO
Joshua M. Franzel, PhDVice President, Research
Amber SnowdenCommunications Manager
Bonnie J. FaulkOperations Manager

About the Center for State and Local Government Excellence
The Center for State and Local Government Excellence helps state and local governments become knowledgeable and competi-tive employers so they can attract and retain a talented and committed workforce. The Center identifies best practices and conducts research on competitive employment practices, workforce development, pensions, retiree health security, and financial planning. The Center also brings state and local leaders together with respected researchers and features the latest demo-graphic data on the aging work force, research studies, and news on health care, recruitment, and succession planning on its web site, www.slge.org.The Center’s five research priorities are:
• Retirement plans and savings
• Retiree health care
• Financial education for employees
• Talent strategies and innovative employment practices
• Workforce development
777 N. Capitol Street NE | Suite 500 | Washington DC 20002-4290 | 202 682 6100 | [email protected]
Helping state and local governments become knowledgeable and competitive employers


