State Auditor’s Office Performance Audit Brian Sonntag Washington State Auditor A U D I T O R O F S T A T E W A S H I N G T O N N O V 1 1 , 1 8 8 9 June 6, 2012 Report No. 1007826 K-12 Education Spending
State Auditor’s Offi ce Contacts .............................................................................90
Executive Summary
3
Why did we do this audit?
The Washington State Constitution says it is “the paramount duty of the state to make ample provision for the education of all children residing within its
borders...” To that end, the state spends more than $12 billion annually toward the education of about one million students in 295 public school districts.
The pressure to squeeze maximum value from those dollars has never been greater, as the state faces declining revenue and increasing demands for services. State policy-makers and educators have had to make very diffi cult spending and cost-cutting choices.
Educators, parents, and students would likely agree that teaching or classroom instruction is the most important aspect of education. But non-instructional activities – such as food, transportation, facility management, and other support functions –are important, too. Districts must ensure that their school buildings are clean and conducive to learning, their buses safely transport children, the school kitchens produce nutritious meals, and appropriate student support services are available. But investment in direct classroom instruction is the top priority.
Every 1 percent of money we can shift to the classroom represents about $100 million – that’s enough to pay for more than 1,000 teachers.
This audit analyzed education expenditures by answering the following questions:
1. What percentage of Washington’s educational dollars is spent on classroom instruction, and how does it compare with other states?
2. How do expenditures at individual school districts compare with their peers in Washington?
3. What cost-containment practices are effi cient school districts using to hold down non-instructional costs that other districts could adopt?
Summary of scope and methodology
We compared Washington’s expenditures with other states using the U.S. Department of Education’s National Center for Education Statistics (NCES) data from 2009, the most recent national expenditure data available. To make comparisons between Washington school districts, we used Washington Offi ce of Superintendent of Public Instruction (OSPI) data from the past three school years, 2009 through 2011.
To make those in-state comparisons more meaningful, we used statistical analysis to organize school districts into 37 peer groups with similar characteristics. We analyzed the data for each peer group to help identify the most signifi cant cost-drivers. We also identifi ed districts with non-instructional costs that were lower than expected compared to similar districts, and visited or interviewed staff at 28 of those districts to fi nd out what strategies they used to help control non-instructional costs.
4
What we found
Washington state’s school districts’ classroom spending patterns closely align with national averages. At 60.2 percent, the percentage of education funds spent in Washington’s classrooms is near the national average (61 percent). The state has been steadily closing the gap since 2006, but NCES data suggests there is room for improvement. Spending a higher proportion of education dollars in the classroom can free up more money for teachers and, along with other factors, can have a positive eff ect on student achievement.
We also found that the way OSPI reports the percent of education spending on “teaching” in its annual Report Card overstates that percentage by about 9 percent.
Per-student costs among districts in Washington vary, even among similar districts. We found fairly large variations in costs per student, as well as diff erences in the distribution of costs between instruction and other spending categories. These varying costs refl ect the wide variation in school district characteristics that are generally outside district control, in areas such as enrollment levels, poverty, and location. However, costs also can vary because of operating decisions districts make.
Opportunities exist for controlling costs outside the classroom. For example, districts that spent less than expected compared to their peers tended to have fewer support or administrative staff per 100 students. Districts reported using a variety of practices to help control costs outside of the classroom, ranging from adjusting class schedules, which can improve the effi ciency of bus use, to using central kitchens.
Assigning school districts to peer groups makes it easier to make meaningful comparisons. We created ”profi les” showing cost and student achievement results information for each district, and compared that information to its peer group. These profi les are available on the SAO website at http://www.sao.wa.gov/EN/Audits/PerformanceAudit/Pages/PerformanceAudit.aspx. They provide useful information to school districts, citizens, and government offi cials. An example of a profi le follows.
See Appendix B for a discussion of the peer group development, and Appendix C for an explanation of the profi les.
• Executive Summary • K-12 Education Spending •
5
• Executive Summary • K-12 Education Spending •
6
• Executive Summary • K-12 Education Spending •
Recommendations
1. School districts should evaluate their non-instructional spending by comparing
themselves to their peers and look for additional opportunities to free up more
money for the classroom.
By comparing themselves to districts with similar characteristics, Washington’s school districts can identify areas in which costs appear out of line with peers or certain benchmarks. Our district profi les and peer group analyses are intended to give decision-makers useful and meaningful tools to help them fi nd opportunities for cost-containment practices that will work for their district. These tools also promote transparency about how districts spend money. By providing data in a user-friendly way, we hope to help inform the discussions and decisions about state education fi nancing.
2. OSPI should change the way it reports on the percentage of education dollars
Washington school districts spend on teaching in its annual Report Card.
For 2011, OSPI’s Report Card showed the percent spent on “teaching” was 70 percent. However, OSPI reported in its annual Financial Summary Report that school districts actually spent 61.5 percent of their education dollars on teaching expenditures that year. The rest was spent on what OSPI refers to as “teaching support services,” such as the costs for curriculum development, student safety, counselors, and nurses. Those support services are not what most people think of when they see the word “teaching.” Reporting “teaching” separately from “teaching support services” in the annual Report Card will provide a more accurate picture for policymakers, school boards, and members of the public, and will be more consistent with how OSPI shows teaching and teaching support services in its report.
3. OSPI should maintain the database that we prepared to create the district profi les.
By providing school districts with readily accessible, on-going information they will be able to compare their operating costs and other performance measures with their peers. In doing so, OSPI should make the same adjustments we made to align certain district costs more closely with their spending categories (see Appendix B). Because those adjustments generally match the reporting categories NCES uses, those adjustments also make comparisons with the data NCES publishes more consistent.
What’s next?
We conducted this performance audit under the authority of the state’s performance audit law, which was enacted in 2005 through a statewide citizen initiative. The Joint Legislative Audit and Review Committee (JLARC) and other legislative committees whose members wish to consider fi ndings and recommendations on specifi c issues review all of our I-900 state government audits and assessments.
Representatives of the State Auditor’s Offi ce will report on this performance audit to JLARC’s Initiative 900 Subcommittee in Olympia. Please check the JLARC website (www.leg.wa.gov/JLARC) for the exact date, time and location. The public will have the opportunity to comment at this meeting.
The state’s 295 school districts and OSPI have the responsibility to decide whether to accept our recommendations. The State Auditor’s Offi ce conducts periodic follow-up evaluations to assess the status of recommendations and may conduct follow-up audits at its discretion.
Introduction
7
Overview
As budget constraints continue to squeeze school district fi nances, it is increasingly important to know how effi ciently school districts are operating.
The public expects school districts to be good stewards of public funds. Districts that apply successful cost-saving techniques to non-instructional activities can use those savings to help maintain or increase spending levels in the classroom.
Analyses done in other states found a wide range of diff erences in the amount and distribution of school spending, even among similar school districts. In addition, auditors in Arizona found that the percent spent in the classroom had a positive eff ect on student achievement. To assess these eff ects in Washington, and to identify cost-saving practices that could free up money for classroom instruction, this audit answers the following questions:
1. What percentage of Washington’s educational dollars is spent on
classroom instruction, and how does it compare with other states?
2. How do expenditures at individual school districts compare with their
peers in Washington?
3. What cost-containment practices are effi cient school districts using to
hold down non-instructional costs that other districts could adopt?
Audit Scope and Methodology
The National Center for Education Statistics (NCES) is a division of the U. S. Department of Education that collects school district data nationally. The adjustments NCES applies to all states’ data make it one of the most reliable resources when states compare themselves to one another. We used 2009 NCES data for national comparisons because it is the latest and only national comparative data available. For in-state, district-to-district comparisons, we used 2011 fi nancial data supplied by school districts to the state’s Offi ce of the Superintendent of Public Instruction (OSPI). In reporting on the 2011 data, we made some adjustments to the way OSPI categorizes expenditures to align costs with their applicable spending category. Appendix B explains the adjustments.
To make meaningful comparisons between districts in Washington, we used statistical analysis to organize school districts into 37 peer groups. Districts in these groups were similar in areas such as enrollment, income level, location, and whether they have a high school. On a per-student basis, we analyzed the data available for each peer group – including costs, staffi ng levels, number of meals served, number of buses used, square feet of space, etc. – to help identify the most signifi cant cost-drivers.
We also interviewed 28 districts with lower-than-expected costs compared to their peers to fi nd out what practices they used to help control non-instructional costs. Those districts were: Arlington, Bridgeport, Centralia, Cheney, Conway, Entiat, Ephrata, Evergreen (Clark), Granger, Hockinson, Inchelium, Kelso, Kent, Mead, Mukilteo, North Thurston, Pasco, Prosser, Richland, Satsop, Seattle, Skamania, Sprague, Steilacoom, Sumner, Wenatchee, Yakima, and Zillah.
8
We developed an interactive database that provides spending and student achievement data for every school district in the state. School administrators, citizens, and government offi cials can compare per-student costs at any school district to others in its peer group. This database can be accessed on our website www.sao.wa.gov/EN/Audits/PerformanceAudit/Pages/PerformanceAudit.aspx.
We conducted the audit under the authority of state law (RCW 43.09.470), approved as Initiative 900 by Washington voters in 2005, and in accordance with generally accepted government auditing standards, prescribed by the U.S. Government Accountability Offi ce. Those standards require that we plan and perform the audit to obtain suffi cient, appropriate evidence to provide a reasonable basis for our fi ndings and conclusions based on our audit objectives. We believe the evidence obtained provides a reasonable basis for our fi ndings and conclusions based on our audit objectives.
Appendix A describes the provisions of Initiative 900 and how the audit addressed these provisions.
Appendix B provides more detail on our scope and methodology.
• Introduction • K-12 Education Spending •
Background
9
The state constitution identifi es educating children from kindergarten through grade 12 as the state’s “paramount duty.” The Legislature (in RCW 28A.320.015)
has granted school boards “broad discretionary power” to spend state and local funds as they see fi t, as long as the expenditures are not in confl ict with other state laws. In addition to providing instruction, school districts must provide support services, including districtwide and school building administration; student support such as counselors and nurses; instructional staff support such as curriculum development; food services; transportation; maintenance and operations; and other support services. The state’s 295 school districts employ more than 100,000 people and serve more than one million students.
School districts’ characteristics varied considerably in 2011. For example:
• Enrollment ranged from 10 to 45,143 students.
• The number of students eligible for either reduced-price or free lunch ranged from none to all.
• Districts ranged from 5 to 1,916 square miles in geographic area.
• Property value per pupil ranged from $20,000 to over $12 million.
• Per-pupil general fund expenditures ranged from $6,469 to $47,835.
K-12 education is Washington state’s single biggest budget item
In the last three budget cycles, public school education has consumed just over 40 percent of Washington’s general fund budget. Total K-12 education spending for the 2011 school year was $12.6 billion, including $9.9 billion in general fund money provided by the state and federal governments and locally-raised levies. This amount excludes construction spending and bond debt.
The state’s general fund provided about 65 percent of districts’ revenues in 2011. School districts may raise additional money through local levies, although that amount is capped. Districts also receive federal funding, mostly for special needs students, such as remedial learning (Title 1, No Child Left Behind), special education, and free or reduced-price meals.
Exhibit 1 shows education spending has increased over the past three years, from $9.2 billion in 2008 to $9.9 billion in 2011. However, the state’s contribution has decreased, from $6.6 billion in 2008 to $6.4 billion in 2011. As a proportion of total contributions to districts’ revenues, the state’s share dropped from 71 percent of districts’ total revenues in 2008 to 65 percent in 2011. From 2009 through 2011, federal stimulus funds temporarily replaced some of the state’s contributions, but the locally raised portion of funding also increased, from $1.8 billion in 2008 to $2.2 billion in 2011. Stimulus funding expires on September 30, 2012, which will put further pressure on the state and its school districts to fund education.
10
State funding for school districts is primarily determined by a formula that includes enrollment and the average education and experience of each district’s teachers. Additional funding is provided for the higher instructional costs associated with the Learning Assistance Program, special education, bilingual, and highly capable students programs. Funding formulas also address non-instructional spending categories such as student transportation and school lunch programs. The state provides a small amount of funding to nine Educational Service Districts (ESDs). ESDs are intermediary agencies between OSPI and school districts; they receive most of their funding through fees charged to the school districts for the specialized services they provide.
The Superintendent of Public Instruction plays a supervisory role in K-12
education funding
The state constitution grants the Superintendent of Public Instruction, an elected offi cial, a supervisory role over public education from kindergarten through grade 12. The Offi ce of the Superintendent of Public Instruction (OSPI) receives funding through legislative appropriations, federal and private grants, and sales of timber from state lands. The agency retains a percentage of state funds for administration costs and to operate the State Board of Education; it acts as a pass-through agency providing funding to the state’s 295 school districts. Although OSPI’s role in state education funding is primarily advisory, it is responsible for establishing binding conditions on school districts facing fi nancial diffi culties.
• Background • K-12 Education Spending •
Exhibit 1 K-12 Revenues by Source 2008-2011, dollars in billions
Source 2008 2009 2010 2011
State $6.6 71% $6.6 67% $6.5 66% $6.4 64%
Local $1.8 20% $1.9 19% $2.0 20% $2.2 22%
Federal $0.8 9% $1.3 13% $1.3 13% $1.3 13%
Other $<0.1 <1% $<0.1 <1% $0.1 1% $0.1 1%
Total $9.2 100% $9.9 100% $9.9 100% $10.0 100%
Source: OSPI.
Audit Results
11
Issue 1: Washington school districts spend about the same percentage of dollars on classroom instruction as their
counterparts in other states, but have room for improvement.
This section of the report answers the questions: What percentage of Washington’s educational dollars is spent on classroom instruction, and how does it compare with other states?
To compare Washington’s classroom expenditures with other states, we used data published by the U.S. Department of Education’s National Center for Education Statistics (NCES). NCES publishes the data states submit, but only after making adjustments to put the data into comparable spending categories. Data for 2009 was the most recent available.
In reviewing and analyzing NCES data on state expenditures, we found the following:
A. Washington spent nearly the same percentage on classroom instruction
as the national average in 2009, but many states spent more.
B. OSPI’s annual Report Card overstates the amount Washington school
districts spend on teaching by about nine percent.
Our fi ndings in these two areas are discussed in more detail below.
A. Although Washington spent nearly the same percentage on
classroom instruction as the national average, 18 states spent
from 1 percent to 8 percent more.
NCES data show Washington school districts spent 60.2 percent of every dollar in the classroom, compared to the national average of 61 percent. Exhibit 2 on the following page shows that Washington was one of 12 states spending about 60 percent of its education dollars in the classroom. The exhibit also shows 18 states spent a higher percentage of education dollars on classroom instruction than Washington.
Using percent spent in the
classroom as the best metric for
state-to-state comparisons
In 2009, the most recent year for which national K-12 spending information is available, NCES data show that Washington school districts spent an average of about $9,700 per student, compared with a national average of about $10,600. However, it is diffi cult to make meaningful comparisons between states on the basis of the amount spent per student because living costs and other factors vary widely. As a result, we focused our analyses on the percentage of states’ K-12 education dollars that were spent inside and outside the classroom. Th is is a more relevant benchmark for comparisons between states.
12
• Results • K-12 Education Spending •
69%
65%
64%
63%
62%
61%
60%
59%
58%
57%
56%
New York
Massachusetts, Minnesota, Nebraska, Utah
New Hampshire
Georgia, North Carolina, Tennessee
Connecticut, Hawaii, Maryland, Vermont
Delaware, Idaho, Iowa, Virginia, Wisconsin
Arizona, California, Florida, Kansas, Maine, Missouri, Montana, Pennsylvania, Rhode Island, Texas, Washington, West Virginia
Illinois, Kentucky, Mississippi, Nevada, New Jersey, Wyoming
Alabama, Arkansas, Colorado, Indiana, Louisiana, New Mexico,North Dakota, Oregon, South Carolina, South Dakota
Michigan, Ohio, Oklahoma
Alaska
Exhibit 2Percentage of total education dollars spent in the classroom by state in 2009
Source: National Center for Education Statistics.
Although Washington’s spending in the classroom was slightly below the
national average in 2009, that percentage has been increasing—and the gap has been closing—since 2006. Exhibit 3 shows that, as Washington’s percentage spent in the classroom has been increasing, the national average has held relatively steady.
2005 2006 2007 2008 2009
Exhibit 3Comparing the percent of Washington’s total education
dollars spent on instruction to the US average
60.2%
61%
59.5%59.4%59.2%59.5%
60.8%61%61%61.1%
United States Average
Washington State
Source: National Center for Education Statistics.
13
• Results • K-12 Education Spending •
Washington’s non-instructional spending also closely aligns with other states. As with instructional expenditures, the distribution of spending on non-instructional activities in Washington was similar to national averages in 2009. This information is summarized in Exhibit 4. For an explanation of the activities included in spending categories, see Appendix G.
Reallocating money to the classroom can make a diff erence. The portion of education dollars spent in the classroom is important. Studies in some other states found that a higher proportion of education dollars going to the classroom had a positive eff ect on student achievement. Other factors can play a signifi cant role, including how districts use the money they spend in the classroom. Nonetheless, every 1 percent of general fund revenue Washington is able to shift from non-instruction to classroom spending frees up $100 million, which could be used to hire more than 1,000 teachers.
Exhibit 4 Washington’s non-instructional spending in
2009 was close to the U. S. average
Spending categories Washington US average
Instruction 60.2% 61.0%
Non-instruction:
Student support
39.8%
6.6%
39.0%
5.4%
Instruction support 4.5% 4.8%
General administration 1.9% 2.0%
School administration 5.8% 5.6%
Operations 8.9% 9.8%
Transportation 3.9% 4.2%
Other services 3.7% 3.2%
Food services 3.3% 3.8%
Enterprise operations 1.2% 0.2%
Source: National Center for Education Statistics, 2009.
14
• Results • K-12 Education Spending •
B. OSPI’s annual Report Card overstates the amount Washington school
districts spend on teaching
As noted earlier, NCES data shows that Washington spent 60.2 percent of its education dollars on classroom instruction in 2009. OSPI’s annual Report Card for that year shows that it spent nearly 70 percent on “teaching.”
In its Financial Reporting Summary, OSPI separately reports expenditures related to teaching (classroom instruction) and activities it categorizes as teaching support (curriculum development, student safety, nurses, counselors, etc.). For 2009, those fi gures were:
• Teaching - 61.4 percent
• Teaching support - 8.6 percent1
In its annual Report Card, however, OSPI combines those two categories and reports them under the heading “teaching.” Because the combined fi gure includes spending for nurses, counselors, student safety, and the like, it overstates the percentage of Washington’s education dollars that is spent in the classroom. Reporting both categories under “teaching” can also confuse policymakers, school offi cials, and board members, and the general public, should they try to compare OSPI’s annual Report Card fi gures on classroom spending to those reported by NCES.
1 These percentages are higher than NCES because NCES eliminates some expenses that would result in double counting.
15
• Results • K-12 Education Spending •
Issue 2: School district spending patterns vary signifi cantly, even among similar districts
This section of the report answers the question: How do expenditures at individual school districts compare with their peers in Washington?
To compare Washington school districts to each other, we used the 2011 data school districts reported to OSPI. To make meaningful comparisons between those districts, we used statistical analysis to organize them into peer groups that shared similar characteristics in four areas: enrollment, income level, location, and whether the district has a high school. These four areas account for more than 75 percent of the diff erences between districts in their non-instructional expenditures. Student enrollment and free or reduced-price meals are also key components of the state’s education funding formulas.
We assigned school districts into 37 peer groups, each containing between four and 13 districts.
Costs per student vary signifi cantly, even among similar Washington school
districts. We found notable diff erences in per-pupil costs even among similar districts. The diff erences were greatest within peer groups of small districts because of the signifi cant eff ect enrollment has on expenditures per student. The cost per student is highest for school districts with the lowest enrollments, where fi xed costs (such as insurance and utilities) are spread over fewer students.
Even within peer groups of large districts, per-pupil costs varied. Exhibit 5 illustrates the ranges in per-pupil costs for a peer group of large districts, all with more than 10,000 students and moderate levels of poverty.
Exhibit 5
Cost per student: Averages and ranges for Peer Group 34(Group contains 9 districts)
Peer Group characteristics Average Range
Enrollment (FTE) 14,883 10,334-20,832
Free and reduced-price meal eligibility 35% 29%-39%
Districts with/without high school All have high schools
Total expenditures per student $9,402 $8,894-$10,005
Teaching (instruction) expenditures per student. This amount as a percentage of the total.
$5,74861%
$5,325-$6,28859%-64%
All non-instructional spending categories Average Range
Instructional support $414 $330-$520
Student support $718 $551-$914
Central administration $59 $27-$81
Building administration $554 $502-$644
Other support services $349 $260-$460
Maintenance and operations $866 $760-$1,163
Transportation $408 $293-$584
Food Service $285 $234-340
Source: School districts 2011 F196 fi nancial reports on record at OSPI. Group includes Battle Ground, Bellingham, Bethel, Central Kitsap, Edmonds, Everett, North Thurston, Puyallup, and Richland districts.
16
• Results • K-12 Education Spending •
Within this peer group:
• Total expenditures per student ranged from $8,894 to $10,005.
• The portion spent on classroom instruction ranged from 59 percent to 64 percent.
• Costs varied across all non-instructional spending categories.
Appendix F shows comparative spending information for all 37 peer groups.
Appendix B shows the adjustments we made in reporting on school district expenditures for 2011 and how OSPI reports on them in its Financial Reporting Summary. For example, instead of reporting costs related to food, maintenance, and transportation supervisors under “central administration,” we reported them under the applicable spending category (e.g., food services). These adjustments allowed us to put staff and associated costs in with the programs they manage, and in many cases matched how NCES reports school district expenditures.
Finally, we developed an interactive database to make “profi les” of each district available on our website. These profi les include district demographics, student achievement data, and expenditure data. They also include peer group averages and state averages for each of the expenditure and achievement measures. District offi cials can use these profi les to compare their operating costs with their peers. The interactive website is available on our website at: www.sao.wa.gov/EN/Audits/
PerformanceAudit/Pages/PerformanceAudit.aspx. A sample of the full-page profi le is presented on page 5 of the Executive Summary.
17
• Results • K-12 Education Spending •
Issue 3: Districts have opportunities for controlling costs outside the classroom
This section of the report answers the question: What cost-containment practices are effi cient school districts using to hold down non-instructional costs that other districts could adopt?
To identify non-instructional cost-saving strategies, we analyzed school district-level data to determine the most signifi cant cost-drivers. We also interviewed or visited local offi cials from 28 school districts to fi nd out what they were actually doing to help control costs outside of the classroom. In doing so, we found the following:
A. Districts that spent less than expected compared to their peers
tended to share certain characteristics.
B. School districts we selected to interview reported using a variety
of practices to reduce non-instructional costs in ways that can free up
dollars for the classroom.
Appendix B describes the methods we used to select those districts. We did not select any districts with more than 10 percent of the student population enrolled in ALE programs, which are listed in Appendix D.2
A. Districts that spent less than expected compared to their peers tended
to share certain characteristics.
Some costs are generally outside a district’s control, such as enrollment, location, number of special education students, and the age of their buildings. Such factors tend to increase costs per student.
Districts can control other factors. District expenditures will vary depending upon the operational decisions they each make, such as contracting out student transportation or food services, sharing staff or space with other districts, and closing under-used buildings. These are the areas where districts have the best opportunities for identifying cost savings.
Our analyses identifi ed the major factors that appeared to contribute to districts spending less than expected compared to their peers. In general, we found that these districts tended to:
• Have fewer staff per 100 students.
• Pay less in salaries and benefi ts per student – possibly because they have less experienced staff or a diff erent mix of staff .
• Spend less per student on utilities – possibly because their buildings are newer or they have less space per student.
• Pay less per student for food, or charge fees that cover their food costs.
• Use fewer buses to transport their students, often because they have smaller geographic areas or are in urban areas.
2 These percentages are higher than NCES because NCES eliminates some expenses that
would result in double counting.
18
• Results • K-12 Education Spending •
In general, staffi ng levels – the number of staff per 100 students – explained much of the diff erence in cost per student between districts. Thus, optimizing staffi ng levels may off er districts an opportunity to reallocate dollars to the classroom. Districts can use the peer group data provided in the district profi les to help determine how their staffi ng levels compare to similar-sized districts.
Exhibits 6-12 on the following pages (pages 19-25) summarize the results of our analyses by each major non-instructional spending category. They show activities associated with the category and the category’s primary cost-drivers, and are based on data from all districts in the state for the 2010-2011 school year. The cost-containment examples in each spending category are derived from interviews with Washington school districts and our reviews of similar audits conducted in other states.
19
• Results • K-12 Education Spending •
Exhibit 6
Administration Costs - 2011 school year$681.7 million in staff and operating costs associated with the
School Board, Superintendent and School Principals.
Administration includes these activities (shown as a
percentage of the activity’s cost)
Central Administration
72% - Superintendent’s Offi ce, including Assistant Superintendents (Activity code 12)28% - School Board Directors (Activity code 11) Building Administration
100% - Principal’s Offi ce: Duties assigned to the principal, assistant or vice principal, and their secretarial/clerical assistants, to coordinate and manage the operation of a school unit (Activity code 23)Most spending in Administration is in:
Central Administration
66% - Salaries and benefi ts30% - Contractual services Building Administration
97% - Salaries and benefi tsDistricts that spent less per student on central
administration tended to:
• Have fewer staff per 100 students.Districts that spent less per student on building
administration tended to (in order of signifi cance):
• Have fewer staff per 100 students. However, in smaller districts, the staff who conducts these duties may be coded elsewhere.
• Pay less in salaries and benefi ts.
Examples of things districts could do to reduce
administration costs
Reduce staffi ng costs
• Combine administrative positions to be conducted by fewer people.
• Hire multi-skilled staff or cross-train existing staff .• Limit the number of Assistant Superintendents and/
or Principals• Share staff with other districts or across school
buildings• Partner with a neighboring district or schools
to share Superintendent, Principals, and/or administrative staff .
Other
• Monitor and control administrative travel and reimbursements for the school board directors.
• Implement legal service policies and procedures to reduce the need for legal counsel services.
• Eliminate most paper copies of policies and procedures by distributing them on the district web site.
• Use e-mail rather than paper to communicate with parents.
Spending amounts and enrollments are based on the 2011 school year for all 295 school districts.
20
• Results • K-12 Education Spending •
Exhibit 7
Other Support Costs - 2011 school year$362.5 million in staff and operating costs that provide business services for the district
including accounting, human resources and information technology.
Other support includes these activities (shown as a
percentage of the activity’s cost)
38% - Information systems, database development, maintenance, processing and storage of data (Activity code 72)32% - Business offi ce budgeting, accounting and business administration (Activity code 13)19% - Human resources and personnel services (Activity code 14)4% - Public relations, preparing information for parents, students, staff and the general public (Activity code15)4% - Warehouse operations and distribution of supplies and mail (Activity code 74)3% - Printing (Activity code 73)Most spending in other support is for:
71% - Salaries and benefi ts22% - Contractual servicesDistricts that spent less per student on other support
tended to (in order of signifi cance):
• Have fewer students eligible for free or reduced-price lunch.
• Have fewer other support staff per 100 students.• Purchase fewer contracted services
Examples of things districts could do to reduce other
support costs
Reduce staffi ng costs• Combine administrative positions to be performed
by fewer individuals. • Hire multi-skilled staff or cross-train existing staff . • Contract with a local educational service district for
some support services.• Centralize shipping and receiving to help reduce
staffi ng levels.• Share staff with other districts• Partner with other districts or entities to share staff .Reduce IT costs• Centralize or reduce the number of printers
per school. • Require the use of laser printers instead of ink jets. • Buy or lease slower copier machines. • Use state contract for copier leases/purchases. • Use soft ware to shut down all computers at
predetermined time in the evening. Reduce purchasing costs• Use purchasing co-ops to obtain volume discounts. • Implement purchase cards to reduce payment
processing and to obtain rebates. Other• Establish expectations and measures of cost per
student and student-to-staff ratios. • Apply for E-Rate discounts to reduce
telecommunications and Internet costs. • Use smart boards and document cameras to reduce
paper costs.
Other Support
Average spending per student by object
Object Per student % of total
Salaries $197 54%Benefi ts $63 17%
Supplies & Materials $80 22%
Other $22 7%Total $362 100%
Other support costs per student
vs. staff per 100 studentsCost per student
Other support staff per 100 students
$2,000
$4,000
$6,000
0 1 2 3 4 5
0
Spending amounts and enrollments are based on the 2011 school year for all 295 school districts.
21
• Results • K-12 Education Spending •
Exhibit 8
Student Support Costs - 2011 school year$672 million in staff and operating costs outside the classroom that: help students plan future career paths;
provide student safety; and promote student wellness through physical and mental health services.
Student support includes these activities (shown as a
percentage of the activity’s cost):
51% - Health services including school nurses, occupational and physical therapists, language pathologists and their assistants (Activity code 26) 36% - Guidance and counseling including services provided by social workers, registrars, and clerks (Activity code 24) 13% - Pupil management and safety including security and crossing guards and playground aides (Activity code 25)Most spending in student support is in:
91% - Salaries and benefi ts Districts that spent less per student on student
support compared with their peers tended to
(in order of signifi cance):• Have fewer student support staff per 100 students.
However, in smaller districts the employees who conduct these duties may be coded elsewhere.
• Pay less for salaries and benefi ts.
Examples of cost containment strategies to reduce
student support costs
Reduce staffi ng costs
• Combine administrative positions to be performed by fewer people.
• Hire multi-skilled staff or cross-train existing staff . • Hire Licensed Practical Nurses rather than
Registered Nurses to staff school infi rmaries. • Share staff with other districts• Partner with a neighboring district to share staff
such as nurses, social workers, counselors.Other
• Establish expectations and measures of cost-per-student and student-to-staff ratios.
• Reduce the number of non-essential services provided to students.
Student Support
Average spending per student by object
Object Per student % of total
Salaries $459 68%Benefi ts $151 23%
Contractual services $53 8%
Other $9 1%Total $672 100%
Student support costs per student
vs. staff per 100 studentsCost per student
Student support staff per 100 students
$1,000
$2,000
$3,000
$4,000
0 1 2 3 4 50
Spending amounts and enrollments are based on the 2011 school year for all 295 school districts.
22
• Results • K-12 Education Spending •
Exhibit 9
Instructional Support Costs - 2011 school year$388 million in staff and operating costs associated with providing supervision, coordination, evaluation, and
development in instruction, curriculum, instructional materials and student services programs.
Instructional support includes these activities (shown
as a percentage of the activity’s cost)
59% - Supervisors providing leadership for instructional programs (Activity code 21)41% - Learning resources and educational materials including audio-visual resources (Activity code 22)Most spending in instructional support is in:
90% - Salaries and benefi ts Districts that spent less per student on instructional
staff support tended to (in order of signifi cance):
• Have fewer instructional support staff per 100 students. However, in smaller districts the employees who conduct these functions may be coded elsewhere.
• Pay lower salaries and benefi ts to instructional support staff .
Examples of things districts could do to reduce
instructional support costs
Reduce staffi ng costs
• Combine administrative positions to be performed by fewer people.
• Hire multi-skilled staff or cross-train existing staff . • Reassign certifi cated librarians to classrooms
and replace them in the library with para-professional staff .
• Share staff with other districts/buildings • Share instructional support staff across buildings
and other districts when possible. Other
• Establish expectations and measures of cost-per-student and student-to-staff ratios.
• Use teachers for professional development training. • Use the K-20 Network for professional development
Spending amounts and enrollments are based on the 2011 school year for all 295 school districts.
23
• Results • K-12 Education Spending •
Exhibit 10
Food Service Costs - 2011 school year$338.6 million in staff and activities that provide student meals.
We measured food service effi ciency by looking at the price charged per average meal compared to the actual cost per average meal. This measures the districts’ ability to cover the cost of the food program.
Food services includes these activities (shown as a
percentage of the activity’s cost)
52% - Operational costs of preparing and serving meals including cooks and cashiers (Activity code 44%)41% - Food including processing, delivery and storage (Activity code 42) 8% - Supervision and management of food services (Activity code 41) -1% - Transfers to other programs (Activity code 49)Most spending in food services is on:
45% - Salaries and benefi ts41% - FoodDistricts that spent less on food services tended to (in
order of signifi cance):
• Have fewer staff per 100,000 meals served.• Charge more for meals. It is very important that
districts charge enough to cover the cost of the food program.
• Provide meals with a lower food cost• Serve more lunches. Th is points to an economy of
scale: as more meals are prepared, the fi xed costs (staff and overhead) are spread over more meals. However the district must be pricing meals above cost.
Examples of things districts could do to reduce food
service costs
Price meals to cover the costs of the food program
• Ensure the program is charged with its share of overhead costs.
• Reduce staffi ng costs• Establish expectations and measures of staff per meal
equivalent.• Change the menu to be less labor intensive.• Share personnel with transportation or maintenance
to reduce costs.• Hire multi-skilled staff or cross-train existing staff . • Use centralized kitchens to reduce the number of
kitchen staff needed.Reduce food costs
• Join purchasing co-ops to receive quantity discounts. • Maximize use of USDA commodities. • Monitor daily production records to help eliminate
over-production.• Establish expectations and measures of cost per meal
equivalent.• Create food service cooperatives with other districts. • Purchase prepared foods from Correctional
Industries.Other
• Evaluate if eligible for USDA alternative meal counting methods.
• Maximize free or reduced price lunch participation. • Centralize free or reduced price lunch application
process.
Food Services
Average spending per student by object
Object Per student % of total
Salaries $100 30%Benefi ts $50 15%
Supplies & materials $144 43%
Other $44 12%Total $338 100%
Food service revenue/expenditure
ratio vs. staffingRevenue/expenditure ratio
Staff per 100,000 equivalent meals
0%20%40%60%80%
100%120%140%
0 2 4 6 8 10 12 14 16
Spending amounts and enrollments are based on the 2011 school year for all 295 school districts.
24
• Results • K-12 Education Spending •
Exhibit 11
Transportation Costs - 2011 school year$400 million in staff and operations that provide transportation to and from
school for more than 419,000 students.
We used cost per rider as the primary measure of effi ciency in transportation.
Transportation includes these activities (shown as a
percentage of the activity’s cost):
84% - Operations including vehicle fuel, bus drivers, and payments to fi rms for transporting students (Activity code 52)13% - Maintenance for vehicles such as labor and parts for repairs and upkeep (Activity code 53)10% - Supervision, managing, and directing the transportation program, including dispatching and clerical support (Activity code 51)2% - Insurance (Activity code 56)-7% - Transfers of costs to other programs (Activity code 59). Most spending in transportation is in:
69% - Salaries and benefi ts 22% - Contracted service Districts that spent less per rider in transportation
tended to (in order of signifi cance):
• Use fewer drivers to transport 100 students. • Use fewer buses to transport 100 students. • Spend less on fuel. Other items of interest
• Overall, membership in a transportation co-op had no measurable eff ect on cost per rider.
Examples of things districts could do to reduce
transportation costs
Reduce the number of required buses and drivers
• Arrange bell schedules to minimize the number of buses needed to transport students.
• Keep ridership high on each bus.Schedule routes effi ciently
• Plan the most direct (effi cient) routes to transport students to and from school.
• Use computerized soft ware to plan routes. • Pick up basic program students from central
locations. • Combine students from diff erent schools and grades
on the same buses if they travel the same route.Reduce fuel costs
• Buy fuel in bulk.• Fuel buses on-site at night with a fueling truck.• Have a no-idling policy and install GPS to monitor
compliance with set routes. Other
• Establish expectations and measures for program performance and cost.
• Purchase good used vehicles rather than new if available.
• Provide vehicle maintenance for other municipalities.
• Work with other districts to create and maintain transportation cooperatives if cost eff ective.
• Manage the transportation in the central/district offi ce.
Transportation
Average spending per student by object
Object Per student % of total
Salaries $464 48%Benefi ts $202 21%
Supplies & Materials $149 16%
Contract Services $211 22%
Transfers $(67) -7%
Total $959 100%
Transportation costs per rider
vs. buses per 100 ridersCost per rider
Buses per 100 riders
$5,000
$10,000
$15,000
0 10 20 30 40 500
Spending amounts and enrollments are based on the 2011 school year for all 295 school districts.
25
• Results • K-12 Education Spending •
Exhibit 12
Maintenance and Operations Costs - 2011 school year$910 million in staff and activities that clean, maintain and provide security for school
buildings and grounds. This category also includes utility and insurances costs.
Maintenance and operations includes these activities
(shown as a percentage of the activity’s cost)
36% - Operation of buildings, janitors, supplies, and small equipment items (Activity code 63)25% - Utilities (Activity code 65)20% - Maintenance, repair, and upkeep (Activity code 64)7% - Insurance except transportation (Activity code 68) 6% - Grounds maintenance (Activity code 62) 3% - Supervisory personnel and their clerical staff (Activity code 61). 2% - Building and property security (Activity code 67) 1% - Motor pool, staff cars, maintenance vehicles, delivery trucks, and other non-student transportation (Activity code 75) Most spending in operations & maintenance is for:
50% - Salaries and benefi ts 25% - Utilities Districts that spent less per student on maintenance
and operations tended to (in order of signifi cance):
• Have fewer square feet of building space per student.• Spend less on utilities.• Have fewer maintenance and operations staff
per 100 students.
Examples of things districts could do to reduce
maintenance and operations costs
Reduce building space• Rent, sell, or close off any unused building space and
eliminate custodial services for that space. • Share maintenance staff with other departments or
other districts such as transportation.• Negotiate fl exible job titles to allow individuals to fi ll
multiple roles. • Negotiate weekend work schedules to conduct work
when students are not in class. • Purchase equipment that can reduce maintenance time. Reduce utility costs• Conduct an energy audit of district facilities and
regularly monitor energy use. • Automate temperature controls and lighting. • Apply for energy grants. • Run energy savings competition between buildings. • Retrofi t energy-effi cient lighting to save energy. • Stay on top of maintenance needs.• Develop and maintain a long-term preventive
maintenance plan.• Develop an automated system for maintenance
requests. Other• Establish expectations and measures for program
performance and cost.• Purchase custodial supplies in bulk, use district wide. • Evaluate phone system technology and change
if costs can be reduced; eliminate unnecessary phone lines.
• Use state surplus rather than warehousing old items.
Spending amounts and enrollments are based on the 2011 school year for all 295 school districts.
26
• Results • K-12 Education Spending •
B. School districts we selected reported using a variety of practices
to reduce non-instructional costs in ways that can free up dollars for
the classroom
The 28 districts we contacted generally spent less than expected compared to their peers in one or more spending categories, or overall. These districts provided insights into a wide range of cost-containment practices, addressing activities as diverse as employment decisions and food purchasing, computer software and energy effi ciencies. We did not verify any information districts reported to us, but many of the cost-savings strategies they reported appear to be consistent with the results of our analyses of major cost-drivers.
Many districts said they were following a variety of cost-containment practices, such as sharing support staff across buildings, using purchasing co-ops, having centralized kitchens, or outsourcing maintenance activities. Examples are discussed in greater detail below, and are summarized in Exhibits 6-12. Districts across the state may be able to use these and other measures to help achieve savings. Not every measure will work for every district, but each describes cost-containment practices that are worth exploring.
Evaluating staffi ng levels
Salaries and benefi ts account for about 73 percent of school districts’ non-instructional expenditures. Staffi ng levels are the most signifi cant factor explaining the diff erences in cost per student between districts, so controlling staffi ng levels and their associated costs can produce signifi cant savings. For example, Evergreen School District in Clark County reported eliminating about 45 percent of its central offi ce administrative staff since the 2005 school year, including about 22 percent of its basic education classifi ed staff . This helped the district signifi cantly reduce non-instructional costs; these savings were moved to the classroom.
A few districts reported reassigning librarians with teaching certifi cates to the classroom and replacing them in the library with para-professionals. Some districts combined two or more non-instructional positions and hired highly skilled people to fi ll the new role, or cross-trained staff to take on the work of individuals retiring or leaving employment. Centralia School District negotiated innovative work schedules to increase productivity. Districts enrolling more students reported that they chose to manage the extra workload at current staffi ng levels rather than hire more people.
Some of the cost-containment practices districts use aren’t permanent, and will depend on the districts’ individual circumstances. For example, Ephrata went without a Curriculum/Assessment Director for three years, distributing those duties to other staff . However, district offi cials told us they decided they needed to fi ll the position after three years because the reduction was not sustainable.
Achieving operational effi ciencies in food service, transportation, and operations and maintenance often aff ects staffi ng levels. For example, by staggering school start times, a district may need fewer buses – reducing not only fuel and maintenance needs, but also the number of drivers. By upgrading lighting to more energy effi cient, longer-lasting bulbs, districts can reduce maintenance time needed to replace bulbs, potentially freeing maintenance staff to perform other tasks.
Optimizing the value of staff
with teaching certifi cates.
Prosser School District reported saving $261,000 when it reassigned librarians with teaching certifi cates to the classroom and replaced them
with para-professionals.
27
• Results • K-12 Education Spending •
Taking advantage of economies of scale
Districts often can take advantage of economies of scale by joining purchasing and service cooperatives, using state purchasing contracts, or buying materials in bulk. For example, Wenatchee installed a large freezer, which allowed it to safely store and use large quantities of U.S. Department of Agriculture bulk commodities. Centralia purchased paper by the semi-truck load, and reports signifi cantly reducing paper costs district-wide. Mead, Sprague and Satsop school districts reported using Full Option Science System (FOSS) science kits obtained through their Educational Service Districts (ESD). Districts pay a one-time joining fee per teacher, and a nominal annual fee thereafter, to receive kits that are equipped with supplies needed to conduct inquiry-based science lessons and experiments. When the lessons are completed, the kits are returned to the ESD, so schools no longer need to stock every classroom with science equipment.
Pursuing technology savings
As technology has become more prevalent in classrooms, we found many districts exploring cost effi ciencies in this area. Several districts take advantage of the Schools and Libraries Program, commonly called the E-Rate program, which is administered by the Universal Service Administrative Company under the direction of the Federal Communications Commission. This fund off ers discounts to schools and libraries that allow them to obtain aff ordable telecommunications and internet access. In addition to the E-Rate program, districts described using grants to purchase computers and other technology upgrades.
Some districts reported purchasing refurbished computers rather than new. Centralia purchased software that turns its computers off at the same time every evening, and reported saving $40,000 a year on its electric bills.
Print management also off ers potential cost savings. North Thurston installed central printers to save money on energy, ink and paper. The district reported that per-page printing costs dropped from 16 to 7 cents, saving the district $740,000 annually.
Weighing whether to develop in-house expertise or contract for services
Another way districts could reduce costs is through careful decision-making on service requirements, weighing whether to develop in-house expertise or contract for services. When Ephrata’s business manager left, the District decided to contract with the local ESD for services rather than hiring a new manager. It reported saving about $29,700 in the 2011-12 school year. On the other hand, Mead told us it saved $250,000 a year by purchasing a fi nancial and student software system and hiring an expert to manage it. Some districts also reported that contracting food service operations, either in their entirety or for management only, gave them access to food service experts and bulk purchasing, lowering their costs.
Evaluating all technology
options for savings.
Arlington now pays a fl at $600 a month for a private branch exchange (PBX) phone system, as opposed to $26 for each phone line. Th e district says this has saved $70,000 a year.
28
• Results • K-12 Education Spending •
Creating a cost-neutral Food Service Department
School districts’ primary goal within food service is to provide nutritious meals to children. National cost-containment practices suggest that food service programs should support themselves through the money brought in by the sale of food and federal programs. However, we found most Washington districts needed to supplement their food budgets with state or local funds that otherwise could be used in the classroom. In the 2009-10 school year, 226 of 295 districts spent more on food service operations than they took in. However, some districts found effi cient ways to reduce costs, increase quality, and feed children without taking money away from the classroom.
For example, Wenatchee’s food service program produces 5,500 meals a day, but is totally self-supporting. It uses a centralized kitchen, buys food in bulk, and uses U.S. Department of Agriculture food. It has also centralized the processing of free or reduced-price meal applications.
By using the Agriculture Department’s “Provision 2” – an alternative meal-reporting method for low-income areas – Bridgeport School District can provide free meals to all its students. Because all meals are free, daily participation by all students increased. The district saves on the expense of cashiers at meal services, while the administrative burden at the local level is reduced because Provision 2 applications are only fi led every four years.
Transporting children in the most cost-eff ective and effi cient manner
Almost 70 percent of Washington school transportation costs are for salaries and benefi ts. Maximizing the time drivers are busy on the road or at other tasks and minimizing down time are key to producing cost effi ciencies. To do so requires careful planning by the transportation department, but also creative thinking by the district as a whole.
Bus routing software can help by calculating the shortest routes to reduce equipment, fuel, and driver expenses. The Evergreen School District in Clark County uses routing software and GPS as management tools to establish effi cient routes. The district also works closely with its schools and the transportation department to coordinate bell schedules. One bus can run up to four routes to accommodate the high school, middle school, early elementary schedule, and late elementary schedule.
Granger, a smaller district, does not see the need for routing software at this time. Instead, the district reported that it monitors buses, ensuring they are kept as full as possible and adjusting stops when necessary. In addition, Granger’s drivers are employed in other positions within the district: as custodians, maintenance staff , or mechanics. The district reports this process helps retain staff , and reduces the cost of benefi ts by having fewer full-time rather than more part-time employees.
Hiring experienced mechanics benefi ts North Thurston and Centralia. North Thurston reported that it now purchases good quality used buses at a lower price because it has the on-staff experts to maintain them in good condition. Centralia and Chehalis created a cooperative, and provide maintenance for other municipalities in their area. According to Centralia offi cials, this practice has brought in about $500,000 annually for their district.
Being willing to change existing
schedules if doing so off ers
signifi cant savings.
North Th urston reported a savings of $1 million a year aft er staggering
its school start times to eliminate the need for 19 routes and drivers.
Reducing the number of sites
where food is prepared.
By changing to a central kitchen three years ago, Seattle Public Schools
reduced staff and purchased more food in bulk quantities, which has
brought its food service costs down.
29
• Results • K-12 Education Spending •
Finally, some districts make decisions with a wider eff ect on the schools and community. A few districts mentioned shifting from half-day kindergarten to full-day kindergarten that eliminates the mid-day bus run. Evergreen School District in Clark County said this move allowed it to use the $500,000 a year savings in transportation costs to help partially pay for full-day kindergarten.
Maintaining and operating schools
For 2011, more than $900 million of state funds was spent on maintenance and operations, with $455 million, or 50 percent, of the money directed to salaries, benefi ts, and utilities. Many districts are working to become more energy effi cient by applying for grants to fund energy audits, window replacement, and lighting upgrades. Some districts are also fi nding ways to use their staff more effi ciently, cutting labor hours.
Centralia, for example, purchased better maintenance equipment that can cover more space in less time, such as large-capacity lawn mowers and fl oor buff ers. The district’s maintenance director developed a time-saving automated system for maintenance requests, enabling him to assign and track work. The district, in a collective bargaining agreement, negotiated to permit one of the maintenance staff to work Wednesday through Sunday, gaining more undisturbed work hours with no students or teachers on site. To reduce utility costs, Centralia obtained energy effi ciency grants and Bonneville Power Administration rebates, and participates in the E-Rate program which has reduced both telephone and technology expenses.
The common denominator of successful districts: careful consideration of
costs and benefi ts
School district managers are aware that reviewing their costs and understanding the short- and long-term benefi ts of their choices are crucial to achieving cost savings. Individual districts must determine whether it is more cost-eff ective to buy or to lease, more effi cient to buy new, warranted products or purchase and maintain less expensive used equipment. It also takes time and consideration to ensure districts optimize and adhere to replacement schedules for equipment, including buses, computers, and textbooks. District offi cials also stressed the importance of maintaining open communication with unions, departments, and staff when making decisions, as well as soliciting community input when deciding where cuts should be made.
Recommendations
30
1. School districts should evaluate non-instructional spending by comparing
themselves to their peers and look for additional opportunities to free up
more money for the classroom.
All districts can benefi t from examining discretionary spending categories, from looking carefully at what their peer districts are doing, and from actively seeking opportunities to apply the cost-containment practices in this report.
A major purpose of this performance audit was to give decision makers meaningful analysis and useful tools around school expenditure data. One of the fi rst steps toward becoming more effi cient is to identify areas in which costs appear out of line compared with certain benchmarks or comparison groups.
Equally important is the increased transparency about how school districts spend money. Taxpayers, parents, and school board members all have an interest in school funding issues.
Districts have a number of resources to help them manage non-instructional costs.
OSPI collects a wealth of school expenditure information, at the district and school level, that can help inform decision making. Some of this data is available on OPSI’s easily-accessible Report Card website at reportcard.ospi.k12.wa.us/summary.
aspx?year=2010-11. In addition, OSPI and ESDs have on-staff subject matter experts. OSPI recently set up a web page to collect and disseminate best practices in instructional and non-instructional areas and technology. We encourage school districts to use this tool to share experiences and cost-saving ideas.
The National Center for Education Statistics (NCES) (online at www.nces.ed.gov) provides state- and district-level revenue and expenditure data that has been standardized to make state-to-state comparisons meaningful. The most recent expenditure data is from 2009. We used NCES data for our national comparisons, but used the more up-to-date OSPI data for in-state comparisons.
As part of our audit work, we assembled a series of District Profi les and Peer Group Comparison Tables. One of the fi rst steps a school district can take towards identifying cost-containment practices they might emulate is to compare their costs and staffi ng levels to those of similar districts. Appendix F includes tables that provide school district-level expenditure data by peer group. Our online profi les of expenditure and student achievement data are available on our website at www.sao.wa.gov/EN/Audits/PerformanceAudit/Pages/PerformanceAudit.aspx.
We have also developed a bibliography of reports that include cost-containment practices from other states that may be applicable to Washington school districts. This bibliography is included in Appendix H.
31
• Recommendations • K-12 Education Spending •
2. OSPI should change the way it reports on the percentage of education
dollars Washington school districts spend on “teaching” in its annual
Report Card.
OSPI’s 2011 Report Card showed that the percent spent on “teaching” was 70 percent. However, OSPI reported in its annual Financial Summary Report that school districts actually spent 61.5 percent of their education dollars on teaching that year. The rest was spent on what OSPI refers to as “teaching support services,” such as the costs for curriculum development, student safety, counselors, and nurses. Those support services are not what most people think of when they see the word “teaching.” Reporting “teaching” separately from “teaching support services” in the annual Report Card will provide a more accurate picture for policymakers, school boards, and members of the public; it will also be more consistent with how OSPI shows teaching and teaching support services in the summary report.
3. OSPI should maintain the database we prepared to create district profi les.
By providing school districts with readily accessible, on-going information, OSPI can enable districts to compare their operating costs and other performance measures with their peers. In doing so, OSPI should make the same adjustments we made to align certain district costs more closely with their spending categories (see Appendix B). Because those adjustments generally match the reporting categories NCES uses, comparisons with the data NCES publishes will become more consistent.
32
Agency Response
32
33
Appendix A: Initiative 900
33
Initiative 900, approved by Washington voters in 2005 and enacted into state law in 2006, authorized the State Auditor’s Offi ce to conduct independent, comprehensive performance audits of state and local governments.
Specifi cally, the law directs the Auditor’s Offi ce to “review and analyze the economy, effi ciency, and eff ectiveness of the policies, management, fi scal aff airs, and operations of state and local governments, agencies, programs, and accounts.” Performance audits are to be conducted according to U.S. General Accountability Offi ce government auditing standards.
In addition, the law identifi es nine elements that are to be considered within the scope of each performance audit. The State Auditor’s Offi ce evaluates the relevance of all nine elements to each audit. The table below indicates which elements are addressed in the audit. Specifi c issues are discussed in the Results and Recommendations section of this report.
I-900 Element Addressed in the audit
1. Identifi cation of cost savings Yes. The audit identifi ed several actions the districts could take to reduce costs in non-instructional areas.
2. Identifi cation of services that can be reduced or eliminated
No. However, school districts and our national research identifi ed opportunities for non-instructional savings. Also, districts reported eliminating or reducing staff positions in some areas.
3. Identifi cation of programs or services that can be transferred to the private sector
No. Local school board members and administrators must determine whether privatization of particular services could produce cost savings.
4. Analysis of gaps or overlaps in programs or services and recommendations to correct gaps or overlaps
No. However, school districts reported saving money by sharing staff between departments or with other districts.
5. Feasibility of pooling information technology systems within the department
No. The audit did not evaluate individual districts’ information technology systems.
6. Analysis of the roles and functions of the department, and recommendations to change or eliminate departmental roles or functions
No. The audit recommends school district management evaluate their own programs to identify the need for changes.
7. Recommendations for statutory or regulatory changes that may be necessary for the department to properly carry out its functions
No. The audit focused on operational issues and potential savings, not laws or regulations.
8. Analysis of departmental performance, data performance measures, and self-assessment systems
Yes. Auditors developed data-based profi les of individual school districts and the state as a whole to evaluate non-instructional spending.
9. Identifi cation of best practices Yes. The audit identifi ed other states’ cost-containment strategies and additional cost saving practices that could be adopted by local districts to help them reallocate funds to classroom instruction.
3434
Appendix B: Scope and MethodologyThe performance audit objectives were to:
• Compare Washington’s education spending with other states.
• Compare education spending among Washington school districts.
• Identify major non-instructional cost drivers.
• Document how school districts reported they control non-instructional spending.
• Make school district demographic, spending, and achievement data available in a user-friendly format.
To achieve these objectives, we:
• Obtained data from the National Center for Education Statistics (NCES) and the Washington Offi ce of Superintendent of Public Instruction (OSPI).
• Analyzed NCES data to compare Washington education expenditures to other states using data for the most recent fi ve years.
• Compared spending by school districts within the state to identify factors outside school district control that explain most of the variation in per-student spending. We also used these factors to assign school districts to peer groups.
• Used regression analysis to determine cost drivers for each spending category.
• Analyzed OSPI student achievement and expenditure data to identify school districts to contact. Residuals3 from our regression analysis helped identify districts with lower-than-predicted costs. We then interviewed 28 school districts to document strategies they use to control non-instructional costs.
• Developed profi les for each school district using demographic, spending, and achievement data. These profi les were incorporated into an interactive data spreadsheet. The spreadsheet is available on the SAO website.
Data sources for national and district-level comparisons
We used the following data for our analyses: 2009 NCES data for national comparisons; 2009-2011 F196 data supplied by districts and compiled by OSPI for district-level comparisons; and 2010 and 2011 OSPI data for student achievement.
An explanation of our reporting of 2011 data
We made several adjustments in reporting on school district expenditures to the way OSPI reports on them in its Financial Reporting Summary. For example, instead of reporting the costs related to food, maintenance, and transportation supervisors under “central administration,” we reported them under the applicable spending category (e.g., food services). These adjustments allowed us to put the people and their expenses in with the programs they manage, and in many cases matched the way NCES reports school district expenditures. Those adjustments are shown in the table below. Refer to OSPI’s School Accounting Manual for further information on school district fi nancial reporting guidance.
3 In regression analysis, the difference between a predicted valued and the actual value.
35
• Appendix B • K-12 Education Spending •
Comparing the treatment of activity code categorization between OSPI fi nancial reporting and this audit
Expenditure activity
(activity code)
In the OSPI Financial
Reporting Summary,
activity reported as
In this audit report, SAO
reports the activity as Our rationale
“Supervision” of the following programs:
• Instruction (21)• Food Service (41)• Facilities (61)• Transportation (51)
All under Central Administration
Programs related to the specifi c activity:• Instruction Support Staff • Food Service• Maintenance & Operations• Transportation
To match these costs to their specifi c spending categories.
Insurance (not Transportation) (68)Motor Pool (75)
Other Maintenance & Operations
Learning Resources (22) Teaching Support Instructional Support Services To show the diff erences between support activities related to teachers and to students.
Guidance and Counseling (24)Pupil Management & Safety (25)Health Related (26)
All under Teaching Support Student Support Services
Business Offi ce (13)Human Resources (14)Public Relations (15)
All under Central Administration
All under Other Support Services To report costs in a way
that is more comparable to NCES.Information Systems (72)
Printing (73)Warehousing & Distribution (74)
All under Other All under Other Support Services
Source: OSPI Financial Reporting Summary and NCES.
Further, NCES reports expenditures diff erently from OSPI in these ways:
• The NCES spending category enterprise services is not supported by the general fund in Washington. This category accounts for less than one percent of expenditures. We included this category in our state-to-state analysis but did not include it in our in-state analysis.
• NCES makes other minor adjustments to OSPI’s data to standardize reporting across states.
We made the following additional changes to school district-level student enrollment and spending data (see Appendix C for details):
• Accounting and adjusting for missing data in the OSPI data sets.
• Adjusting spending data for districts that participate in transportation cooperatives.
• Adjusting student enrollment numbers for school districts with summer school, Running Start, and state institutions.
36
• Appendix B • K-12 Education Spending •
District-level comparison
We applied regression analysis to identify factors that infl uence non-instructional costs, using district-level expenditure data. We included in the regression analysis data from 2009, 2010, and 2011 for the following factors:
• Full Time Equivalent (FTE) enrollment
• Percent of students eligible for free or reduced-price lunch
• Percent Transitional Bilingual
• Assessed property valuation per pupil
• Percent of students in special education programs
• Presence or absence of a district high school
• Locale (such as urban, rural, etc.), using the NCES defi nition
Enrollment was the most signifi cant predictor of non-instructional costs, while four other factors were also signifi cant across all districts. In descending order of signifi cance, these are percent of students eligible for free or reduced-price lunch, presence or absence of a district high school, transitional bilingual students, and location. These fi ve factors explained around 76 percent of district variation in non-instructional costs per student.
We also wanted to identify districts with lower-than-expected per-pupil costs than estimated by our regression4 model. To do this, we grouped districts to compare non-instructional costs between similar districts.
Identifying peer groups for comparison purposes
We assigned districts to peer groups using their characteristics for enrollment, percent of students eligible for free or reduced price lunches, locale, and whether or not the district has a high school. We split enrollment and free or reduced lunch values into manageable categories, then performed a binary cluster analysis5 on the included factors. The initial analysis sorted the 295 school districts into 21 peer groups. We used this set of peer groups to identify districts for interviews.
As our audit was under way, OSPI made available its 2011 data, so we refi ned the peer grouping using new data, which resulted in a fi nal set of 37 groups.
Correlation analysis of 2011 data
We performed a correlation analysis to identify major cost drivers that cause variation in non-instructional spending per student between districts using the 2011 data.
We analyzed this data using eight non-instructional spending categories defi ned by NCES to identify factors that infl uence non-instructional costs for Washington school districts. We identifi ed the major cost drivers for each of the eight categories and used these results to update our reporting. We also used these results to create one-page spending category summaries, illustrated on pages 19-25.
4 A statistical tool we used to explore the relationship between districts’ non-instructional per student spending and demographic and geographic characteristics that infl uence their spending.5 Cluster analysis is a statistical tool we used to group school districts that are similar on several characteristics thatinfl uence per student spending.6 Correlation analyses is a statistical tool we used to indicate the strength and direction of an association between districts’ per student spending and each measure of effi cient spending.
37
• Appendix B • K-12 Education Spending •
Selecting school districts for interviews
We conducted a three-phase analysis to identify effi cient districts. First, we organized districts into peer groups using regression analysis as described earlier, and compared them within those groups. Second, we evaluated districts by functional area, looking at transportation, food service, administration, support services, and operations and maintenance. Third, we analyzed expenditure data and achievement scores to identify school districts with both lower-than-expected non-instructional costs and higher-than-expected student achievement.
We chose 28 school districts to interview by phone, on site, or both. Through a series of open-ended questions we invited district managers to tell us about the cost-containment practices they had put in place to generate effi ciencies.
3838
Appendix C: School District Data Profi lesWe recognized that our audit data would be most benefi cial if it was readily accessible to school districts and other interested parties. As a result, we produced a data profi le for each school district and developed an interactive website to display these profi les to users, school districts, and the public. We surveyed school districts to refi ne and fi nalize an interactive district profi les spreadsheet. These interactive profi les are available on our website www.sao.wa.gov/EN/Audits/PerformanceAudit/Pages/PerformanceAudit.aspx.
Interactive spreadsheet
We designed the interactive data profi les spreadsheet in Microsoft Excel to graphically display district profi le data. The profi les include district demographics, student achievement data, and expenditure data. All the information recorded on these profi les came from data school districts report to OSPI (see Appendix E). We modifi ed certain spending categories in these profi les, as described in Appendix B. The expenditure data and performance measures were correlated with district costs-per-student (see Appendix B for a discussion of our correlation analyses). We incorporated into these profi les peer group averages and state averages for each of the expenditure and achievement measures. Appendix B also contains a full discussion of district peer grouping.
The spreadsheet uses embedded data to populate the graphics. The “interactive” aspect of the spreadsheet is the main tab, “District Profi les,” which has a drop-down list of all 295 school districts at the top of the sheet. When a user selects a school district from this list, the sheet’s graphics are automatically populated with the appropriate district and peer group data, alongside state average data. See page 40 for a sample district profi le.
Specifi c data fi elds in the district profi les are the following:
Demographics
• On-time graduation rate
• Alternative Learning Experiences (ALE) percentage
• Free or reduced price lunch eligibility
• Enrollment
Student achievement
• Fourth graders meeting state standards for reading, math, and writing
• Tenth graders meeting state standards for reading and writing
• Tenth graders passing Year 1 End of Course (EOC) math exams
• Tenth graders passing Year 2 EOC math exams
Expenditure data
• NCES spending categories: teaching (instruction), instruction support, administration, operations and maintenance, food services, transportation, student support, and other support services.
• Performance measures for:
• Student Support Services (cost per student; staff per 100 students)
• Administration (cost per student; staff per 100 students)
• Operations and Maintenance (cost per student; square foot per student)
• Food Services (cost per meal; revenue to cost ratio)
• Transportation (cost per rider; buses per 100 riders)
39
• Appendix C • K-12 Education Spending •
School district survey
We gave school districts the opportunity to comment on their data and peer group assignments, and either made appropriate adjustments to the data or incorporated their comments into their profi les. The changes we made include the following:
• Enrollment data. Some districts indicated that their data were inaccurate due to the exclusion of certain enrollment categories. We updated enrollment data by including enrollment numbers for Running Start, summer school, and state institutions.
• Transportation data. We adjusted transportation data where necessary to account for districts in transportation cooperatives.
• Peer groups. A few districts indicated through the survey that another peer group was most appropriate for their district. As a result we shifted two districts to other peer groups based on their input to the survey.
• Other support services. We received input that the inclusion of certain activity codes improperly impacted data and presented an inaccurate picture of per-student expenditures. As a result, we dropped several activity codes from our calculation. These codes were (Other support services activities), 83 (Other Interest), 84 (Principal on debt), 85 (Debt Related Expenditures), and 91 (Public Activities).
• Notes. Through the survey, some districts off ered comments to explain their data or unique district circumstances (such as contractual arrangements with other districts), or to describe cost-control activities. We edited these comments for grammar, spelling, and length only. Like other data in the interactive profi les, these comments automatically populate the “Notes from ___ School District” fi eld when a district is chosen from the drop-down menu. In addition to district-provided comments, this fi eld contains a note if a district’s 2011 ALE enrollment exceeds 10 percent (see Appendix D).
40
• Appendix C • K-12 Education Spending •
4141
Appendix D: Alternative Learning (ALE) EnrollmentWe found that school districts with high Alternative Learning Experience (ALE) enrollment generally had lower non-instructional costs per student than other districts. These students require fewer services because they often study off site. As a result, districts with high ALE enrollment may appear more effi cient on a cost-per-student basis than other districts. We excluded school districts with a high ALE enrollment—over 10 percent—from our district interviews. We also added a note to the interactive profi les for each of these districts. This note explains that high ALE enrollment may make expenditure data for those districts appear unusually low. The following table shows ALE enrollments reported by school districts where ALE enrollment accounts for more than 10 percent of their enrollment. Note: We did not audit this data.
Districts with more than 10 percent Alternative
Learning Experiences (ALE) enrollment in 2011
School districtPercent ALE enrollment
Battle Ground 10.6%Colville 29.4%Crescent 36.1%Deer Park 21.8%Kettle Falls 20.4%Loon Lake 57.7%Mary Walker 17.8%Meridian 41.3%Monroe 21.5%Northport 48.0%Omak 40.2%Orcas Island 37.9%Orient 85.8%Quilcene 56.4%Quillayute Valley 67.0%Raymond 35.7%Soap Lake 16.2%Steilacoom Hist. 36.3%Stevenson-Carson 26.6%Sultan 17.5%Summit Valley 58.2%Toppenish 11.5%Valley 72.2%Wellpinit 38.6%West Valley (Spokane) 17.4%
42
Appendix E: Data SourcesWe used multiple reports and data from the Offi ce of the Superintendent of Public Instruction (OSPI) and the National Center for Education Statistics (NCES) for the time period of 2007-2010 school years, as well as information provided by individuals from OSPI and school districts statewide. The major data sources used for this audit are listed below:
Offi ce of the Superintendent of Public Instruction (OSPI) Data
• Enrollment data was provided by OSPI. The fi le presented average annual student headcount by district, converted to average daily attendance for school years 2008-09, 2009-10 and 2010-11.
• Expenditure and revenue data (F196) was provided by OSPI. We obtained expenditure and revenue fi les used as the basis for OSPI to complete the NCES state survey. These fi les covered the 2007-08, 2008-09, 2009-10 and 2010-11 school years.
• School district staffi ng data (S275) was pulled from the OSPI website at www.k12.
wa.us for school years 2007-08, 2008-09, 2009-10, and 2010-11.
• Achievement and demographic data was provided by OSPI. This data included AYP scores by district, student demographics, graduation rates, and math/reading/writing scores. These fi les were for school years 2007-08, 2008-09, 2009-10, and 2010-11.
• Assessed property values data was provided by OSPI by district.
• Facilities inventory data was provided by OSPI for the 2009-10 and 2010-11 school year, by district.
• Food service data (1800A through 1800I) was obtained from the OSPI website at www.k12.wa.us for the school years 2007-08, 2008-09, 2009-10. This data provided food service revenues, expenditures, and meal equivalents for federal lunch program.
• Transportation data was provided by OSPI for each district for the 2008-09, 2009-10, 2010-11 school years. This data involved an inventory of buses and ridership reporting.
National Center for Education Statistics (NCES) data
1. Financial Statement data was pulled from the NCES website at www.nces.ed.gov for the 2007-08 and 2008-09 school years.
2. School district classifi cation data was pulled from the NCES website at www.nces.
ed.gov used to classify districts by density codes.
Other sources:
1. Interviews with school district offi cials
2. Interviews with OSPI offi cials
3. Reports and audits from other states (See Appendix H)
The fi rst several pages of this appendix are an alphabetical listing of school districts with their peer group number for easy reference. The remaining pages show per-student expenditures and the corresponding percentages for each district within its peer group.
Some per-student expenditures may appear to be signifi cantly higher or lower than expenditures for other districts in a peer grouping because of anomalies in the way districts coded their data. In addition, per-student expenditures for districts with high percentages of students enrolled in Alternative Learning Experience (ALE) programs may appear to be artifi cially low because those students often are off -site and use fewer resources. Those districts with more than ten percent of their students enrolled in ALE programs are marked with an asterisk (*) in the peer group tables.
NCES category Washington activity code definitions
Instruction 27 Teaching
• Includes expenditures for instructing pupils in a teacher-pupil learning situation where the teacher is regularly in the presence of the pupils or in regular communication with pupils (such as with distance learning and running start) in a systematic program designed to assist pupils in acquiring new or improved knowledge, skills, and understandings. Include expenditures for textbooks under this activity. Also include the direct expenditures for classroom teachers, teachers’ aides, teachers of homebound, teachers of institutionalized, correspondence teachers, and others assigned to instruct pupils regularly in a teacher-learning situation, and their secretaries, clerks, and other assistants.
• Includes expenditures for training teachers for their teaching functions.28 Extracurricular
• This activity is used to record expenditures directly related to student services such as coaching, class or student activity advising, supervising student body fund accounting, and related duties.
29 Payments to School Districts
• This activity is used to record payments to other school districts including, but not limited to, non-high school, special education, and skills center payments by participating school districts.
Student support
services
24 Guidance and Counseling
• Includes expenditures involved in aiding pupils to assess and understand their abilities, aptitudes, interests, environmental factors, and educational needs through activities such as student assessment testing.
• Includes that part of the pupil services program concerned with assisting pupils in increasing their understanding and use of educational and career opportunities. Include activities of the counselor, social worker, guidance director, secretaries, registrars, clerks, and other assistants, and outreach for deprived students and/or homeless liaison work.
25 Pupil Management and Safety
• Includes expenditures for hall guards, crossing guards, bus aides, playground aides, and pupil security personnel. Also include expenditures for lunchroom aides when their duties involve control and assistance of students. Lunchroom aides who assist in preparation or distribution of food are charged to Activity 44 Operations.
• In addition, includes personnel whose duties are primarily those of attendance tracking. Include those who are involved with early identifi cation of patterns of nonattendance, analysis of causes of nonattendance, early professional action on problems of nonattendance, and enforcement of compulsory attendance laws.
• Does not include expenditures for building security that must be charged to Activity 67 Building and Property Security.
• Also includes administrative expenses such as cell phones that are utilized by personnel responsible for pupil management and safety.
The following table displays activity code defi nitions used by OSPI in the School Accounting Manual, which is the guidance provided to school districts for reporting expenditures. Activities are organized by National Center for Education Statistics (NCES) categories, which NCES calls “functional areas.”
83
Appendix G: Defi nitions of Activity Codes
83
NCES category Washington activity code definitions
26 Health/Related Services
• Include services in the fi eld of physical and mental health consisting of medical, dental, optometry, psychiatric, doctor, nurse, orientation-mobility specialists, occupational therapists, and physical therapists. Also include duties of the psychologist, psychometrist, language pathologists, and audiometrists, and their secretarial, clerical, and other assistants.
Instructional staff
support
21 Supervision
This activity is used to record expenditures for overall leadership for the instructional programs.• Include the expenditures for staff members providing supervision, coordination,
evaluation, and development in instruction, curriculum, instructional materials, and pupil services programs. Also include secretarial and clerical assistants along with nonemployee-related costs for these functions. Include expenditures for training supervisors for their supervisory activities.
• Instructional employees assigned on a long-term basis to develop new curriculum or to oversee program implementation district wide should be charged to this activity. Instructional staff released or paid to attend in-service meetings or work on short-term curricular projects should be charged to the same activity as the individual’s basic salary.
22 Learning Resources
• Include the part of the instructional program that provides services and materials specifi cally designed to improve learning through use of instructional/educational aids. It provides for organizing learning resources in a systematic manner at locations where they are available for use by pupils and staff members in educational programs of the school. Learning resource materials include books, fi lm, video, pictures, charts, models, and other materials for aiding instruction.
General
administration
11 Board of Directors
• Include those responsibilities that are not delegated but are retained and carried out by the school district’s governing board. Delegated responsibilities will be charged to the activity in which the responsible person is charged.
• Include such items as expenditures for board memberships, audits, elections, legal services, and judgments not covered by insurance, census, and, as provided by RCW 36.70.015 for regional planning.12 Superintendent’s Offi ce
• This activity relates to district wide administrative responsibility. It consists of general administration and superintendent’s offi ce.
School
administration
23 Principal’s Offi ce
• This activity covers management and coordination of a school unit. Specifi cally, it includes the implementation of administrative policies, assignment of duties to staff members, administration of the instructional program, evaluation of the effi ciency of staff members, supervision of the maintenance and operation workers as their work may aff ect the school unit’s program, management of records, coordination of the school unit’s program of instruction with the district wide program, and such other management and coordination of programs as required for the operation of an elementary or secondary school or school of adult education.
84
• Appendix G • K-12 Education Spending •
NCES category Washington activity code definitions
• Include the duties of the principal, assistant principal, vice principal, and skills center director, and their secretarial and clerical assistants assigned to coordinate and manage the operation of a school unit.
Operations &
maintenance
60 Maintenance and Operation
• This series consists of activities concerned with keeping the physical plant open, comfortable, and safe for use, and keeping the grounds, buildings, and equipment in an effi cient working condition.
61 Supervision
• This activity is used to record expenditures relating to the supervision of the maintenance and operations of the school district.
• Includes the expenditures for the services of supervisory personnel and their secretarial and clerical assistants, property managers, assistant property managers, and those administrative expenses required for maintenance and operation oversight.
62 Grounds Maintenance
• Includes expenditures for routine care of grounds, such as raking, hoeing, watering, cutting and protecting lawns, transplanting, trimming, and caring for fl owerbeds. Include all related supplies and materials.
• Maintenance includes expenditures for maintaining grounds and equipment. Include repairing or replacing walks, fences, tennis courts, playground surfaces, lawn sprinkling systems, outside fl agpoles, driveways, and sewers.
63 Operation of Buildings
• Operations encompass those activities related to a building’s normal performance of the function for which it is used. Include expenditures for personnel who maintain buildings. Include expenditures for all small equipment items and consumable supplies used by personnel in operating the building.
• In addition, include rental expenditures for land and buildings for purposes other than pupil transportation. Equipment rentals are charged to the using activity and appropriate program.
64 Maintenance
• Maintenance is the upkeep of property and equipment, work necessary to realize the originally anticipated useful life of a building. Included are expenditures for maintaining buildings and equipment through repair and upkeep.
65 Utilities
• Includes expenditures for water, electricity, sewage, gas, coal, wood, oil, sanitary, recycling, basic voice telecommunications services, and other service assessments or charges. Telecommunications expenditures that are part of the instructional program, such as video or data transmission, may be charged directly to the appropriate activity or may be transferred using debit and credit transfer objects of expenditures. Utility costs may not be charged to any program in which this activity is not allowable.
67 Building and Property Security
• Includes services designed to protect buildings and other property of the district from unlawful entry, vandalism, and burglary. Include the expenditures for security supervision, security patrols, intrusion devices, and cell phone expenses related to security supervision.
85
• Appendix G • K-12 Education Spending •
NCES category Washington activity code definitions
68 Insurance
• Includes provision for property, employee, liability insurance, and fi delity bonds in this activity. Insurance deductible amounts may be included in this activity. Do not include pupil transportation insurance that is charged to Activity 56 Insurance.
75 Motor Pool
• If accumulating motor pool expenditures for allocation to using departments, include all direct expenditures for operating motor vehicles and other motor-driven transportation equipment used for purposes other than pupil transportation.
Student
transportation
50 Pupil Transportation
This series is charged with expenditures related to the conveyance of pupils.Expenditures identifi ed with this series must be charged to Program 99 Pupil Transportation, except:• Transportation expenditures chargeable to other programs for which program
approval has been obtained through the use of debit and credit transfer objects.• Expenditures chargeable to Program 73 Summer School and Program 89 Other
Community Services through the use of debit and credit transfer objects.• Purchases and rebuilding expenditures for pupil transportation vehicles must be
charged to the Transportation Vehicle Fund.51 Supervision
This activity is used to record expenditures relating to the overall supervision of the pupil transportation program.• Includes the expenditures for managing, directing, and supervising the
transportation program. Services include those of supervisory, secretarial, and other assistants in establishing routings and schedules, supervision of vehicle operations and maintenance, dispatching, and training pupil transportation staff .
52 Operations
• Includes direct operating expenditures for buses and payments to fi rms for transporting pupils. The only salaries charged to this activity are those of the bus drivers. Include expenditures for the transportation of pupils by means other than school buses as well as expenditures for medical exams for bus drivers. Vehicle fuel costs should be charged to Object 5 under this activity.
53 Maintenance
• The expenditures for maintaining pupil transportation vehicles are charged to this activity. Include such services as mechanical repair, painting, checking for safety, cleaning, greasing, and preventive maintenance. Also charged to this activity are tires, tubes, antifreeze, fi rst aid kits, oils, lubricants, and fi re extinguishers. Include rent, custodial and related services for the garage, and the repair and maintenance of the garage buildings, grounds, and equipment. Also included are the expenditures for replacement and additional shop equipment.
56 Insurance
• Includes expenditures for insuring pupil transportation vehicles and providing the school district with liability protection. Types of insurance include liability, property damage, medical care, collision, fi re, and theft damage.
86
• Appendix G • K-12 Education Spending •
NCES category Washington activity code definitions
59 Transfers
• Includes the expenditures for providing transportation for pupils on trips in connection with educational programs, including exhibits, fi lms, galleries, theaters, music halls, ski schools, environmental sites, and other locations for the purpose of broadening their knowledge and experience. Include motor pool expenditures originally charged to the Activity 50 series that must be transferred to Activity 75 Motor Pool. Expenditures to be transferred out are initially accumulated in Activities 51 through 53 along with other transportation expenditures.
Other Support
Services
13 Business Offi ce
This activity consists of the fi nancial and accounting operations of a district. Include district wide research and planning for budgeting, accounting, bookkeeping and statistical services, business administration, fi scal control, purchasing, and payroll.14 Human Resources
This activity consists of the personnel recruitment and placement activities of the district. This would include expenditures such as employee assistance programs, employment services, classifi cation and compensation, human resources information systems, labor relations, recruitment and development, employee association representatives, etc.15 Public Relations
This activity consists of writing, editing, and other preparation necessary to disseminate educational and administrative information to parents, students, staff , and the general public through direct mailing, the various news media, e-mail, internet web sites, and personal contact.72 Information Systems
• Includes all expenditures concerned with the operation of a recognized organizational unit that administers the district’s information system. Such services as systems and database development and/or maintenance, processing data, and storage of data are charged here.
• Includes the operation of the district’s network including, but not limited to, server equipment, technology staff , maintenance costs and agreements, internet connection fees, right of way fees, operating systems and managing system software, content fi ltering, and network security.
• Information systems expenditures that are specifi c to a program, such as computer-assisted instruction and/or classroom terminals, may be charged directly to the appropriate program/activity.
73 Printing
• Includes the operating expenditures for duplicating, printing, or otherwise reproducing printed materials by a print shop and contracted printing services. Transfer printing expenditures that are part of the instructional program to the appropriate activity through the use of debit and credit transfer objects.
74 Warehousing and Distribution
• Includes the expenditures for distributing supplies, delivering mail, and the expenditures for operating a central warehouse. Warehousing and distribution expenditures that are part of other programs, such as delivery of meals to schools, may be charged directly to the appropriate activity or may be transferred through the use of debit and credit transfer objects.
87
• Appendix G • K-12 Education Spending •
NCES category Washington activity code definitions
Food services 40 School Food Services
The activities in this series are used to record operating expenditures for nutrition services (the preparation and serving of regular and incidental meals for pupils and teachers as provided by RCW 28A.235.120) provided in connection with regular school activities.Expenditures identifi ed with this series must be charged to Program 98 School Food Services, except:• Expenditures chargeable to other programs for which program approval has been
obtained through the use of debit and credit transfer objects.• Expenditures chargeable to Program 73 Summer School and Program 89 Other
Community Services through the use of debit and credit transfer objects.41 Supervision
This activity is used to record the expenditures for managing, directing, and supervising the food service program.• Services include those of supervisory, secretarial, and other assistants involved
in the administration of the food service program. Examples include: directors, director’s support staff , and dieticians.
42 Food
• Includes the expenditures for all food (purchased and commodities) used in connection with the regular food services program including expenditures for processing, freight, delivery, and storage.
44 Operations
• Includes the direct expenditures for preparing and serving breakfasts and lunches in connection with school activities and the delivering of prepared meals to schools. Include services of cooks, cashiers, and kitchen help expenditures, contractual services, supplies and materials (other than food), travel, and capital outlay. Include lunchroom aides who assist in food preparation or distribution.
49 Transfers
This activity, under Program 98 School Food Services, is used exclusively for transferring expenditures for banquets, feeding of the elderly, feeding approved day care children, and other feeding operations not chargeable to Program 98. Expenditures to be transferred out are accumulated in Activities 41 through 44 along with other school food services expenditures.
Enterprise NCES reclassifi es WA state ASB Fund Expenditures as Enterprise for presentation purposes. Our audit did not analyze ASB expenditures
Refer to OSPI’s School Accounting Manual for further information on school district fi nancial reporting guidance.
88
• Appendix G • K-12 Education Spending •
Bibliography of reports on cost - containment strategies
_____. Best Practices Could Help School Districts Reduce Their Food Service Program Costs. Offi ce of Program Policy Analysis & Government Accountability. Report No. 09-02. Tallahassee, FL. January 2009.
_____. Balancing the Budget, 101 Ideas for Cutting Costs and Maximizing Revenues. Texas School Performance Review. March 2003.
_____. Voluntary Effi ciency Audits of School Districts. Legislative Division of Post Audit State of Kansas. 11PA01. August 2010.
_____. K-12 Education: School District Effi ciency Audits. Legislative Division of Post Audit State of Kansas. 08PA11. July 2009.
_____. Arizona School District Spending (Classroom Dollars) Fiscal Year 2010. Offi ce of the Auditor General. Arizona. Report No 11-01. February 2011.
_____. Arizona School District Spending (Classroom Dollars) Fiscal Year 2011. Offi ce of the Auditor General. Arizona. Report No 11-01. February 2012.
_____. Education Effi ciency Audit of West Virginia’s Primary and Secondary Education Systems. Public Works LLC. January 3, 2012.
The State Auditor’s Offi ce independently serves the citizens
of Washington by promoting accountability, fi scal integrity
and openness in state and local government. Working with these
governments and with citizens, we strive to ensure the effi cient and eff ective use of public resources.
Americans with
Disabilities
In accordance with the Americans with Disabilities Act, this document will be made available in alternate formats. Please call (360) 902-0370 for more information.
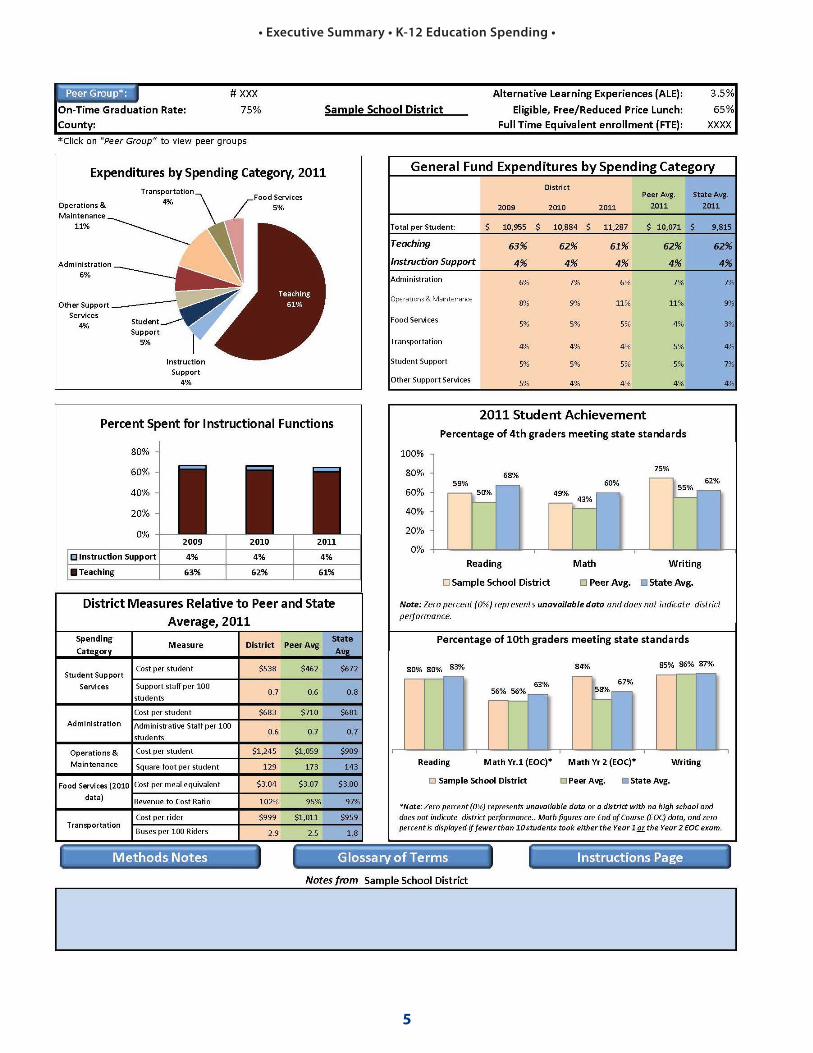

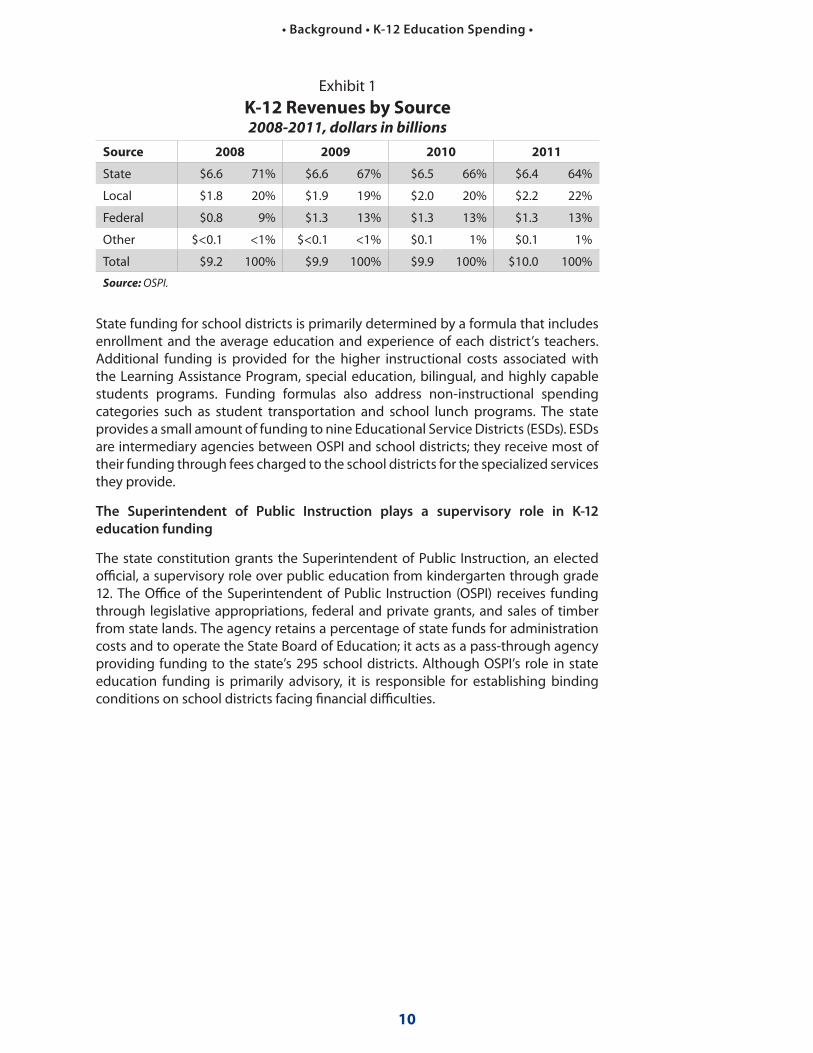

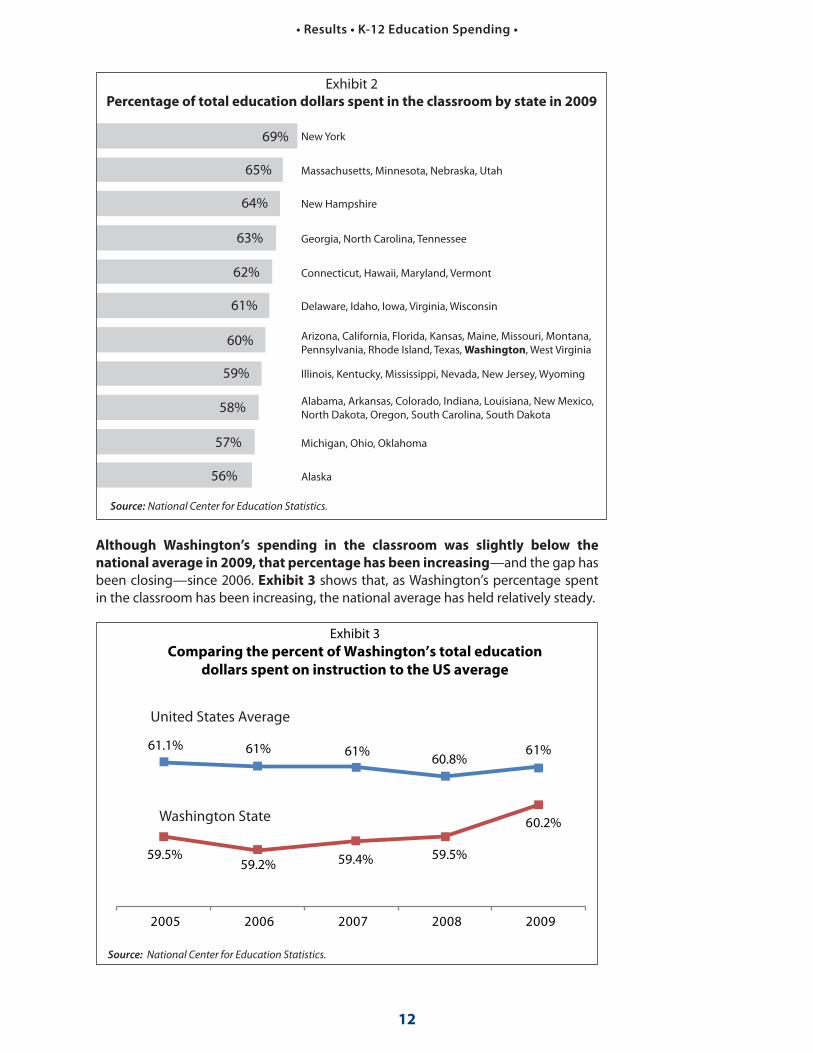
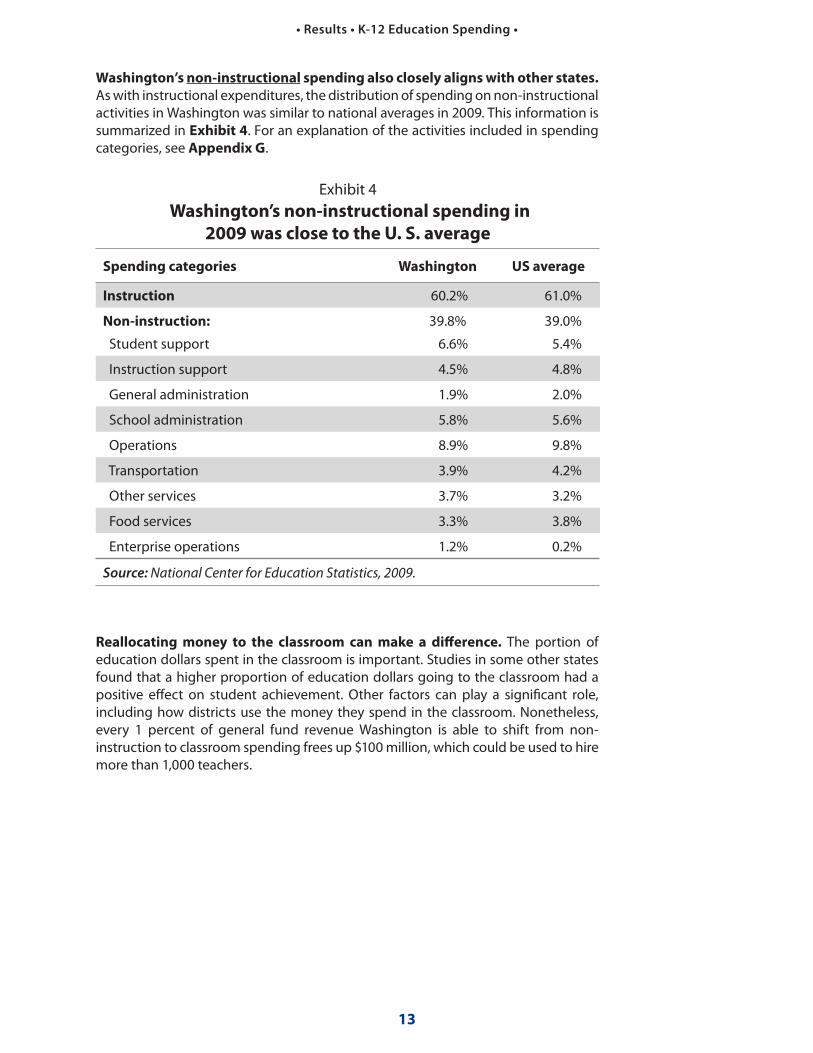

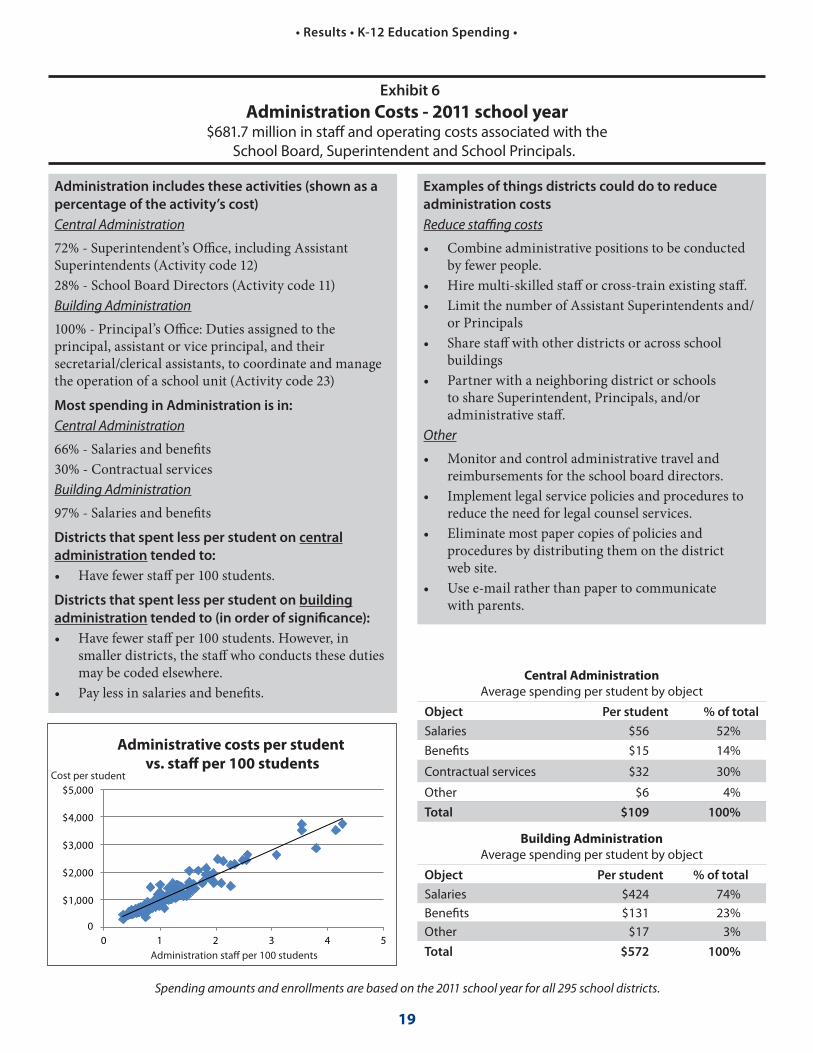
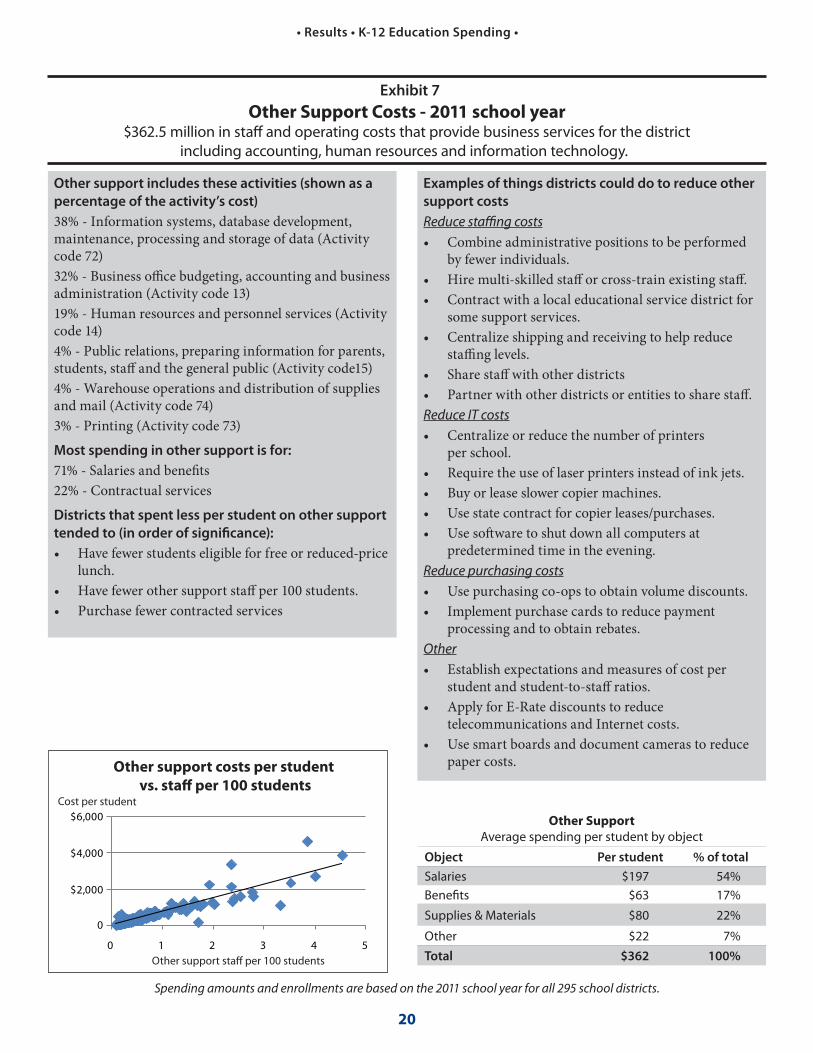
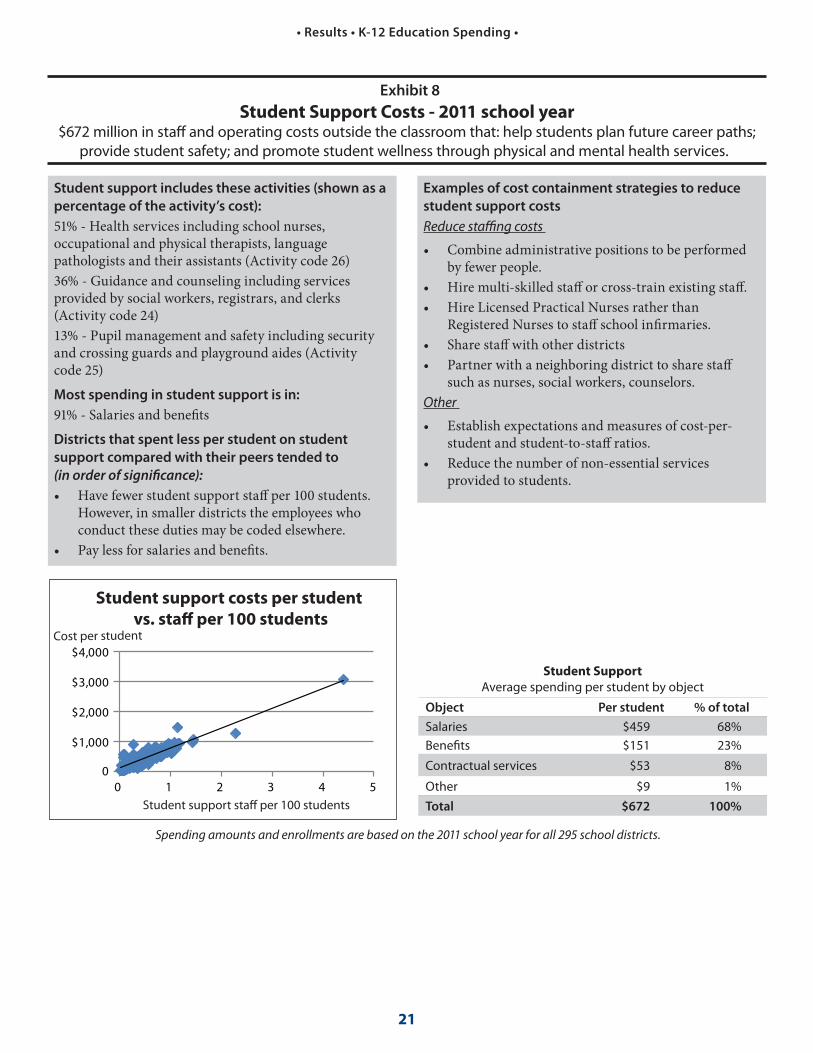
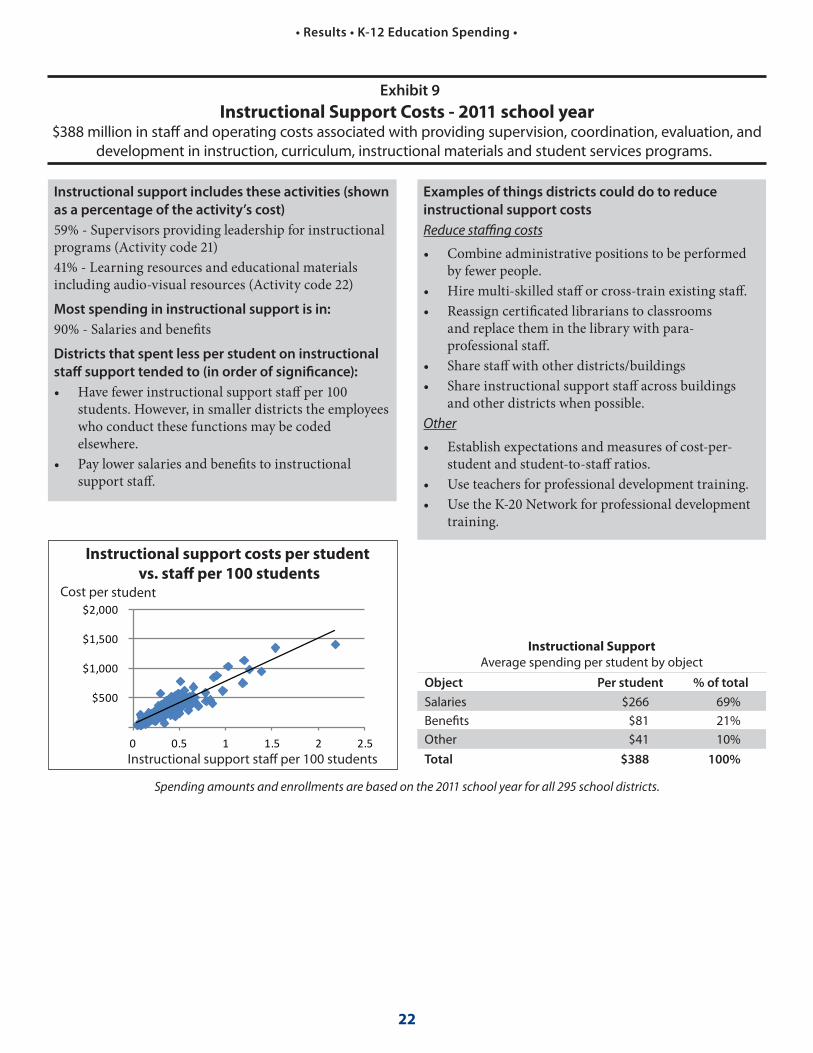
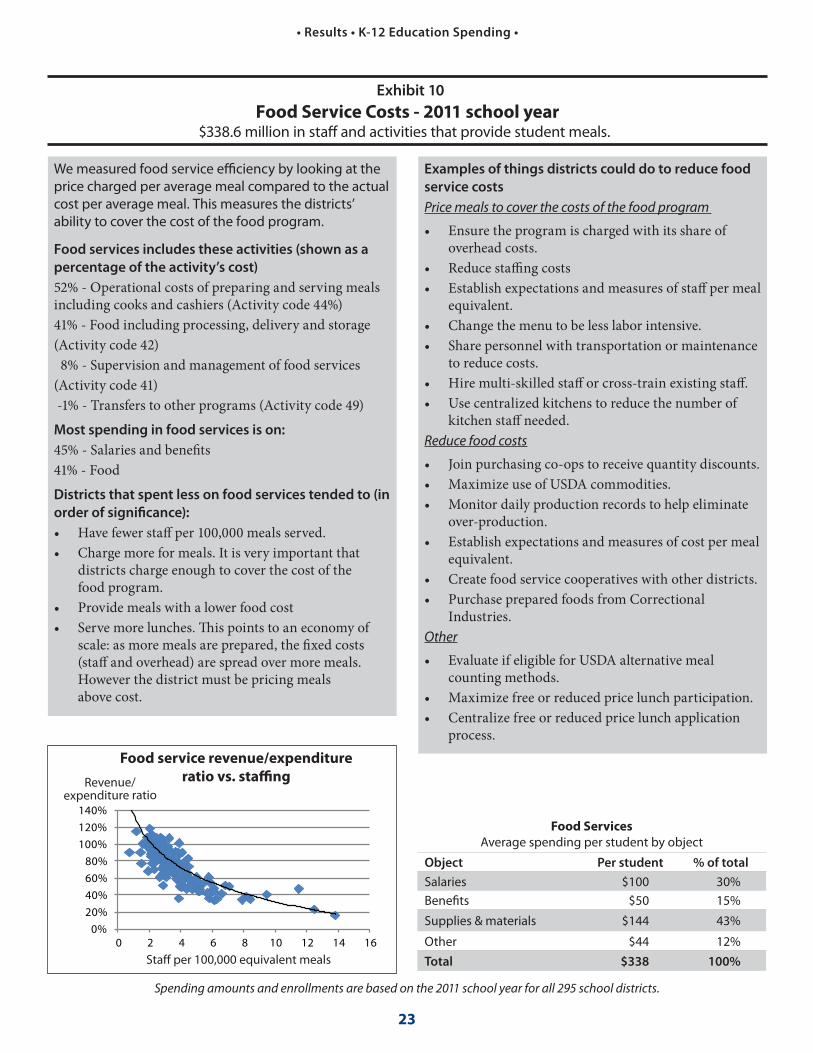
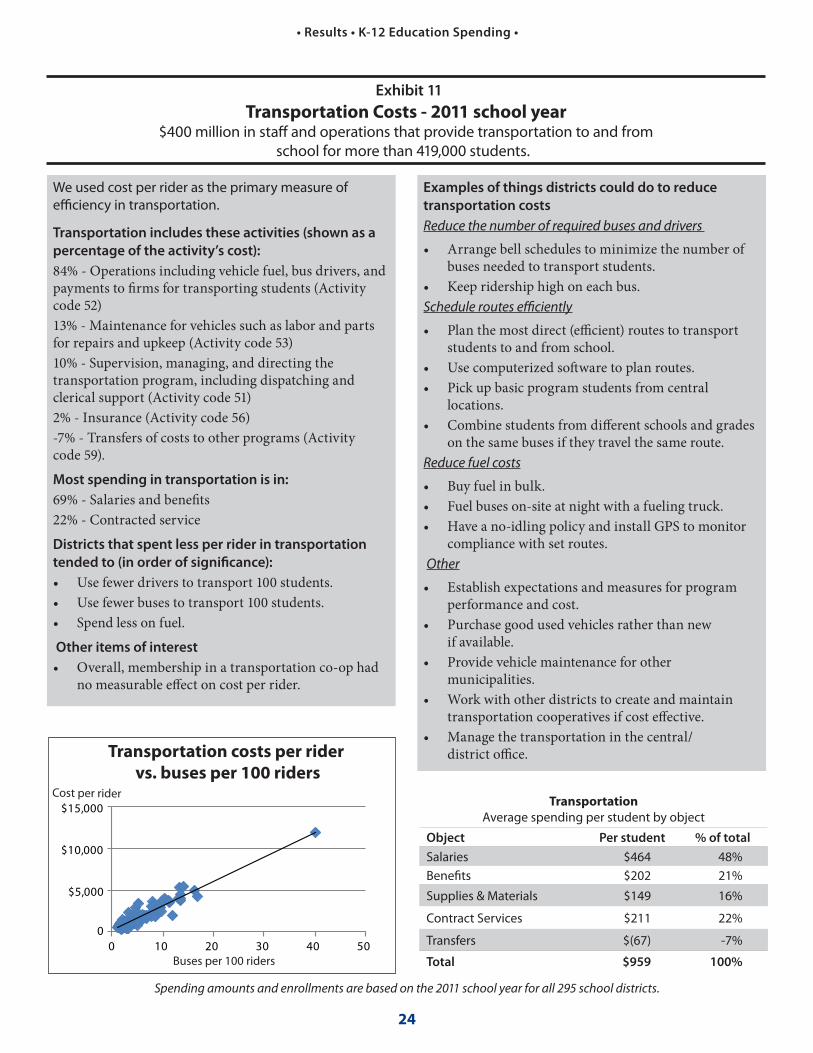
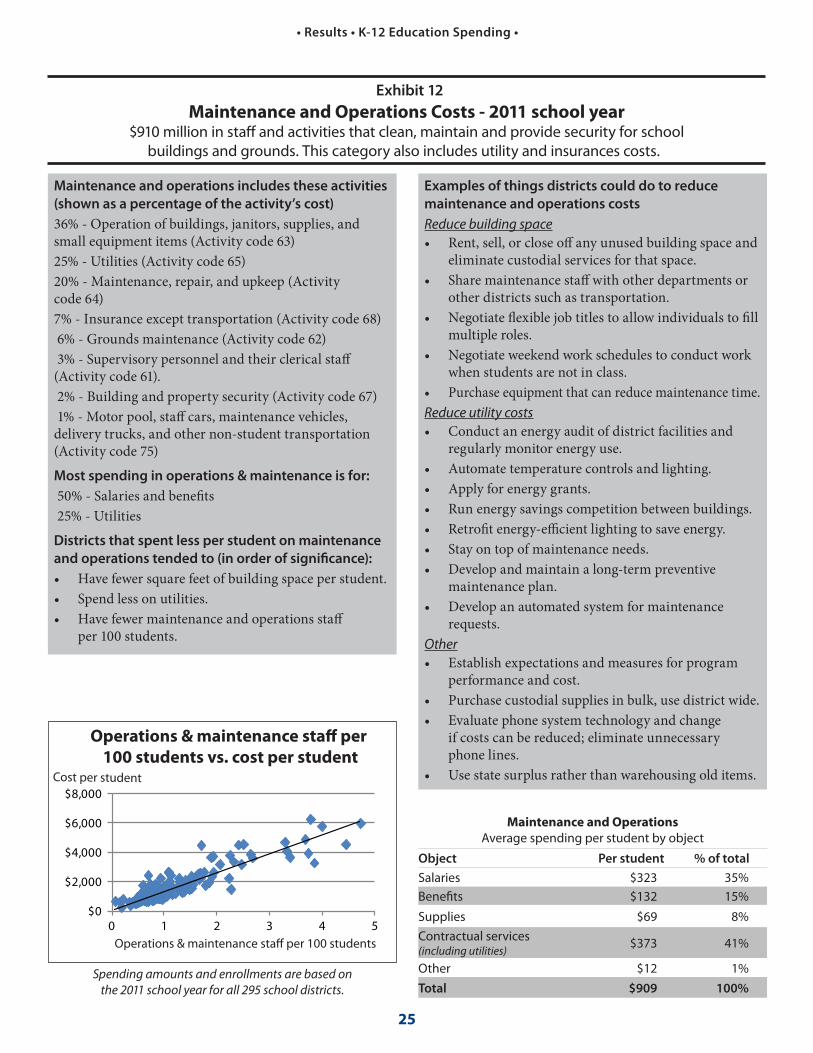


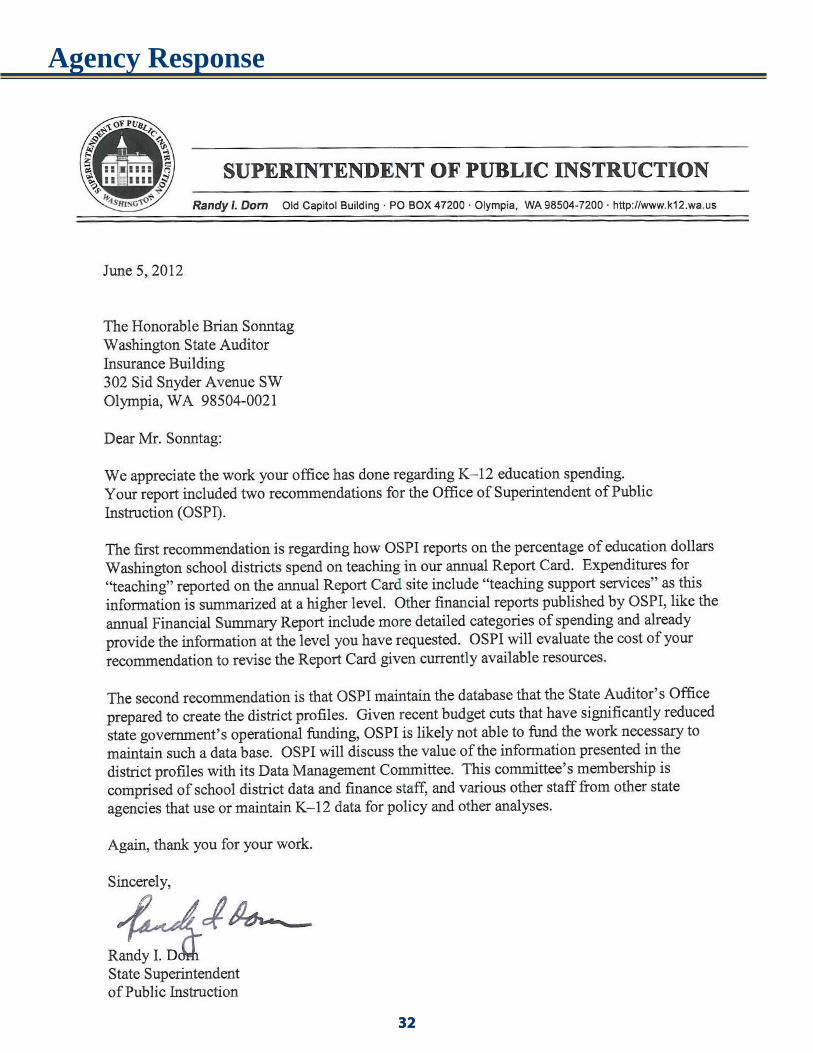
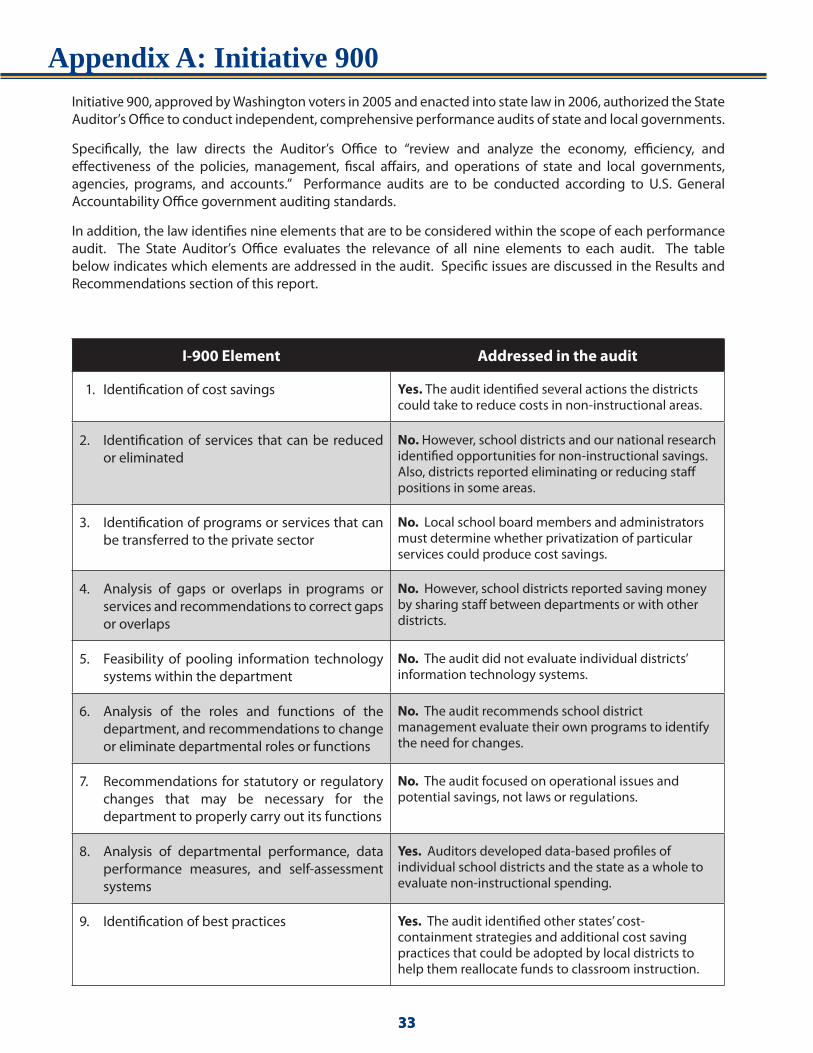
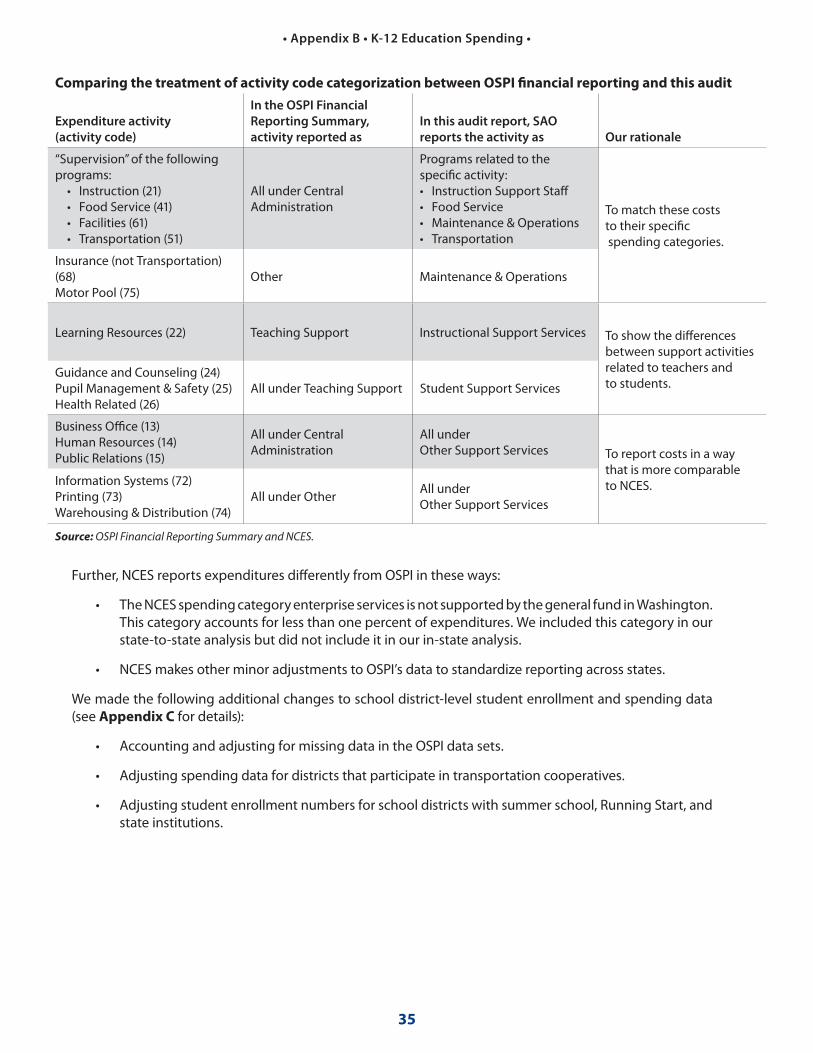


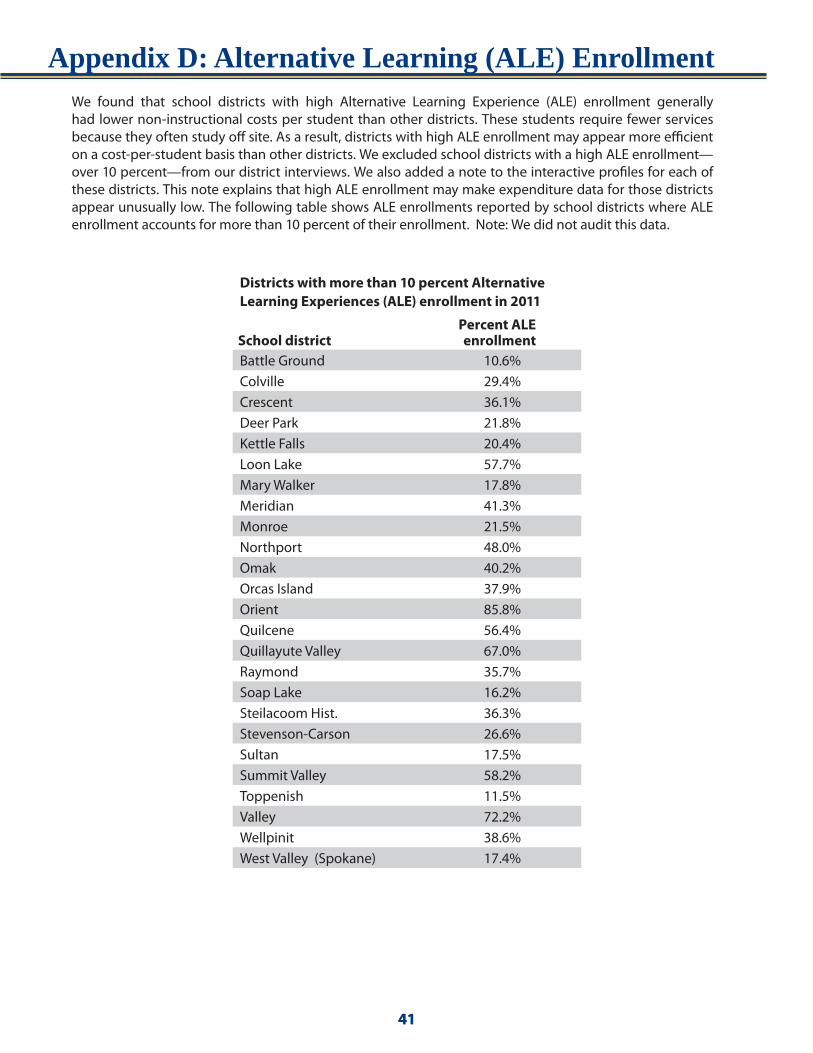

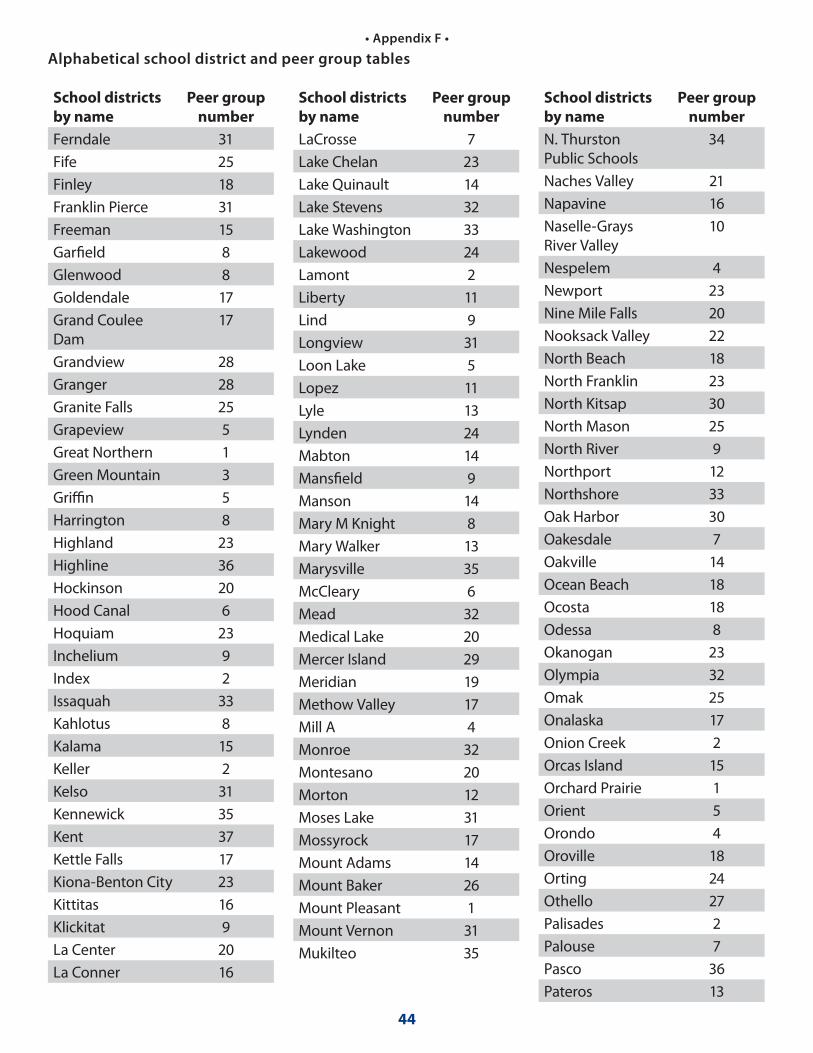
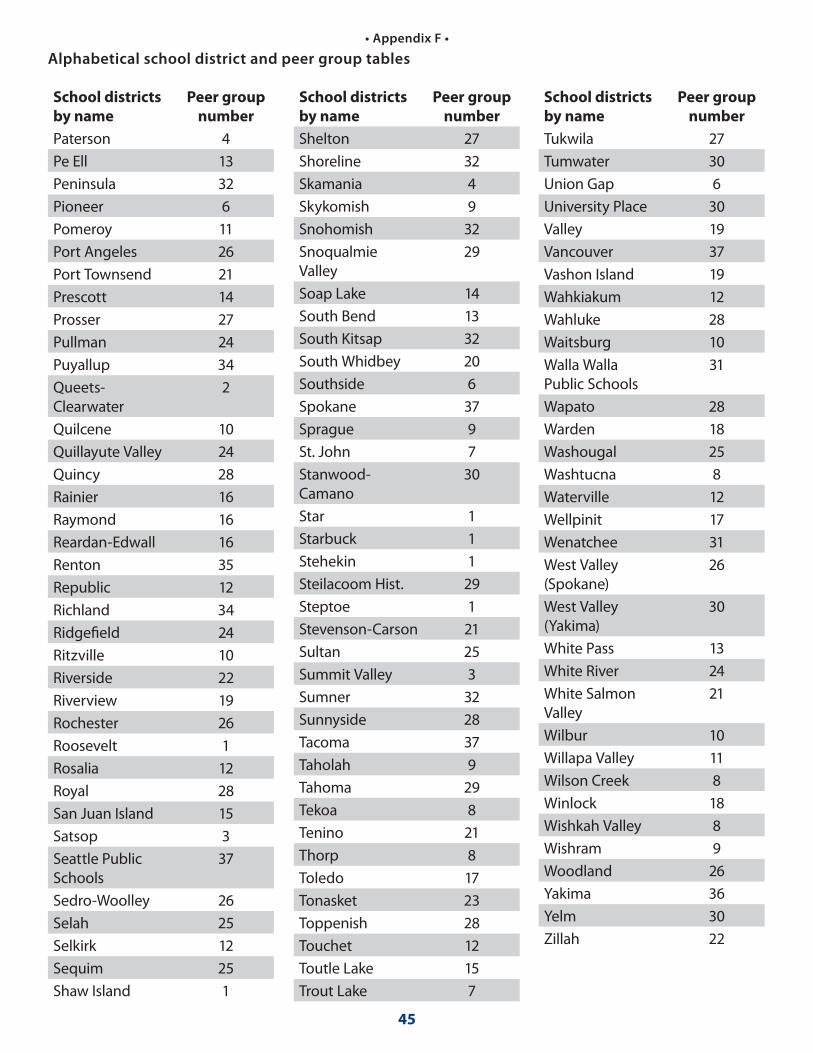
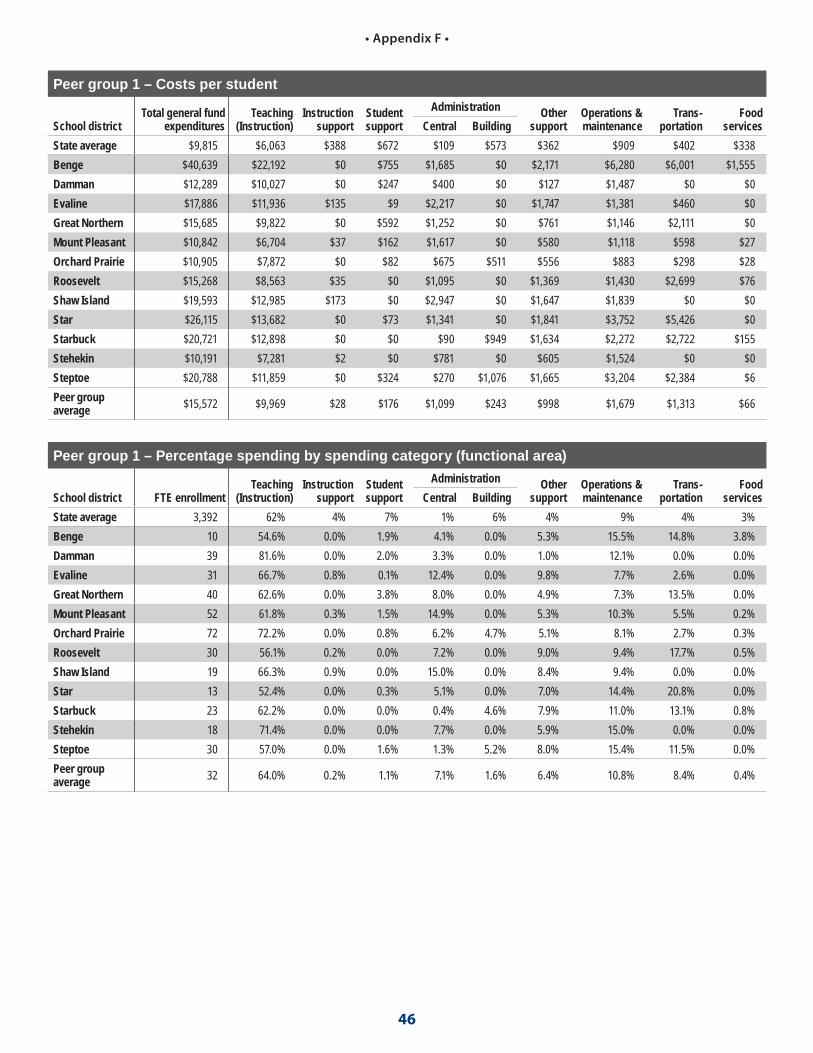


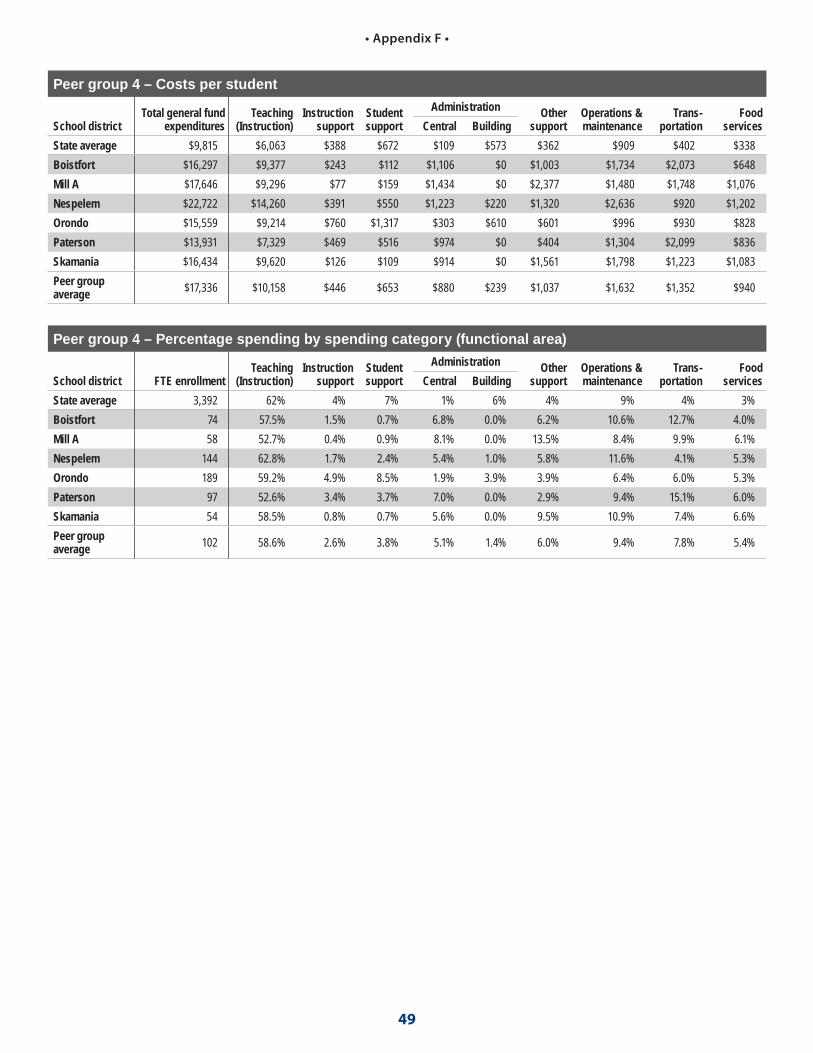

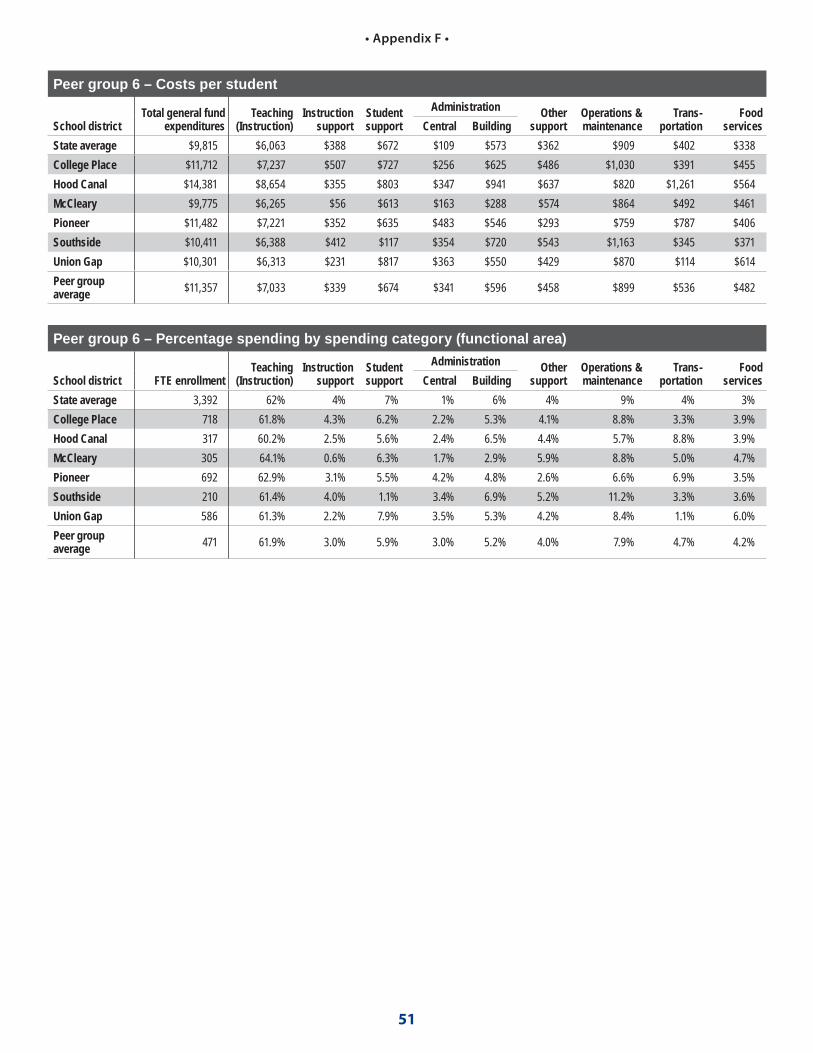

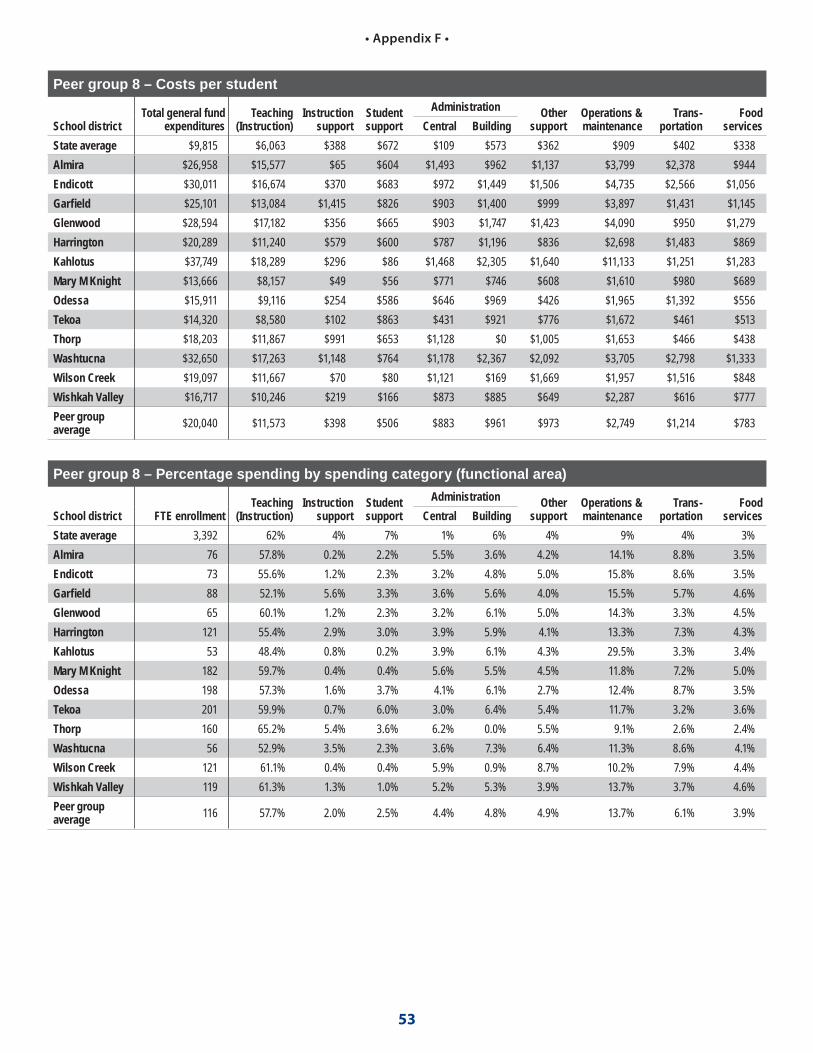
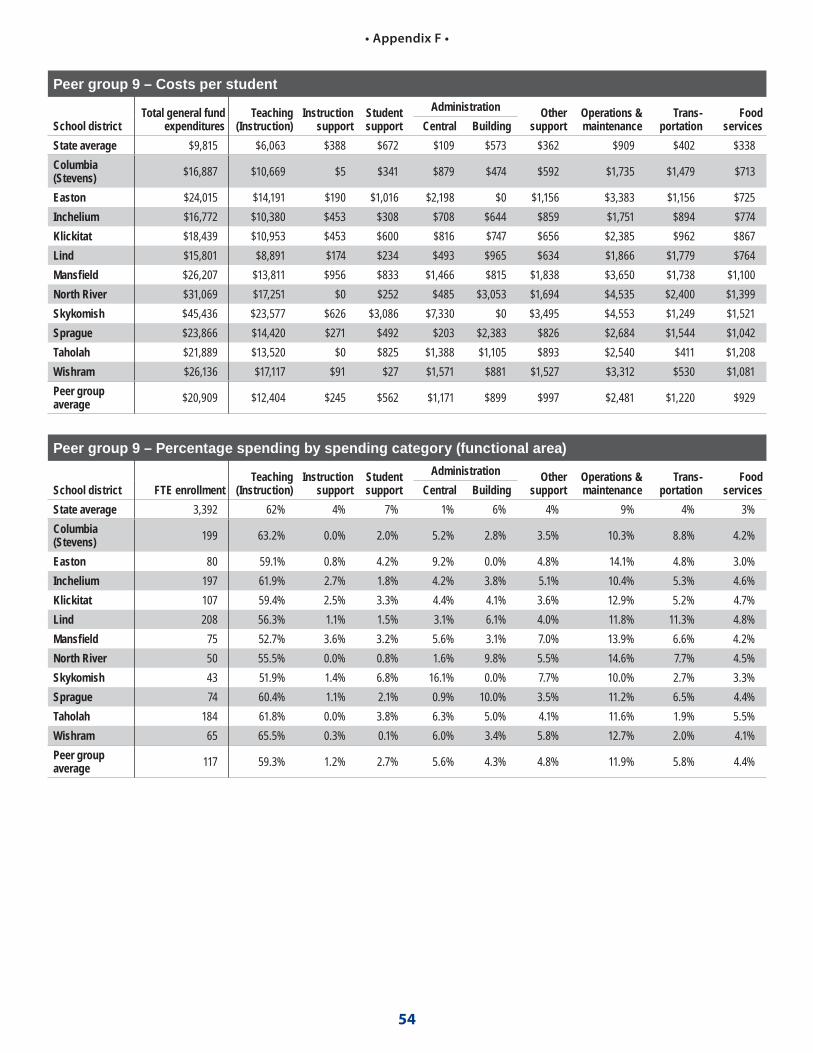


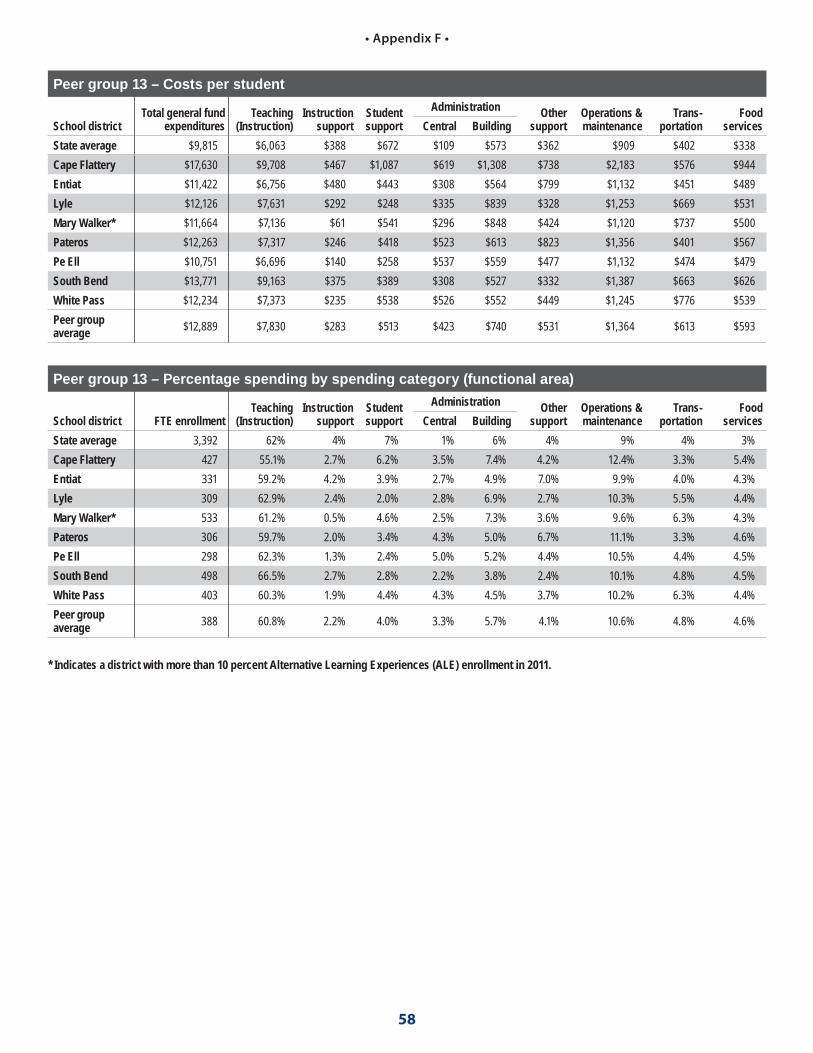
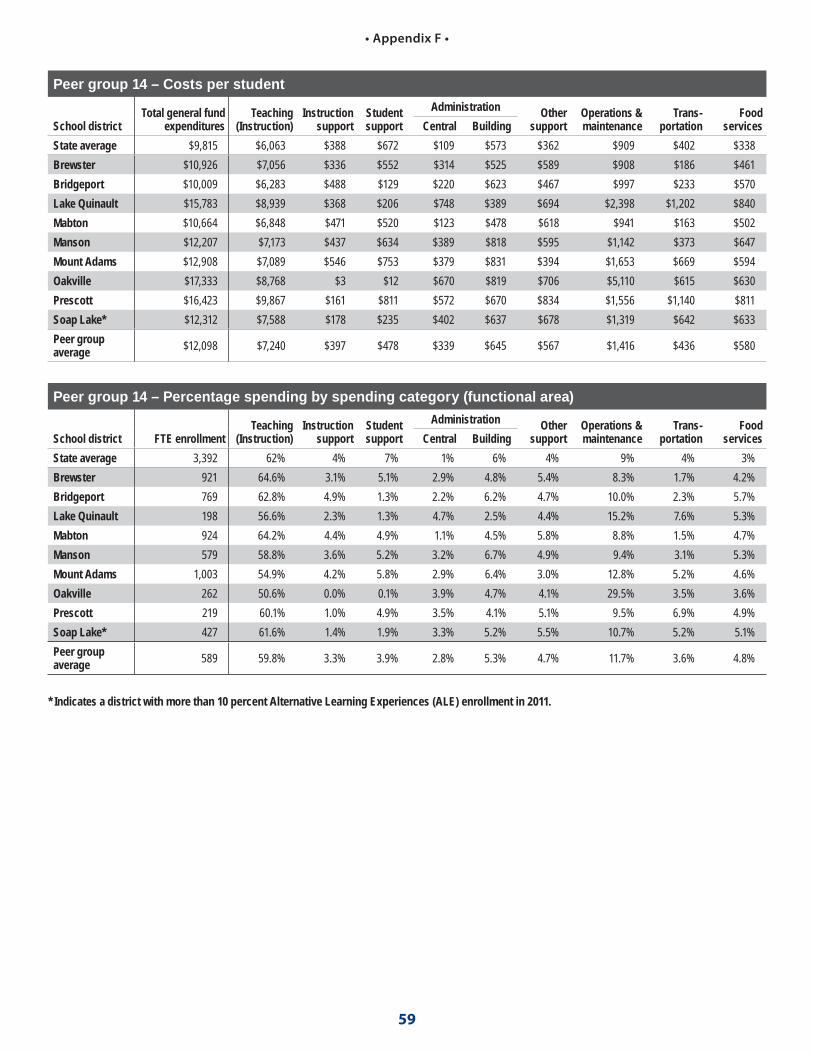
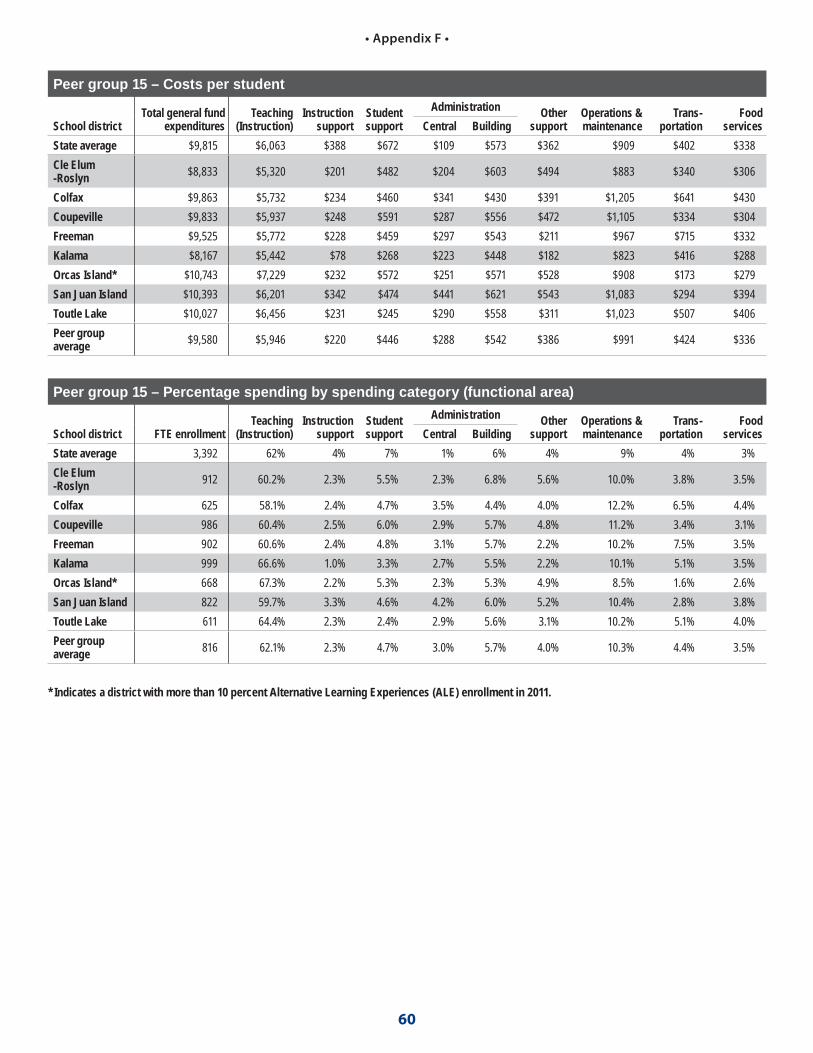

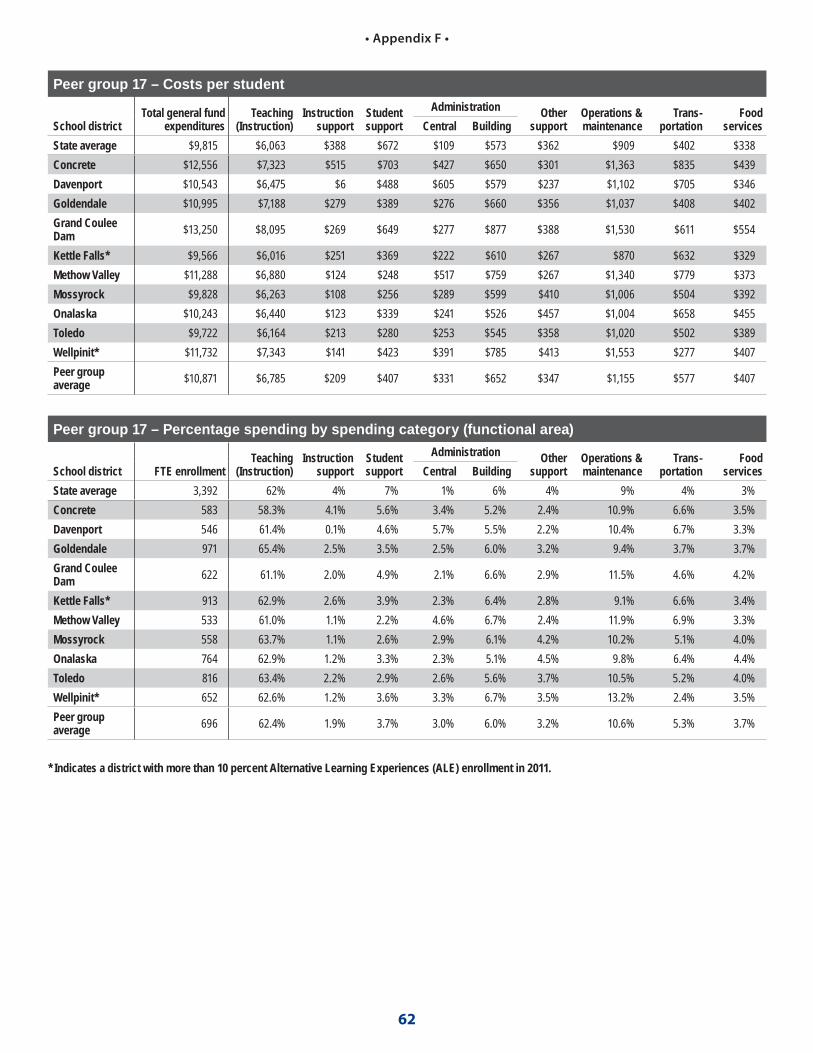
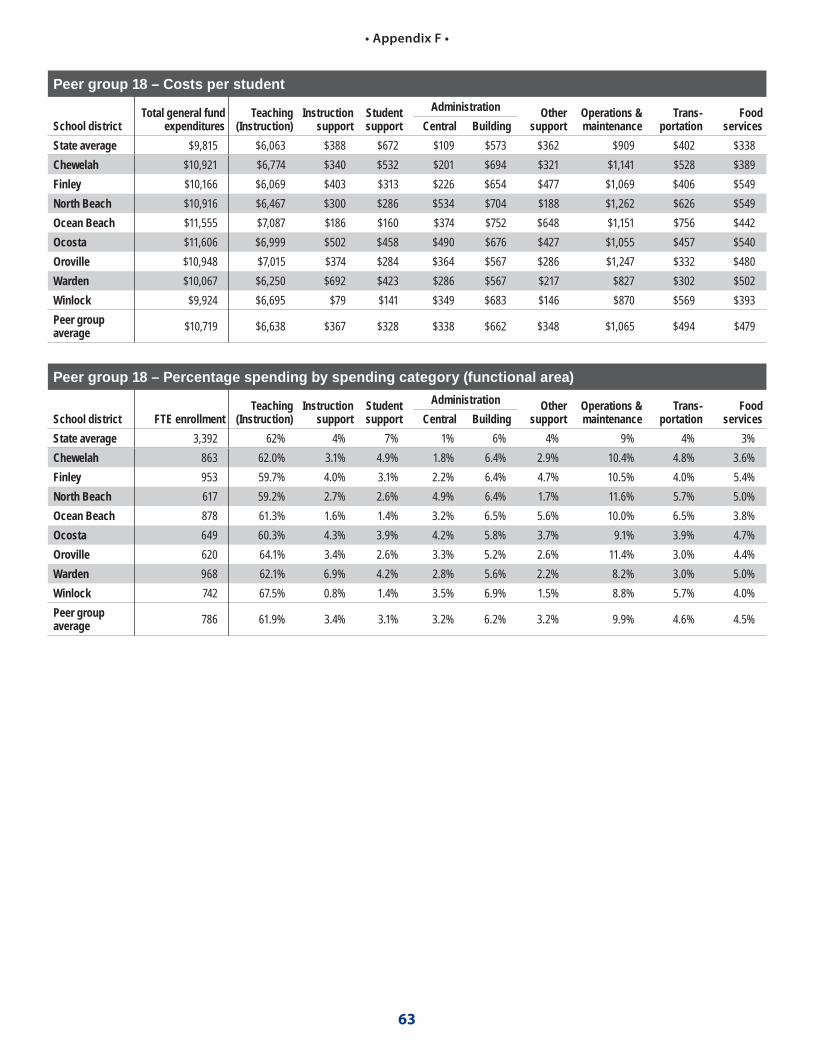

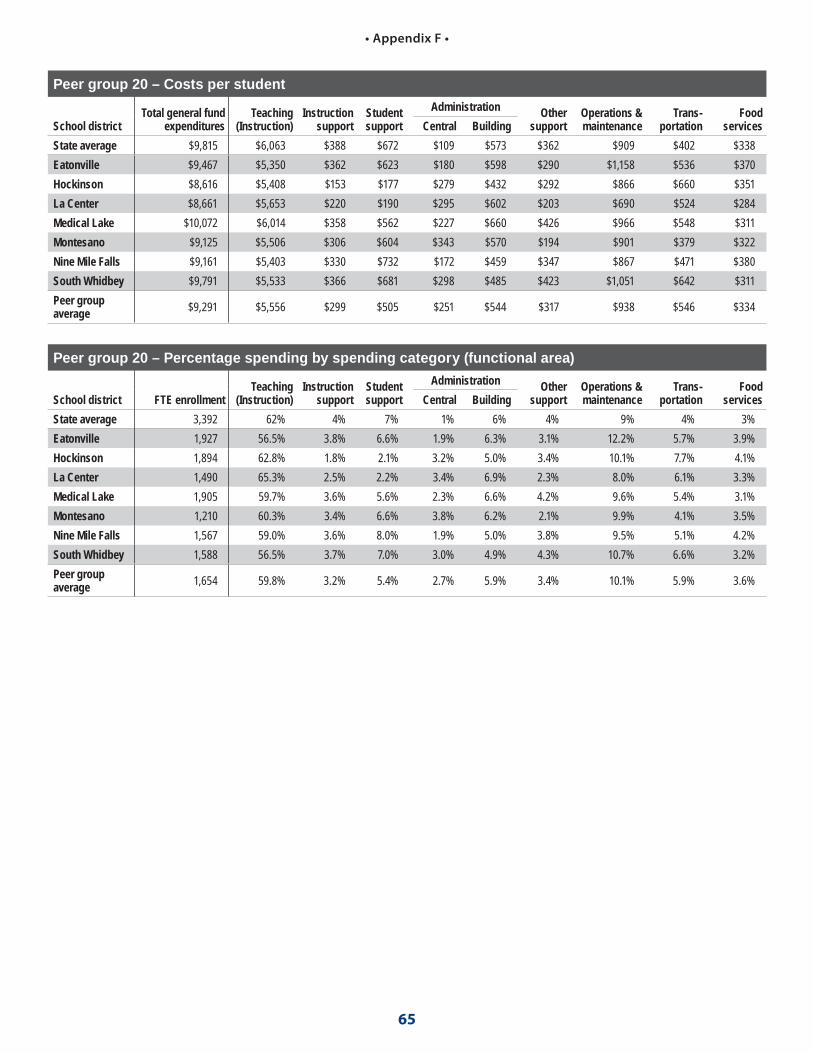
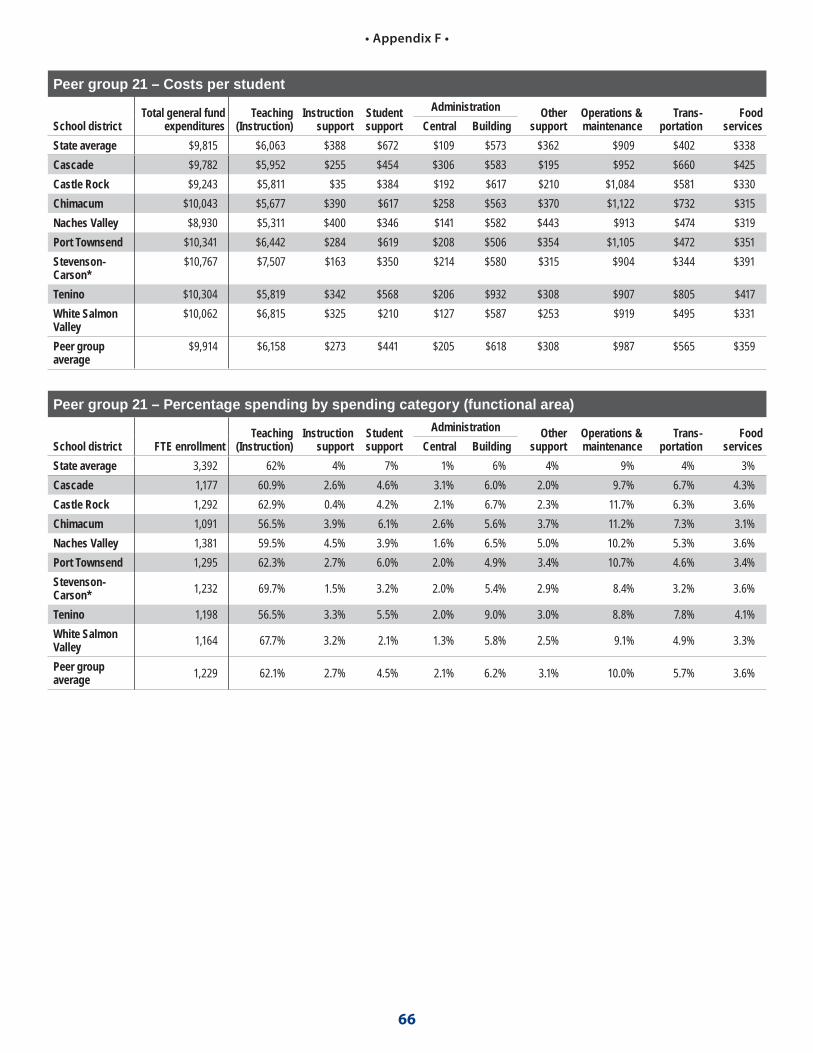
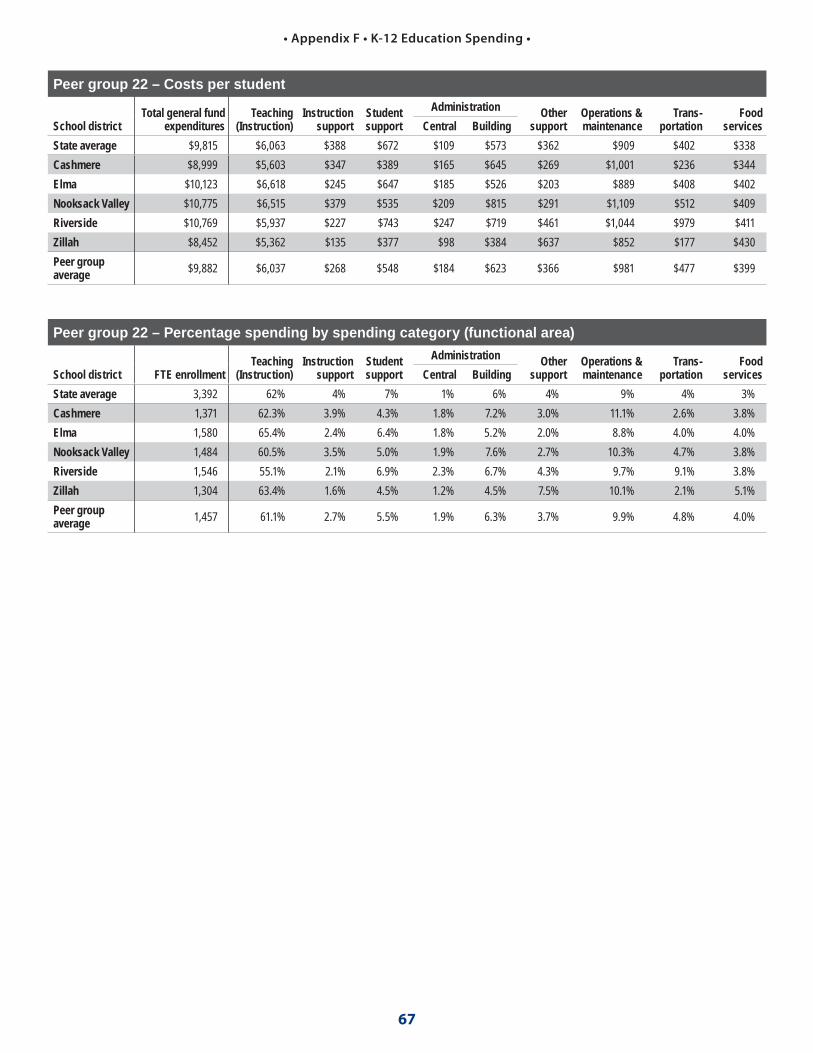
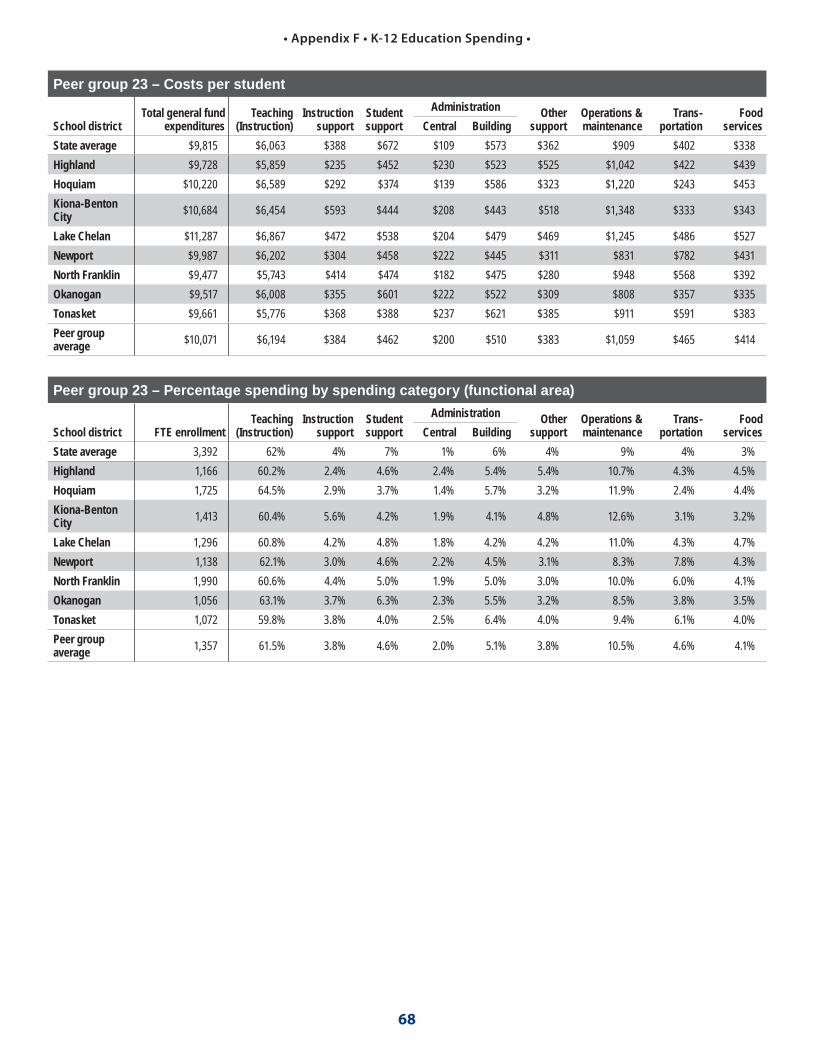
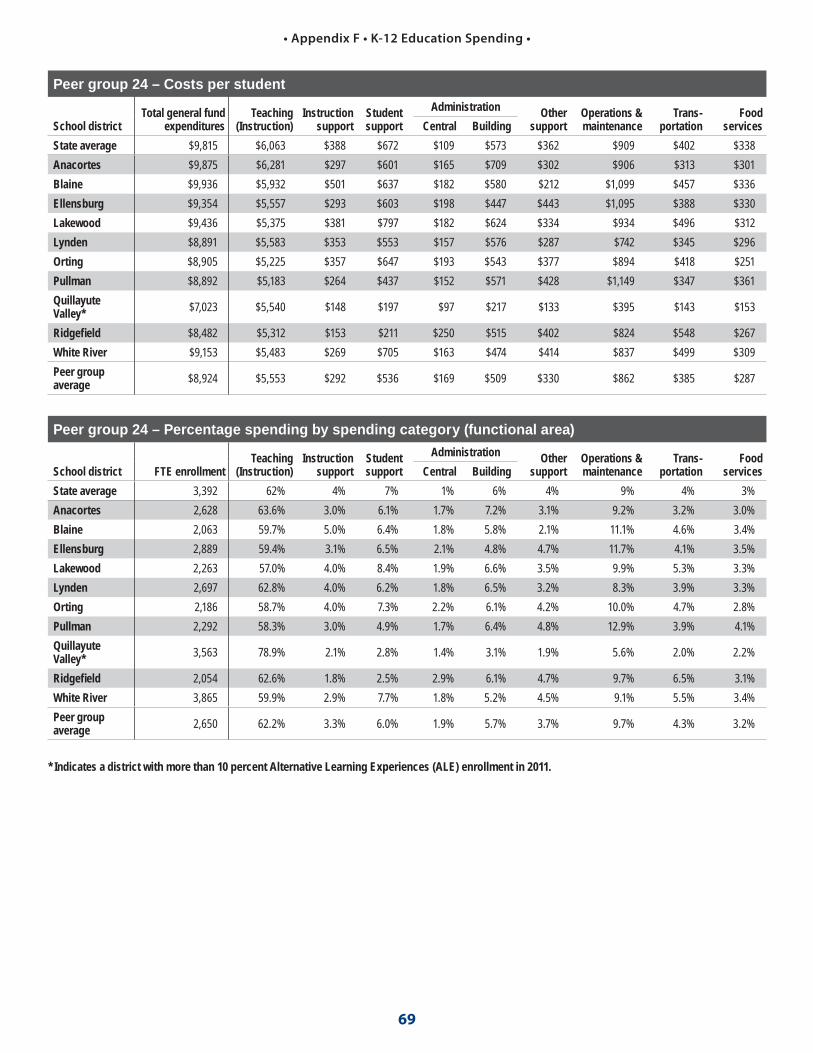
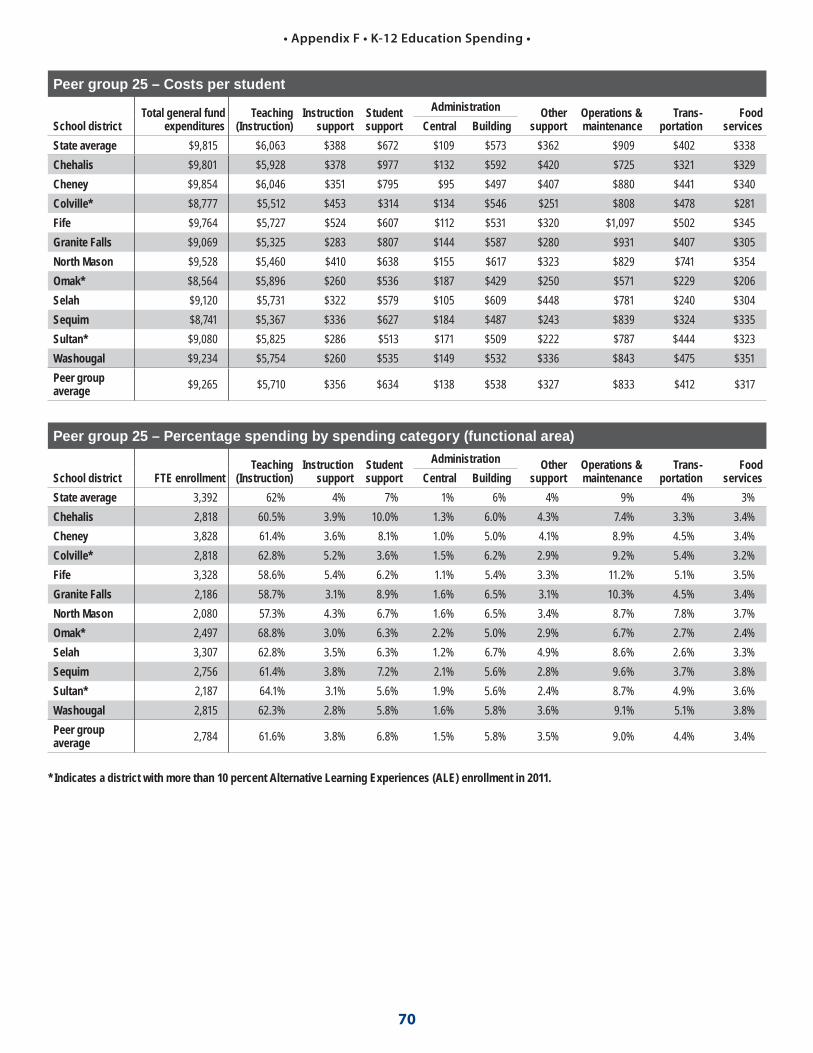
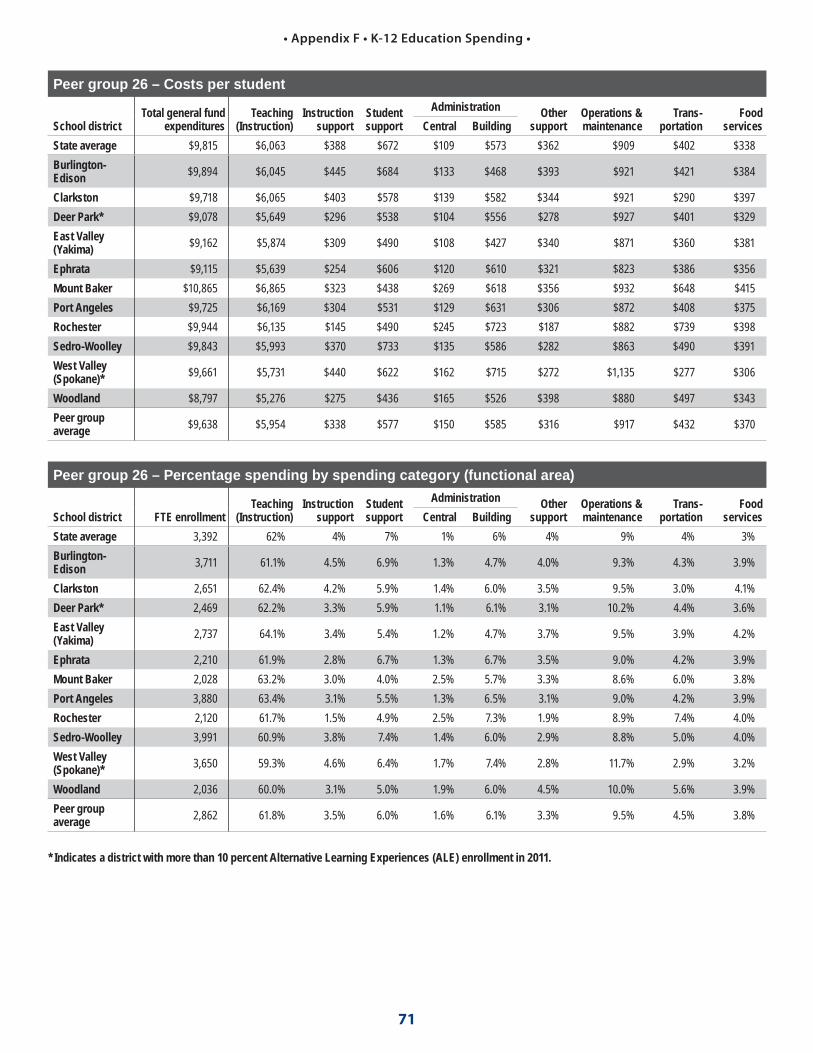

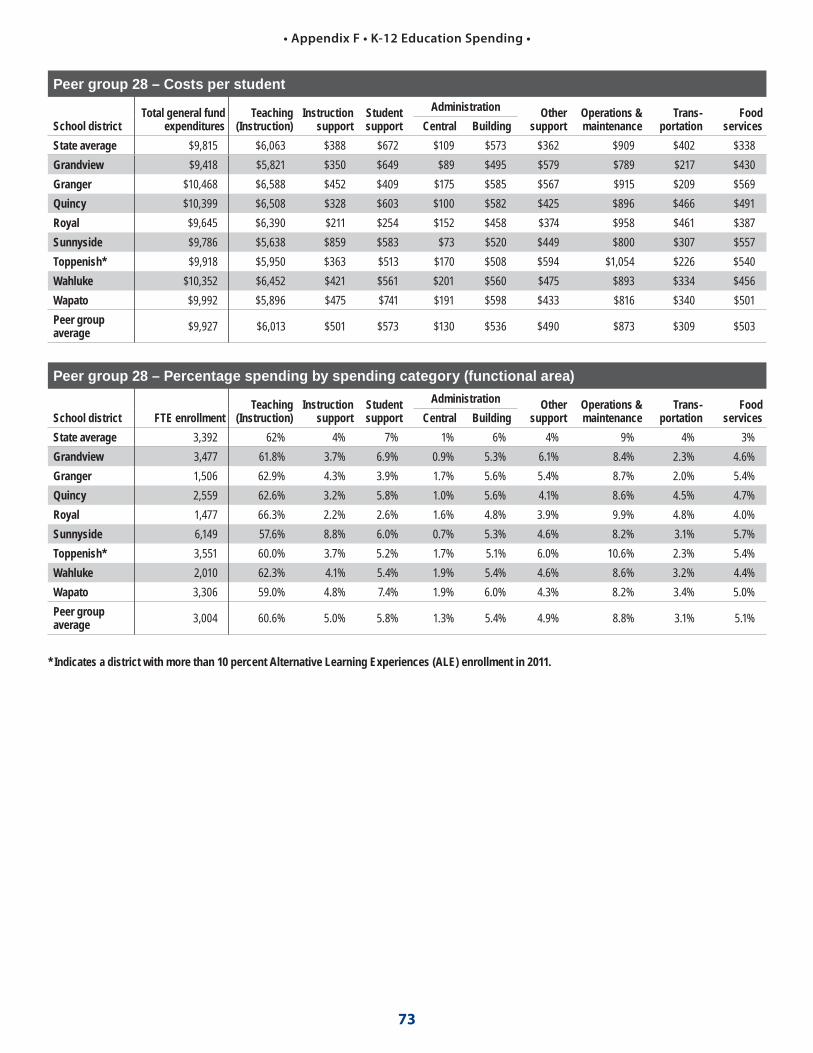
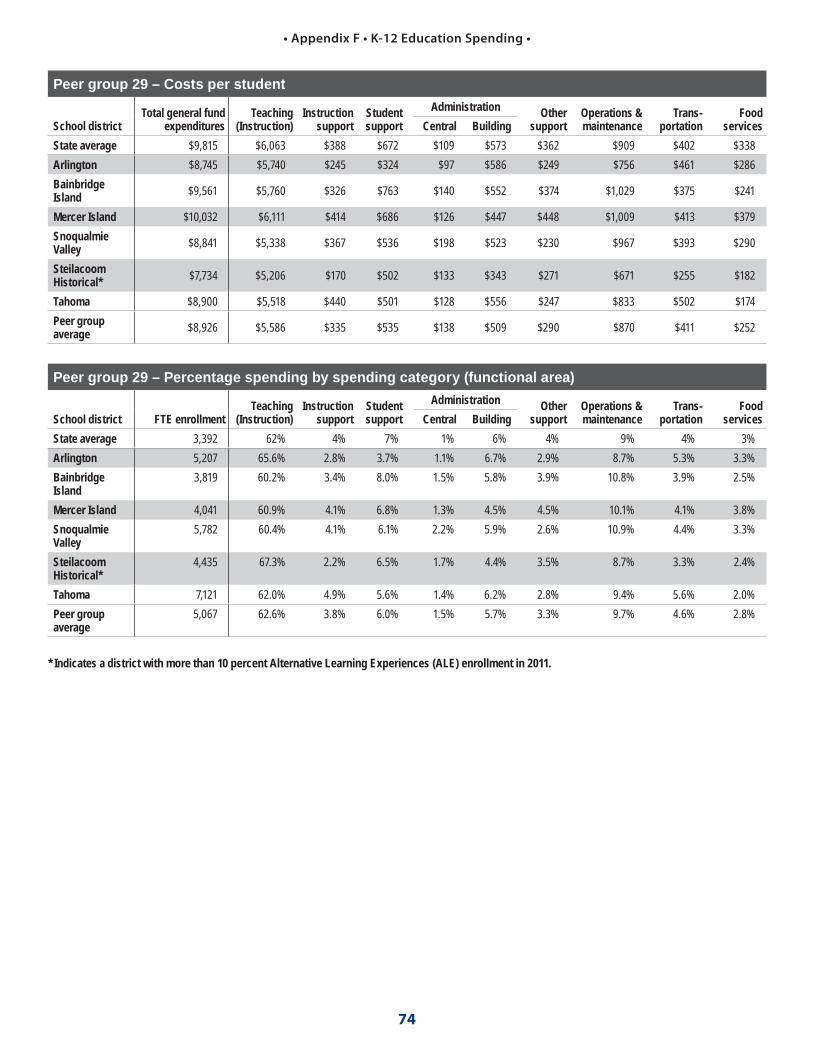
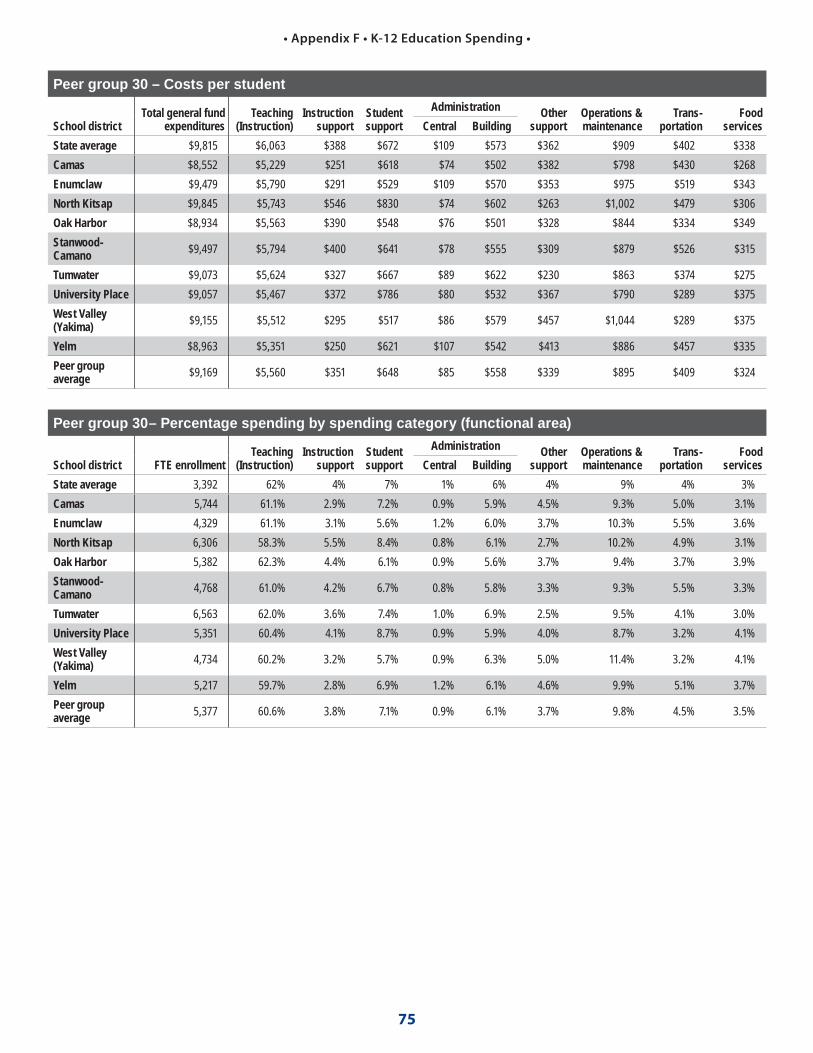
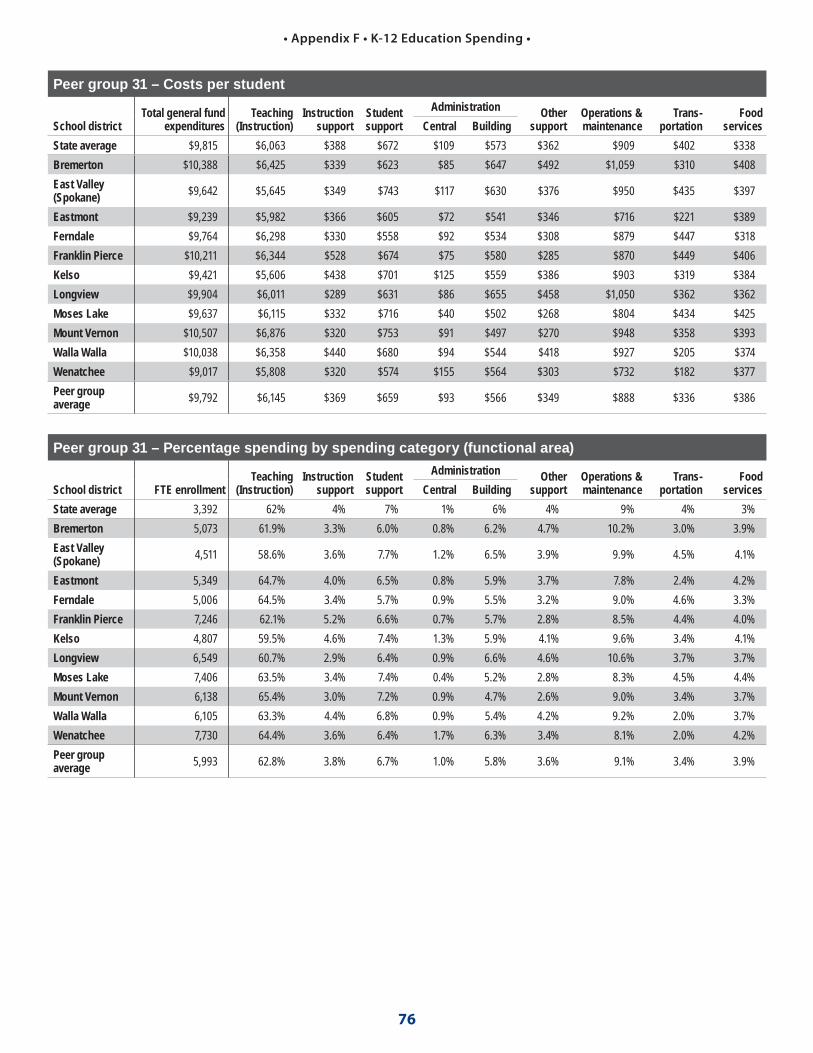

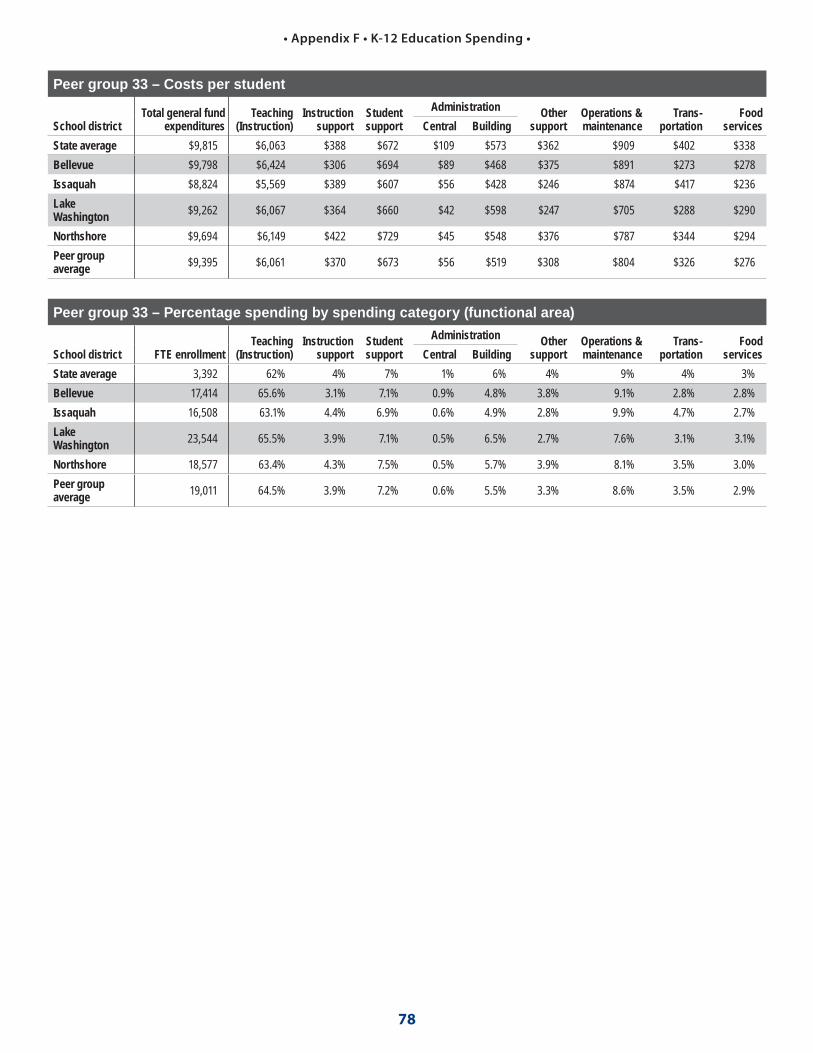
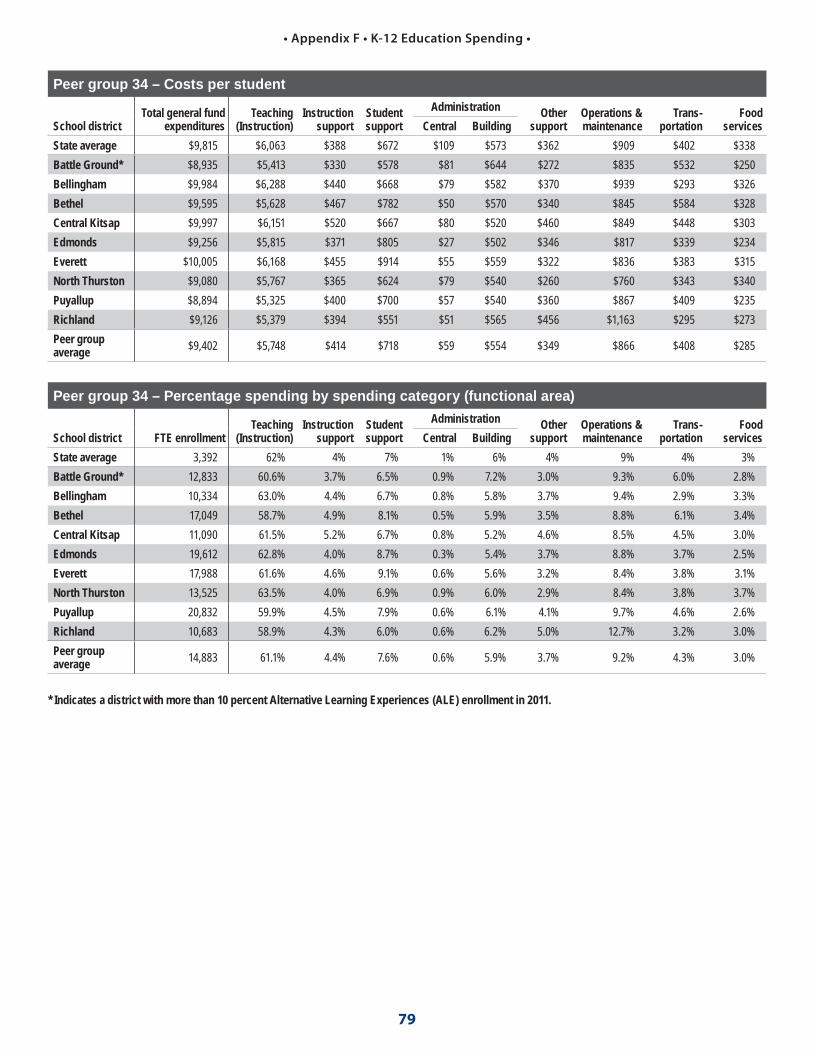
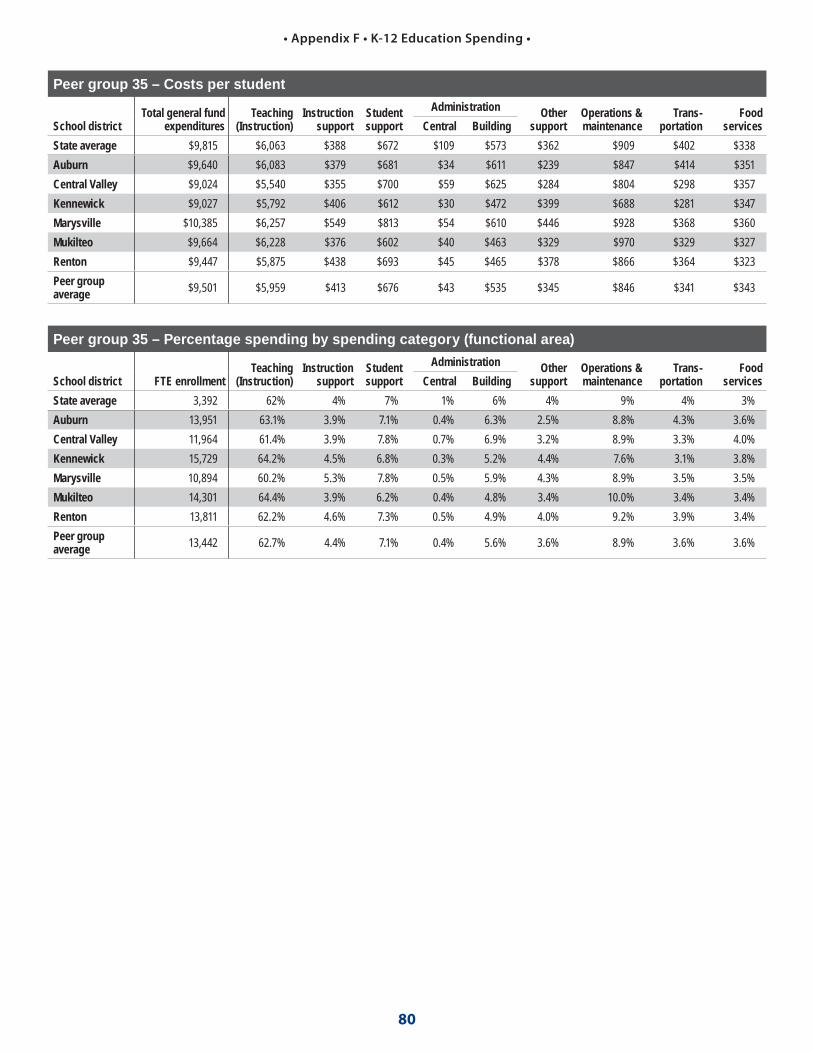


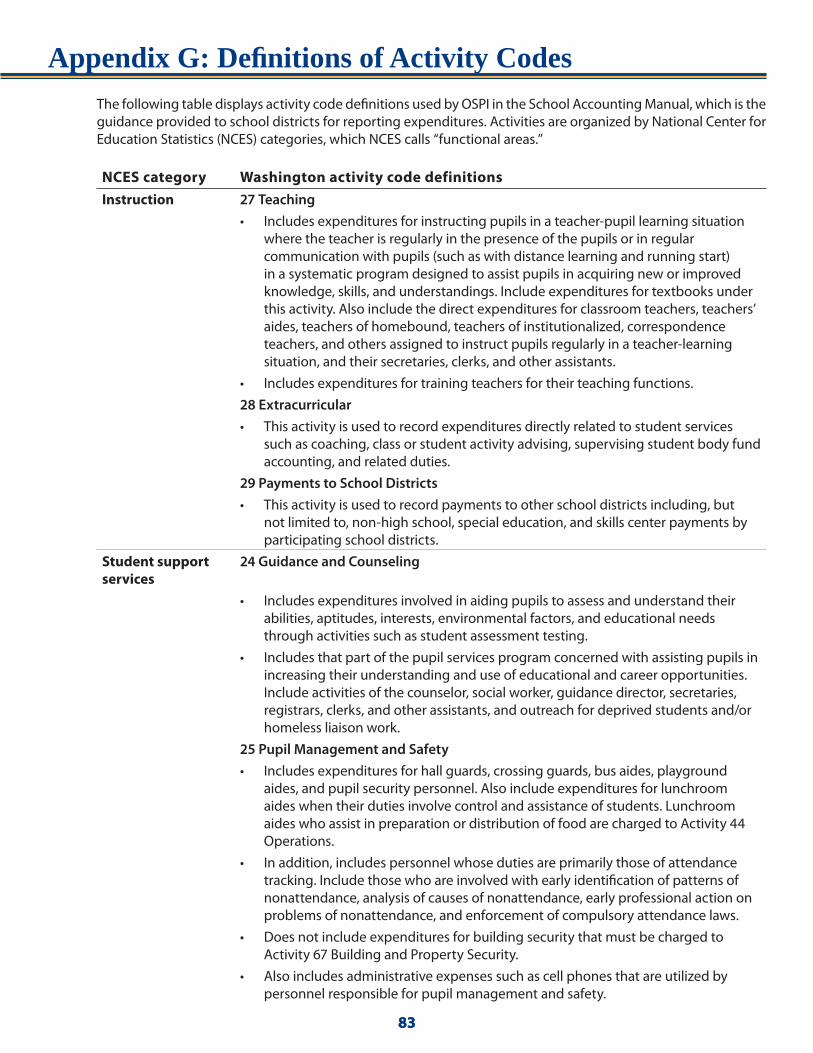

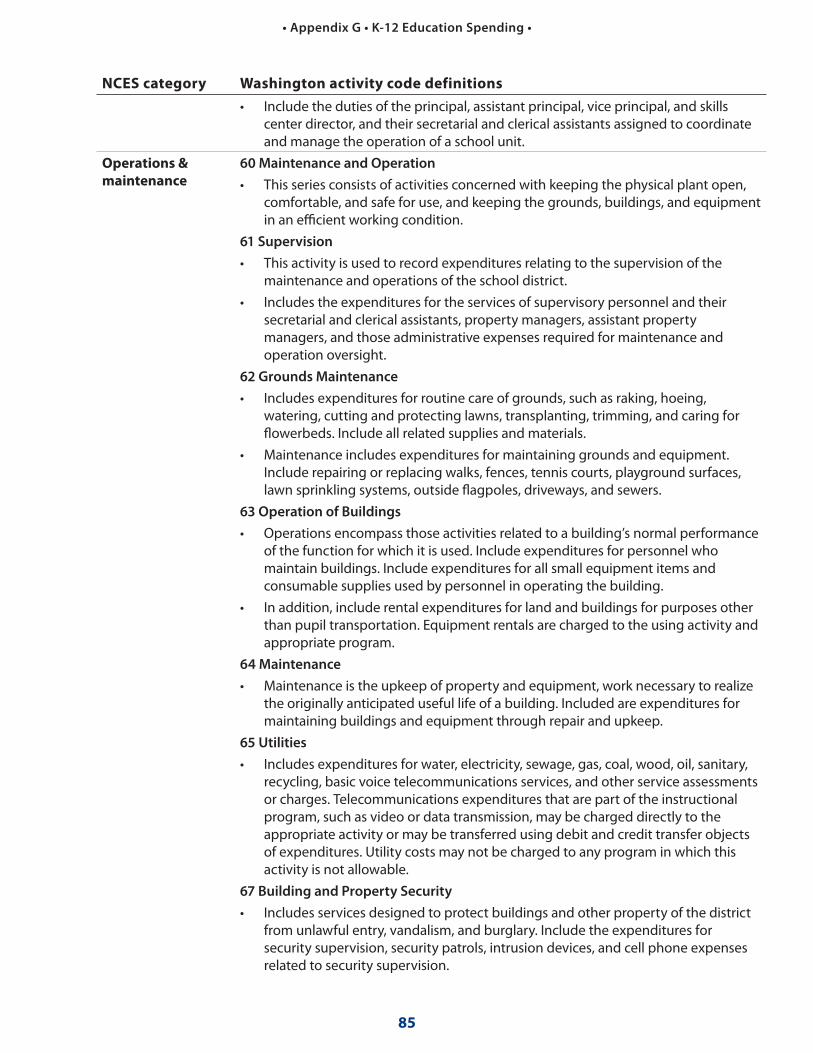

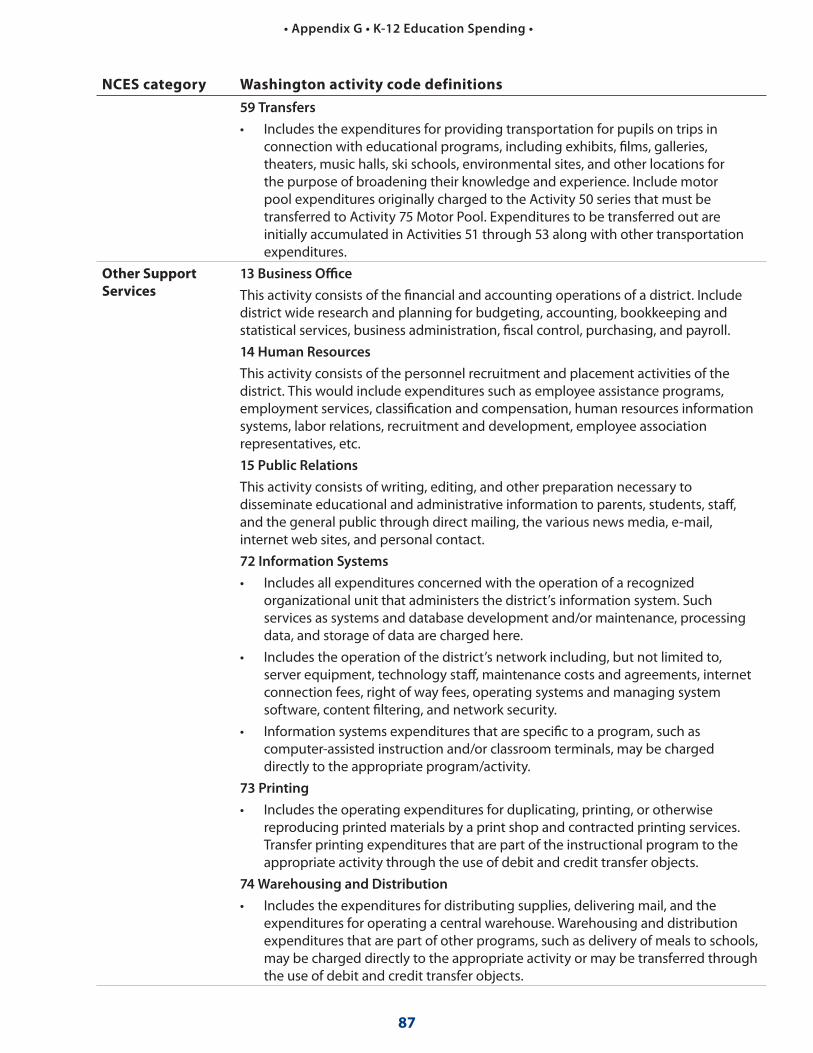
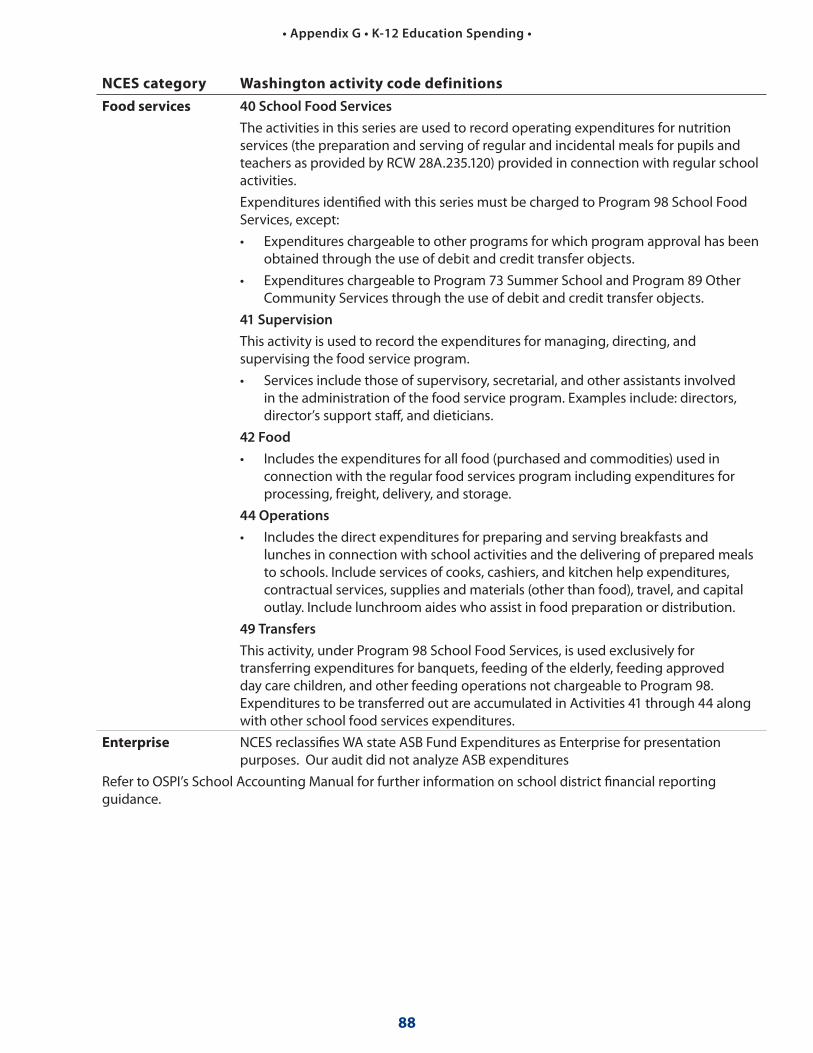


![Financial Statements with Independent Auditor’s Report ar15... · Independent Auditor’s Report For the year ended December 31, 2015. mpoer T [page 38] The Directors present their](https://static.documents.pub/doc/80x56/5b582ba57f8b9ad0048b86b4/financial-statements-with-independent-auditors-report-ar15-independent.jpg)


