State Capitalism in China 19 State Capitalism in China Yasheng Huang 1 O ne way to characterize Chinese economy today is that it is an econom- ic system rooted in “state capitalism.” However, this characterization is not without controversy, both about whether the characterization is valid factually and/or whether the characterization entails prescriptive value for policy. On the more positive spectrum, Ian Bremmer, in a widely circulated article published in Foreign Affairs, entitled “State Capitalism Comes of Age: e End of the Free Market?” argued that the 2008 financial crisis exposed the Achilles heels of the free market system and that state capitalism was the correct antidote to excesses of capitalism. In this article as well as in his book, e End of the Free Market: Who Wins the War Between States and Corporations?, Bremmer went fur- ther and argued that state capitalism was not just an anti-cyclical tool but also a source of China’s long-run economic boom. In recent years, Nicholas Lardy has offered one of the most forceful rejections of the view that Chinese growth resulted from the state capitalism model. In his book, Markets Over Mao, Lardy shows and argues that Chinese growth has fol- lowed a path similar to other successful economies—an overwhelming reliance on the private sector and an expansion of the market economy. He has also rejected the view that state capitalism is an empirically accurate characterization of Chi- nese economic strategy. He argues that reforms in China have been unidirection- ally linear—toward more privatization and market economy. In this essay, I will put forward the view that state capitalism is indeed an em- pirically accurate characterization of Chinese economy today but that, contrary to the claims posited by Bremmer, state capitalism is the source of many structural problems in the Chinese economy today, such as its unsustainably high level of investment, massive and most likely increasingly unproductive accumulation of 1 Yasheng Huang was the 2015 Miller Upton Scholar and is the International Program Professor in Chinese Economy and Business and a Professor of Global Economics and Management at the MIT Sloan School of Management. He is also an Associate Dean at MIT Sloan School of Management.
Transcript
State Capitalism in China 19
State Capitalism in ChinaYasheng Huang1
One way to characterize Chinese economy today is that it is an econom-ic system rooted in “state capitalism.” However, this characterization is not without controversy, both about whether the characterization is
valid factually and/or whether the characterization entails prescriptive value for policy. On the more positive spectrum, Ian Bremmer, in a widely circulated article published in Foreign Affairs, entitled “State Capitalism Comes of Age: The End of the Free Market?” argued that the 2008 financial crisis exposed the Achilles heels of the free market system and that state capitalism was the correct antidote to excesses of capitalism. In this article as well as in his book, The End of the Free Market: Who Wins the War Between States and Corporations?, Bremmer went fur-ther and argued that state capitalism was not just an anti-cyclical tool but also a source of China’s long-run economic boom.
In recent years, Nicholas Lardy has offered one of the most forceful rejections of the view that Chinese growth resulted from the state capitalism model. In his book, Markets Over Mao, Lardy shows and argues that Chinese growth has fol-lowed a path similar to other successful economies—an overwhelming reliance on the private sector and an expansion of the market economy. He has also rejected the view that state capitalism is an empirically accurate characterization of Chi-nese economic strategy. He argues that reforms in China have been unidirection-ally linear—toward more privatization and market economy.
In this essay, I will put forward the view that state capitalism is indeed an em-pirically accurate characterization of Chinese economy today but that, contrary to the claims posited by Bremmer, state capitalism is the source of many structural problems in the Chinese economy today, such as its unsustainably high level of investment, massive and most likely increasingly unproductive accumulation of
1 Yasheng Huang was the 2015 Miller Upton Scholar and is the International Program Professor in Chinese Economy and Business and a Professor of Global Economics and Management at the MIT Sloan School of Management. He is also an Associate Dean at MIT Sloan School of Management.
20 The Annual Proceedings of the Wealth and Well-Being of Nations
debt and the lackluster growth of labor income (relative to GDP growth). This ac-count of the Chinese economy contradicts both the normative account provided by Bremmer as well as the positivistic account provided by Lardy.2
At least in terms of policy rhetoric, the Chinese policy makers have signaled at least some willingness to rethink the viability of the prevailing state capitalism model. However, the policy rhetoric has not been matched with actual policy actions. An indication of this ambiguity is the much heralded communique of the Third Plenum of the 18th Party Congress, issued in November 2013. The communique, which is the programmatic platform of the Chinese Communist Party, signaled two somewhat conflictual policy goals: 1) the Chinese Communist Party (CCP) believes that the current configuration of Chinese economic system, i.e., state capitalism, requires some substantial retooling and revamping, and 2) the CCP has ruled out reforming or attenuating the two institutional pillars of state capitalism—namely the ownership arrangements of SOEs and the political monopoly of the CCP. The intellectual debates about the utility of state capitalism among the CCP leaders appear to be largely behind us; the remaining issue is one of tactics and political will—how to reform state capitalism while preserving the fundamental institutional pillars of state capitalism.
This essay argues that state capitalism has been detrimental to China’s bal-anced and broadly-based socioeconomic developments and to China’s growth prospects. The essay does so in three steps. First, it shows that China today is still a fundamentally state-capitalistic economy. Second, it shows the trajectory of state capitalism over the past three decades. In particular, the essay shows that China’s initial takeoff in the wake of rural reforms of the late 1970s followed a directional shift toward entrepreneurial capitalism. Sometime in the mid-1990s, the country made another directional shift, this time toward the version of state capitalism that characterizes the Chinese economy today.
The most important takeaway of this part of the discussion is twofold. One is that the ascendancy of state capitalism predated the 2008 financial crisis (by a long shot). A popular view among both China economists and outside analysts is that the 2008 financial crisis pivoted China toward state capitalism. This is
2 I have proposed this way of looking at Chinese economy more expansively elsewhere. In my book, Capitalism with Chinese Characteristics, I showed that policies of state capitalism have tended to correlate strongly with relatively sluggish household income growth, especially income growth of rural households compared to GDP growth. Journal of Economic Perspectives published a shorter summary of the main arguments in the book. See Huang (2008) and (2012).
State Capitalism in China 21
wrong. The year 2008 marked an acceleration of state capitalism, not its origin. The right way to view the 2008 version of state capitalism—“State Capitalism 2.0”, if you will—is that it was based on an existing institutional apparatus that was some 10 to 13 years in the making already. In other words, both the scale and microeconomic tools of the state capitalism 2.0—in Chinese often referred to as “advancing of the state and the retreat of the private sector”—implemented since 2008 required a strong bureaucratic and funding platform (such as State-owned Assets Supervision and Administration Commission or SASAC and State De-velopment Bank). That platform was not constructed post 2008 but long before 2008. SASAC was formally established in 2003, having been amalgamated from many government agencies that were established in the mid-1990s (See Wang, Guthrie, and Xiao, 2012). The State Development Bank was established in 1994.
The second takeaway of this discussion is that there has been considerable heterogeneity with respect to the directional characteristics of Chinese economy. I stress the word “directional” to underscore an often neglected point that it is the change, not the level, that explains variables such as growth and/or broad socio-economic developments.
The third section of this essay argues that state capitalism is unsustainable, economically, politically and environmentally. I single out two issues for empha-sis. One is the relatively lackluster growth of personal income relative to GDP growth; the other is the increasingly problematic structure of the Chinese macro-economy that is investment heavy and consumption light. These two features of the Chinese economy are closely related to each other.
At least there is now probably an abstract recognition of the huge downside of state capitalism among China’s ruling elites. The evidence so far suggests that the Xi Jinping leadership is willing to announce ambitious but vague and extremely long-term reform objectives but is equally willing to preserve the fundamental pillars of state capitalism. The reforms the Xi leadership has already implemented have been extraordinarily incremental and granular. They amount to baby steps that have the effect of “reversing the reversals,” i.e., reversing some of the reform reversals by the Hu Jintao leadership. While returning China to the status quo ante (i.e., 2002) should not be equated with true market reforms, the effects of the Xi leadership so far have largely been either neutral on or marginally detrimental to reforms. The concluding section discusses this and related issues.
22 The Annual Proceedings of the Wealth and Well-Being of Nations
The “State” of State Capitalism Today
Analysts who argue that China today is not state-capitalistic point to the private sector’s large and growing shares of total output and employment. In his book, Markets over Mao, Nicholas Lardy (2013 pp. 72) shows that the private sector as of 2011 accounted for 74% of industrial output value. He also shows that net employment has been generated entirely in the private sector. The sta-tistics cited by Lardy are meant to support his optimistic view that China today has a vibrant private sector and that China’s growth prospects are robust due to its private sector.
Whether Lardy is right or wrong critically depends on what benchmarks we apply to China. Lardy, as many other analysts, takes China in 1978—the year when China began its economic reforms—as the benchmark. Compared to that benchmark—China at that time did not have any private sector at all—74% of industrial output value is indeed substantial. But it is important to note that the issue under debate here is not whether China is still a communist, central-ly planned economy. It is clearly not a Soviet-type centrally planned economy. The issue here is whether China is a heavily state-controlled economy with many shared characteristics of the commanding-heights economies of the 1970s and the 1980s’ vintage (Yergin and Stanislaw, 2002).
By the benchmark of commanding-heights economies, the size of the private sector in China is unremarkable. In a 1995 study, the World Bank (1995) tracked the production and control roles of the state in much of the developing world (outside of the communist countries). What is revealing from the data in that report is that even some of the most statist economies in the world at that time, such as Tanzania, Brazil, India, and Congo, had private sector output shares in excess of 80% of GDP. All had private sector employment shares in excess of 90% of total employment. These figures easily exceed the most optimistic estimates of the size of the private sector in China today.
None of these statist economies from the 1970s and the 1980s turned out to be successful economic performers in the long run. This is an important lesson from history. A large private sector is most likely to be a necessary but not a suf-ficient condition for economic success. All successful economies in history have been primarily private-sector and market-driven. Not a single centrally planned economy has ever succeeded in attaining high income status and a living standard comparable to that of the West. The sheer size of the private sector, however, is
State Capitalism in China 23
not a sufficient condition for long-run economic growth and development. There are other factors at work, such as how competition among firms is structured, the basic orientation of the financial system, the role of innovations in growth, and the extent of the de jure and de facto constraints on the power of the government. In my ongoing book project, I use “quantity of capitalism” to describe the size of private sector and “quality of capitalism” to describe the textured relationships between market and firms and between political and economic controls in an economy.3 China today has quantity of capitalism, but so did Brazil and India of the 1980s. History is clear on quantity of capitalism—it is not enough to get a country to high income.
The second issue has to do with the statistical complications of how to classify the Chinese private sector. Lardy accepted the Chinese definition of the private sector at its face value, but as anyone who works on this topic knows, defining the private sector in China today is fiendishly hard. The reason is that the right definition of private or statist nature of an entity does not or should not entirely rest on the revenue rights –the rights to receive dividends from the operations of the owned entity--of this entity but on the control rights of this entity—the rights to hire and fire top management and dispose of owned entity. Two complications ensue. One is that we have more information on the revenue rights of Chinese firms than we do on the control rights. We have information on equity ownership by state, legal-person entities, and private shareholders in a dataset widely-used by economists, the National Bureau of Statistics’ (NBS) Census of Industrial Firms. But the Chinese government does not disclose information on who actually con-trols these firms.
The second complication is that it is a hazardous exercise to infer control rights from the information on revenue rights. For one, we do not know what the control threshold is for an average Chinese firm. Is 51% equity necessary for the state to establish controls or 10%? Indeed is 0% by the state sufficient to nullify state controls? Many completely private firms have established branches of the Chinese Communist Party (CCP) as is mandated by law, and we do not have enough information to know whether establishing these branches has an effect on the operating decisions of the nominally private-sector firms. For the other, we have very little information about who actually controls many of the holding
3 This book project extends and updates my 2008 book, Capitalism with Chinese Characteristics and traces the rise of and speculates on the future of state capitalism in China.
24 The Annual Proceedings of the Wealth and Well-Being of Nations
companies that have equity claims on those firms for which we do have data on equity ownership. We must know whether these holding companies themselves are state-controlled before we can make any meaningful statements about the ownership nature of their subsidiaries. For any analyst to be able to assert confi-dently that Chinese economy is 65% or 75% private today presumes an amount of knowledge that simply does not exist.
To reconcile the discrepancies resulting from various and competing defi-nitions of private firms, in what follows, we present estimates based on a set of metrics that approximate a firm’s control rights, however imperfectly. Control rights refer to the rights to appoint managers, dispose of assets, and set the stra-tegic direction of the firm and in the context of the Chinese SOEs, these two sets of rights often do not overlap. The government can exercise substantial control rights over firms over which its revenue rights are minimal. Control rights are more meaningful measures of firms’ ownership than revenue rights. An opera-tional difficulty in applying this definition, however, is that it is not easy to know whether a firm’s control rights are private or governmental. An early attempt to get at this question is a paper by Dougherty and Herd (2005), two economists working at OECD. This essay follows their approach but with one substantial variance about an important assumption that Dougherty and Herd (2005) made in their estimation. That assumption has to do with the ambiguity of classifying a type of firms in China known as “legal-person shareholding firms” (subsequently abbreviated as LPS firms). It turns out that the estimates by Dougherty and Herd (2005) are extremely sensitive to the assumption we make about LPS firms.
Dougherty and Herd’s paper is based on a unique dataset compiled by the National Bureau of Statistics (NBS) that covers over 160,000 industrial firms in China between 1998 and 2005. The dataset contains fairly detailed breakdowns of the ownership structure of firms. One caveat, however, is that the NBS dataset is biased toward large firms—defined as those with at least five million yuan in sales (or about $750,000, a cutoff for medium-sized firms in the Chinese con-text). We should keep in mind that the estimates based on this dataset reflect the private share of the industrial value-added produced by the large and medium firms in China, not the private share of the entire industry.
The classification methodology adopted by Dougherty and Herd (2005) in-volves two steps. First, they divide firms into state and non-state firms. State firms in turn comprise two types of firms: SOEs and collective firms in which the collec-tive share capital exceeds 50 percent. The second step is to classify all those firms
State Capitalism in China 25
in the non-state category as those with more than 50 percent of share capital held by legal person entities, individual investors, and foreign firms. This definition is broadly consistent with the definition used in Lardy’s estimates. Dougherty and Herd conclude that the private economy accounted for 28.9 percent of industrial value-added in 1998, 52.3 percent in 2003, and 71.2 percent in 2005,4 -- quite close to Lardy’s (2013 pp. 72 and 75) more recent estimates.
The OECD economists assign the entire output by legal-person shareholding firms to the private sector. Is this a reasonable approach? Getting this question right is critical. In 1998, legal-person shareholding firms accounted for 40 per-cent (11.3 percent/28.9 percent) of the purported private sector. Excluding these firms would reduce the share of the private sector in industrial value-added from 28.9 percent in 1998 to only 17.6 percent (28.9 percent minus 11.3 percent). For 2005, the private sector exclusive of legal-person shareholding firms would be 39.8 percent rather than 71.2 percent (71.2 percent minus 31.4 percent). Getting this detail right really matters. The difference is on the order of 40 percent.
LPS structure refers to cross-shareholding by firms. Probably because of the connotations of this term, the OECD economists might have assumed that le-gal-person shareholding implies that China has a keiretsu arrangement similar to that in Japan where firms own each others’ stocks. The difference with Japan, however, is that in China much of the legal-person share capital originates in the state sector, i.e., SOEs establishing or holding significant equity stakes in other firms. These firms then become affiliates or subsidiaries of the SOEs. The subsid-iaries of the SOEs, on account of their final control rights are still SOEs.
One way to learn more about these legal-person shareholding firms that the OECD study classified as private is to check their names. Such an exercise would have immediately revealed that many of the LPS firms are among the best-known and quintessential SOEs in China. They include subsidiaries of Daqing and Da-gang oil-fields, owned and operated by two of China’s largest SOEs. Daqing is owned by PetroChina, and Dagang is owned by China National Petroleum Cor-poration (CNPC). The list also includes subsidiaries of NORINCO, a large de-fense product firm. PetroChina, CNPC, and NORINCO are not only SOEs; they are known as central SOEs directly supervised by the State Council. In fact, some of these firms have the word “state-owned” in their names.
4 Dougherty and Herd (2005) only have estimates up to 2003 but I extended their methodology to data for 2005.
26 The Annual Proceedings of the Wealth and Well-Being of Nations
Another well-known SOE on the list classified by the OECD study as private is SAIC Motor Corporation Limited (SAIC Motor). In the NBS dataset, the state share of SAIC Motor’s share capital structure is 0 percent. It is 70 percent legal-person shareholding and 30 percent individual shareholding. So this firm qualifies as a private firm in the OECD definition. But SAIC Motor is not even remotely a private firm. SAIC Motor was established in 1997; its predecessor was Shanghai Gear Factory. In 1997, 30 percent of the share capital was issued on the Shanghai Stock Exchange and the rest of the share capital was held by Shanghai Automotive Industry Corporation (SAIC), which is 100 percent owned by the Shanghai government. Because the Shanghai government owns SAIC Motor via SAIC—a legal-person shareholder—the state share capital is reduced to zero, but from a control perspective, there is little question who controls this firm.
The high concentration of the ownership structure of the legal-person share-holding firms is another sign that these firms are not private at all. In the NBS dataset, SAIC Motor has the most dispersed shareholding structure among the legal-person shareholding firms with 30 percent of its shares owned by individuals (This is because the firm is listed on the Shanghai Stock Exchange.) In contrast, of 16,871 legal-person shareholding firms in the NBS dataset for 1998, 75 percent have no ownership by individuals. For the entire sample, individuals only account for 3.7 percent of total outstanding shares. This is entirely expected given the heavily accounting nature of the SOE reforms. As evidence, 7,612 of these so-called legal-person shareholding firms are actually factories—i.e., they are simply production subsidiaries of other SOEs. This explains the extraordinary concentra-tion of ownership and control of these firms.
The exercise above to decompose Chinese private-sector firms into more granular ownership categories focuses on the division of output between the state and private sectors. Another complementary approach is to examine the inputs that go into SOEs and private sector. The output measure tells about the size of the private sector in the Chinese economy but it has also been used by many economists as a short-hand indicator of the policy treatment of the private sector. This second application of the measure is fraught with methodological problems.
The biggest problem is that the measure incorporates two effects. One is the policy effect of policy liberalization; the other is the firm-level effect having to do with the relative efficiency differences between private firms and other types of firms. Suppose one observes the rise of private share of output over time (as we have seen happening in China). On that basis, can we draw the conclusion
State Capitalism in China 27
that government policy toward the private sector has become progressively more liberal over time?
The source of interpretational ambiguity is that we do not know the relative importance of these two effects. One is policy liberalism and the other is the firm-level efficiency. It is entirely plausible that the private share of output can rise without any policy liberalization. Private firms are more efficient than SOEs and therefore they generate more value-added per unit of inputs—labor and/or capital—deployed. A rise in the output shares of private firms over those of SOEs can happen without any improvement in policy environment so long as private firms are more efficient than SOEs.
We can cite two examples to demonstrate this dynamic. In 1989, in the wake of Tiananmen crackdown, the newly ascendant political conservatives strength-ened central planning and arrested many private entrepreneurs. (During the demonstration, private entrepreneurs donated food and money to protesting stu-dents.) Yet in 1990, the output ratio of the private sector relative to the SOEs still increased. Clearly, this rising ratio had nothing to do with policy liberalization. Another example comes from the former Soviet Union. No one accuses Leonid Brezhnev of being pro-market, but under his leadership, private plots contributed half of agricultural household income in the Soviet Union: private farming was so much more efficient than the state farming that its contributions to income were disproportionate to the inputs allocated to it. Private plots only accounted for 1.4% of cultivable land in the Soviet Union.5
This Soviet example shows that input, not output, is a more reliable measure of private-sector policies. The most relevant input measure is capital allocation and specifically capital allocation to fund fixed asset investment activities of firms. Fixed asset investment activities are a policy measure for a simple reason: They are tightly controlled by the state, and throughout the reform era, this control has not abated. While there is an issue about whether this control rests with the central government or with the local governments, that fixed asset investment is state-controlled is not in doubt.
There is a great deal of economic evidence that the governmental control of the investment process has remained substantial during the reform era. A telling piece of evidence, as marshaled by Tom Rawski, is that China’s seasonal investment cycles matched almost perfectly those prevailing during the centrally-planned era.
5 I detailed this example in Huang (2008).
28 The Annual Proceedings of the Wealth and Well-Being of Nations
Since fixed asset investment is a large component of China’s GDP, the fluctuations of investment levels have a substantial impact on GDP. Here Rawski (2001a) shows that China’s quarterly GDP growth patterns differed substantially from those in South Korea, Taiwan and Hong Kong, an indication that factors such as weather or traditional Chinese holidays are not the principal determinant of Chi-na GDP’s seasonal rhythm. Rawski (2002 pp.368) quotes a Chinese economist in his overall assessment of Chinese investment process:
Many basic components of a pure market economy are still in their incipient stage in China, although market-oriented reform started two decades ago. Gov-ernment-guided investment mechanisms, a state-controlled banking system and dominant state-owned enterprises…still run in a framework molded primarily on the previous planned economy.
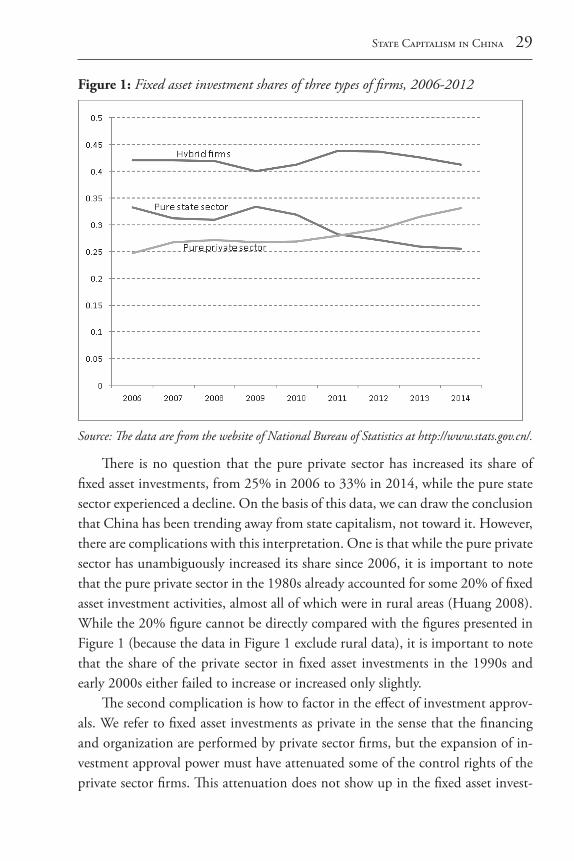
If anything, until 2012 or so, the Chinese state has further centralized in-vestment approval authority. So fixed asset investment allocation is still a reliable indicator of the division of control between the state and private sectors. So how large is the fixed asset investment share of the state sector? Figure 1 shows the fixed asset investment shares of three types of firms, pure state, mixed ownership and pure private, during the period from 2006 to 2014. (Data were downloaded from the website of the National Bureau of Statistics, http://www.stats.gov.cn/.) Pure state refers to traditional SOEs that are registered as SOEs or as collective firms. Pure private refers to de jure private firms registered legally as private firms or as individual proprietorships. Mixed ownership refers to three types of firms: joint-ownership firms, various types of shareholding firms, and unclassified firms. (There is also a fourth category, foreign-invested enterprises or FIEs, but for the purpose of this discussion FIEs are excluded as the essay focuses on domestic firms.)
State Capitalism in China 29
Figure 1: Fixed asset investment shares of three types of firms, 2006-2012
Source: The data are from the website of National Bureau of Statistics at http://www.stats.gov.cn/.
There is no question that the pure private sector has increased its share of fixed asset investments, from 25% in 2006 to 33% in 2014, while the pure state sector experienced a decline. On the basis of this data, we can draw the conclusion that China has been trending away from state capitalism, not toward it. However, there are complications with this interpretation. One is that while the pure private sector has unambiguously increased its share since 2006, it is important to note that the pure private sector in the 1980s already accounted for some 20% of fixed asset investment activities, almost all of which were in rural areas (Huang 2008). While the 20% figure cannot be directly compared with the figures presented in Figure 1 (because the data in Figure 1 exclude rural data), it is important to note that the share of the private sector in fixed asset investments in the 1990s and early 2000s either failed to increase or increased only slightly.
The second complication is how to factor in the effect of investment approv-als. We refer to fixed asset investments as private in the sense that the financing and organization are performed by private sector firms, but the expansion of in-vestment approval power must have attenuated some of the control rights of the private sector firms. This attenuation does not show up in the fixed asset invest-
30 The Annual Proceedings of the Wealth and Well-Being of Nations
ment data. The other pattern in Figure 1 is the clear importance of mixed ownership
firms. Whether the private sector is judged as small or big substantially rests on how we assign the ownership rights of the mixed ownership firms. The largest category of mixed ownership firms are shareholding firms. They account for about 70% of the fixed asset investment activities in this category. It is entirely possible that some and even most of the mixed-ownership firms are closely controlled by the state and their control rights are fundamentally statist. There are two principal types of shareholding firms under Chinese corporation law. One basically consists of SOEs that have been “corporatized,” i.e., they have been given a shareholding organizational form. This is known as state wholly owned firms. In terms of own-ership, there is little difference between these firms and traditional SOEs. The sec-ond principal category consists of those firms that have issued shares on China’s two main stock exchanges in Shanghai and Shenzhen.6 (There are also exchanges for small-cap firms but these were established only in recent years. The firms listed on those exchanges are primarily private.) According to an article on Xinhuanet, an official website, cumulatively between 1990 and 2003, only 6.97 percent of the firms that issued IPOs on these two stock exchanges were private sector firms. The rest are SOEs that have issued minority shares.7 While there have been more listings of private-sector on the two main exchanges since 2003, the vast majority of the listed firms are unquestionably state-owned and/or state-controlled.
Assigning the entire mixed-ownership firms to either state sector or to pri-vate sector would lead to estimation biases in opposite directions. One simple approach is to assign 50% of the fixed asset investments by the mixed-ownership firms to state and private sector each. This methodology would yield an estimate of the private-sector share of fixed asset investments around 45% for 2006 and 51% as of 2014. To provide a benchmark, in 1983, at the height of the “License Raj,” the private sector in India accounted for 58% of fixed asset investments (World Bank, 1989). China today is more state capitalistic than India of the In-dira Gandhi era.
6 There is also a third category of shareholding firms known as shareholding coops but under the Chi-nese statistical conventions they are grouped together with collective firms. 7 See http://www.baidu.com/s?cl=3&wd=http://news.xinhuanet.com/stock/2004-09/07/content_1952118.htm.
State Capitalism in China 31
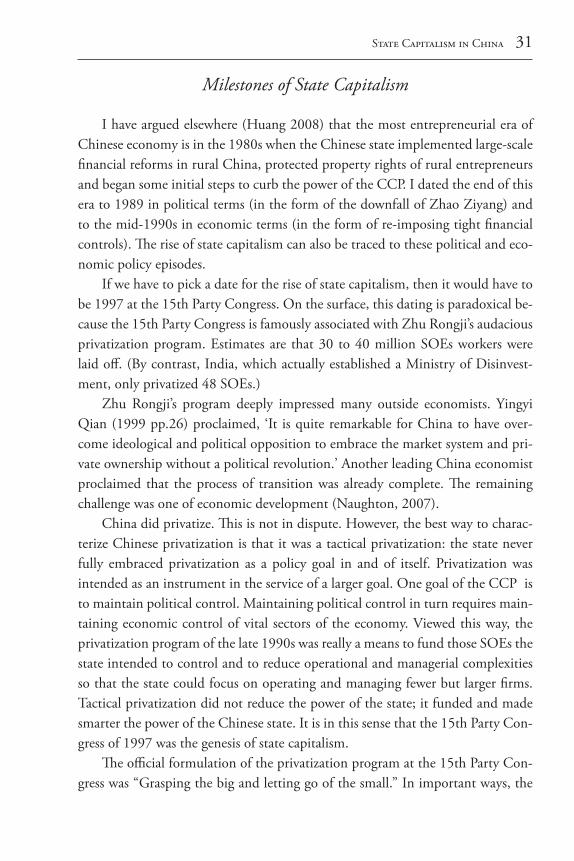
Milestones of State Capitalism
I have argued elsewhere (Huang 2008) that the most entrepreneurial era of Chinese economy is in the 1980s when the Chinese state implemented large-scale financial reforms in rural China, protected property rights of rural entrepreneurs and began some initial steps to curb the power of the CCP. I dated the end of this era to 1989 in political terms (in the form of the downfall of Zhao Ziyang) and to the mid-1990s in economic terms (in the form of re-imposing tight financial controls). The rise of state capitalism can also be traced to these political and eco-nomic policy episodes.
If we have to pick a date for the rise of state capitalism, then it would have to be 1997 at the 15th Party Congress. On the surface, this dating is paradoxical be-cause the 15th Party Congress is famously associated with Zhu Rongji’s audacious privatization program. Estimates are that 30 to 40 million SOEs workers were laid off. (By contrast, India, which actually established a Ministry of Disinvest-ment, only privatized 48 SOEs.)
Zhu Rongji’s program deeply impressed many outside economists. Yingyi Qian (1999 pp.26) proclaimed, ‘It is quite remarkable for China to have over-come ideological and political opposition to embrace the market system and pri-vate ownership without a political revolution.’ Another leading China economist proclaimed that the process of transition was already complete. The remaining challenge was one of economic development (Naughton, 2007).
China did privatize. This is not in dispute. However, the best way to charac-terize Chinese privatization is that it was a tactical privatization: the state never fully embraced privatization as a policy goal in and of itself. Privatization was intended as an instrument in the service of a larger goal. One goal of the CCP is to maintain political control. Maintaining political control in turn requires main-taining economic control of vital sectors of the economy. Viewed this way, the privatization program of the late 1990s was really a means to fund those SOEs the state intended to control and to reduce operational and managerial complexities so that the state could focus on operating and managing fewer but larger firms. Tactical privatization did not reduce the power of the state; it funded and made smarter the power of the Chinese state. It is in this sense that the 15th Party Con-gress of 1997 was the genesis of state capitalism.
The official formulation of the privatization program at the 15th Party Con-gress was “Grasping the big and letting go of the small.” In important ways, the
32 The Annual Proceedings of the Wealth and Well-Being of Nations
Chinese state is far more consistent both in its pronouncements and in its policy practices than outside economists often credit. Many economists assumed that the Communist Party in 1997 endorsed a full privatization programme, when in fact the Chinese state has done exactly what it said it would do in 1997. ‘Letting go of the small’ meant that the government supported privatization of individ-ually small but numerically numerous SOEs. These are labour-intensive firms, and singling them out for privatization, with no established social protection in place, led to massive unemployment, social instability, and wrenching human costs. (Coincidentally and concurrently, the Chinese state tightened its political and security controls in order to suppress dissent.)
The idea of state capitalism is illustrated by the first part of the Chinese pri-vatization formula—‘Grasping the big’. ‘Grasping the big’ meant restructuring, consolidating, and strengthening China’s largest SOEs. ‘Letting go of the small’ is the tactic employed to ‘grasp the big’ by reducing or ending government subsidies and social liabilities which, in turn, reduced operating and managerial complex-ities. Instead of managing tens of thousands of small firms scattered around the country, the Chinese state could now focus on only a few thousand firms. Taken together ‘Grasping the big and letting go of the small’ really means a massive real-location of financial, human, and managerial resources away from the small SOEs to a handful of the largest SOEs.
For the Chinese reformers, the dilemma has been how to leverage the state’s limited and shrinking financial resources to achieve greater corporate control. The shareholding reform program was justified as a means to fortify the allocative functions and corporate control role of the state, not to weaken state control in the economy. It is difficult, if not impossible, to reconcile the official justification with the standard privatization rationale that seeks to reduce state interference in the economy and to introduce efficient management and supervision by private investors. Another inconsistency with the prevailing privatization rationale has to do with the use of the privatization proceeds. Some of the privatization pro-ceeds were used to finance investment and technology acquisition programs of the large, pillar SOEs.8 Such use of funds does not reduce the aggregate ownership role of the state in the economy; it has only changed the composition of the state’s role. It is far from clear how this manner of privatization has provided an exit
8 A number of researchers have documented instances in which local governments invested in SOEs, while at the same time divesting from smaller SOEs Cao, Qian, and Weingast (1999).
State Capitalism in China 33
option to the state.One problem with studying state capitalism is that the growth model is not
easily observable. In this section, I will try to present data showing some evidence on “discontinuity” in a number of economic indicators. Discontinuity here im-plies that there is a break in the data series that suggests the effect of concrete policy changes. The underlying assumption here is that normal economic forces and dynamics produce smooth data series whereas policy changes lead to breaks in the data series.
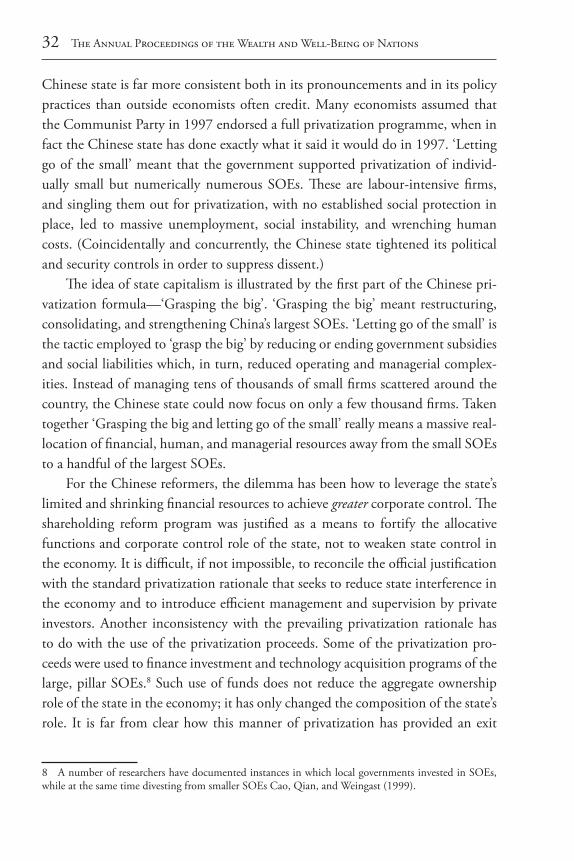
Figure 2: Gross capital formation and external balances (% of GDP), 1978-2012
Source: World Development Indicators by the World Bank
Figure 2 presents two ratios. One is gross capital formation as a percentage share of GDP; the other is external balance as a percentage share of GDP. Two patterns stand out from the graph. One is that until 1992 China invested at a high rate but it was always below 40% of GDP. This is on a par with other East Asian economies during their takeoff era, i.e. between 35% and 40% of GDP. The year 1993 marks a turning point. In that year China invested 45% of GDP, followed by three years above 40% and six years below 40%. Starting in 2003, the ratio in-
34 The Annual Proceedings of the Wealth and Well-Being of Nations
creased dramatically, to nearly 50% in the 2010s. No other country, during peace time, ever invested 50% of its GDP.
One explanation for China’s growth is that it is skillful in using undervalu-ation of its currency as a roundabout way to subsidize industrialization (Rodrik 2013). Figure 2 does not support this explanation. Until 1990, China’s external balance of trade and services—measured as percentage share of GDP—either had a deficit or a small surplus (the biggest being 2.4% in 1982). As is well known, China in the 1980s had an overvalued exchange rate and yet it was able to indus-trialize at a rapid rate. Contrast this pattern with the one since 1990. China ran trade surpluses every year except in 1993, and in 2007 its external balances were almost 8.8% of GDP, a massive number for a country the size of China. (It should be noted that since 2007 the surpluses have declined substantially.) The mercan-tilist strategy that Rodrik proposed really only applied to China since 1990 and in its extreme form, only since 2004. One has to explain why during the 1980s China was able to industrialize with an overvalued exchange rate but since 1990 it had to rely on an undervalued exchange rate to industrialize. The turn toward state capitalism, which is investment intensive and is consumption suppressing, provides a plausible explanation for this shift of these two ratios over time. Invest-ment shares of GDP correlate positively with shares of external balances of GDP.
The acceleration of investment intensity also implies a shift of growth drivers of GDP. During the less statist growth phase, the growth was driven by more broad-based, rural entrepreneurship and by light industries, such as textile and garment. During the more statist phase, the growth drivers shifted, toward heavy industries and commanding-heights sectors of the economy. It is important to distinguish a gradual economic maturation from skill-extensive growth drivers to skill-intensive growth drivers over time from one that is an outward shift of the growth drivers. The telltale evidence is whether there is a discrete discontinuity in the data series or whether there is a smooth movement of the data series.
State Capitalism in China 35
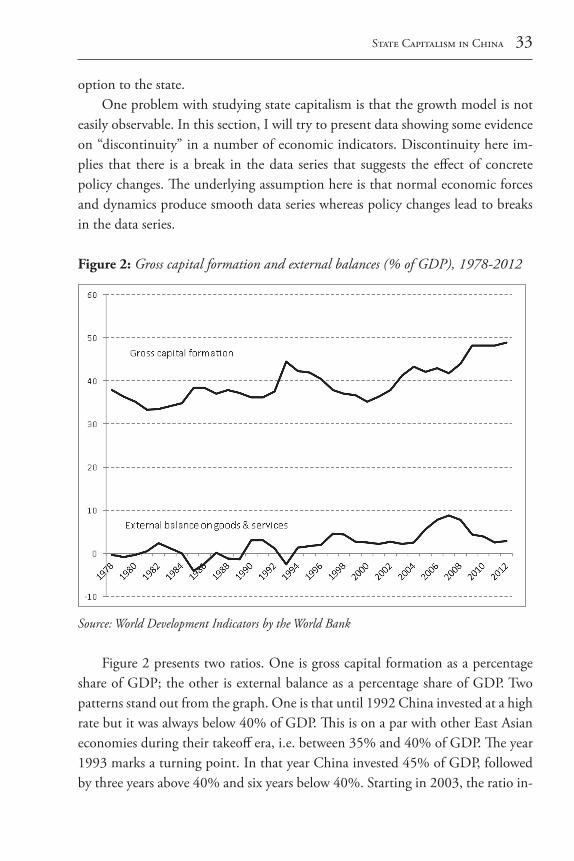
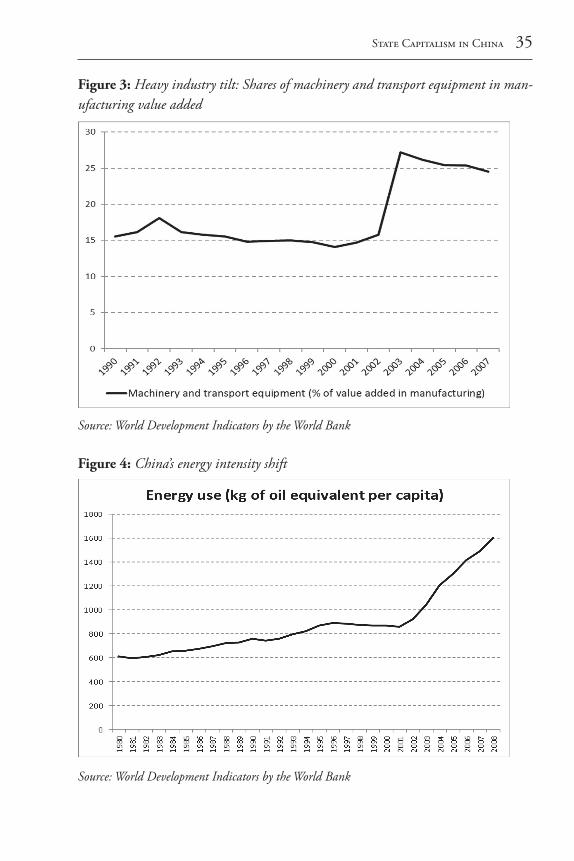
Figure 3: Heavy industry tilt: Shares of machinery and transport equipment in man-ufacturing value added
Source: World Development Indicators by the World Bank
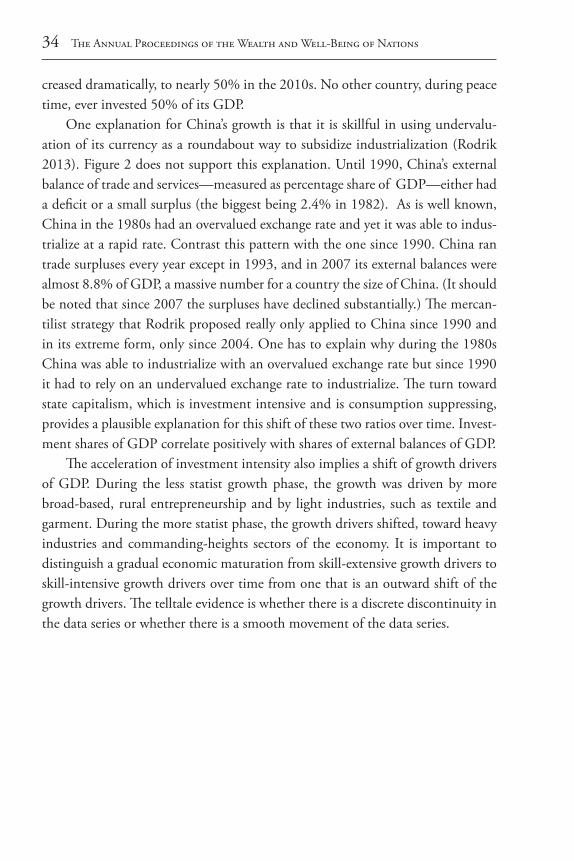
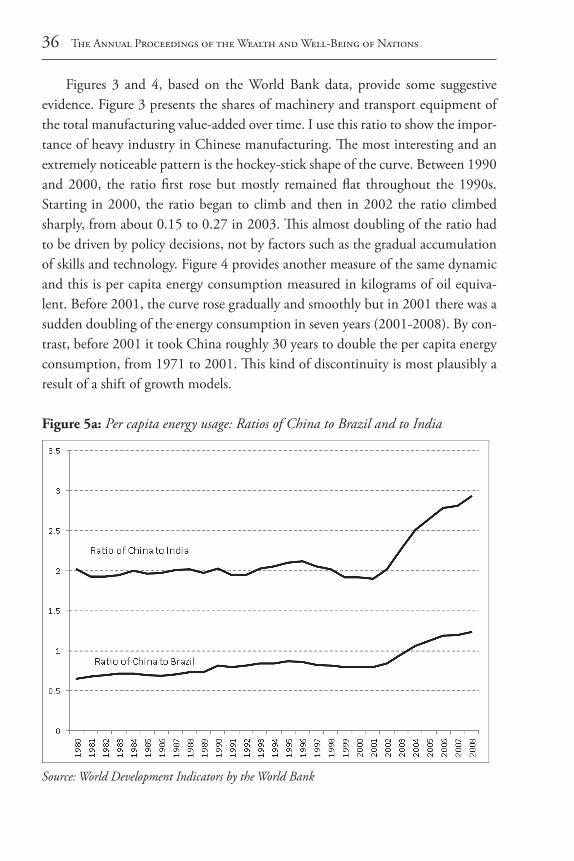
Figure 4: China’s energy intensity shift
Source: World Development Indicators by the World Bank
36 The Annual Proceedings of the Wealth and Well-Being of Nations
Figures 3 and 4, based on the World Bank data, provide some suggestive evidence. Figure 3 presents the shares of machinery and transport equipment of the total manufacturing value-added over time. I use this ratio to show the impor-tance of heavy industry in Chinese manufacturing. The most interesting and an extremely noticeable pattern is the hockey-stick shape of the curve. Between 1990 and 2000, the ratio first rose but mostly remained flat throughout the 1990s. Starting in 2000, the ratio began to climb and then in 2002 the ratio climbed sharply, from about 0.15 to 0.27 in 2003. This almost doubling of the ratio had to be driven by policy decisions, not by factors such as the gradual accumulation of skills and technology. Figure 4 provides another measure of the same dynamic and this is per capita energy consumption measured in kilograms of oil equiva-lent. Before 2001, the curve rose gradually and smoothly but in 2001 there was a sudden doubling of the energy consumption in seven years (2001-2008). By con-trast, before 2001 it took China roughly 30 years to double the per capita energy consumption, from 1971 to 2001. This kind of discontinuity is most plausibly a result of a shift of growth models.
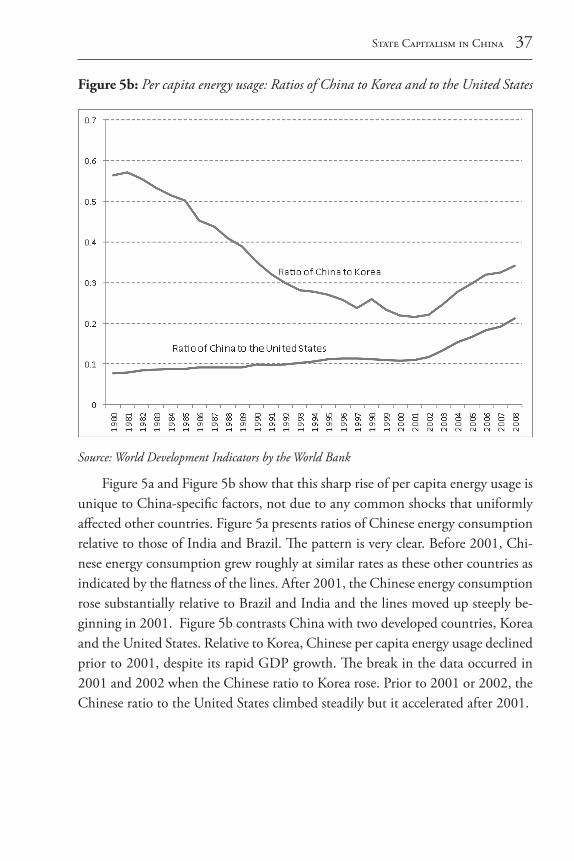
Figure 5a: Per capita energy usage: Ratios of China to Brazil and to India
Source: World Development Indicators by the World Bank
State Capitalism in China 37
Figure 5b: Per capita energy usage: Ratios of China to Korea and to the United States
Source: World Development Indicators by the World Bank
Figure 5a and Figure 5b show that this sharp rise of per capita energy usage is unique to China-specific factors, not due to any common shocks that uniformly affected other countries. Figure 5a presents ratios of Chinese energy consumption relative to those of India and Brazil. The pattern is very clear. Before 2001, Chi-nese energy consumption grew roughly at similar rates as these other countries as indicated by the flatness of the lines. After 2001, the Chinese energy consumption rose substantially relative to Brazil and India and the lines moved up steeply be-ginning in 2001. Figure 5b contrasts China with two developed countries, Korea and the United States. Relative to Korea, Chinese per capita energy usage declined prior to 2001, despite its rapid GDP growth. The break in the data occurred in 2001 and 2002 when the Chinese ratio to Korea rose. Prior to 2001 or 2002, the Chinese ratio to the United States climbed steadily but it accelerated after 2001.
38 The Annual Proceedings of the Wealth and Well-Being of Nations
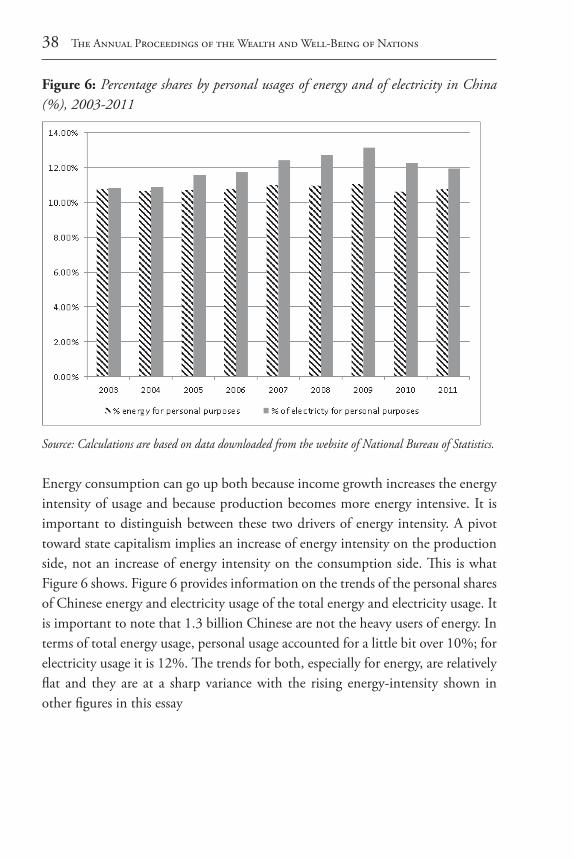
Figure 6: Percentage shares by personal usages of energy and of electricity in China (%), 2003-2011
Source: Calculations are based on data downloaded from the website of National Bureau of Statistics.
Energy consumption can go up both because income growth increases the energy intensity of usage and because production becomes more energy intensive. It is important to distinguish between these two drivers of energy intensity. A pivot toward state capitalism implies an increase of energy intensity on the production side, not an increase of energy intensity on the consumption side. This is what Figure 6 shows. Figure 6 provides information on the trends of the personal shares of Chinese energy and electricity usage of the total energy and electricity usage. It is important to note that 1.3 billion Chinese are not the heavy users of energy. In terms of total energy usage, personal usage accounted for a little bit over 10%; for electricity usage it is 12%. The trends for both, especially for energy, are relatively flat and they are at a sharp variance with the rising energy-intensity shown in other figures in this essay
State Capitalism in China 39
Performance of State Capitalism
Advocates of state capitalism often cite China’s high GDP growth as evidence of the efficacy of state capitalism. One problem with this view is that there has not been one growth model in China. There are at least two: one—prevailing in the 1980s and up to the mid-1990s—that is less statist in terms of the policy orienta-tions and one since the mid-1990s that is increasingly rooted in state capitalism. GDP growth under both of these policy models has been robust. To say that state capitalism is responsible for China’s fast GDP growth is to have committed an attribution error.
The differentiators between the two policy models go beyond GDP growth rates and are centered on the growth of personal income. During the more entre-preneurial phase of Chinese growth, personal income grew on a par with GDP growth and there was an initial improvement income distribution. While China continued to grow rapidly during the phase of state capitalism, personal income growth slowed down substantially and income distribution deteriorated.
In Huang (2008), I documented in great detail that household income growth in the 1980s exceeded GDP growth but it lagged substantially behind GDP growth in the 1990s. In fact, in the second half of the 1990s, there was no growth of rural household nominal income at all. All the growth came from a severe deflation experienced by China in the late 1990s. In the 2000s, household income growth improved substantially from the level prevailing in the 1990s but so did GDP growth. So the gap between economic growth and personal income growth has persisted.
Given the substantial discrepancy between the per capita GDP and the per-sonal-income measure of performance, the question is to which measure should we assign more weight? There is a technical and there is a substantive response to this question. In technical terms, Chinese GDP data are often criticized for their inconsistencies, lack of definitional clarity, and the inadequate explanations of and disclosures about reporting norms and procedures (Rawski 2001b). Indeed, recently local governments reported a GDP figure 10 to 15 percent larger than what the national government reported and Chinese GDP purportedly grew at a rapid rate despite a sharp slowdown in the growth of electricity usage. In contrast, the personal income data were obtained through painstaking household surveys. Such household surveys are widely held by outside analysts as well-designed and informative.
40 The Annual Proceedings of the Wealth and Well-Being of Nations
The substantive reason is that personal income represents a better measure of the welfare of the Chinese populace compared to national accounting data such as GDP. Economics, John Stuart Mill famously stated, is the study of “the sources and conditions of wealth and material prosperity for aggregate bodies of human beings.” Mill (1865) reminds us that economic growth matters primarily because growth improves the health and welfare of the majority of the population, not simply a few elite members of a society. The normative justifications of the China model are also offered on welfare grounds. One famous formulation in the eco-nomics literature is that the Chinese reform has been “Pareto-optimal” in that it has created winners without creating losers (Lau, Qian, and Roland 2000).
We do not have an exact measure of “welfare” but we have something closer to the concept than GDP—personal income and consumption data. We will also pay particular attention to China’s rural population. Although the rural popula-tion now is 45% of China’s population, it is important to note that this is defined in terms of the residence status, i.e., they are rural as long-term residents—defined as more than six months—in rural China. Added to that is another some 200 mil-lion rural migrant workers who reside in cities but lack the legal benefits of urban citizenship (such as free basic education and healthcare). This bifurcation between residency and legal status is a feature of what is known as the “hukou” system in China. China’s rural population is the Chinese equivalent of “the aggregate bodies of human beings” Mill emphasized in his justification for economic growth.
Figure 7 divides the developments into three periods: the first policy period, from 1979 to 1988 (referred to as the “1980s” in this essay), is the era of Hu Yaobang and Zhao Ziyang in terms of economic policy. Hu and Zhao are widely regarded as the most liberal Chinese leaders during the reform era. The subse-quent years, 1989 to 2002 (referred to as the “1990s” in this paper), Jiang Zemin and Zhu Rongji governed the country and managed the economy. Both of these leaders came from Shanghai, a city that laid down the intellectual and operational foundation of state capitalism (Huang and Qian 2010).
The third policy period between 2003 and 2013 is the era of Hu Jintao and Wen Jiabao. This period is mixed in terms of the orientations of the state capital-ism. In rural policy, this group of leaders reversed some of the anti-rural policies from the 1990s but in other areas, such as state monopolies and investments in SOEs, there has been a substantial exacerbation of the statist biases from the 1990s. While the developments during the third policy period hold important, although conflicting, clues about China’s economic future, the decades of the
State Capitalism in China 41
1980s and 1990s provide the cleanest way to test some of the claims about the state capitalism model. Much of our analysis will thus focus on these two policy periods. I will touch on the most recent policy period, under President Xi Jinping, in the concluding section of the paper.
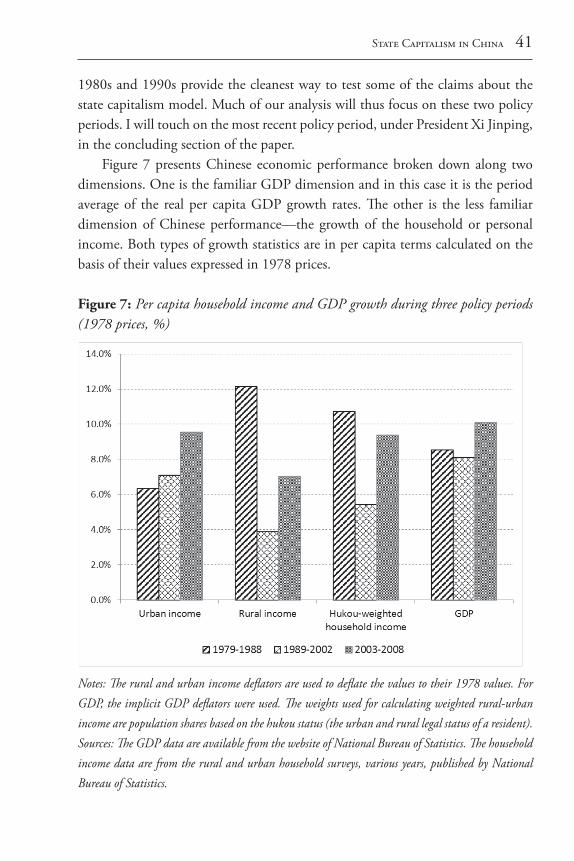
Figure 7 presents Chinese economic performance broken down along two dimensions. One is the familiar GDP dimension and in this case it is the period average of the real per capita GDP growth rates. The other is the less familiar dimension of Chinese performance—the growth of the household or personal income. Both types of growth statistics are in per capita terms calculated on the basis of their values expressed in 1978 prices.
Figure 7: Per capita household income and GDP growth during three policy periods (1978 prices, %)
Notes: The rural and urban income deflators are used to deflate the values to their 1978 values. For GDP, the implicit GDP deflators were used. The weights used for calculating weighted rural-urban income are population shares based on the hukou status (the urban and rural legal status of a resident). Sources: The GDP data are available from the website of National Bureau of Statistics. The household income data are from the rural and urban household surveys, various years, published by National Bureau of Statistics.
42 The Annual Proceedings of the Wealth and Well-Being of Nations
Let’s first examine the GDP series. During the first period,1979 to 1988, GDP per capita grew at an annual average rate of 8.5 percent in China, versus 8.1 percent during the second period, 1989-2002. On the basis of GDP data alone, one could conclude that the Chinese economic performance has been consistently robust. Yet one comes to a very different conclusion when looking at household income. Household income measures personal income or take-home pay. It refers to money that goes to the household sector in the form of wage, benefits, transfer payments, property income (rental income, interest payments on bank deposits, or stock dividends), and profits from operating small businesses. In other words, unlike GDP, which is an abstract accounting construct, household or personal income denotes the actual monetary and material gains accruing to the Chinese people, and it is closer to the concept of welfare than GDP.
In sharp contrast to the consistency of the high GDP growth, household income performance exhibits a highly varied pattern. We show household income developments in three ways—urban, rural and weighted rural-urban income growth. The source of household income data is the annual survey conducted by the National Bureau of Statistics. (For details, see Huang, 2008). Because NBS conducted rural and urban household surveys separately, we need to pool the rural and urban household income together to calculate the household income growth for the entire country. In my calculation I weighted the rural and urban income by the shares of rural and urban population based on their legal status under the hukou system.
In the 1980s, the weighted rural-urban per capita household income growth exceeded GDP per capita growth by 2.6 percentage points (11.1 percent minus 8.5 percent). In the 1990s, the pattern reversed itself. Per capita GDP growth averaged 8.1 percent annually between 1989 and 2002, but weighted rural-urban per capita household income growth slowed down sharply, from 11.1 percent in the previous decade to only 5.4 percent. The difference between household income growth and GDP growth is now negative at nearly -3 percentage points.
The biggest change has to do with the growth of rural household income. Ru-ral household income in the 1980s grew at an extraordinarily robust rate, averag-ing 12 percent for the 1978–88 period (after inflation is excluded). In the 1990s, the growth slowed down to 3.9 percent. Urban per capita income averaged 7.1 percent annually in the 1990s as compared with 6.3 percent in the 1980s. How-ever, the increase in the growth rate of the urban income was not enough to offset the decrease in the growth rate of rural income both because the acceleration of
State Capitalism in China 43
the urban income growth was relatively modest and because of the large number of rural residents.
There are, however, some data issues that need to be resolved. Naughton (2007) points out that the rural consumer price index for the early 1980s under-states rural inflation (and thus over-states growth). One exercise to get around this objection is to assume that the performance in the second half of the 1980s—for which we have better data on inflation—prevailed throughout the entire 1980s. Between 1984 and 1989, the annual growth rate of rural household income per capita averaged 7.2 percent. This is surely an extremely conservative estimate for the 1980s. Rural economy put out its strongest relative performance in the first half of the 1980s. But even this estimate is still a far stronger performance than the growth in the 1990s (3.9 percent).
It should be noted that the annual difference between the 7.2 percent as-sumed for the 1980s and the growth rate of 3.9 percent of the 1990s is not an abstract matter. It entails real and substantial income and welfare implications for hundreds of millions of Chinese rural residents. This is not only because of the difference in the two growth rates, but also because of the extraordinary length of the second policy period, thirteen years. Assuming that Chinese rural households had grown in the 1990s at 7.2 percent instead of the actual 3.9 percent, by 2002 an average Chinese rural resident would have been 52 percent richer than he ac-tually was. This is the counterfactual scenario for China. Had China continued with its policy model of the 1980s and had rural Chinese thus been 50% richer, many of the hot-button issues prevailing today such as domestic consumption, exchange rate valuation, and global imbalances would have been much less severe and of much less importance.
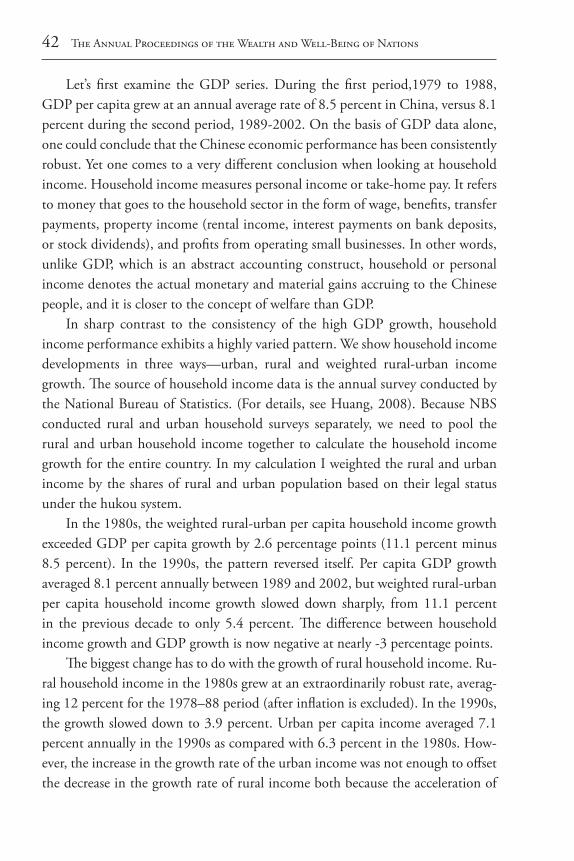
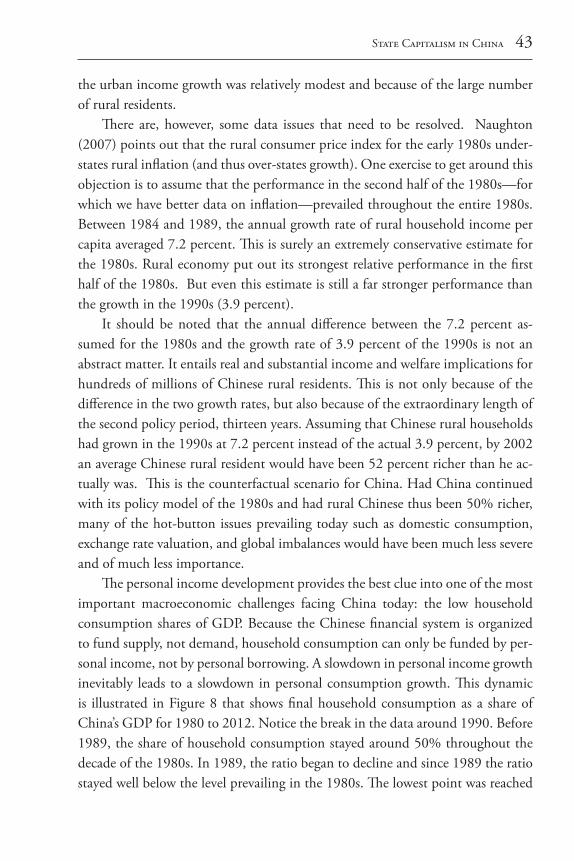
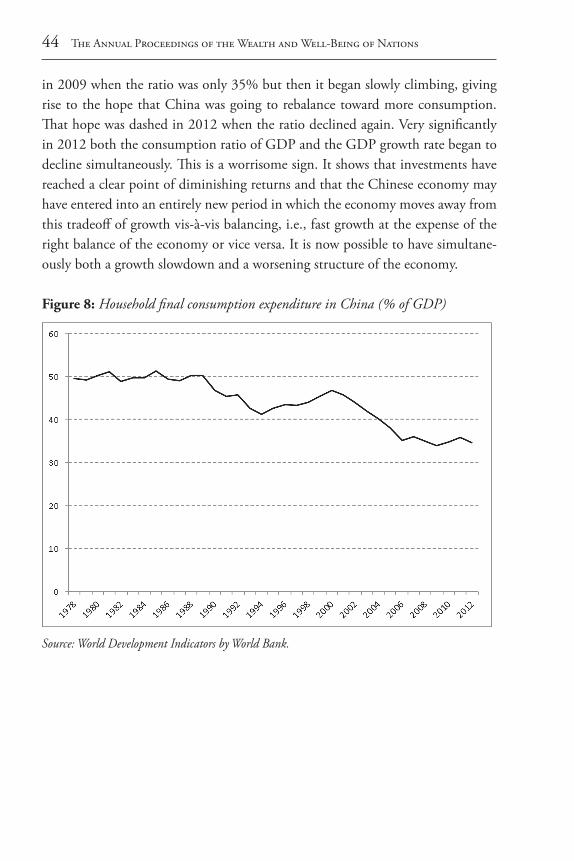
The personal income development provides the best clue into one of the most important macroeconomic challenges facing China today: the low household consumption shares of GDP. Because the Chinese financial system is organized to fund supply, not demand, household consumption can only be funded by per-sonal income, not by personal borrowing. A slowdown in personal income growth inevitably leads to a slowdown in personal consumption growth. This dynamic is illustrated in Figure 8 that shows final household consumption as a share of China’s GDP for 1980 to 2012. Notice the break in the data around 1990. Before 1989, the share of household consumption stayed around 50% throughout the decade of the 1980s. In 1989, the ratio began to decline and since 1989 the ratio stayed well below the level prevailing in the 1980s. The lowest point was reached
44 The Annual Proceedings of the Wealth and Well-Being of Nations
in 2009 when the ratio was only 35% but then it began slowly climbing, giving rise to the hope that China was going to rebalance toward more consumption. That hope was dashed in 2012 when the ratio declined again. Very significantly in 2012 both the consumption ratio of GDP and the GDP growth rate began to decline simultaneously. This is a worrisome sign. It shows that investments have reached a clear point of diminishing returns and that the Chinese economy may have entered into an entirely new period in which the economy moves away from this tradeoff of growth vis-à-vis balancing, i.e., fast growth at the expense of the right balance of the economy or vice versa. It is now possible to have simultane-ously both a growth slowdown and a worsening structure of the economy.
Figure 8: Household final consumption expenditure in China (% of GDP)
Source: World Development Indicators by World Bank.
State Capitalism in China 45
Conclusion
In 2012, a new leadership took the reins of the country. President Xi Jinping assumed his position at a time when the GDP growth rate began to slow down and the household consumption ratio of GDP declined. This is the situation that Xi Jinping and his colleagues inherited from their predecessors.
Four years into his leadership, we are able to formulate some initial judgement on what the Xi leadership intends to do about China’s state capitalism growth model. The communique of the Third Plenum of 18th Party Congress has been much debated and commented upon. A close reading of that document gives rise to three plausible interpretations. One is that the Xi Jinping leadership has endorsed a reform blueprint that is far more comprehensive and complete than the previous reform documents. The document covered no less than 26 policy areas, touching on economics, education, and military. The second interpretation is that the Xi leadership has explicitly rejected reforming or attenuating the in-stitutional pillars of the state capitalistic model—i.e., the SOEs and the absolute power of the CCP. Thus we know that the Xi leadership has an intellectual vision for reforms but we also know that it has not endorsed the two pathways toward realizing that vision—i.e., reforming SOEs and reforming Chinese politics.
A third interpretation is that the communique presents a set of long-term visions, not short-term action plans. Many of the reforms are set against a dead-line of completion by 2020. One way to interpret this deadline is that the Xi Jin-ping leadership does not believe that the challenges China faces present imminent risks, a view that would be at odds with the fact that Chinese economy today is heavily indebted and is dangerously addicted to the real estate bubble as a way to reduce its over-capacity.
While many analysts have equated the communique of the Third Plenum of 18th Party Congress with the Third Plenum of the 11th Party Congress of 1978, the truly revolutionary document that launched China’s transformational rural reforms in the 1980s, in fact there are more differences than similarities. Two dif-ferences stand out. First, the 1978 communique is a short-term action program that unleashed what economists call “endogenous reforms,” i.e., reform in one area—specifically in agriculture—that would lead to reforms in many other areas. The 2013 communique contains a laundry list of textbook building blocks of a market economy but it is remarkably silent on a strategy to move the Chinese economy from its current state capitalistic model to one more closely resembling
46 The Annual Proceedings of the Wealth and Well-Being of Nations
a market economy. The document is not a call for action. The second difference is the rationale provided for reforms by the two com-
muniques. The 1978 communique was direct and explicit. The document went into great detail discussing the problems facing the Chinese economy such as agricultural stagnation and inefficiencies. Not so with the 2013 communique. What is remarkable about the 2013 communique is that the seemingly radical visions for the Chinese economy presented in the document are completely de-tached from the realities of the real economy on the ground. The document does not provide any rationale for why China needs the radical reforms outlined in it and it does not provide any detailed discussions of the enormous economic and social challenges. It is a bit like a physician, after prescribing an organ transplant, a surgery, and chemotherapy, declaring, “Other than that, you are in good health.”
Aside from uncertainties about the future directions of Chinese economic policy, what is most worrisome is the state of Chinese politics. The fundamental pillar of state capitalism is the political monopoly of the CCP. Four years into his first term (ending in 2017), it is abundantly clear that Xi has assigned the highest weight to protecting, perpetuating and even strengthening the monopoly controls of the CCP. The disconnect between the seeming rhetorical rejection of the state capitalism model in the Third Plenum Communique and the numerous actions and measures taken since 2012 to consolidate the power of the CCP is truly jarring.
At the time of writing this essay, the news coming out of China is all about a bifurcation of repricing of housing assets—in the first-tier cities such as Shanghai and Shenzhen property prices are increasing rapidly (fueled by loose credit and monetary policies) and in second or third-tier cities property prices are either soft or declining. The Chinese leadership is addicted to policies that do relatively little to the real economy except to inflate property prices (including stock market prices in 2014 and first half of 2015). This is clear evidence that the leadership prefers to rely on policy gimmicks rather than on genuine reforms to deal with the emergent challenges.
The bifurcation of the property prices, however, is a sign that this policy is only able to achieve its intended purpose in a small number of locations (such as a handful of first-tier cities). The lack of response from the rest of the country signals risks of an undisciplined unwinding of the state capitalistic model. State capitalism depends on two economic forces to succeed: 1) strong external de-mand and 2) strong housing demand. The 2008 financial crisis ended the first
State Capitalism in China 47
and China’s out of whack economic fundamentals will end the second. Despite high expectations, so far the Xi Jinping leadership has only shown high rhetorical commitments to reforms. It is all but certain that state capitalism will end under the watch of Xi Jinping, possibly under his second term (from 2017 to 2022), either in a crisis or in a gradual transition engineered by reforms. At the time of this writing, the crisis scenario is inching upward in probability relative to the reform scenario.
48 The Annual Proceedings of the Wealth and Well-Being of Nations
BibliographyBremmer, Ian, The End of the Free Market: Who Wins the War Between States
and Corporations (New York: Portfolio, 2010). Bremmer, I. (2009). State capitalism comes of age. Foreign Affairs, 88(3), 40-55. Dougherty, Sean, and Richard Herd. 2005. “Fast-Falling Barriers and Growing
Concentration: The Emergence of a Private Economy in China.” Paris: Or-ganisation for Economic Cooperation and Development.
Huang, Yasheng. 2008. Capitalism with Chinese Characteristics: Entrepreneur-ship and State During the Reform Era. New York: Cambridge Univeristy Press.
Huang, Yasheng, and Yi Qian. 2010. “Is Entrepreneurship Missing in Shanghai?” In International Differences in Entrepreneurship, edited by Joshua Lerner and Antoinette Shoar. Chicago: University of Chicago Press.
Lardy, Nicholas, Markets over Mao: The Rise of Private Business in China, (Wash-ington DC: William Peterson Institute of International Economics, 2014).
Lau, Lawrence J., Yingyi Qian, and Gerard Roland. 2000. “Reform without los-ers: An interpretation of China’s dual-track approach to transition.” Journal of Political Economy, 108 (Issue), 120-43.
Mill, John Stuart. Principles of political economy: with some of their applications to social philosophy. Vol. 2. Longmans, Green, 1865.
Naughton, Barry 2007. The Chinese economy: Transitions and growth. Cam-bridge: The MIT Press.
Qian, Yingyi. 1999. The institutional foundations of China’s market transition. Paper read at The World Bank Annual Conference on Development Eco-nomics, April 28-30, at Washington, DC.
Rawski, Thomas G. 2001a. “China Reform Watch: Turning Point.” China Per-spectives, 28-35.
Rawski, Thomas G. 2001b. “What Is Happening to China’s GDP Statistics.” China Economic Review 12 (4):347-54.
Rodrik, D. (2013). When ideas trump interests: preferences, world views, and policy innovations (No. w19631). National Bureau of Economic Research.
Wang, Junmin, Doug Guthrie, and Zhixing Xiao, “The Rise of SASAC: Asset Management, Ownership Concentration, and Firm Performance in China’s Capital Markets,” Management and Organization Review, Volume 8, Issue 2, pages 253–281, July 2012.
World Bank. 1989. India: An industrializing economy in transition. Washington, DC: The World Bank.
AC01629619, A. (Ed.). (1995). Bureaucrats in business: The economics and pol-
State Capitalism in China 49
itics of government ownership. Oxford University Press. Yergen, D., and Stanislaw, J. 2002.The Commanding Heights: The battle for the