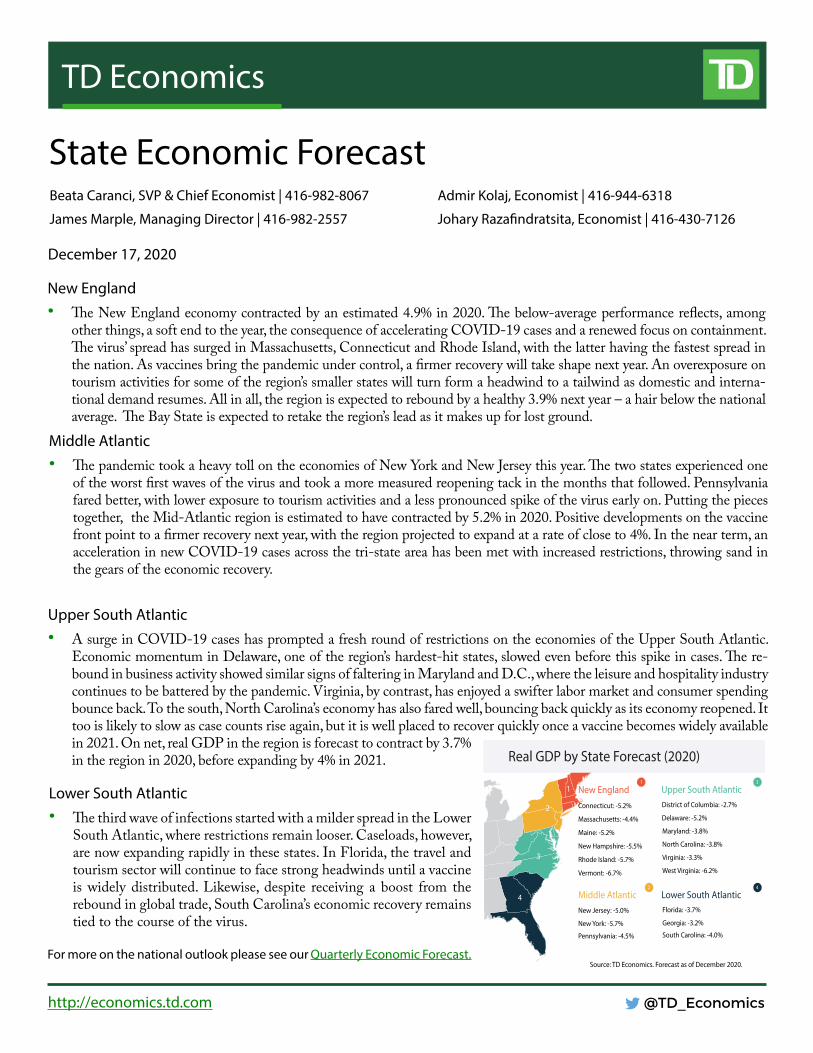
TD Economics @TD_Economics http://economics.td.com State Economic Forecast New England • e New England economy contracted by an estimated 4.9% in 2020. e below-average performance reflects, among other things, a soft end to the year, the consequence of accelerating COVID-19 cases and a renewed focus on containment. e virus’ spread has surged in Massachusetts, Connecticut and Rhode Island, with the latter having the fastest spread in the nation. As vaccines bring the pandemic under control, a firmer recovery will take shape next year. An overexposure on tourism activities for some of the region’s smaller states will turn form a headwind to a tailwind as domestic and interna- tional demand resumes. All in all, the region is expected to rebound by a healthy 3.9% next year – a hair below the national average. e Bay State is expected to retake the region’s lead as it makes up for lost ground. Beata Caranci, SVP & Chief Economist | 416-982-8067 James Marple, Managing Director | 416-982-2557 December 17, 2020 Middle Atlantic • e pandemic took a heavy toll on the economies of New York and New Jersey this year. e two states experienced one of the worst first waves of the virus and took a more measured reopening tack in the months that followed. Pennsylvania fared better, with lower exposure to tourism activities and a less pronounced spike of the virus early on. Putting the pieces together, the Mid-Atlantic region is estimated to have contracted by 5.2% in 2020. Positive developments on the vaccine front point to a firmer recovery next year, with the region projected to expand at a rate of close to 4%. In the near term, an acceleration in new COVID-19 cases across the tri-state area has been met with increased restrictions, throwing sand in the gears of the economic recovery. Admir Kolaj, Economist | 416-944-6318 Johary Razafindratsita, Economist | 416-430-7126 Upper South Atlantic • A surge in COVID-19 cases has prompted a fresh round of restrictions on the economies of the Upper South Atlantic. Economic momentum in Delaware, one of the region’s hardest-hit states, slowed even before this spike in cases. e re- bound in business activity showed similar signs of faltering in Maryland and D.C., where the leisure and hospitality industry continues to be battered by the pandemic. Virginia, by contrast, has enjoyed a swifter labor market and consumer spending bounce back. To the south, North Carolina’s economy has also fared well, bouncing back quickly as its economy reopened. It too is likely to slow as case counts rise again, but it is well placed to recover quickly once a vaccine becomes widely available in 2021. On net, real GDP in the region is forecast to contract by 3.7% in the region in 2020, before expanding by 4% in 2021. Lower South Atlantic • e third wave of infections started with a milder spread in the Lower South Atlantic, where restrictions remain looser. Caseloads, however, are now expanding rapidly in these states. In Florida, the travel and tourism sector will continue to face strong headwinds until a vaccine is widely distributed. Likewise, despite receiving a boost from the rebound in global trade, South Carolina’s economic recovery remains tied to the course of the virus. Real GDP by State Forecast (2020) Source: TD Economics. Forecast as of December 2020. Middle Atlantic New Jersey: -5.0% New York: -5.7% Pennsylvania: -4.5% 2 3 District of Columbia: -2.7% Delaware: -5.2% Maryland: -3.8% North Carolina: -3.8% Virginia: -3.3% West Virginia: -6.2% Upper South Atlantic 3 2 Lower South Atlantic Florida: -3.7% Georgia: -3.2% South Carolina: -4.0% 4 4 Connecticut: -5.2% Massachusetts: -4.4% Maine: -5.2% New Hampshire: -5.5% Rhode Island: -5.7% Vermont: -6.7% New England 1 1 For more on the national outlook please see our Quarterly Economic Forecast.
Transcript
TD Economics
@TD_Economicshttp://economics.td.com
State Economic Forecast
New England• The New England economy contracted by an estimated 4.9% in 2020. The below-average performance reflects, among
other things, a soft end to the year, the consequence of accelerating COVID-19 cases and a renewed focus on containment. The virus’ spread has surged in Massachusetts, Connecticut and Rhode Island, with the latter having the fastest spread in the nation. As vaccines bring the pandemic under control, a firmer recovery will take shape next year. An overexposure on tourism activities for some of the region’s smaller states will turn form a headwind to a tailwind as domestic and interna-tional demand resumes. All in all, the region is expected to rebound by a healthy 3.9% next year – a hair below the national average. The Bay State is expected to retake the region’s lead as it makes up for lost ground.
Middle Atlantic• The pandemic took a heavy toll on the economies of New York and New Jersey this year. The two states experienced one
of the worst first waves of the virus and took a more measured reopening tack in the months that followed. Pennsylvania fared better, with lower exposure to tourism activities and a less pronounced spike of the virus early on. Putting the pieces together, the Mid-Atlantic region is estimated to have contracted by 5.2% in 2020. Positive developments on the vaccine front point to a firmer recovery next year, with the region projected to expand at a rate of close to 4%. In the near term, an acceleration in new COVID-19 cases across the tri-state area has been met with increased restrictions, throwing sand in the gears of the economic recovery.
Admir Kolaj, Economist | 416-944-6318
Johary Razafindratsita, Economist | 416-430-7126
Upper South Atlantic• A surge in COVID-19 cases has prompted a fresh round of restrictions on the economies of the Upper South Atlantic.
Economic momentum in Delaware, one of the region’s hardest-hit states, slowed even before this spike in cases. The re-bound in business activity showed similar signs of faltering in Maryland and D.C., where the leisure and hospitality industry continues to be battered by the pandemic. Virginia, by contrast, has enjoyed a swifter labor market and consumer spending bounce back. To the south, North Carolina’s economy has also fared well, bouncing back quickly as its economy reopened. It too is likely to slow as case counts rise again, but it is well placed to recover quickly once a vaccine becomes widely available in 2021. On net, real GDP in the region is forecast to contract by 3.7% in the region in 2020, before expanding by 4% in 2021.
Lower South Atlantic• The third wave of infections started with a milder spread in the Lower
South Atlantic, where restrictions remain looser. Caseloads, however, are now expanding rapidly in these states. In Florida, the travel and tourism sector will continue to face strong headwinds until a vaccine is widely distributed. Likewise, despite receiving a boost from the rebound in global trade, South Carolina’s economic recovery remains tied to the course of the virus.
Real GDP by State Forecast (2020)
Source: TD Economics. Forecast as of December 2020.
Middle AtlanticNew Jersey: -5.0%
New York: -5.7%
Pennsylvania: -4.5%
2
3
District of Columbia: -2.7%
Delaware: -5.2%
Maryland: -3.8%
North Carolina: -3.8%
Virginia: -3.3%
West Virginia: -6.2%
Upper South Atlantic3
2
Lower South AtlanticFlorida: -3.7%
Georgia: -3.2%
South Carolina: -4.0%
4
4
Connecticut: -5.2%
Massachusetts: -4.4%
Maine: -5.2%
New Hampshire: -5.5%
Rhode Island: -5.7%
Vermont: -6.7%
New England1
1
For more on the national outlook please see our Quarterly Economic Forecast.
New England (CT, MA, ME, NH, RI, VT)Connecticut: Underlying resilience
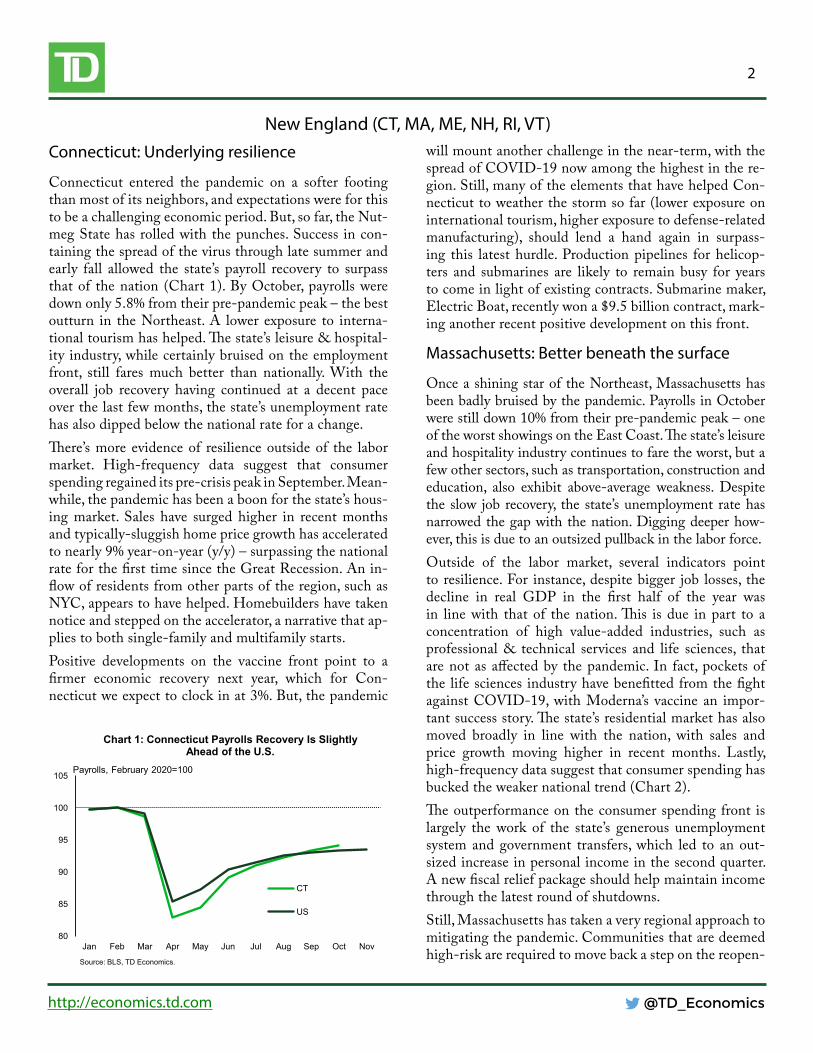
Connecticut entered the pandemic on a softer footing than most of its neighbors, and expectations were for this to be a challenging economic period. But, so far, the Nut-meg State has rolled with the punches. Success in con-taining the spread of the virus through late summer and early fall allowed the state’s payroll recovery to surpass that of the nation (Chart 1). By October, payrolls were down only 5.8% from their pre-pandemic peak – the best outturn in the Northeast. A lower exposure to interna-tional tourism has helped. The state’s leisure & hospital-ity industry, while certainly bruised on the employment front, still fares much better than nationally. With the overall job recovery having continued at a decent pace over the last few months, the state’s unemployment rate has also dipped below the national rate for a change. There’s more evidence of resilience outside of the labor market. High-frequency data suggest that consumer spending regained its pre-crisis peak in September. Mean-while, the pandemic has been a boon for the state’s hous-ing market. Sales have surged higher in recent months and typically-sluggish home price growth has accelerated to nearly 9% year-on-year (y/y) – surpassing the national rate for the first time since the Great Recession. An in-flow of residents from other parts of the region, such as NYC, appears to have helped. Homebuilders have taken notice and stepped on the accelerator, a narrative that ap-plies to both single-family and multifamily starts.Positive developments on the vaccine front point to a firmer economic recovery next year, which for Con-necticut we expect to clock in at 3%. But, the pandemic
will mount another challenge in the near-term, with the spread of COVID-19 now among the highest in the re-gion. Still, many of the elements that have helped Con-necticut to weather the storm so far (lower exposure on international tourism, higher exposure to defense-related manufacturing), should lend a hand again in surpass-ing this latest hurdle. Production pipelines for helicop-ters and submarines are likely to remain busy for years to come in light of existing contracts. Submarine maker, Electric Boat, recently won a $9.5 billion contract, mark-ing another recent positive development on this front.
Massachusetts: Better beneath the surface
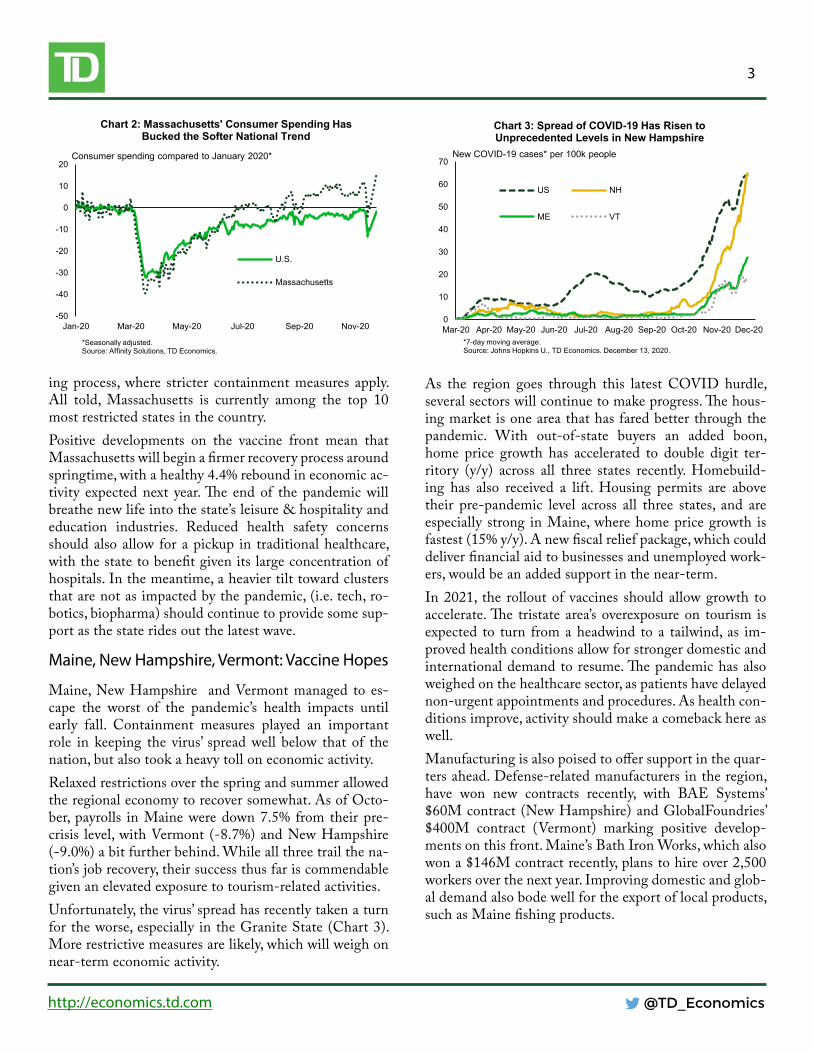
Once a shining star of the Northeast, Massachusetts has been badly bruised by the pandemic. Payrolls in October were still down 10% from their pre-pandemic peak – one of the worst showings on the East Coast. The state’s leisure and hospitality industry continues to fare the worst, but a few other sectors, such as transportation, construction and education, also exhibit above-average weakness. Despite the slow job recovery, the state’s unemployment rate has narrowed the gap with the nation. Digging deeper how-ever, this is due to an outsized pullback in the labor force. Outside of the labor market, several indicators point to resilience. For instance, despite bigger job losses, the decline in real GDP in the first half of the year was in line with that of the nation. This is due in part to a concentration of high value-added industries, such as professional & technical services and life sciences, that are not as affected by the pandemic. In fact, pockets of the life sciences industry have benefitted from the fight against COVID-19, with Moderna’s vaccine an impor-tant success story. The state’s residential market has also moved broadly in line with the nation, with sales and price growth moving higher in recent months. Lastly, high-frequency data suggest that consumer spending has bucked the weaker national trend (Chart 2). The outperformance on the consumer spending front is largely the work of the state’s generous unemployment system and government transfers, which led to an out-sized increase in personal income in the second quarter. A new fiscal relief package should help maintain income through the latest round of shutdowns. Still, Massachusetts has taken a very regional approach to mitigating the pandemic. Communities that are deemed high-risk are required to move back a step on the reopen-
80
85
90
95
100
105
Jan Feb Mar Apr May Jun Jul Aug Sep Oct Nov
Chart 1: Connecticut Payrolls Recovery Is Slightly Ahead of the U.S.
ing process, where stricter containment measures apply. All told, Massachusetts is currently among the top 10 most restricted states in the country.Positive developments on the vaccine front mean that Massachusetts will begin a firmer recovery process around springtime, with a healthy 4.4% rebound in economic ac-tivity expected next year. The end of the pandemic will breathe new life into the state’s leisure & hospitality and education industries. Reduced health safety concerns should also allow for a pickup in traditional healthcare, with the state to benefit given its large concentration of hospitals. In the meantime, a heavier tilt toward clusters that are not as impacted by the pandemic, (i.e. tech, ro-botics, biopharma) should continue to provide some sup-port as the state rides out the latest wave.
Maine, New Hampshire, Vermont: Vaccine Hopes
Maine, New Hampshire and Vermont managed to es-cape the worst of the pandemic’s health impacts until early fall. Containment measures played an important role in keeping the virus’ spread well below that of the nation, but also took a heavy toll on economic activity.Relaxed restrictions over the spring and summer allowed the regional economy to recover somewhat. As of Octo-ber, payrolls in Maine were down 7.5% from their pre-crisis level, with Vermont (-8.7%) and New Hampshire (-9.0%) a bit further behind. While all three trail the na-tion’s job recovery, their success thus far is commendable given an elevated exposure to tourism-related activities. Unfortunately, the virus’ spread has recently taken a turn for the worse, especially in the Granite State (Chart 3). More restrictive measures are likely, which will weigh on near-term economic activity.
As the region goes through this latest COVID hurdle, several sectors will continue to make progress. The hous-ing market is one area that has fared better through the pandemic. With out-of-state buyers an added boon, home price growth has accelerated to double digit ter-ritory (y/y) across all three states recently. Homebuild-ing has also received a lift. Housing permits are above their pre-pandemic level across all three states, and are especially strong in Maine, where home price growth is fastest (15% y/y). A new fiscal relief package, which could deliver financial aid to businesses and unemployed work-ers, would be an added support in the near-term.In 2021, the rollout of vaccines should allow growth to accelerate. The tristate area’s overexposure on tourism is expected to turn from a headwind to a tailwind, as im-proved health conditions allow for stronger domestic and international demand to resume. The pandemic has also weighed on the healthcare sector, as patients have delayed non-urgent appointments and procedures. As health con-ditions improve, activity should make a comeback here as well.Manufacturing is also poised to offer support in the quar-ters ahead. Defense-related manufacturers in the region, have won new contracts recently, with BAE Systems’ $60M contract (New Hampshire) and GlobalFoundries’ $400M contract (Vermont) marking positive develop-ments on this front. Maine’s Bath Iron Works, which also won a $146M contract recently, plans to hire over 2,500 workers over the next year. Improving domestic and glob-al demand also bode well for the export of local products, such as Maine fishing products.
-50
-40
-30
-20
-10
0
10
20
Jan-20 Mar-20 May-20 Jul-20 Sep-20 Nov-20
Chart 2: Massachusetts' Consumer Spending Has Bucked the Softer National Trend
Middle Atlantic (NJ, NY, PA)New Jersey: This too shall pass
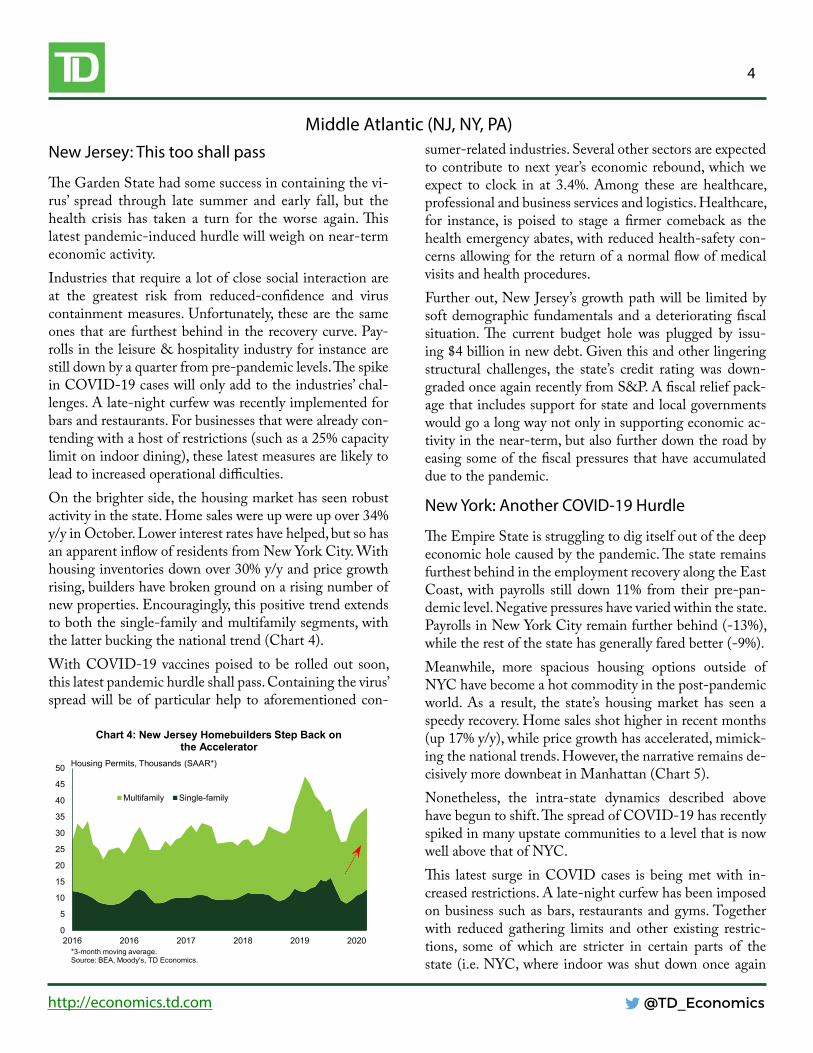
The Garden State had some success in containing the vi-rus’ spread through late summer and early fall, but the health crisis has taken a turn for the worse again. This latest pandemic-induced hurdle will weigh on near-term economic activity. Industries that require a lot of close social interaction are at the greatest risk from reduced-confidence and virus containment measures. Unfortunately, these are the same ones that are furthest behind in the recovery curve. Pay-rolls in the leisure & hospitality industry for instance are still down by a quarter from pre-pandemic levels. The spike in COVID-19 cases will only add to the industries’ chal-lenges. A late-night curfew was recently implemented for bars and restaurants. For businesses that were already con-tending with a host of restrictions (such as a 25% capacity limit on indoor dining), these latest measures are likely to lead to increased operational difficulties. On the brighter side, the housing market has seen robust activity in the state. Home sales were up were up over 34% y/y in October. Lower interest rates have helped, but so has an apparent inflow of residents from New York City. With housing inventories down over 30% y/y and price growth rising, builders have broken ground on a rising number of new properties. Encouragingly, this positive trend extends to both the single-family and multifamily segments, with the latter bucking the national trend (Chart 4). With COVID-19 vaccines poised to be rolled out soon, this latest pandemic hurdle shall pass. Containing the virus’ spread will be of particular help to aforementioned con-
sumer-related industries. Several other sectors are expected to contribute to next year’s economic rebound, which we expect to clock in at 3.4%. Among these are healthcare, professional and business services and logistics. Healthcare, for instance, is poised to stage a firmer comeback as the health emergency abates, with reduced health-safety con-cerns allowing for the return of a normal flow of medical visits and health procedures. Further out, New Jersey’s growth path will be limited by soft demographic fundamentals and a deteriorating fiscal situation. The current budget hole was plugged by issu-ing $4 billion in new debt. Given this and other lingering structural challenges, the state’s credit rating was down-graded once again recently from S&P. A fiscal relief pack-age that includes support for state and local governments would go a long way not only in supporting economic ac-tivity in the near-term, but also further down the road by easing some of the fiscal pressures that have accumulated due to the pandemic.
New York: Another COVID-19 Hurdle
The Empire State is struggling to dig itself out of the deep economic hole caused by the pandemic. The state remains furthest behind in the employment recovery along the East Coast, with payrolls still down 11% from their pre-pan-demic level. Negative pressures have varied within the state. Payrolls in New York City remain further behind (-13%), while the rest of the state has generally fared better (-9%). Meanwhile, more spacious housing options outside of NYC have become a hot commodity in the post-pandemic world. As a result, the state’s housing market has seen a speedy recovery. Home sales shot higher in recent months (up 17% y/y), while price growth has accelerated, mimick-ing the national trends. However, the narrative remains de-cisively more downbeat in Manhattan (Chart 5).Nonetheless, the intra-state dynamics described above have begun to shift. The spread of COVID-19 has recently spiked in many upstate communities to a level that is now well above that of NYC. This latest surge in COVID cases is being met with in-creased restrictions. A late-night curfew has been imposed on business such as bars, restaurants and gyms. Together with reduced gathering limits and other existing restric-tions, some of which are stricter in certain parts of the state (i.e. NYC, where indoor was shut down once again
0
5
10
15
20
25
30
35
40
45
50
2016 2016 2017 2018 2019 2020
Chart 4: New Jersey Homebuilders Step Back on the Accelerator
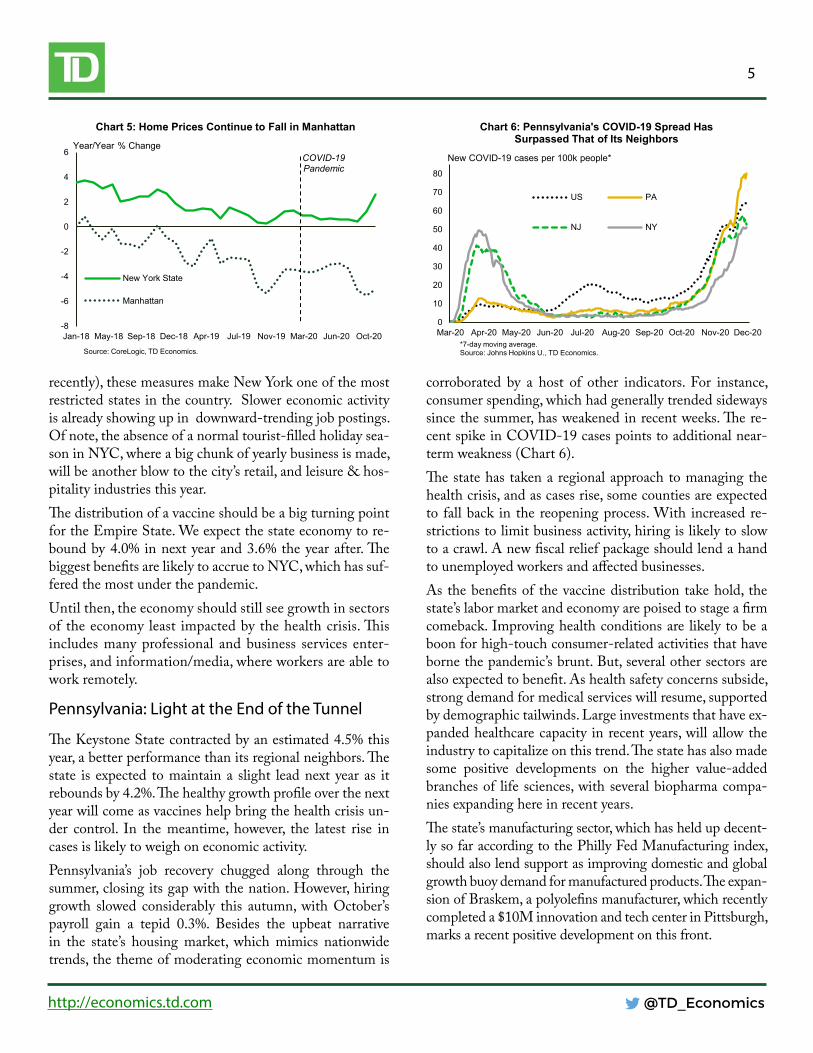
recently), these measures make New York one of the most restricted states in the country. Slower economic activity is already showing up in downward-trending job postings. Of note, the absence of a normal tourist-filled holiday sea-son in NYC, where a big chunk of yearly business is made, will be another blow to the city’s retail, and leisure & hos-pitality industries this year. The distribution of a vaccine should be a big turning point for the Empire State. We expect the state economy to re-bound by 4.0% in next year and 3.6% the year after. The biggest benefits are likely to accrue to NYC, which has suf-fered the most under the pandemic. Until then, the economy should still see growth in sectors of the economy least impacted by the health crisis. This includes many professional and business services enter-prises, and information/media, where workers are able to work remotely.
Pennsylvania: Light at the End of the Tunnel
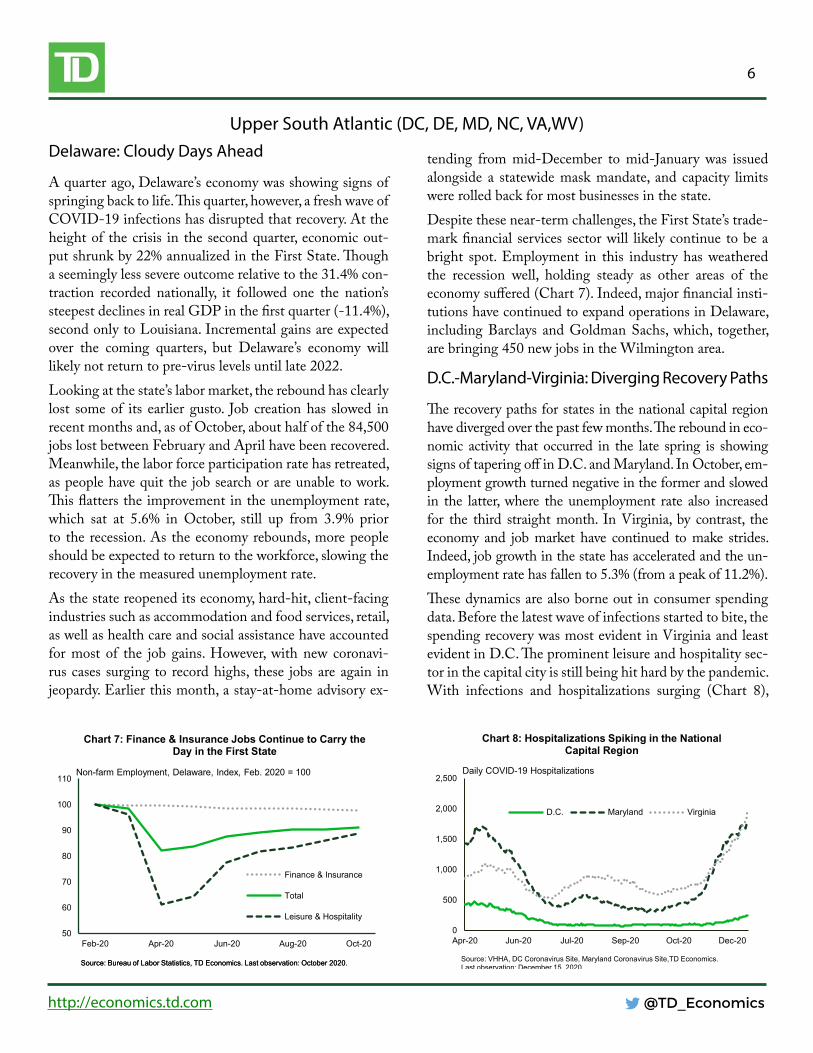
The Keystone State contracted by an estimated 4.5% this year, a better performance than its regional neighbors. The state is expected to maintain a slight lead next year as it rebounds by 4.2%. The healthy growth profile over the next year will come as vaccines help bring the health crisis un-der control. In the meantime, however, the latest rise in cases is likely to weigh on economic activity.Pennsylvania’s job recovery chugged along through the summer, closing its gap with the nation. However, hiring growth slowed considerably this autumn, with October’s payroll gain a tepid 0.3%. Besides the upbeat narrative in the state’s housing market, which mimics nationwide trends, the theme of moderating economic momentum is
corroborated by a host of other indicators. For instance, consumer spending, which had generally trended sideways since the summer, has weakened in recent weeks. The re-cent spike in COVID-19 cases points to additional near-term weakness (Chart 6). The state has taken a regional approach to managing the health crisis, and as cases rise, some counties are expected to fall back in the reopening process. With increased re-strictions to limit business activity, hiring is likely to slow to a crawl. A new fiscal relief package should lend a hand to unemployed workers and affected businesses.As the benefits of the vaccine distribution take hold, the state’s labor market and economy are poised to stage a firm comeback. Improving health conditions are likely to be a boon for high-touch consumer-related activities that have borne the pandemic’s brunt. But, several other sectors are also expected to benefit. As health safety concerns subside, strong demand for medical services will resume, supported by demographic tailwinds. Large investments that have ex-panded healthcare capacity in recent years, will allow the industry to capitalize on this trend. The state has also made some positive developments on the higher value-added branches of life sciences, with several biopharma compa-nies expanding here in recent years. The state’s manufacturing sector, which has held up decent-ly so far according to the Philly Fed Manufacturing index, should also lend support as improving domestic and global growth buoy demand for manufactured products. The expan-sion of Braskem, a polyolefins manufacturer, which recently completed a $10M innovation and tech center in Pittsburgh, marks a recent positive development on this front.
Upper South Atlantic (DC, DE, MD, NC, VA,WV)Delaware: Cloudy Days Ahead
A quarter ago, Delaware’s economy was showing signs of springing back to life. This quarter, however, a fresh wave of COVID-19 infections has disrupted that recovery. At the height of the crisis in the second quarter, economic out-put shrunk by 22% annualized in the First State. Though a seemingly less severe outcome relative to the 31.4% con-traction recorded nationally, it followed one the nation’s steepest declines in real GDP in the first quarter (-11.4%), second only to Louisiana. Incremental gains are expected over the coming quarters, but Delaware’s economy will likely not return to pre-virus levels until late 2022. Looking at the state’s labor market, the rebound has clearly lost some of its earlier gusto. Job creation has slowed in recent months and, as of October, about half of the 84,500 jobs lost between February and April have been recovered. Meanwhile, the labor force participation rate has retreated, as people have quit the job search or are unable to work. This flatters the improvement in the unemployment rate, which sat at 5.6% in October, still up from 3.9% prior to the recession. As the economy rebounds, more people should be expected to return to the workforce, slowing the recovery in the measured unemployment rate. As the state reopened its economy, hard-hit, client-facing industries such as accommodation and food services, retail, as well as health care and social assistance have accounted for most of the job gains. However, with new coronavi-rus cases surging to record highs, these jobs are again in jeopardy. Earlier this month, a stay-at-home advisory ex-
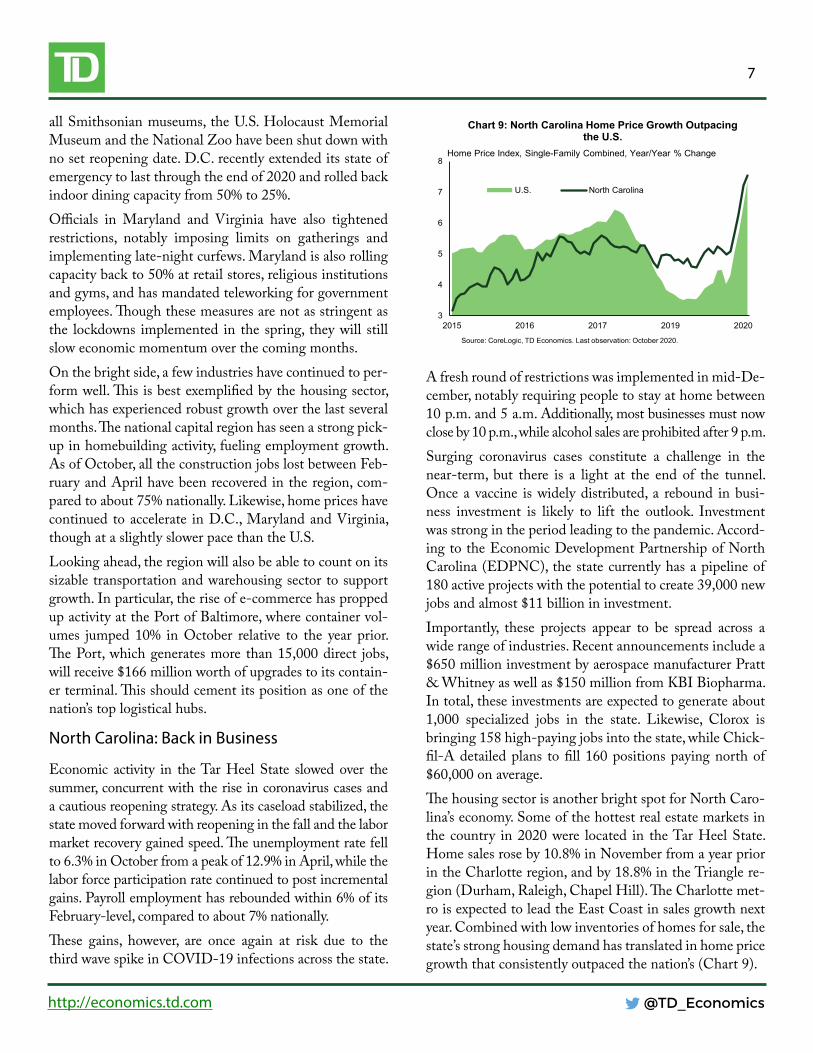
tending from mid-December to mid-January was issued alongside a statewide mask mandate, and capacity limits were rolled back for most businesses in the state. Despite these near-term challenges, the First State’s trade-mark financial services sector will likely continue to be a bright spot. Employment in this industry has weathered the recession well, holding steady as other areas of the economy suffered (Chart 7). Indeed, major financial insti-tutions have continued to expand operations in Delaware, including Barclays and Goldman Sachs, which, together, are bringing 450 new jobs in the Wilmington area.
D.C.-Maryland-Virginia: Diverging Recovery Paths
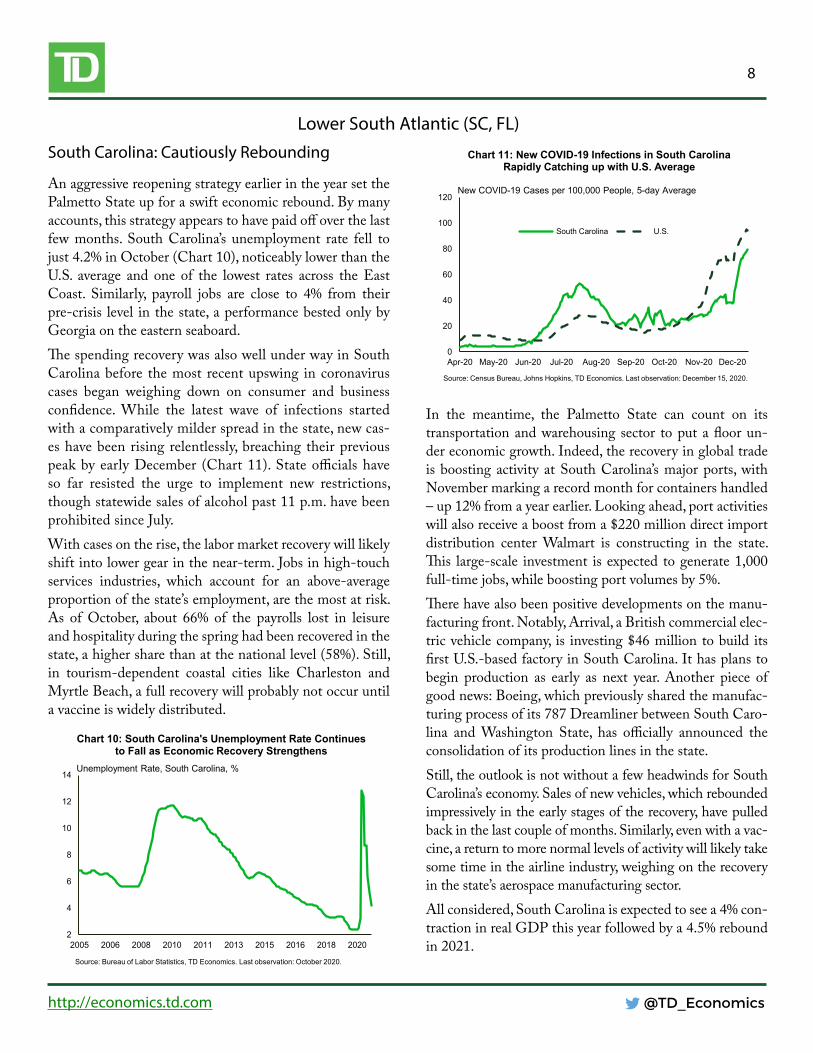
The recovery paths for states in the national capital region have diverged over the past few months. The rebound in eco-nomic activity that occurred in the late spring is showing signs of tapering off in D.C. and Maryland. In October, em-ployment growth turned negative in the former and slowed in the latter, where the unemployment rate also increased for the third straight month. In Virginia, by contrast, the economy and job market have continued to make strides. Indeed, job growth in the state has accelerated and the un-employment rate has fallen to 5.3% (from a peak of 11.2%).These dynamics are also borne out in consumer spending data. Before the latest wave of infections started to bite, the spending recovery was most evident in Virginia and least evident in D.C. The prominent leisure and hospitality sec-tor in the capital city is still being hit hard by the pandemic. With infections and hospitalizations surging (Chart 8),
all Smithsonian museums, the U.S. Holocaust Memorial Museum and the National Zoo have been shut down with no set reopening date. D.C. recently extended its state of emergency to last through the end of 2020 and rolled back indoor dining capacity from 50% to 25%.Officials in Maryland and Virginia have also tightened restrictions, notably imposing limits on gatherings and implementing late-night curfews. Maryland is also rolling capacity back to 50% at retail stores, religious institutions and gyms, and has mandated teleworking for government employees. Though these measures are not as stringent as the lockdowns implemented in the spring, they will still slow economic momentum over the coming months. On the bright side, a few industries have continued to per-form well. This is best exemplified by the housing sector, which has experienced robust growth over the last several months. The national capital region has seen a strong pick-up in homebuilding activity, fueling employment growth. As of October, all the construction jobs lost between Feb-ruary and April have been recovered in the region, com-pared to about 75% nationally. Likewise, home prices have continued to accelerate in D.C., Maryland and Virginia, though at a slightly slower pace than the U.S.Looking ahead, the region will also be able to count on its sizable transportation and warehousing sector to support growth. In particular, the rise of e-commerce has propped up activity at the Port of Baltimore, where container vol-umes jumped 10% in October relative to the year prior. The Port, which generates more than 15,000 direct jobs, will receive $166 million worth of upgrades to its contain-er terminal. This should cement its position as one of the nation’s top logistical hubs.
North Carolina: Back in Business
Economic activity in the Tar Heel State slowed over the summer, concurrent with the rise in coronavirus cases and a cautious reopening strategy. As its caseload stabilized, the state moved forward with reopening in the fall and the labor market recovery gained speed. The unemployment rate fell to 6.3% in October from a peak of 12.9% in April, while the labor force participation rate continued to post incremental gains. Payroll employment has rebounded within 6% of its February-level, compared to about 7% nationally. These gains, however, are once again at risk due to the third wave spike in COVID-19 infections across the state.
A fresh round of restrictions was implemented in mid-De-cember, notably requiring people to stay at home between 10 p.m. and 5 a.m. Additionally, most businesses must now close by 10 p.m., while alcohol sales are prohibited after 9 p.m. Surging coronavirus cases constitute a challenge in the near-term, but there is a light at the end of the tunnel. Once a vaccine is widely distributed, a rebound in busi-ness investment is likely to lift the outlook. Investment was strong in the period leading to the pandemic. Accord-ing to the Economic Development Partnership of North Carolina (EDPNC), the state currently has a pipeline of 180 active projects with the potential to create 39,000 new jobs and almost $11 billion in investment. Importantly, these projects appear to be spread across a wide range of industries. Recent announcements include a $650 million investment by aerospace manufacturer Pratt & Whitney as well as $150 million from KBI Biopharma. In total, these investments are expected to generate about 1,000 specialized jobs in the state. Likewise, Clorox is bringing 158 high-paying jobs into the state, while Chick-fil-A detailed plans to fill 160 positions paying north of $60,000 on average.The housing sector is another bright spot for North Caro-lina’s economy. Some of the hottest real estate markets in the country in 2020 were located in the Tar Heel State. Home sales rose by 10.8% in November from a year prior in the Charlotte region, and by 18.8% in the Triangle re-gion (Durham, Raleigh, Chapel Hill). The Charlotte met-ro is expected to lead the East Coast in sales growth next year. Combined with low inventories of homes for sale, the state’s strong housing demand has translated in home price growth that consistently outpaced the nation’s (Chart 9).
3
4
5
6
7
8
2015 2016 2017 2019 2020
U.S. North Carolina
Source: CoreLogic, TD Economics. Last observation: October 2020.
Home Price Index, Single-Family Combined, Year/Year % Change
Chart 9: North Carolina Home Price Growth Outpacing the U.S.
An aggressive reopening strategy earlier in the year set the Palmetto State up for a swift economic rebound. By many accounts, this strategy appears to have paid off over the last few months. South Carolina’s unemployment rate fell to just 4.2% in October (Chart 10), noticeably lower than the U.S. average and one of the lowest rates across the East Coast. Similarly, payroll jobs are close to 4% from their pre-crisis level in the state, a performance bested only by Georgia on the eastern seaboard.The spending recovery was also well under way in South Carolina before the most recent upswing in coronavirus cases began weighing down on consumer and business confidence. While the latest wave of infections started with a comparatively milder spread in the state, new cas-es have been rising relentlessly, breaching their previous peak by early December (Chart 11). State officials have so far resisted the urge to implement new restrictions, though statewide sales of alcohol past 11 p.m. have been prohibited since July. With cases on the rise, the labor market recovery will likely shift into lower gear in the near-term. Jobs in high-touch services industries, which account for an above-average proportion of the state’s employment, are the most at risk. As of October, about 66% of the payrolls lost in leisure and hospitality during the spring had been recovered in the state, a higher share than at the national level (58%). Still, in tourism-dependent coastal cities like Charleston and Myrtle Beach, a full recovery will probably not occur until a vaccine is widely distributed.
In the meantime, the Palmetto State can count on its transportation and warehousing sector to put a floor un-der economic growth. Indeed, the recovery in global trade is boosting activity at South Carolina’s major ports, with November marking a record month for containers handled – up 12% from a year earlier. Looking ahead, port activities will also receive a boost from a $220 million direct import distribution center Walmart is constructing in the state. This large-scale investment is expected to generate 1,000 full-time jobs, while boosting port volumes by 5%.There have also been positive developments on the manu-facturing front. Notably, Arrival, a British commercial elec-tric vehicle company, is investing $46 million to build its first U.S.-based factory in South Carolina. It has plans to begin production as early as next year. Another piece of good news: Boeing, which previously shared the manufac-turing process of its 787 Dreamliner between South Caro-lina and Washington State, has officially announced the consolidation of its production lines in the state. Still, the outlook is not without a few headwinds for South Carolina’s economy. Sales of new vehicles, which rebounded impressively in the early stages of the recovery, have pulled back in the last couple of months. Similarly, even with a vac-cine, a return to more normal levels of activity will likely take some time in the airline industry, weighing on the recovery in the state’s aerospace manufacturing sector.All considered, South Carolina is expected to see a 4% con-traction in real GDP this year followed by a 4.5% rebound in 2021.
2
4
6
8
10
12
14
2005 2006 2008 2010 2011 2013 2015 2016 2018 2020
Source: Bureau of Labor Statistics, TD Economics. Last observation: October 2020.
Unemployment Rate, South Carolina, %
Chart 10: South Carolina's Unemployment Rate Continues to Fall as Economic Recovery Strengthens
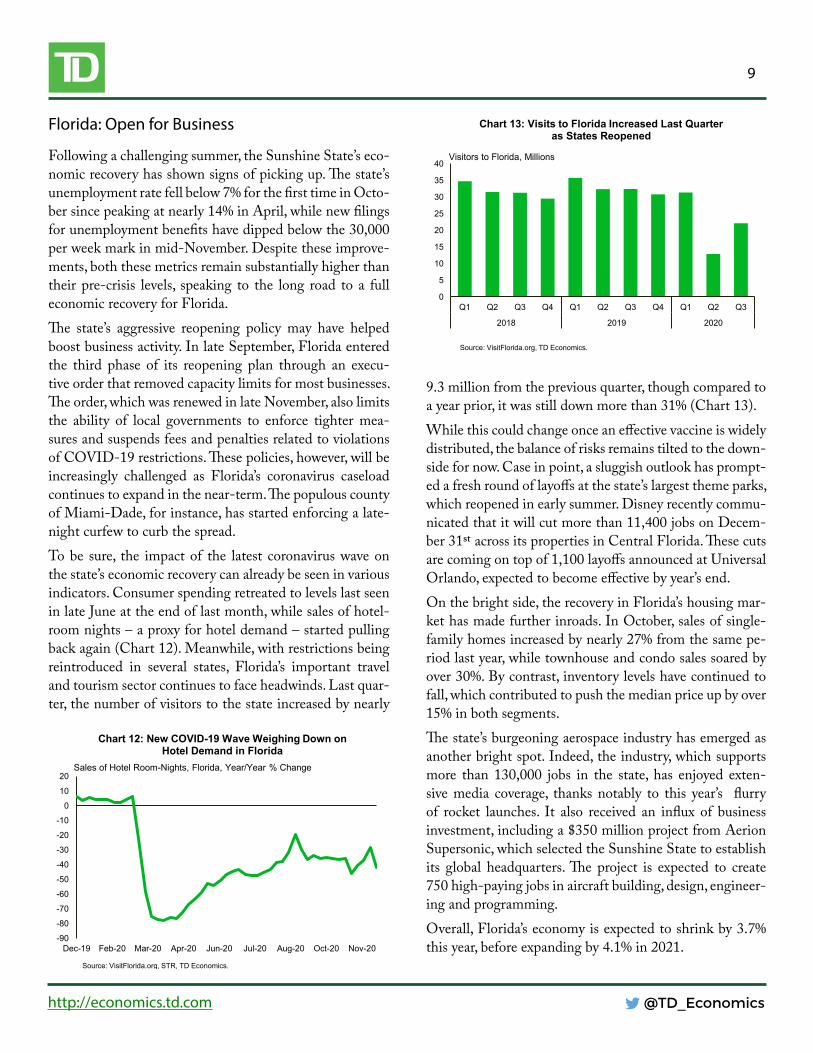
9.3 million from the previous quarter, though compared to a year prior, it was still down more than 31% (Chart 13). While this could change once an effective vaccine is widely distributed, the balance of risks remains tilted to the down-side for now. Case in point, a sluggish outlook has prompt-ed a fresh round of layoffs at the state’s largest theme parks, which reopened in early summer. Disney recently commu-nicated that it will cut more than 11,400 jobs on Decem-ber 31st across its properties in Central Florida. These cuts are coming on top of 1,100 layoffs announced at Universal Orlando, expected to become effective by year’s end. On the bright side, the recovery in Florida’s housing mar-ket has made further inroads. In October, sales of single-family homes increased by nearly 27% from the same pe-riod last year, while townhouse and condo sales soared by over 30%. By contrast, inventory levels have continued to fall, which contributed to push the median price up by over 15% in both segments.The state’s burgeoning aerospace industry has emerged as another bright spot. Indeed, the industry, which supports more than 130,000 jobs in the state, has enjoyed exten-sive media coverage, thanks notably to this year’s flurry of rocket launches. It also received an influx of business investment, including a $350 million project from Aerion Supersonic, which selected the Sunshine State to establish its global headquarters. The project is expected to create 750 high-paying jobs in aircraft building, design, engineer-ing and programming. Overall, Florida’s economy is expected to shrink by 3.7% this year, before expanding by 4.1% in 2021.
Florida: Open for Business
Following a challenging summer, the Sunshine State’s eco-nomic recovery has shown signs of picking up. The state’s unemployment rate fell below 7% for the first time in Octo-ber since peaking at nearly 14% in April, while new filings for unemployment benefits have dipped below the 30,000 per week mark in mid-November. Despite these improve-ments, both these metrics remain substantially higher than their pre-crisis levels, speaking to the long road to a full economic recovery for Florida. The state’s aggressive reopening policy may have helped boost business activity. In late September, Florida entered the third phase of its reopening plan through an execu-tive order that removed capacity limits for most businesses. The order, which was renewed in late November, also limits the ability of local governments to enforce tighter mea-sures and suspends fees and penalties related to violations of COVID-19 restrictions. These policies, however, will be increasingly challenged as Florida’s coronavirus caseload continues to expand in the near-term. The populous county of Miami-Dade, for instance, has started enforcing a late-night curfew to curb the spread.To be sure, the impact of the latest coronavirus wave on the state’s economic recovery can already be seen in various indicators. Consumer spending retreated to levels last seen in late June at the end of last month, while sales of hotel-room nights – a proxy for hotel demand – started pulling back again (Chart 12). Meanwhile, with restrictions being reintroduced in several states, Florida’s important travel and tourism sector continues to face headwinds. Last quar-ter, the number of visitors to the state increased by nearly
DisclaimerThis report is provided by TD Economics. It is for informational and educational purposes only as of the date of writing, and may not be appropriate for other purposes. The views and opinions expressed may change at any time based on market or other conditions and may not come to pass. This material is not intended to be relied upon as investment advice or recommendations, does not constitute a solicitation to buy or sell securities and should not be considered specific legal, investment or tax advice. The report does not provide material information about the business and affairs of TD Bank Group and the members of TD Economics are not spokespersons for TD Bank Group with respect to its business and affairs. The information contained in this report has been drawn from sources believed to be reliable, but is not guaranteed to be accurate or complete. This report contains economic analysis and views, including about future economic and financial markets performance. These are based on certain assumptions and other factors, and are subject to inherent risks and uncertainties. The actual outcome may be materially different. The Toronto-Dominion Bank and its affiliates and related entities that comprise the TD Bank Group are not liable for any errors or omissions in the information, analysis or views contained in this report, or for any loss or damage suffered.