139
State Education Indicators With a Focus on Title I: 2002-03 U. S. D E P A R T M E N T O F E D U C A T I O N

State Education Indicators With a Focus on Title I: 2002-03
U. S. D E p a r T m E n T o F E D U c a T I o n
�
State Educat ion IndicatorsWith a Focus on Ti t le I
2002-03
ByAndra Wi l l iamsRol f K. B lank
Car la ToyeAdam Petermann
Counci l of Chief State School Off icersWashington, D.C.
Prepared for :U.S. Department of Educat ion
Off ice of P lanning, Evaluat ion and Pol icy Development 2007

��
This report was prepared for the U.S. Department of Education under Contract No. ED-01-CO-0040-0001. The project monitors were Jessica Hausman and Adrienne Hosek in the Policy and Program Studies Service. The views expressed herein are those of the contractor. No official endorsement by the U.S. Department of Education is intended or should be inferred.
U.S.DepartmentofEducat�onMargaret SpellingsSecretary
OfficeofPlann�ng,Evaluat�onandPol�cyDevelopmentDoug MesecarActing Assistant Secretary
Pol�cyandProgramStud�esServ�ceAlan GinsburgDirector
ProgramandAnalyt�cStud�esD�v�s�onDavid Goodwin Director
July 2007
This report is in the public domain. Authorization to reproduce it in whole or in part is granted. While permission to reprint this publication is not necessary, the citation should be: U.S. Department of Education, Office of Planning, Evaluation and Policy Development, Policy and Program Studies Service, State Education Indicators With a Focus on Title I, 2002-03, Washington, D.C., 2007.
This report is available on the Department’s Web site at: http://www.ed.gov/about/offices/list/opepd/reports.html.
On request, this publication is available in alternate formats, such as Braille, large print, or computer diskette. For more information, please contact the Department’s Alternate Format Center at (202) 260-0852 or (202) 260-0818.

���
ContentsTables.......................................................................................................................................................................................................................................................ivIntroduction .............................................................................................................................................................................................................................................vAcknowledgments .................................................................................................................................................................................................................................ixNational.Summary ................................................................................................................................................................................................................................ 1State.Profiles ........................................................................................................................................................................................................................................ 11
Alabama ..........................................12Alaska .............................................14Arizona ............................................16Arkansas ..........................................18California .........................................20Colorado ..........................................22Connecticut ......................................24Delaware .........................................26District of Columbia ..........................28Florida .............................................30Georgia ............................................32Hawaii .............................................34Idaho ...............................................36Illinois ..............................................38
Nevada ............................................68New Hampshire ...............................70New Jersey .......................................72New Mexico .....................................74New York .........................................76North Carolina .................................78North Dakota ...................................80Ohio ................................................82Oklahoma ........................................84Oregon ............................................86Pennsylvania ....................................88Puerto Rico ......................................90Rhode Island ....................................92South Carolina .................................94
Indiana ............................................40Iowa ................................................42Kansas .............................................44Kentucky ..........................................46Louisiana .........................................48Maine ..............................................50Maryland .........................................52Massachusetts .................................54Michigan ..........................................56Minnesota ........................................58Mississippi .......................................60Missouri ...........................................62Montana ..........................................64Nebraska .........................................66
South Dakota .................................. 96Tennessee ....................................... 98Texas ............................................ 100Utah ............................................. 102Vermont ........................................ 104Virginia ......................................... 106Washington .................................. 108West Virginia ................................. 110Wisconsin ..................................... 112Wyoming ...................................... 114
AppendixesAppendix A: Sources ........................................................................................................................................................................................................................... 117Appendix B: State Definitions of Proficient ........................................................................................................................................................................................... 121Appendix C: National Assessment of Educational Progress—Definitions and Further Information .......................................................................................................... 127

�v
Tables
Table.1:.State.Assessments,.Number.of.Student.Proficiency.Levels,.and.Years.of.Consistent.Assessment.Data,.2002-03 ....................................................................... 2Table.2:.Percentage.of.Students.Achieving.At.or.Above.Each.State’s.Proficient.Level,.by.Grade.Level,.in.Reading.or.Language.Arts.and.Mathematics,.2002-03. ......... 4Table.3:.Trends.in.the.Percentage.of.Students.Achieving.At.or.Above.Each.State’s.Proficient.Level,.in.Elementary.Reading.or.Language.Arts.and.in.Middle.Grades.......Mathematics,.1996.to.2003 ................................................................................................................................................................................................................. 6Table.4:.Links.to.State.Report.Cards.for.More.Information.on.Student.Accountability.and.Assessment ................................................................................................. 8
v
IntroductionReport Objectives and Design
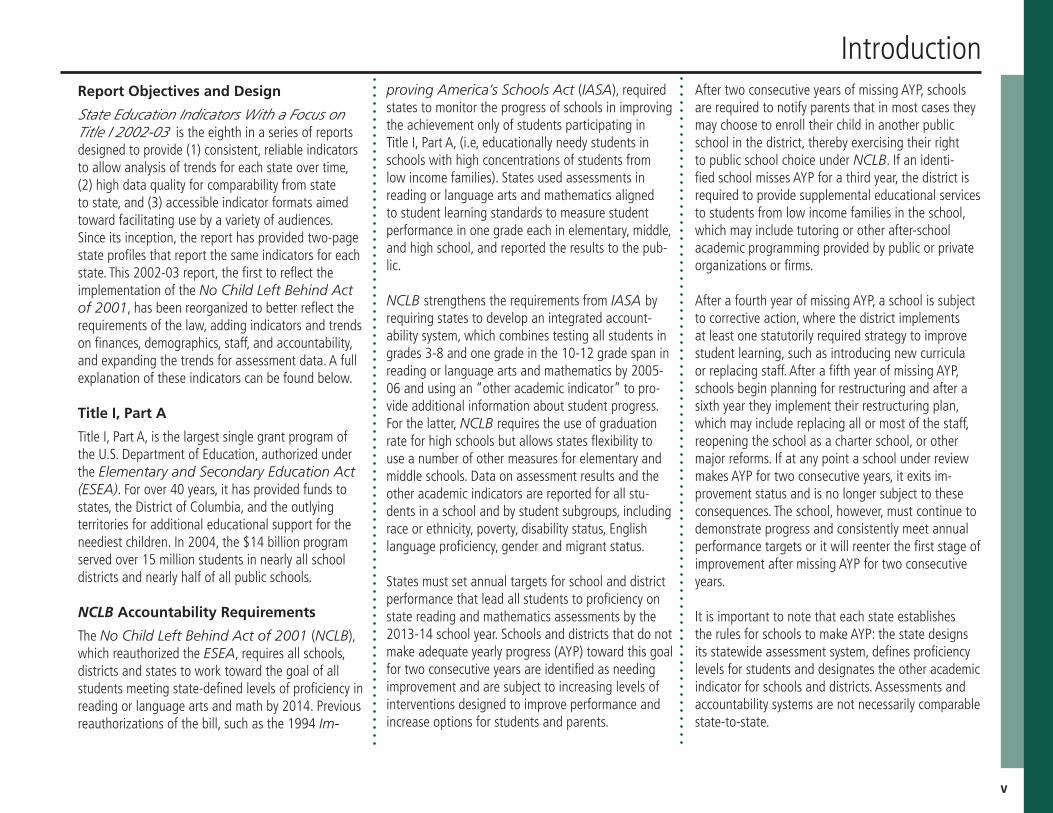
State Education Indicators With a Focus on Title I 2002-03 is the eighth in a series of reports designed to provide (1) consistent, reliable indicators to allow analysis of trends for each state over time, (2) high data quality for comparability from state to state, and (3) accessible indicator formats aimed toward facilitating use by a variety of audiences. Since its inception, the report has provided two-page state profiles that report the same indicators for each state. This 2002-03 report, the first to reflect the implementation of the No Child Left Behind Act of 2001, has been reorganized to better reflect the requirements of the law, adding indicators and trends on finances, demographics, staff, and accountability, and expanding the trends for assessment data. A full explanation of these indicators can be found below. Title I, Part A
Title I, Part A, is the largest single grant program of the U.S. Department of Education, authorized under the Elementary and Secondary Education Act (ESEA). For over 40 years, it has provided funds to states, the District of Columbia, and the outlying territories for additional educational support for the neediest children. In 2004, the $14 billion program served over 15 million students in nearly all school districts and nearly half of all public schools. NCLB Accountability Requirements
The No Child Left Behind Act of 2001 (NCLB), which reauthorized the ESEA, requires all schools, districts and states to work toward the goal of all students meeting state-defined levels of proficiency in reading or language arts and math by 2014. Previous reauthorizations of the bill, such as the 1994 Im-
proving America’s Schools Act (IASA), required states to monitor the progress of schools in improving the achievement only of students participating in Title I, Part A, (i.e, educationally needy students in schools with high concentrations of students from low income families). States used assessments in reading or language arts and mathematics aligned to student learning standards to measure student performance in one grade each in elementary, middle, and high school, and reported the results to the pub-lic.
NCLB strengthens the requirements from IASA by requiring states to develop an integrated account-ability system, which combines testing all students in grades 3-8 and one grade in the 10-12 grade span in reading or language arts and mathematics by 2005-06 and using an “other academic indicator” to pro-vide additional information about student progress. For the latter, NCLB requires the use of graduation rate for high schools but allows states flexibility to use a number of other measures for elementary and middle schools. Data on assessment results and the other academic indicators are reported for all stu-dents in a school and by student subgroups, including race or ethnicity, poverty, disability status, English language proficiency, gender and migrant status.
States must set annual targets for school and district performance that lead all students to proficiency on state reading and mathematics assessments by the 2013-14 school year. Schools and districts that do not make adequate yearly progress (AYP) toward this goal for two consecutive years are identified as needing improvement and are subject to increasing levels of interventions designed to improve performance and increase options for students and parents.
After two consecutive years of missing AYP, schools are required to notify parents that in most cases they may choose to enroll their child in another public school in the district, thereby exercising their right to public school choice under NCLB. If an identi-fied school misses AYP for a third year, the district is required to provide supplemental educational services to students from low income families in the school, which may include tutoring or other after-school academic programming provided by public or private organizations or firms.
After a fourth year of missing AYP, a school is subject to corrective action, where the district implements at least one statutorily required strategy to improve student learning, such as introducing new curricula or replacing staff. After a fifth year of missing AYP, schools begin planning for restructuring and after a sixth year they implement their restructuring plan, which may include replacing all or most of the staff, reopening the school as a charter school, or other major reforms. If at any point a school under review makes AYP for two consecutive years, it exits im-provement status and is no longer subject to these consequences. The school, however, must continue to demonstrate progress and consistently meet annual performance targets or it will reenter the first stage of improvement after missing AYP for two consecutive years.
It is important to note that each state establishes the rules for schools to make AYP: the state designs its statewide assessment system, defines proficiency levels for students and designates the other academic indicator for schools and districts. Assessments and accountability systems are not necessarily comparable state-to-state.

v�
Guide to State Indicator Profiles
The state profiles in this report contain key indicators for K-12 public education. They focus on the status of each indicator as of the 2002-03 school year, the first year of the implementation of NCLB, and many indicators also include data for a baseline year for the purpose of analyzing trends over time. The sources section at the end of the publication provides more detailed information and explanations for the indica-tors. The indicators in each state profile are organized into seven categories:
Districts and Schools
The indicators in this category provide a statewide picture of characteristics of the public K-12 school system as of 2002-03, including the number of dis-tricts, public schools, and charter schools in the state. A comparison number from 1993-94 is provided to give a picture of how the state’s school systems have changed over time, and to reflect change since the 1994 ESEA reauthorization. These data are from the Common Core of Data (CCD), collected from state departments of education by the National Center for Education Statistics (NCES).
Finances
Four financial data elements are included in this report: total current expenditures, including in-structional, noninstructional, and support; per-pupil expenditures; sources of funding; and Title I, Part A, allocation. These figures provide a picture of school finances for each state, demonstrating how funding is distributed, as well as the relationship between fed-eral funding allocations and state and local resources. Data are collected from CCD surveys through NCES and the Budget Office of the U. S. Department of Education.
Students
An important aspect of the accountability system requirements under NCLB is the disaggregation of student achievement results by student subgroup. This section of the profile reports student enroll-ment across grades, as well as trends in the student populations in each state, particularly characteristics of students by race or ethnicity, poverty, disability status, English language proficiency, and migrant sta-tus. The bar graph showing counts of public schools by the percentage of students eligible for the free or reduced-price lunch program (i.e., students from low-income families) is useful for reviewing the disag-gregated student achievement results reported on the second page of each profile. Data on students in each state are collected from several sources, including NCES, program offices within the U. S. Department of Education, and the National Assessment of Educa-tional Progress (NAEP).
Staff
This section provides information about educators, including the number of teachers and non-teach-ing staff in each state from data collected by NCES through the CCD. A third data element, the percent-age of teachers with a major in the main subject taught, grades 7-12, is reported from results of the Schools and Staffing Survey, a periodic sample survey of teachers and schools conducted by NCES.
The final figure in this section, percentage of core courses taught by highly qualified teachers, 2002-03, was reported by states through the Consoli-dated State Performance Report. In 2002-03, NCLB required that all newly hired teachers in assignments supported with Title I, Part A, funds be “highly qualified,” and by 2005-06 all teachers teaching
in core academic subjects had to be “highly quali-fied.” NCLB provides a framework by which states label teachers as “highly qualified.” Because the law requires each state to create its own rubric for evaluating experienced teachers, these indictors are not comparable across states.
Outcomes
Three measures of student outcomes are reported in the national and state profiles: the high school “event” dropout rate; the averaged freshman gradu-ation rate, a calculation of high school graduation rates; and the college-going rate.
The high school dropout rate is based on the CCD “event rate” that reports the annual percent of students in grades 9-12 that drop out of school. This measure may underestimate the actual number of students that drop out of high school, because it indicates only the percent of students that dropped out of high school within a single year and not the cumulative dropout rate for each student cohort over a lifetime.
An alternate estimate of student attrition, the aver-aged freshman graduation rate, is reported for com-parison purposes. The indicator is a new calculation from NCES. It uses aggregate student enrollment data to estimate the size of an incoming freshman class and aggregate counts of the number of regular di-plomas awarded four years later. While the averaged freshman graduation rate is the best measure of the graduation rate that is currently available, it has sev-eral flaws that affect its accuracy and reliability. The calculation for each state is based on local definitions of what constitutes a high school diploma, which vary considerably. For example, this definition may or may

v��
not include students graduating with a GED or other alternative credential. The graduation rate also does not take into account student mobility across districts or states, or into or out of private schools, nor does it include students who repeated a grade in high school or those who graduated early. Another outcome pro-vided is the college-going rate, which measures the percent of high school graduates in a state enrolled in any postsecondary education institution in the fall of the following school year, as reported by NCES.
Finally, this section also includes test results from the National Assessment of Educational Progress (NAEP) in reading and mathematics, which are comparable across states. Prior to the passage of NCLB, state participation in NAEP was voluntary and reading and mathematics tests were given in four-year cycles. Under NCLB, each state is now required to partici-pate in each two-year cycle of the NAEP, starting with 2002 for reading and 2003 for mathematics. The NAEP for these subjects is administered to a repre-sentative sample of students in each state (approxi-mately 2,000 students), producing state-level scores for grades 4 and 8 reading and mathematics. Data for 1994 (reading) and 1996 (mathematics) NAEP are provided in order to show trends, as these years are closest to the 1993-94 baseline used for the remain-der of the report.
Statewide Accountability Information
The first column on the second page of each state profile provides a snapshot of state accountability systems for the 2002-03 school year, the first year of NCLB implementation. Accountability information is presented for each state, including the name of the state’s accountability system, the assessments used, the subjects included for state-level accountability
determinations, and the performance levels used to report student achievement.
This section provides information on accountability goals for one grade in elementary, middle, and high school (the same as the assessment data reported in the second column of the second page of each profile) in reading or language arts (or the state’s equivalent) and mathematics. The annual measurable objective (AMO) target provides an indication of how many students in each student group must perform at or above the state-defined proficient level for 2002-03 in order to make adequate yearly progress (AYP) on the state’s trajectory toward 100 percent profi-ciency by 2013-14. The starting point of the trajec-tory for most states was 2001-02, and the target for 2002-03 is also displayed. The latter number is useful for reviewing the achievement information presented in the second column on the second page.
Accountability results are based on school and district performance against three criteria: disaggregated student assessment results, student participation on state assessments, and performance on the other indicator selected by the state. Any consequences are applied in the following school year. The middle part of this column provides information on school and district performance, including the number that made AYP, the number identified for improvement (due to missing AYP two or more years in a row), and the number that exited school improvement status (after making AYP two years in a row).
Each state chooses its own assessment, sets its own learning standards, and determines the level of proficiency expected of its students. As a result, AYP results, as well as AMOs and targets are not compa-rable from state-to-state.
Student Achievement 2002-03
The second column on page 2 of the profile includes state student assessment information, including the name of the assessment, the subject assessed, and disaggregated results for one grade in elementary, middle, and high school. Due to limited space, the profile does not include all disaggregated scores and grades assessed. However, NCLB requires the assessment of all students in grades 3-8 and once in the 10-12 grade span in reading or language arts and mathematics by the 2005-06 school year, and that these assessment results be reported for state-de-fined performance levels by the following categories: all students and students disaggregated by economic disadvantage, limited English proficiency, disability, migrant status, gender, and race or ethnicity. (While reporting by migrant status and gender is required by NCLB, these two indicators are not used in deter-mining AYP.) In the 2002-03 school year, all states reported in all of these categories, according to the guidelines of NCLB.
To illustrate recent achievement trends, two charts are provided showing a three-year trend, where available, for the percentage of students achieving at the state’s proficient level or above in reading and mathematics for one grade each in elementary, middle, and high school.
Nationwide Data
In addition to providing individual state profiles, this report includes three tables that provide national summary information. Table 1 on page 2 provides a summary of state assessments, the number of levels for which student achievement is reported, and the number of years consistent data is available. Table 2 on page 4 provides a summary of student per-
v���
formance in elementary and middle schools at the proficient level or higher by state. Table 3 on page 6 provides a summary of student achievement trends for elementary reading or language arts and middle grades mathematics from 1995-96 through 2002-03 for states that have used consistent tests, standards and performance levels. Finally, Table 4 on page 8 provides a table of links to state reports where disag-gregated state reporting data are located.

�x
AcknowledgmentsThe Council of Chief State School Officers received valuable contributions from many organizations and individuals in preparing State Education Indicators With a Focus on Title I 2002-03. We consider the report a collaborative effort.
We received strong support from chief state school officers, state assessment directors, and state Title I directors for the idea of a 50-state report profiling key statewide education indicators and indicators of progress of Title I programs. States provided excellent cooperation in reporting not only the state assessment data required under Title I but also further details about state assessment systems and student demo-graphics that provide the context for analyzing assess-ment results. State education staff carefully reviewed the data in the state profiles and provided important suggestions for improving the report, and we thank them for their continued assistance which makes the profiles possible.
Funding support for the State Education Indicators report was provided under a task order from the U.S. Department of Education, Policy and Program Stud-ies Service. We very much appreciate the guidance and assistance provided by staff in the Policy and Program Studies Service, especially Jessica Hausman and Adrienne Hosek, as well as staff from the Office of Elementary and Secondary Education, especially Mary Moran and Chuck Laster. The National Center for Edu-cation Statistics provided access to data files from the Common Core of Data, NAEP, and Schools and Staff-ing Survey, and we particularly thank John Sietsema and Lee Hoffman for their assistance. The database for the state profiles was developed in collaboration with Westat, Inc., and we appreciate the efforts of Beth
Sinclair, Nina Blecher, and Babette Gutmann in data collection and project support.
We appreciate the support and encouragement from our Technical Working Group, who contributed signifi-cantly to the profile redesign: Dale Carlson, Kerstin Le-Floch, Peter Prowda, Pat Roschewski, Lani Seikaly, Beth Sinclair, Robin Taylor, Lee Hoffman, Daphne Kaplan, Joseph McCrary, Mary Moran, and Stephanie Stullich.
The data were proofed by Carla Toye, Nina de las Alas, and Carlise Smith. The state assessment directors, Title I coordinators, and CCD coordinators reviewed the profiles and proofed the state assessment data. The EIMAC subcommittee on assessment, co-chaired by Sally Tiel (Idaho) and Louis Fabrizio (North Carolina), reviewed the design and offered suggestions.

x
�
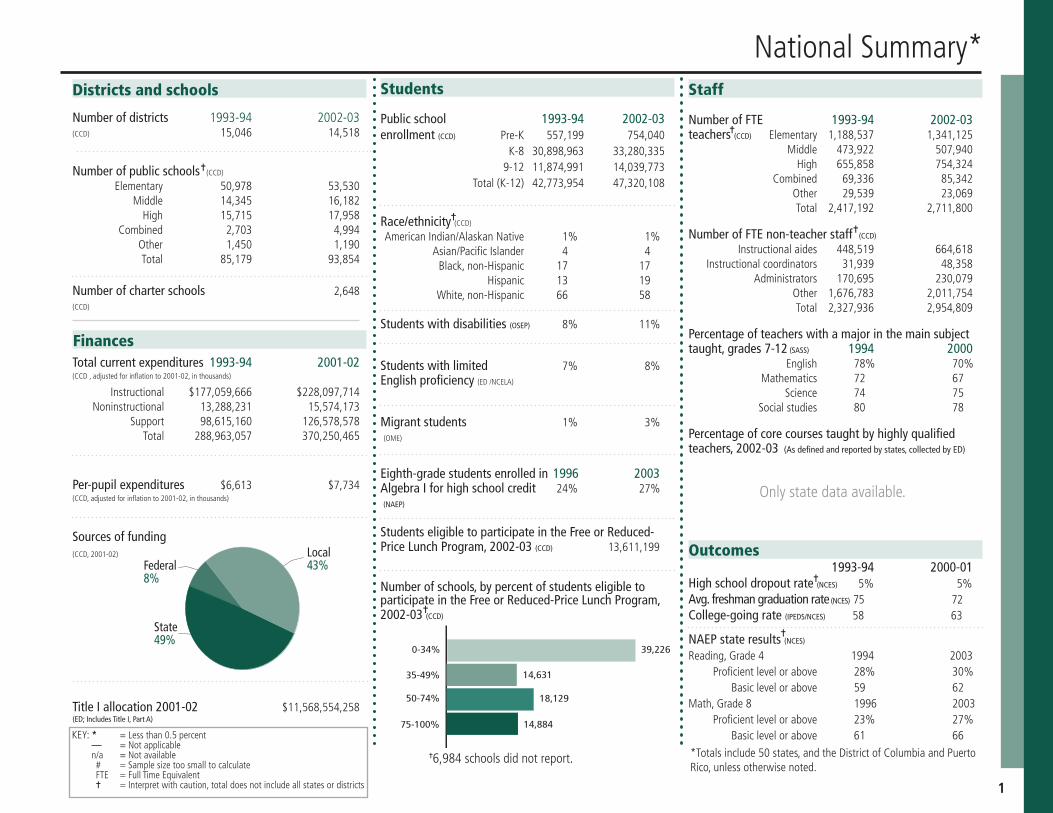
KEY: * =Less than 0.5 percentKEY: — =Not applicableKEY: n/a =Not available # = Sample size too small to calculate FTE = Full Time Equivalent ^ = Interpret with caution, total does not include all states or districts
Staff
NumberofFTE 1993-94 2002-03teachers(CCD) Elementary 1,188,537 1,341,125 Middle 473,922 507,940 High 655,858 754,324 Combined 69,336 85,342 Other 29,539 23,069 Total 2,417,192 2,711,800
NumberofFTEnon-teacherstaff(CCD)
Instructional aides 448,519 664,618 Instructional coordinators 31,939 48,358 Administrators 170,695 230,079 Other 1,676,783 2,011,754 Total 2,327,936 2,954,809
Percentageofteacherswithamajorinthemainsubjecttaught,grades7-12(SASS) 1994 2000 English 78% 70% Mathematics 72 67 Science 74 75 Social studies 80 78
Percentageofcorecoursestaughtbyhighlyqualifiedteachers,2002-03(Asdefinedandreportedbystates,collectedbyED)
Students
Publicschool 1993-94 2002-03enrollment(CCD) Pre-K 557,199 754,040 K-8 30,898,963 33,280,335 9-12 11,874,991 14,039,773 Total (K-12) 42,773,954 47,320,108
Race/ethnicity(CCD) American Indian/Alaskan Native 1% 1% Asian/Pacific Islander 4 4 Black, non-Hispanic 17 17 Hispanic 13 19 White, non-Hispanic 66 58Studentswithdisabilities(OSEP) 8% 11%
Studentswithlimited 7% 8%Englishproficiency(ED /NCELA)
Migrantstudents 1% 3%(OME)
Eighth-gradestudentsenrolledin 1996 2003AlgebraIforhighschoolcredit 24% 27% (NAEP)
StudentseligibletoparticipateintheFreeorReduced-PriceLunchProgram,2002-03(CCD) 13,611,199 Outcomes
1993-94 2000-01Highschooldropoutrate(NCES) 5% 5%Avg.freshmangraduationrate(NCES) 75 72College-goingrate(IPEDS/NCES) 58 63
NAEPstateresults(NCES)Reading, Grade 4 1994 2003 Proficient level or above 28% 30% Basic level or above 59 62Math, Grade 8 1996 2003 Proficient level or above 23% 27% Basic level or above 61 66
Numberofdistricts 1993-94 2002-03 (CCD) 15,046 14,518
Numberofpublicschools(CCD)
Elementary 50,978 53,530 Middle 14,345 16,182 High 15,715 17,958 Combined 2,703 4,994 Other 1,450 1,190 Total 85,179 93,854
Numberofcharterschools 2,648(CCD)
Districts and schools
Numberofschools,bypercentofstudentseligibletoparticipateintheFreeorReduced-PriceLunchProgram,2002-03(CCD)
Sourcesoffunding(CCD, 2001-02)
TitleIallocation2001-02 $11,568,554,258 (ED;IncludesTitleI,PartA)
Totalcurrentexpenditures 1993-94 2001-02(CCD , adjusted for inflation to 2001-02, in thousands)
Instructional $177,059,666 $228,097,714 Noninstructional 13,288,231 15,574,173 Support 98,615,160 126,578,578 Total 288,963,057 370,250,465
Per-pupilexpenditures $6,613 $7,734(CCD, adjusted for inflation to 2001-02, in thousands)
0-34%
35-49%
50-74%
75-100%
14,631
18,129
14,884
39,226
Finances
National Summary*
*Totals include 50 states, and the District of Columbia and Puerto Rico, unless otherwise noted.
Federal8%
State49%
Local43%
^
^
^
^
^
Only state data available.
^
^
^6,984 schools did not report.

�
Table 1: State Assessments, Number of Student Proficiency Levels, and Years of Consistent Assessment Data, 2002-03
State Number of student Years of State assessment* proficiency levels consistent data Alabama Stanford 10 n/a — Alaska Alaska Benchmark Exams 4 2 Arizona Arizona’s Instrument to Measure Standards (AIMS) 4 — Arkansas Arkansas Benchmark Exams 4 — California California Standards Tests, California High School Exit Exam 5 3 (Reading) Colorado Colorado Student Assessment Program 4 7 Connecticut CMT 5 4 Delaware Delaware Student Testing Program 5 4 District of Columbia Stanford 9 4 — Florida Florida Comprehensive Assessment Test 5 3 Georgia Criterion-Referenced Competency Tests (CRCT) 3 4 Georgia High School Graduation Tests 3 — Hawaii Hawaii Content and Performance Standards II 4 2 Idaho Idaho State Achievement Tests 3 — Illinois Illinois Standards Achievement Test (ISAT) 4 5 Indiana Indiana Statewide Testing for Educational Progress Plus (ISTEP+) 3 3 Iowa Iowa Tests of Basic Skills, Iowa Test of Ed. Dev. 3 3 Kansas Kansas Assessment Program 5 4 Kentucky Kentucky Core Content Test 4 5 Louisiana Louisiana Educational Assessment Program 5 3 Maine Maine Educational Assessment 4 5 Maryland Maryland School Assessments 3 — Massachusetts Massachusetts Comprehensive Assessment System 4 4 Michigan Michigan Educational Assessment Program 4 7 (Reading) Minnesota Minnesota Comprehensive Assessment 5 7 (Math) Mississippi Mississippi Curriculum Test 4 — Missouri Missouri Assessment Program 5 6 Montana Montana Comprehensive Assessment System 4 3 Nebraska School-based Teacher-led Assessment and Reporting System (STARS) 4 — Nevada Nevada Criterion-Referenced Tests 4 —
Assessments

�
State Number of student Years of State assessment* proficiency levels consistent data New Hampshire New Hampshire Educational Improvement and Assessment Program 4 — New Jersey New Jersey Skills and Knowledge Assessment 3 5 New Mexico New Mexico Standards Based Assessment 4 — New York New York State Tests 4 — North Carolina North Carolina End of Grade Mathematics/Reading 4 8 North Dakota North Dakota State Assessment 4 — Ohio Ohio Proficiency Test 4 3 Oklahoma Oklahoma Core Curriculum Tests 4 4 Oregon Oregon State Assessments 5 3 Pennsylvania Pennsylvania System of School Assessment 4 3 Puerto Rico Pruebas Puertorriqueñas de Aprovechamiento Académico 3 — Rhode Island New Standards Reference Exam 2 — South Carolina Palmetto Achievement Challenge Test 4 5 South Dakota Dakota State Test of Educational Progress 4 — Tennessee Tennessee Achievement Test 3 — Texas Texas Assessment of Knowledge and Skills (TAKS) 3 — Utah Utah Performance Assessment System for Students 4 — Vermont New Standards Reference Examinations 5 — Virginia Standards of Learning Assessments 3 6 Washington Washington Assessment of Student Learning 4 3 West Virginia WESTEST 5 — Wisconsin Wisconsin Knowledge and Concepts Examinations, WAA-SWD, WAA-LEP 4 5 Wyoming Wyoming Comprehensive Assessment System 3 — Nation (50 states plus the 3 levels: 15 states At least 3 years: 35 states District of Columbia and 4 levels: 24 states 4-6 years: 12 states Puerto Rico) 5 levels: 11 states More than 6 years: 4 states
*More information on assessments can be found in state profiles beginning on page 12.Source: State assessment results submitted in the Consolidated Report, Section B, 2002-03, and follow-up by CCSSO with the State Education Accountability Reports and Indicator Reports: Status of Reports across the States, 2003. Note: The column showing “Years of Consistent Data” indicates the number of years that the state had a consistent test in the same grades and a consistent definition of proficient in at least one subject and grade included in this report. See state profiles beginning on page 12 for more details.

�
State term for proficient
Elementary school Middle school High school
Reading Mathematics Reading Mathematics Reading MathematicsAlabama – Grade 4, 63% Grade 4, 64% Grade 8, 59% Grade 8, 56% – –
Alaska Proficient Grade 3, 74% Grade 3, 72% Grade 8, 68% Grade 8, 64% High school,70% High school, 70%
Arizona Meets the standard Grade 3, 64% Grade 3, 57% Grade 8, 46% Grade 8, 18% High school, 52% High school, 32%
Arkansas Proficient Grade 4, 61% Grade 4, 60% Grade 8, 42% Grade 8, 22% High school, 41% High school, 43%
California Proficient Grade 4, 39% Grade 4, 46% Grade 8, 31% Grade 8, 29% High school, 48% High school, 39%
Colorado Proficient Grade 4, 87% Grade 5, 87% Grade 8, 89% Grade 8, 69% Grade 10, 88% Grade 10, 64%
Connecticut Proficient Grade 4, 69% Grade 4, 81% Grade 8, 78% Grade 8, 77% High school, 78% High school, 74%
Delaware Meets the standard Grade 3, 79% Grade 3, 74% Grade 8, 70% Grade 8, 47% Grade 10, 67% Grade 10, 45%
District of Columbia Proficient Grade 4, 46% Grade 4, 54% Grade 8, 42% Grade 8, 40% High school, 30% High school, 44%
Florida Level 4 Grade 4, 61% Grade 4, 56% Grade 8, 49% Grade 8, 57% Grade 10, 37% Grade 10, 62%
Georgia Meets the standard Grade 4, 80% Grade 4, 74% Grade 8, 81% Grade 8, 67% Grade 11, 95% Grade 11, 92%
Hawaii Meets proficiency Grade 3, 43% Grade 3, 24% Grade 8, 39% Grade 8, 17% High school, 40% High school, 18%
Idaho Proficient Grade 4, 75% Grade 4, 77% Grade 8, 74% Grade 8, 53% High school, 75% High school, 71%
Illinois Meets standards Grade 3, 62% Grade 3, 76% Grade 8, 64% Grade 8, 53% Grade 11, 56% Grade 11, 53%
Indiana Pass Grade 3, 72% Grade 3, 67% Grade 8, 64% Grade 8, 66% High school, 68% High school, 68%
Iowa High Grade 4, 76% Grade 4, 75% Grade 8, 69% Grade 8, 72% High school, 77% High school, 79%
Kansas Proficient Grade 5, 69% Grade 4, 74% Grade 8, 71% Grade 7, 60% Grade 11, 61% Grade 10, 46%
Kentucky Proficient Grade 4, 62% Grade 5, 38% Grade 7, 57% Grade 8, 31% High school, 31% High school, 33%
Louisiana Basic Grade 4, 61% Grade 4, 60% Grade 8, 55% Grade 8, 52% High school, 53% High school, 59%
Maine Meets the standard Grade 4, 49% Grade 4, 28% Grade 8, 45% Grade 8, 18% High school, 46% High school, 20%
Maryland Proficient Grade 3, 58% Grade 3, 65% Grade 8, 60% Grade 8, 40% High school, 61% High school, 43%
Massachusetts Proficient Grade 4, 56% Grade 4, 40% Grade 7, 66% Grade 8, 37% High school, 61% High school, 51%
Michigan Meets expectations Grade 4, 66% Grade 4, 66% Grade 7, 59% Grade 8, 54% High school, 64% High school, 43%
Minnesota Level III Grade 3, 76% Grade 3, 74% – – – –
Mississippi Proficient Grade 4, 87% Grade 4, 74% Grade 8, 57% Grade 8, 48% High school, 35% High school, 45%
Missouri Proficient Grade 3, 34% Grade 4, 37% Grade 7, 32% Grade 8, 14% High school, 22% High school, 12%
Montana Proficient Grade 4, 77% Grade 4, 75% Grade 8, 71% Grade 8, 70% Grade 11, 78% Grade 11, 77%
Nebraska Proficient Grade 4, 83% Grade 4, 82% Grade 8, 80% Grade 8, 75% High school, 77% High school, 65%
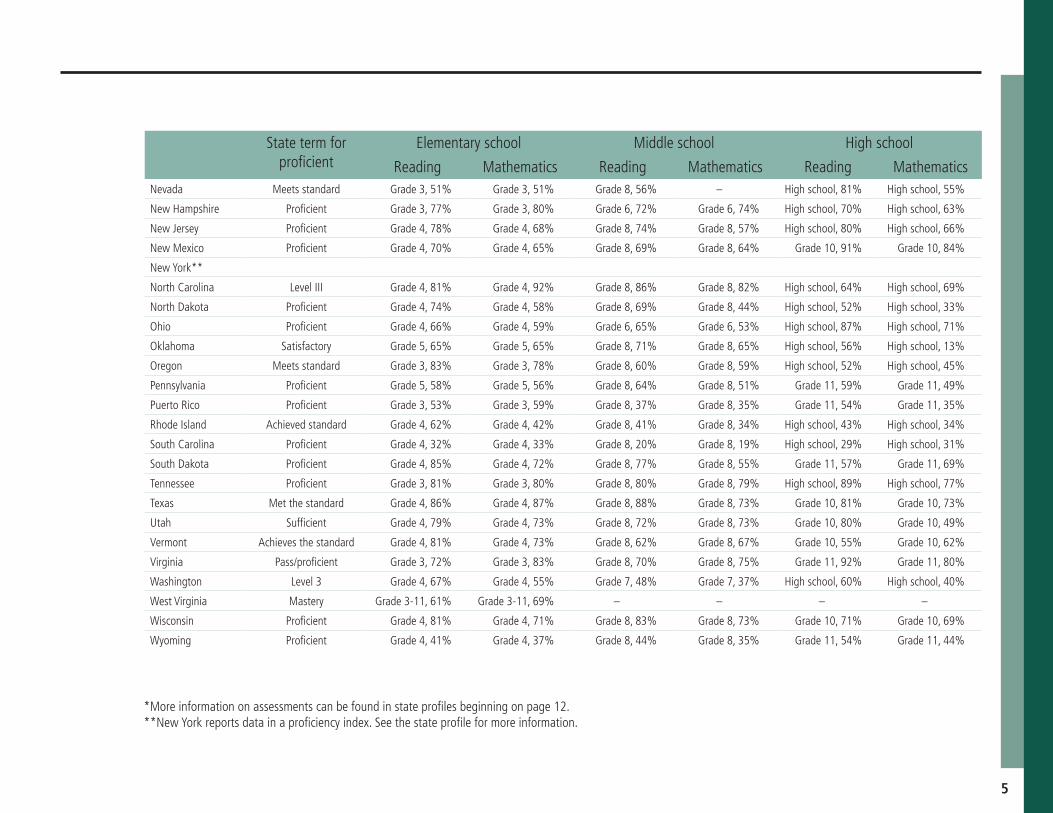
Table 2: Percentage of Students Achieving At or Above Each State’s Proficient Level, by Grade Level, in Reading or Language Arts and Mathematics, 2002-03
Summary of student performance 2002-03
�
State term for proficient
Elementary school Middle school High school
Reading Mathematics Reading Mathematics Reading MathematicsNevada Meets standard Grade 3, 51% Grade 3, 51% Grade 8, 56% – High school, 81% High school, 55%
New Hampshire Proficient Grade 3, 77% Grade 3, 80% Grade 6, 72% Grade 6, 74% High school, 70% High school, 63%
New Jersey Proficient Grade 4, 78% Grade 4, 68% Grade 8, 74% Grade 8, 57% High school, 80% High school, 66%
New Mexico Proficient Grade 4, 70% Grade 4, 65% Grade 8, 69% Grade 8, 64% Grade 10, 91% Grade 10, 84%
New York**
North Carolina Level III Grade 4, 81% Grade 4, 92% Grade 8, 86% Grade 8, 82% High school, 64% High school, 69%
North Dakota Proficient Grade 4, 74% Grade 4, 58% Grade 8, 69% Grade 8, 44% High school, 52% High school, 33%
Ohio Proficient Grade 4, 66% Grade 4, 59% Grade 6, 65% Grade 6, 53% High school, 87% High school, 71%
Oklahoma Satisfactory Grade 5, 65% Grade 5, 65% Grade 8, 71% Grade 8, 65% High school, 56% High school, 13%
Oregon Meets standard Grade 3, 83% Grade 3, 78% Grade 8, 60% Grade 8, 59% High school, 52% High school, 45%
Pennsylvania Proficient Grade 5, 58% Grade 5, 56% Grade 8, 64% Grade 8, 51% Grade 11, 59% Grade 11, 49%
Puerto Rico Proficient Grade 3, 53% Grade 3, 59% Grade 8, 37% Grade 8, 35% Grade 11, 54% Grade 11, 35%
Rhode Island Achieved standard Grade 4, 62% Grade 4, 42% Grade 8, 41% Grade 8, 34% High school, 43% High school, 34%
South Carolina Proficient Grade 4, 32% Grade 4, 33% Grade 8, 20% Grade 8, 19% High school, 29% High school, 31%
South Dakota Proficient Grade 4, 85% Grade 4, 72% Grade 8, 77% Grade 8, 55% Grade 11, 57% Grade 11, 69%
Tennessee Proficient Grade 3, 81% Grade 3, 80% Grade 8, 80% Grade 8, 79% High school, 89% High school, 77%
Texas Met the standard Grade 4, 86% Grade 4, 87% Grade 8, 88% Grade 8, 73% Grade 10, 81% Grade 10, 73%
Utah Sufficient Grade 4, 79% Grade 4, 73% Grade 8, 72% Grade 8, 73% Grade 10, 80% Grade 10, 49%
Vermont Achieves the standard Grade 4, 81% Grade 4, 73% Grade 8, 62% Grade 8, 67% Grade 10, 55% Grade 10, 62%
Virginia Pass/proficient Grade 3, 72% Grade 3, 83% Grade 8, 70% Grade 8, 75% Grade 11, 92% Grade 11, 80%
Washington Level 3 Grade 4, 67% Grade 4, 55% Grade 7, 48% Grade 7, 37% High school, 60% High school, 40%
West Virginia Mastery Grade 3-11, 61% Grade 3-11, 69% – – – –
Wisconsin Proficient Grade 4, 81% Grade 4, 71% Grade 8, 83% Grade 8, 73% Grade 10, 71% Grade 10, 69%
Wyoming Proficient Grade 4, 41% Grade 4, 37% Grade 8, 44% Grade 8, 35% Grade 11, 54% Grade 11, 44%
*More information on assessments can be found in state profiles beginning on page 12.**New York reports data in a proficiency index. See the state profile for more information.

�
Student achievement trendsTable 3: Trends in the Percentage of Students Achieving At or Above Each State’s Proficient Level,
in Elementary Reading or Language Arts and in Middle Grades Mathematics, 1996 to 2003State Grade Test Subject State term for Proficient** 1996 1997 1998 1999 2000 2001 2002 2003 California 4 California Standards Tests English/Lang. Arts Proficient – – – – – 33% 36% 39% Connecticut 4 Connecticut Mastery Test Reading Proficient – – – – 71% 71% 69% 69% 8 Mathematics – – – – 77% 76% 77% 77% Delaware 3 Del. Student Testing Program Reading Meets Standard – – – – 77% 78% 80% 79% 8 Mathematics – – – – 36% 43% 48% 47% Georgia 4 Criterion-Referenced Comp. Test Reading Meets Standard – – – – 65% 74% 77% 80% 8 Mathematics – – – – 54% 58% 65% 67% Illinois 3 Illinois Standards Achiev. Test Reading Meets Standards – – – 61% 62% 62% 63% 62% 8 Mathematics – – – 43% 47% 50% 52% 53% Iowa 4 Iowa Tests of Basic Skills Reading Proficient – – – – – 68% 69% 76% 8 Mathematics – – – – – 74% 73% 72% Kansas 5 Kansas Assessment Program Reading Proficient – – – – 62% 63% 63% 69% 7 Mathematics – – – – 53% 57% 56% 60% Kentucky 4 Kentucky Core Content Test Reading Proficient – – – 32% 57% 58% 60% 62% 8 Mathematics – – – 33% 25% 27% 26% 31% Maine 4 Maine Educational Assessment Reading Meets the Standard – – – 47% 45% 51% 49% 49% 8 Mathematics – – – 19% 21% 20% 21% 18% Mass. 4 Mass. Comp. Assmt. System English Lang. Arts Proficient – – – – 20% 51% 54% 56% 8 Mathematics – – – – 34% 34% 34% 37% Michigan 4 Mich. Educ. Assmt. Program Reading/Lang. Arts Met Expectations – 49% 59% 59% 58% 60% 57% 66% Missouri 3 Missouri Assessment Program Comm. Arts Proficient – – – 29% 32% 32% 36% 34% 8 Mathematics – – 13% 11% 14% 14% 14% 14% Montana 4 Iowa Tests of Basic Skills Reading Proficient – – – – – 79% 73% 77% 8 Mathematics – – – – – 69% 68% 70% New Jersey 4 New Jersey Proficiency Test Language Arts Literacy Proficient – – – 57% 55% 79% 79% 78% 8 Mathematics – – – 62% 60% 62% 58% 57% N. Carolina 4 N.C. End of Grade/Course Test Reading Level III 69% 68% 71% 71% 72% 74% 77% 81% 8 Mathematics 68% 69% 76% 78% 80% 80% 83% 82% Ohio 4 Ohio Proficiency Test Reading Proficient – – – – – 56% 66% 53% 6 Mathematics – – – – – 61% 59% 65% Oklahoma 5 Oklahoma Core Curriculum Test Reading Satisfactory – – – – 68% 66% 63% 65% 8 Mathematics – – – – 65% 63% 64% 65%

�
State Grade Test Subject State term for Proficient** 1996 1997 1998 1999 2000 2001 2002 2003 Oregon 3 Oregon State Assmts. Reading Meets Standard – – – – – 84% 85% 83% 8 Mathematics – – – – – 55% 58% 59% Pennsylvania 5 Penn. System of School Assmts. Reading Proficient – – – – – 56% 57% 58% 8 Mathematics – – – – – 51% 52% 51% S. Carolina 4 Palmetto Achiev. Challenge Test English Language Arts Proficient – – – 29% 37% 37% 34% 32% 8 Mathematics – – – 15% 20% 18% 19% 19% Virginia 3 Standards of Learning English Pass/Proficient – – 54% 61% 61% 64% 71% 72% 8 Mathematics – – – – 61% 68% 70% 75% Washington 4 Wash. Assmt. of Student Learning Reading Level 3 – – – – – 67% 66% 67% 7 Mathematics – – – – – 27% 30% 37% Wisconsin 4 Wis. Knowl. and Concepts Exam. Reading Proficient – – – 81% 78% 78% 79% 81% 8 Mathematics – – – 43% 42% 39% 44% 73%
*Note: “Trend” indicates at least one subject and grade in the state has had a consistent test, definitions of proficient, and grade tested across the years reported.**More information on assessments can be found in state profiles beginning on page 12.

�
State report cards
State Weblink Alabama ftp://ftp.alsde.edu/documents/ReportCards/2002-2003/000.pdf Alaska http://www.eed.state.ak.us/reportcard/2002-2003/2State%20Report%20Card/2002-2003%20Report%20Card.pdf Arizona http://www.ade.az.gov/srcs/statereportcards/2002-2003.pdf Arkansas http://www.as-is.org/reportcard/rc2003 California http://star.cde.ca.gov/star2003/viewreport.asp Colorado http://www.cde.state.co.us/FedPrograms/Reports/download/NCLBRptCrd/NCLBRprtCrdsFull0203.pdf Connecticut http://www.csde.state.ct.us/public/der/ssp/sch0203/school.htm Delaware http://www.doe.k12.de.us/files/pdf/de_edreportcard200203.pdf District of Columbia http://silicon.k12.dc.us/NCLB/reportcards.asp Florida http://schoolgrades.fldoe.org/default.asp?schoolYear=2002-2003 Georgia http://reportcard2003.gaosa.org/ Hawaii http://arch.k12.hi.us/PDFs/nclb/2003/SEArptFinal021204_rev062104.pdf Idaho http://www.sde.state.id.us/ipd/reportcard/SchoolReportCard.asp Illinois http://webprod1.isbe.net/ereportcard/publicsite/getsearchcriteria.aspx Indiana http://www.doe.state.in.us/asap/pdf/2003IndianaAnnual.pdf Iowa http://www.iowaccess.org/educate/ecese/nclb/doc/reportcard03.pdf Kansas http://www3.ksde.org/accountability/accountability_report_2002_2003.pdf Kentucky http://www.education.ky.gov/NR/rdonlyres/2F3C178D-15D7-47FD-8B0A-399E22E29E2A/0/NCLBmediareport.docLouisiana http://www.louisianaschools.net/lde/pair/1794.asp Maine http://www.state.me.us/education/profiles/getprofiles.htm Maryland http://mdreportcard.org/ Massachusetts http://profiles.doe.mass.edu/staterc/ Michigan http://www.michigan.gov/documents/State_Report_Card_2003-04_120358_7.doc Minnesota http://education.state.mn.us/ReportCard2005/ Mississippi http://www.mde.k12.ms.us/Account/RC3B/RC02-03.pdf Missouri http://dese.mo.gov/commissioner/statereportcard/ Montana http://www.opi.state.mt.us/ReportCard/Index.html
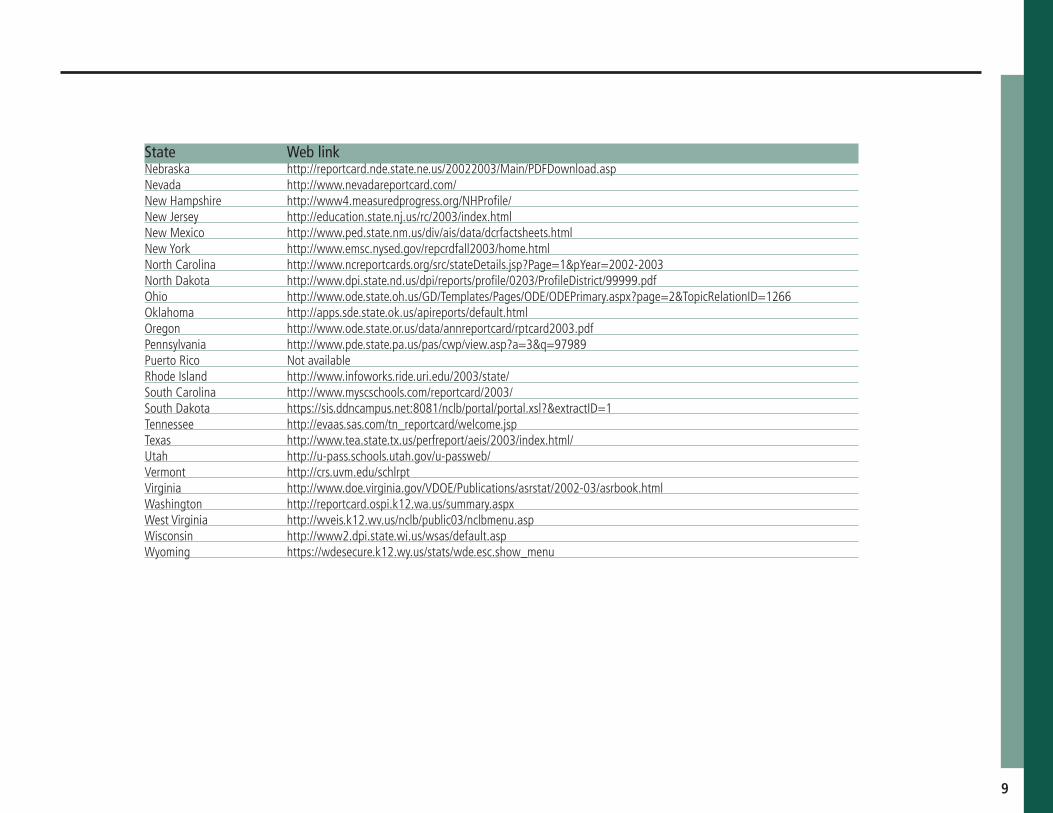
Table 4: Links to State Report Cards for More Information on Student Accountability and Assessment
�
State Weblink Nebraska http://reportcard.nde.state.ne.us/20022003/Main/PDFDownload.asp Nevada http://www.nevadareportcard.com/ New Hampshire http://www4.measuredprogress.org/NHProfile/ New Jersey http://education.state.nj.us/rc/2003/index.html New Mexico http://www.ped.state.nm.us/div/ais/data/dcrfactsheets.html New York http://www.emsc.nysed.gov/repcrdfall2003/home.html North Carolina http://www.ncreportcards.org/src/stateDetails.jsp?Page=1&pYear=2002-2003 North Dakota http://www.dpi.state.nd.us/dpi/reports/profile/0203/ProfileDistrict/99999.pdf Ohio http://www.ode.state.oh.us/GD/Templates/Pages/ODE/ODEPrimary.aspx?page=2&TopicRelationID=1266 Oklahoma http://apps.sde.state.ok.us/apireports/default.html Oregon http://www.ode.state.or.us/data/annreportcard/rptcard2003.pdf Pennsylvania http://www.pde.state.pa.us/pas/cwp/view.asp?a=3&q=97989 Puerto Rico Not available Rhode Island http://www.infoworks.ride.uri.edu/2003/state/ South Carolina http://www.myscschools.com/reportcard/2003/ South Dakota https://sis.ddncampus.net:8081/nclb/portal/portal.xsl?&extractID=1 Tennessee http://evaas.sas.com/tn_reportcard/welcome.jsp Texas http://www.tea.state.tx.us/perfreport/aeis/2003/index.html/ Utah http://u-pass.schools.utah.gov/u-passweb/ Vermont http://crs.uvm.edu/schlrpt Virginia http://www.doe.virginia.gov/VDOE/Publications/asrstat/2002-03/asrbook.html Washington http://reportcard.ospi.k12.wa.us/summary.aspx West Virginia http://wveis.k12.wv.us/nclb/public03/nclbmenu.asp Wisconsin http://www2.dpi.state.wi.us/wsas/default.asp Wyoming https://wdesecure.k12.wy.us/stats/wde.esc.show_menu

�0
��
S T A T E P R O F I L E S

Staff
Number of FTE 1993-94 2002-03teachers (CCD) Elementary Middle High Combined Other Total
Number of FTE non-teacher staff (CCD)
Instructionalaides Instructionalcoordinators Administrators Other Total
Percentage of teachers with a major in the main subject taught, grades 7-12 (SASS) 1994 2000 English Mathematics Science Socialstudies
Percentage of core courses taught by highly qualified teachers, 2002-03 (As defined and reported by states, collected by ED)
Students
Public school 1993-94 2002-03enrollment (CCD) Pre-K K-8 9-12 Total(K-12)
Race/ethnicity (CCD) AmericanIndian/AlaskanNative Asian/PacificIslander Black,non-Hispanic Hispanic White,non-Hispanic
Students with disabilities (OSEP)
Students with limited English proficiency (NCELA)
Migrant students (OME)
Eighth-grade students enrolled in 1996 2003Algebra I for high school credit (NAEP)
Students eligible to participate in the Free or Reduced- Price Lunch Program, 2002-03 (CCD) Outcomes
1993-94 2000-01High school dropout rate (NCES)
Avg. freshman graduation rate (NCES) College-going rate (IPEDS/NCES)
NAEP state results (NCES) Reading,Grade4 1994 2003 Proficientlevelorabove BasicleveloraboveMath,Grade8 1996 2003 Proficientlevelorabove Basiclevelorabove
Number of districts 1993-94 2002-03(CCD)
Number of public schools (CCD)
Elementary Middle High Combined Other Total
Number of charter schools (CCD)
Districts and schools
Number of schools, by percent of students eligible to participate in the Free or Reduced-Price Lunch Program, 2002-03 (CCD)
Sources of funding(CCD,2001-02)
Title I allocation 2001-02 (ED; Includes Title I, Part A)
Total current expenditures 1993-94 2001-02 (CCD,adjustedforinflationto2001-02,inthousands)
Instructional Noninstructional Support Total
Per-pupil expenditures (CCD,adjustedforinflationto2001-02)
KEY: * =Lessthan0.5percent — = NotapplicableK n/a = Notavailable # =Samplesizetoosmalltocalculate FTE =FullTimeEquivalent
Finances
18,619 21,325 6,474 7,436 9,699 10,962 5,898 5,455 2,312 1,927 43,002 47,104
3,897 6,169 393 667 2,384 4,697 31,246 30,245 37,920 41,778
75% 63% 89 83 73 78 80 69
8,445 n/a 527,373 523,594 198,651 203,117 726,024 726,711
1% 1% 1 1 36 36 * 2 62 60
12% 11%
* 1%
1% 1%
20% 17%
364,226
6% 4% 6464 6458
23% 23% 52 53
12% 16% 45 53
127 129
664 710 218 231 246 274 155 167 11 9 1,294 1,391
n/a
Alabama http://www.alsde.edu
$154,938,816
$2,249,389 $2,721,721 284,407 307,556 935,139 1,415,114 3,468,935 4,444,391
$4,898 $6,029
12
0-34%
35-49%
50-74%
75-100%
281
445
362
301
35%
29%
36%Low-poverty schools
High-poverty schools
All schools
Federal10%
State59%
Local31%
^
^2schoolsdidnotreport.

S t u d e n t A c h i e v e m e n t 2 0 0 2 - 0 3S t a t e w i d e A c c o u n t a b i l i t y I n f o r m a t i o n
SeeAppendixBforAlabama’sdefinitionsofproficientforreading/languageartsandmathematicsforgrades4,8,andhighschool.
Seehttp://www.alsde.edu/html/reports1.asp?systemcode=000&schoolcode=0000formoredetailsonthestatewideaccountabilitysystem.
State assessment for NCLB accountability:n/aState student achievement levels: n/a
NCLB Accountability Goals 2001-02 Annual measurable Target objective starting point (2002-03)Grade4 Reading/LanguageArts – – Mathematics – –Grade8 Reading/LanguageArts – – Mathematics – – Grade- Reading/LanguageArts – – Mathematics – –
2002-03 NCLB accountability results, applied to 2003-04 school year AYP outcomes and consequences* Title I schools All schools All districtsMadeAYP n/a n/a n/aIdentifiedforimprovement:
Year1 n/a n/a n/aYear2 n/a n/a n/aCorrectiveaction n/a n/a n/aRestructuring n/a n/a n/a
Exitedimprovementstatus(madeAYPtwice n/a n/a n/aaftermissingtwiceormore,includestotal“made”above)
Other indicator, 2002-03 State Target State Outcome
Elementaryindicator:Attendance – –Middleindicator:Attendance – –Highschoolindicator:Graduationrate – –
NCLB choice participation Number of Title I students Percent of eligible students
TitleIschoolchoice: 836 *Supplementaleducationalservices: 726 1%
*AYPoutcomesforthisstatearenotavailableduetoissueswithdatacollection,measurement,orotherreasons.Formoreinformationpleasevisitthestate’sWebsite,above.
ReadingProficient level or above for: Grade 4 Grade 8 GradeAllstudents 63% 59% –Economicallydisadvantagedstudents 50 42 –Migrantstudents 43 38 –Studentswithdisabilities 25 16 –StudentswithlimitedEnglishproficiency 32 14 –Black,non-Hispanicstudents 45 38 –Hispanicstudents 49 38 –White,non-Hispanicstudents 76 71 –
Studentachievementtrend:Readingpercentproficientlevelorabove
Alabama
Stanford 10, not used for NCLB accountability in 2002-03
13
MathematicsProficient level or above for: Grade 4 Grade 8 GradeAllstudents 64% 56% –Economicallydisadvantagedstudents 53 41 –Migrantstudents 50 45 –Studentswithdisabilities 26 14 –StudentswithlimitedEnglishproficiency 46 34 –Black,non-Hispanicstudents 49 38 –Hispanicstudents 52 42 –White,non-Hispanicstudents 74 67 –
Studentachievementtrend:Mathematicspercentproficientlevelorabove
0%
25%
50%
75%
100%
5664
200320022001
HighSchoolGrade8Grade4
n/an/a
n/a
0%
25%
50%
75%
100%
5963
200320022001
HighSchoolGrade8Grade4
n/an/a
n/a
Staff
Number of FTE 1993-94 2002-03teachers (CCD) Elementary Middle High Combined Other Total
Number of FTE non-teacher staff (CCD)
Instructionalaides Instructionalcoordinators Administrators Other Total
Percentage of teachers with a major in the main subject taught, grades 7-12 (SASS) 1994 2000 English Mathematics Science Socialstudies
Percentage of core courses taught by highly qualified teachers, 2002-03 (As defined and reported by states, collected by ED)
Students
Public school 1993-94 2002-03enrollment (CCD) Pre-K K-8 9-12 Total(K-12)
Race/ethnicity (CCD) AmericanIndian/AlaskanNative Asian/PacificIslander Black,non-Hispanic Hispanic White,non-Hispanic
Students with disabilities (OSEP)
Students with limited English proficiency (NCELA)
Migrant students (OME)
Eighth-grade students enrolled in 1996 2003Algebra I for high school credit (NAEP)
Students eligible to participate in the Free or Reduced- Price Lunch Program, 2002-03 (CCD) Outcomes
1993-94 2000-01High school dropout rate (NCES)
Avg. freshman graduation rate (NCES) College-going rate (IPEDS/NCES)
NAEP state results (NCES) Reading,Grade4 1994 2003 Proficientlevelorabove BasicleveloraboveMath,Grade8 1996 2003 Proficientlevelorabove Basiclevelorabove
Number of districts 1993-94 2002-03(CCD)
Number of public schools (CCD)
Elementary Middle High Combined Other Total
Number of charter schools (CCD)
Districts and schools
Number of schools, by percent of students eligible to participate in the Free or Reduced-Price Lunch Program, 2002-03 (CCD)
Sources of funding(CCD,2001-02)
Title I allocation 2001-02 (ED; Includes Title I, Part A)
Total current expenditures 1993-94 2001-02 (CCD,adjustedforinflationto2001-02,inthousands)
Instructional Noninstructional Support Total
Per-pupil expenditures (CCD,adjustedforinflationto2001-02)
KEY: * =Lessthan0.5percent — = NotapplicableK n/a = Notavailable # =Samplesizetoosmalltocalculate FTE =FullTimeEquivalent
Finances
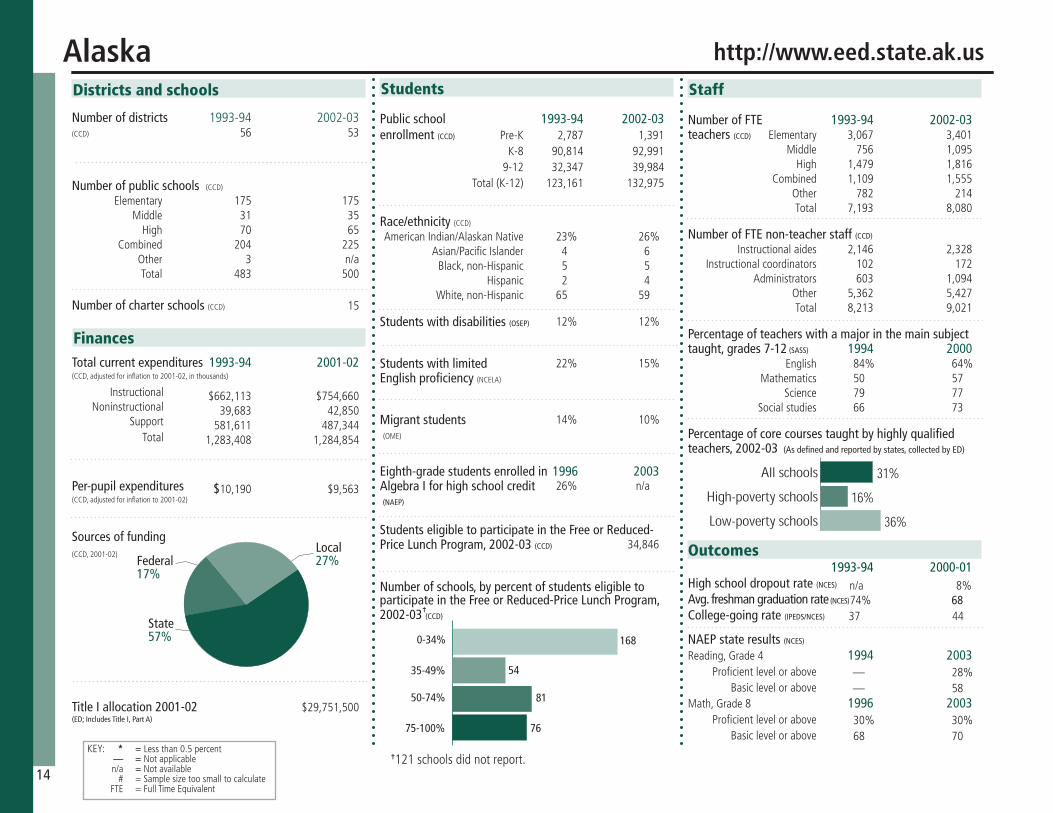
$662,113 $754,660 39,683 42,850 581,611 487,344 1,283,408 1,284,854
$10,190 $9,563
3,067 3,401 756 1,095 1,479 1,816 1,109 1,555 782 214 7,193 8,080
2,146 2,328 102 172 603 1,094 5,362 5,427 8,213 9,021
84% 64% 50 57 79 77 66 73
2,787 1,391 90,814 92,991 32,347 39,984 123,161 132,975
23% 26% 4 6 5 5 2 4 65 59
12% 12%
22% 15%
14% 10%
26% n/a
34,846
n/a 8% 74% 683744
— 28% — 58
30% 30% 68 70
56 53
175 175 31 35 70 65 204 225 3 n/a 483 500
15
Alaska http://www.eed.state.ak.us
$29,751,500
14
0-34%
35-49%
50-74%
75-100%
54
81
76
168
31%
16%
36%Low-poverty schools
High-poverty schools
All schools
Federal17%
State57%
Local27%
^
^121schoolsdidnotreport.

S t u d e n t A c h i e v e m e n t 2 0 0 2 - 0 3S t a t e w i d e A c c o u n t a b i l i t y I n f o r m a t i o n
SeeAppendixBforAlaska’sdefinitionsofproficientforreadingandmathematicsforgrades3,8,andhighschool.
Seehttp://www.eed.state.ak.us/stats/formoredetailsonthestatewideaccountabilitysystem.
State assessment for NCLB accountability:AlaskaBenchmarkExamsState student achievement levels: FarBelowProficient,BelowProficient,Proficient,Advanced
NCLB Accountability Goals 2001-02 Annual measurable Target objective starting point (2002-03)Grade3 Reading 64.03% 64.03% Mathematics 54.86 54.86Grade8 Reading 64.03 64.03 Mathematics 54.86 54.86 HighSchoolReading 64.03 64.03 Mathematics 54.86 54.86
2002-03 NCLB accountability results, applied to 2003-04 school year AYP outcomes and consequences Title I schools All schools All districtsMadeAYP 118 (40%) 206 (42%) 13 (24%)Identifiedforimprovement:
Year1 46 (16%) 49 (10%) 4 (7%)Year2 9 (3%) 9 (2%) 2 (4%)Correctiveaction 8 (3%) 8 (2%) 0Restructuring 0 0 0
Exitedimprovementstatus(madeAYPtwice 0 0 0aftermissingtwiceormore,includestotal“made”above)
Other indicator, 2002-03 State target State outcome
Elementaryindicator:Averagedailyattendance 85% MetMiddleindicator:Averagedailyattendance 85% MetHighschoolindicator:Graduationrate 55.58% Met
NCLB choice participation Number of Title I students Percent of eligible students
TitleIschoolchoice: 26 *Supplementaleducationalservices: 475 2%
ReadingProficient level or above for: Grade 3 Grade 8 High SchoolAllstudents 74% 68% 70%Economicallydisadvantagedstudents 58 48 47Migrantstudents 44 39 44Studentswithdisabilities 45 26 24StudentswithlimitedEnglishproficiency 44 34 32Black,non-Hispanicstudents 71 63 47Hispanicstudents 73 56 63White,non-Hispanicstudents 85 81 82
Studentachievementtrend:Readingpercentproficientlevelorabove
0%
25%
50%
75%
100%
706874 70
9275
200320022001
HighSchoolGrade8Grade3
n/a
Alaska
Alaska Benchmark Exams, used for NCLB accountability
15
MathematicsProficient level or above for: Grade 3 Grade 8 High SchoolAllstudents 72% 64% 70%Economicallydisadvantagedstudents 58 45 51Migrantstudents 48 42 52Studentswithdisabilities 49 22 27StudentswithlimitedEnglishproficiency 47 39 45Black,non-Hispanicstudents 62 52 51Hispanicstudents 69 46 62White,non-Hispanicstudents 82 75 79
Studentachievementtrend:Mathematicspercentproficientlevelorabove
0%
25%
50%
75%
100%
706472
64
40
71200320022001
HighSchoolGrade8Grade3
n/a

Staff
Number of FTE 1993-94 2002-03teachers (CCD) Elementary Middle High Combined Other Total
Number of FTE non-teacher staff (CCD)
Instructionalaides Instructionalcoordinators Administrators Other Total
Percentage of teachers with a major in the main subject taught, grades 7-12 (SASS) 1994 2000 English Mathematics Science Socialstudies
Percentage of core courses taught by highly qualified teachers, 2002-03 (As defined and reported by states, collected by ED)
Students
Public school 1993-94 2002-03enrollment (CCD) Pre-K K-8 9-12 Total(K-12)
Race/ethnicity (CCD) AmericanIndian/AlaskanNative Asian/PacificIslander Black,non-Hispanic Hispanic White,non-Hispanic
Students with disabilities (OSEP)
Students with limited English proficiency (NCELA)
Migrant students (OME)
Eighth-grade students enrolled in 1996 2003Algebra I for high school credit (NAEP)
Students eligible to participate in the Free or Reduced- Price Lunch Program, 2002-03 (CCD) Outcomes
1993-94 2000-01High school dropout rate (NCES)
Avg. freshman graduation rate (NCES) College-going rate (IPEDS/NCES)
NAEP state results (NCES) Reading,Grade4 1994 2003 Proficientlevelorabove BasicleveloraboveMath,Grade8 1996 2003 Proficientlevelorabove Basiclevelorabove
Number of districts 1993-94 2002-03(CCD)
Number of public schools (CCD)
Elementary Middle High Combined Other Total
Number of charter schools (CCD)
Districts and schools
Number of schools, by percent of students eligible to participate in the Free or Reduced-Price Lunch Program, 2002-03 (CCD)
Sources of funding(CCD,2001-02)
Title I allocation 2001-02 (ED; Includes Title I, Part A)
Total current expenditures 1993-94 2001-02 (CCD,adjustedforinflationto2001-02,inthousands)
Instructional Noninstructional Support Total
Per-pupil expenditures (CCD,adjustedforinflationto2001-02)
KEY: * =Lessthan0.5percent — = NotapplicableK n/a = Notavailable # =Samplesizetoosmalltocalculate FTE =FullTimeEquivalent
Finances
3,164 7,434 519,054 644,438 182,737 272,679 701,791 917,117
7% 7% 2 2 4 5 28 36 60 50
9% 9%
12% 15%
2% 3%
26% 22%
111,717
19,983 25,716 6,453 7,880 8,624 11,269 69 437 2,636 1,799 37,493 47,101
9,519 13,650 180 187 2,040 2,397 25,447 33,304 37,186 49,538
65% 52% 61 49 73 66 65 75
14% 11% 72 744450
24% 23% 52 54
18% 21% 57 62
217 323
720 1,008 193 240 176 399 12 143 11 11 1,112 1,801
319
Arizona http://www.ade.state.az.us
$173,246,701
$2,151,235 $3,123,642 243,677 346,134 1,332,105 2,029,869 3,727,017 5,499,645
$5,254 $5,964
16
0-34%
35-49%
50-74%
75-100%
83
98
35
276
95%
90%
100%Low-poverty schools
High-poverty schools
All schools
Federal10%
State50%
Local40%
^
^1,309schoolsdidnotreport.
S t u d e n t A c h i e v e m e n t 2 0 0 2 - 0 3S t a t e w i d e A c c o u n t a b i l i t y I n f o r m a t i o n
SeeAppendixBforArizona’sdefinitionsofproficientforreadingandmathematicsforgrades3,8,andhighschool.
Seehttp://www.ade.az.gov/researchpolicy/srcs.aspformoredetailsonthestatewideaccountabilitysystem.
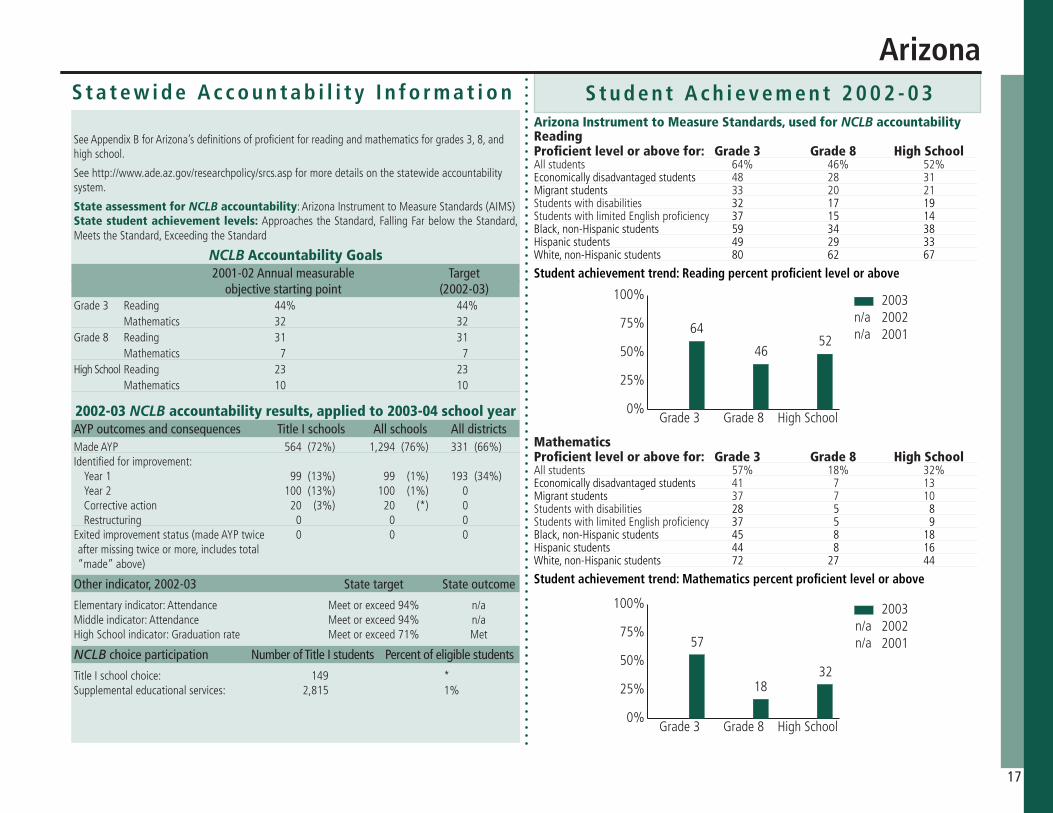
State assessment for NCLB accountability:ArizonaInstrumenttoMeasureStandards(AIMS)State student achievement levels: ApproachestheStandard,FallingFarbelowtheStandard,MeetstheStandard,ExceedingtheStandard
NCLB Accountability Goals 2001-02 Annual measurable Target objective starting point (2002-03)Grade3 Reading 44% 44% Mathematics 32 32Grade8 Reading 31 31 Mathematics 7 7 HighSchoolReading 23 23 Mathematics 10 10
2002-03 NCLB accountability results, applied to 2003-04 school year AYP outcomes and consequences Title I schools All schools All districtsMadeAYP 564 (72%) 1,294 (76%) 331 (66%)Identifiedforimprovement:
Year1 99 (13%) 99 (1%) 193 (34%)Year2 100 (13%) 100 (1%) 0Correctiveaction 20 (3%) 20 (*) 0Restructuring 0 0 0
Exitedimprovementstatus(madeAYPtwice 0 0 0aftermissingtwiceormore,includestotal“made”above)
Other indicator, 2002-03 State target State outcome
Elementaryindicator:Attendance Meetorexceed94% n/aMiddleindicator:Attendance Meetorexceed94% n/aHighSchoolindicator:Graduationrate Meetorexceed71% Met
NCLB choice participation Number of Title I students Percent of eligible students
TitleIschoolchoice: 149 *Supplementaleducationalservices: 2,815 1%
ReadingProficient level or above for: Grade 3 Grade 8 High SchoolAllstudents 64% 46% 52%Economicallydisadvantagedstudents 48 28 31Migrantstudents 33 20 21Studentswithdisabilities 32 17 19StudentswithlimitedEnglishproficiency 37 15 14Black,non-Hispanicstudents 59 34 38Hispanicstudents 49 29 33White,non-Hispanicstudents 80 62 67
Studentachievementtrend:Readingpercentproficientlevelorabove
0%
25%
50%
75%
100%
5246
64
200320022001
HighSchoolGrade8Grade3
n/an/a
Arizona
Arizona Instrument to Measure Standards, used for NCLB accountability
17
MathematicsProficient level or above for: Grade 3 Grade 8 High SchoolAllstudents 57% 18% 32%Economicallydisadvantagedstudents 41 7 13Migrantstudents 37 7 10Studentswithdisabilities 28 5 8StudentswithlimitedEnglishproficiency 37 5 9Black,non-Hispanicstudents 45 8 18Hispanicstudents 44 8 16White,non-Hispanicstudents 72 27 44
Studentachievementtrend:Mathematicspercentproficientlevelorabove
0%
25%
50%
75%
100%
3218
57
200320022001
HighSchoolGrade8Grade3
n/an/a
Staff
Number of FTE 1993-94 2002-03teachers (CCD) Elementary Middle High Combined Other Total
Number of FTE non-teacher staff (CCD)
Instructionalaides Instructionalcoordinators Administrators Other Total
Percentage of teachers with a major in the main subject taught, grades 7-12 (SASS) 1994 2000 English Mathematics Science Socialstudies
Percentage of core courses taught by highly qualified teachers, 2002-03 (As defined and reported by states, collected by ED)
Students
Public school 1993-94 2002-03enrollment (CCD) Pre-K K-8 9-12 Total(K-12)
Race/ethnicity (CCD) AmericanIndian/AlaskanNative Asian/PacificIslander Black,non-Hispanic Hispanic White,non-Hispanic
Students with disabilities (OSEP)
Students with limited English proficiency (NCELA)
Migrant students (OME)
Eighth-grade students enrolled in 1996 2003Algebra I for high school credit (NAEP)
Students eligible to participate in the Free or Reduced- Price Lunch Program, 2002-03 (CCD) Outcomes
1993-94 2000-01High school dropout rate (NCES)
Avg. freshman graduation rate (NCES) College-going rate (IPEDS/NCES)
NAEP state results (NCES) Reading,Grade4 1994 2003 Proficientlevelorabove BasicleveloraboveMath,Grade8 1996 2003 Proficientlevelorabove Basiclevelorabove
Number of districts 1993-94 2002-03(CCD)
Number of public schools (CCD)
Elementary Middle High Combined Other Total
Number of charter schools (CCD)
Districts and schools
Number of schools, by percent of students eligible to participate in the Free or Reduced-Price Lunch Program, 2002-03 (CCD)
Sources of funding(CCD,2001-02)
Title I allocation 2001-02 (ED; Includes Title I, Part A)
Total current expenditures 1993-94 2001-02 (CCD,adjustedforinflationto2001-02,inthousands)
Instructional Noninstructional Support Total
Per-pupil expenditures (CCD,adjustedforinflationto2001-02)
KEY: * =Lessthan0.5percent — = NotapplicableK n/a = Notavailable # =Samplesizetoosmalltocalculate FTE =FullTimeEquivalent
Finances
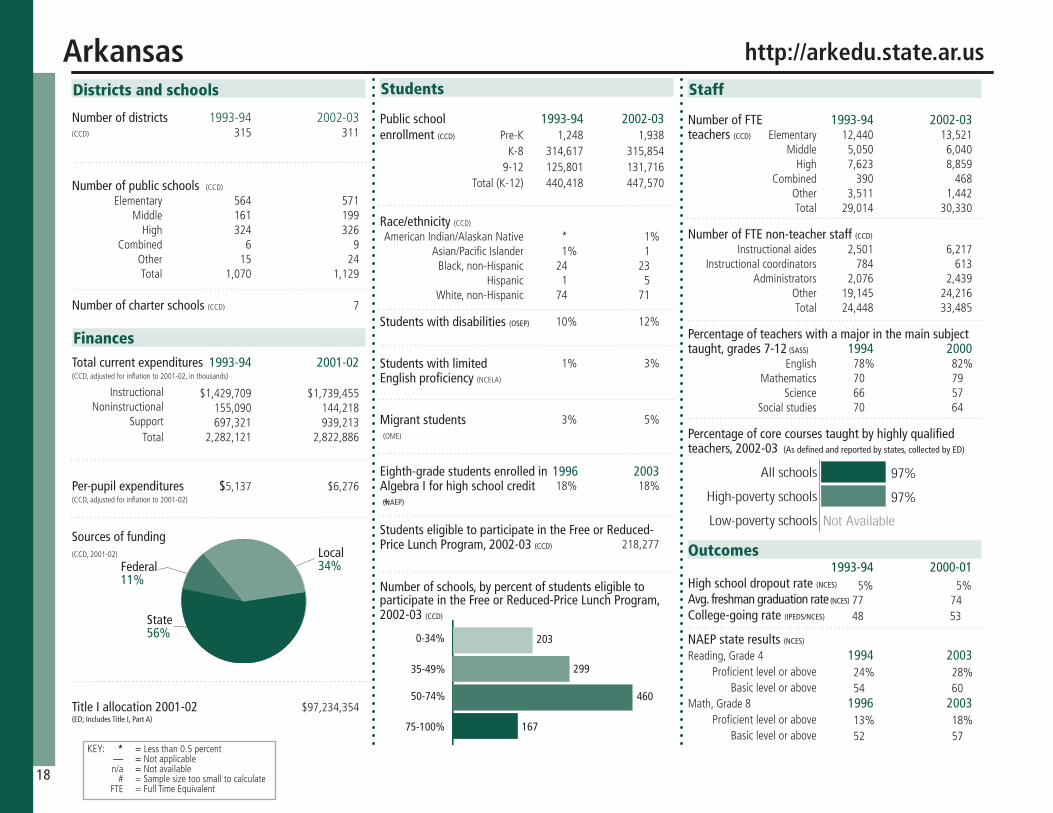
12,440 13,521 5,050 6,040 7,623 8,859 390 468 3,511 1,442 29,014 30,330
2,501 6,217 784 613 2,076 2,439 19,145 24,216 24,448 33,485
78% 82% 70 79 66 57 70 64
1,248 1,938 314,617 315,854 125,801 131,716 440,418 447,570
* 1% 1% 1 24 23 1 5 74 71
10% 12%
1% 3%
3% 5%
18% 18%+
218,277
5% 5% 77 74 48 53
24% 28% 54 60
13% 18% 52 57
315 311
564 571 161 199 324 326 6 9 15 24 1,070 1,129
7
Arkansas http://arkedu.state.ar.us
$97,234,354
$1,429,709 $1,739,455 155,090 144,218 697,321 939,213 2,282,121 2,822,886
$5,137 $6,276
18
0-34%
35-49%
50-74%
75-100%
299
460
167
203
97%
97%
Low-poverty schools
High-poverty schools
All schools
Not Available
Federal11%
State56%
Local34%

S t u d e n t A c h i e v e m e n t 2 0 0 2 - 0 3S t a t e w i d e A c c o u n t a b i l i t y I n f o r m a t i o n
SeeAppendixBforArkansas’sdefinitionsofproficientforreadingandmathematicsforgrades4,8andhighschool.
Seehttp://www.as-is.org/reportcard/rc2003/formoredetailsonthestatewideaccountabilitysystem.
State assessment for NCLB accountability:ArkansasBenchmarkExamsState student achievement levels: BelowBasic,Basic,Proficient,Advanced
NCLB Accountability Goals 2001-02 Annual measurable Target objective starting point (2002-03)Grade4 Reading 31.8% 37.48% Mathematics 28.2 34.18Grade8 Reading 18.1 24.93 Mathematics 15.3 22.36 HighschoolReading 19.5 26.21 Mathematics 10.4 17.87
2002-03 NCLB accountability results, applied to 2003-04 school year AYP outcomes and consequences* Title I schools All schools All districtsMadeAYP n/a n/a n/aIdentifiedforimprovement:
Year1 227 (28%) 227 (21%) 0Year2 15 (2%) 15 (1%) 0Correctiveaction 2 (*) 2 (*) 0Restructuring 0 0 0
Exitedimprovementstatus(madeAYPtwice n/a n/a n/aaftermissingtwiceormore,includestotal“made”above)
Other indicator, 2002-03 State target State outcomeElementaryindicator:Attendance 92.70% MetMiddleindicator:Attendance 92.70% MetHighschoolindicator:Graduationrate 86.7% Met
NCLB choice participation Number of Title I students Percent of eligible students
TitleIschoolchoice: 175 *Supplementaleducationalservices: 3 *
*SomeAYPoutcomesforthisstatearenotavailableduetoissueswithdatacollection,measurement,orotherreasons.Formoreinformationpleasevisitthestate’sWebsite,above.
ReadingProficient level or above for: Grade 4 Grade 8 High schoolAllstudents 61% 42% 41%Economicallydisadvantagedstudents 50 27 –Migrantstudents 47 24 13Studentswithdisabilities 11 <5 <5StudentswithlimitedEnglishproficiency 39 16 10Black,non-Hispanicstudents 40 21 16Hispanicstudents 56 31 22White,non-Hispanicstudents 69 50 51
Studentachievementtrend:Readingpercentproficientlevelorabove
0%
25%
50%
75%
100%
414261
200320022001
HighSchoolGrade8Grade4
n/an/a
Arkansas
Arkansas Benchmark Exams, used for NCLB accountability
19
MathematicsProficient level or above for: Grade 4 Grade 8 High schoolAllstudents 60% 22% 43%Economicallydisadvantagedstudents 49 11 –Migrantstudents 50 8 17Studentswithdisabilities 20 <5 8StudentswithlimitedEnglishproficiency 46 6 17Black,non-Hispanicstudents 32 <5 18Hispanicstudents 58 13 28White,non-Hispanicstudents 69 28 52
Studentachievementtrend:Mathematicspercentproficientlevelorabove
0%
25%
50%
75%
100%
43
22
60
200320022001
HighSchoolGrade8Grade4
n/an/a
Staff
Number of FTE 1993-94 2002-03teachers (CCD) Elementary Middle High Combined Other Total
Number of FTE non-teacher staff (CCD)
Instructionalaides Instructionalcoordinators Administrators Other Total
Percentage of teachers with a major in the main subject taught, grades 7-12 (SASS) 1994 2000 English Mathematics Science Socialstudies
Percentage of core courses taught by highly qualified teachers, 2002-03 (As defined and reported by states, collected by ED)
Students
Public school 1993-94 2002-03enrollment (CCD) Pre-K K-8 9-12 Total(K-12)
Race/ethnicity (CCD) AmericanIndian/AlaskanNative Asian/PacificIslander Black,non-Hispanic Hispanic White,non-Hispanic
Students with disabilities (OSEP)
Students with limited English proficiency (NCELA)
Migrant students (OME)
Eighth-grade students enrolled in 1996 2003Algebra I for high school credit (NAEP)
Students eligible to participate in the Free or Reduced- Price Lunch Program, 2002-03 (CCD) Outcomes
1993-94 2000-01High school dropout rate (NCES)
Avg. freshman graduation rate (NCES) College-going rate (IPEDS/NCES)
NAEP state results (NCES) Reading,Grade4 1994 2003 Proficientlevelorabove BasicleveloraboveMath,Grade8 1996 2003 Proficientlevelorabove Basiclevelorabove
Number of districts 1993-94 2002-03(CCD)
Number of public schools (CCD)
Elementary Middle High Combined Other Total
Number of charter schools (CCD)
Districts and schools
Number of schools, by percent of students eligible to participate in the Free or Reduced-Price Lunch Program, 2002-03 (CCD)
Sources of funding(CCD,2001-02)
Title I allocation 2001-02 (ED; Includes Title I, Part A)
Total current expenditures 1993-94 2001-02 (CCD,adjustedforinflationto2001-02,inthousands)
Instructional Noninstructional Support Total
Per-pupil expenditures (CCD,adjustedforinflationto2001-02)
KEY: * =Lessthan0.5percent — = NotapplicableK n/a = Notavailable # =Samplesizetoosmalltocalculate FTE =FullTimeEquivalent
Finances
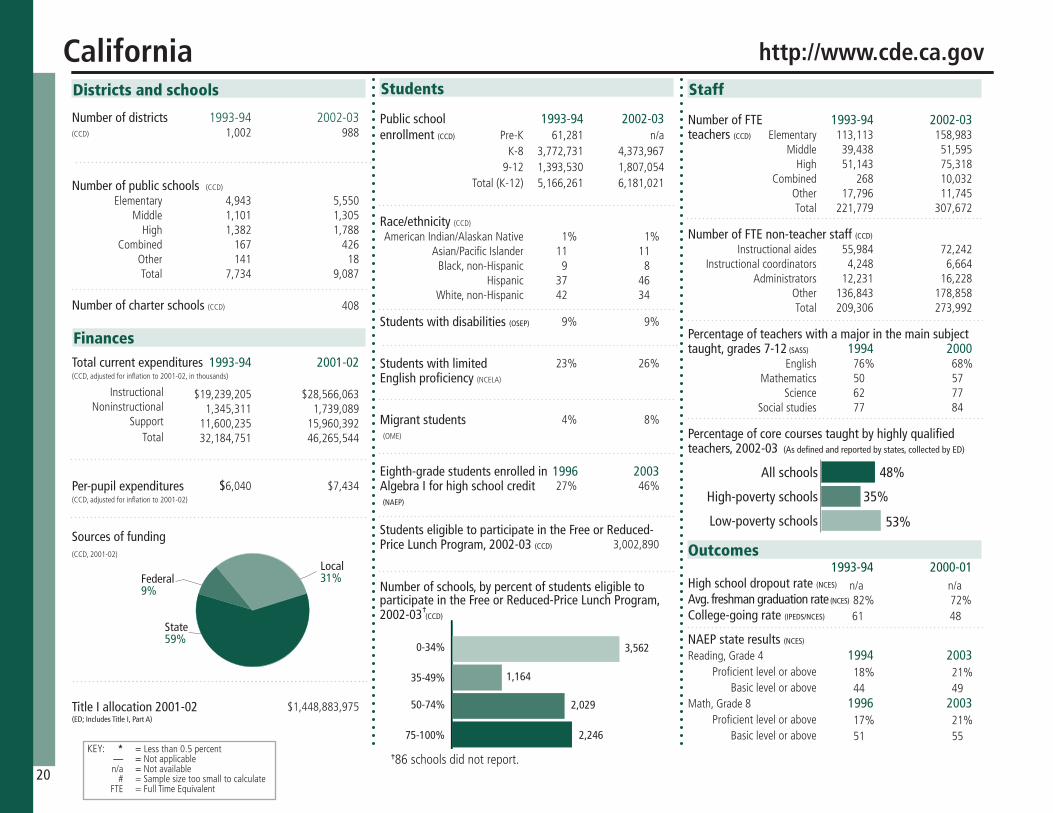
113,113 158,983 39,438 51,595 51,143 75,318 268 10,032 17,796 11,745 221,779 307,672
55,984 72,242 4,248 6,664 12,231 16,228 136,843 178,858 209,306 273,992
76% 68% 50 57 62 77 77 84
61,281 n/a 3,772,731 4,373,967 1,393,530 1,807,054 5,166,261 6,181,021
1% 1% 11 11 9 8 37 46 42 34
9% 9%
23% 26%
4% 8%
27% 46%
3,002,890
n/a n/a 82%72% 6148
18% 21% 44 49
17% 21% 51 55
1,002 988
4,943 5,550 1,101 1,305 1,382 1,788 167 426 141 18 7,734 9,087
408
California http://www.cde.ca.gov
$1,448,883,975
$19,239,205 $28,566,063 1,345,311 1,739,089 11,600,235 15,960,392 32,184,751 46,265,544
$6,040 $7,434
20
0-34%
35-49%
50-74%
75-100%
1,164
2,029
2,246
3,562
48%
35%
53%Low-poverty schools
High-poverty schools
All schools
Federal9%
State59%
Local31%
^
^86schoolsdidnotreport.

S t u d e n t A c h i e v e m e n t 2 0 0 2 - 0 3S t a t e w i d e A c c o u n t a b i l i t y I n f o r m a t i o n
SeeAppendixBforCalifornia’sdefinitionsofproficientforEnglishlanguageartsandmathematicsforgrades4,8,andhighschool.
Seehttp://star.cde.ca.gov/star2003/viewreport.aspformoreonthestatewideaccountabilitysystem.
State assessment for NCLB accountability:CaliforniaStandardsTests(CSTs)grades2-8,Cali-forniaHighSchoolExitExam(SCSAHSEE)grade10State student achievement levels: BelowBasic,Basic,FarBelowBasic,Proficient,Advanced
NCLB Accountability Goals 2001-02 Annual measurable Target objective starting point (2002-03)Grade4 Englishlanguagearts 13.6% 13.6% Mathematics 16 16Grade8 Englishlanguagearts 13.6 13.6 Mathematics 16 16 HighschoolEnglishlanguagearts 11.2 11.2 Mathematics 9.6 9.6
2002-03 NCLB accountability results, applied to 2003-04 school year AYP Outcomes and Consequences Title I schools All schools All districtsMadeAYP 2,786 (51%) 4,874 (54%) 456 (44%)Identifiedforimprovement:
Year1 644 (54%) 644 (7%) 0Year2 216 (18%) 216 (2%) 0Correctiveaction 329 (27%) 329 (4%) 0Restructuring 11 (1%) 11 (*) 0
Exitedimprovementstatus(madeAYPtwice 191 (16%) 191 (2%) 0aftermissingtwiceormore,includestotal“made”above)
Other indicator, 2002-03 State target State outcomeElementary,Middle,andHighschoolindicator: MeetingAPI Mettarget.AcademicPerformanceIndex(API),reflectinggrowth targetorgrowing inallperformanceareas. atleastoneAPIpoint.
NCLB choice participation Number of Title I students Percent of eligible students
TitleIschoolchoice: 3,609 *Supplementaleducationalservices: 41,198 1%
English or language artsProficient level or above for: Grade 4 Grade 8 Grade 10Allstudents 39% 31% 48%Economicallydisadvantagedstudents 24 16 28Migrantstudents 13 9 17Studentswithdisabilities 15 5 14StudentswithlimitedEnglishproficiency 21 14 25Black,non-Hispanicstudents 27 17 33Hispanicstudents 24 16 30White,non-Hispanicstudents 59 47 67
Studentachievementtrend:Englishorlanguageartspercentproficientlevelorabove
0%
25%
50%
75%
100%
4831
39 333236 313233
200320022001
Grade10Grade8Grade4
California
California Standards Tests and California High School Exit Exam, used for NCLB accountability
21
MathematicsProficient level or above for: Grade 4 Grade 8 Grade 10Allstudents 46% 29% 39%Economicallydisadvantagedstudents 33 16 23Migrantstudents 25 13 17Studentswithdisabilities 20 6 10StudentswithlimitedEnglishproficiency 34 18 24Black,non-Hispanicstudents 29 12 19Hispanicstudents 33 15 21Whitestudents 61 42 56
Studentachievementtrend:Mathematicspercentproficientlevelorabove
0%
25%
50%
75%
100%
3929
46
200320022001
HighSchoolGrade8Grade4
n/an/a

Staff
Number of FTE 1993-94 2002-03teachers (CCD) Elementary Middle High Combined Other Total
Number of FTE non-teacher staff (CCD)
Instructionalaides Instructionalcoordinators Administrators Other Total
Percentage of teachers with a major in the main subject taught, grades 7-12 (SASS) 1994 2000 English Mathematics Science Socialstudies
Percentage of core courses taught by highly qualified teachers, 2002-03 (As defined and reported by states, collected by ED)
Students
Public school 1993-94 2002-03enrollment (CCD) Pre-K K-8 9-12 Total(K-12)
Race/ethnicity (CCD) AmericanIndian/AlaskanNative Asian/PacificIslander Black,non-Hispanic Hispanic White,non-Hispanic
Students with disabilities (OSEP)
Students with limited English proficiency (NCELA)
Migrant students (OME)
Eighth-grade students enrolled in 1996 2003Algebra I for high school credit (NAEP)
Students eligible to participate in the Free or Reduced- Price Lunch Program, 2002-03 (CCD) Outcomes
1993-94 2000-01High school dropout rate (NCES)
Avg. freshman graduation rate (NCES) College-going rate (IPEDS/NCES)
NAEP state results (NCES) Reading,Grade4 1994 2003 Proficientlevelorabove BasicleveloraboveMath,Grade8 1996 2003 Proficientlevelorabove Basiclevelorabove
Number of districts 1993-94 2002-03(CCD)
Number of public schools (CCD)
Elementary Middle High Combined Other Total
Number of charter schools (CCD)
Districts and schools
Number of schools, by percent of students eligible to participate in the Free or Reduced-Price Lunch Program, 2002-03 (CCD)
Sources of funding(CCD,2001-02)
Title I allocation 2001-02 (ED; Includes Title I, Part A)
Total current expenditures 1993-94 2001-02 (CCD,adjustedforinflationto2001-02,inthousands)
Instructional Noninstructional Support Total
Per-pupil expenditures (CCD,adjustedforinflationto2001-02)
KEY: * =Lessthan0.5percent — = NotapplicableK n/a = Notavailable # =Samplesizetoosmalltocalculate FTE =FullTimeEquivalent
Finances
16,771 22,407 7,267 9,288 8,681 12,010 67 1,337 876 359 33,661 45,401
4,995 11,008 670 926 2,592 3,313 21,102 29,748 29,359 44,995
91% 80% 65 68 78 72 61 88
7,249 20,005 451,469 513,918 164,260 217,133 615,729 731,051
1% 1% 2 3 5 6 17 24 74 66
12% 9%
4% 11%
1% 3%
28% 27%
214,115
n/a n/a 77% 73% 52 53
28% 37% 59 70
25% 35% 67 74
176 178
817 959 246 291 243 339 14 72 18 1 1,373 1,662
92
Colorado http://www.cde.state.co.us
$96,384,762
$2,324,087 $2,976,088 142,061 183,604 1,316,544 1,991,311 3,782,691 5,151,003
$6,051 $6,941
22
0-34%
35-49%
50-74%
75-100%
275
302
116
966
86%
85%
Low-poverty schools
High-poverty schools
All schools
Not Available
Federal6%
State42%
Local52%
^
^3schoolsdidnotreport.
S t u d e n t A c h i e v e m e n t 2 0 0 2 - 0 3S t a t e w i d e A c c o u n t a b i l i t y I n f o r m a t i o n
SeeAppendixBforColorado’sdefinitionsofproficientforreadingandmathematicsforgrades4,8,and10.
Seehttp://www.cde.state.co.us/cdeunified/NCLBProfiles0506/index.aspformoredetailsonthestate-wideaccountabilitysystem.
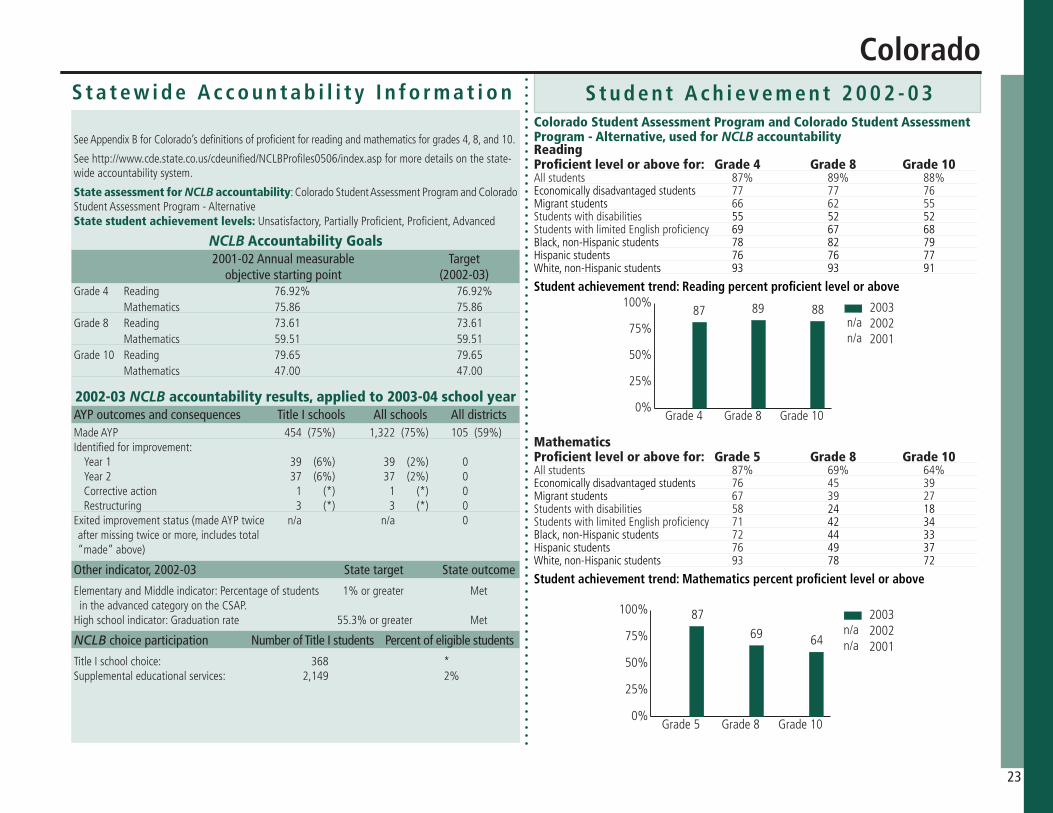
State assessment for NCLB accountability:ColoradoStudentAssessmentProgramandColoradoStudentAssessmentProgram-AlternativeState student achievement levels: Unsatisfactory,PartiallyProficient,Proficient,Advanced
NCLB Accountability Goals 2001-02 Annual measurable Target objective starting point (2002-03)Grade4 Reading 76.92% 76.92% Mathematics 75.86 75.86Grade8 Reading 73.61 73.61 Mathematics 59.51 59.51 Grade10 Reading 79.65 79.65 Mathematics 47.00 47.00
2002-03 NCLB accountability results, applied to 2003-04 school year AYP outcomes and consequences Title I schools All schools All districtsMadeAYP 454 (75%) 1,322 (75%) 105 (59%)Identifiedforimprovement:
Year1 39 (6%) 39 (2%) 0Year2 37 (6%) 37 (2%) 0Correctiveaction 1 (*) 1 (*) 0Restructuring 3 (*) 3 (*) 0
Exitedimprovementstatus(madeAYPtwice n/a n/a 0aftermissingtwiceormore,includestotal“made”above)
Other indicator, 2002-03 State target State outcome
ElementaryandMiddleindicator:Percentageofstudents 1%orgreater MetintheadvancedcategoryontheCSAP.Highschoolindicator:Graduationrate 55.3%orgreater Met
NCLB choice participation Number of Title I students Percent of eligible students
TitleIschoolchoice: 368 *Supplementaleducationalservices: 2,149 2%
ReadingProficient level or above for: Grade 4 Grade 8 Grade 10Allstudents 87% 89% 88%Economicallydisadvantagedstudents 77 77 76Migrantstudents 66 62 55Studentswithdisabilities 55 52 52StudentswithlimitedEnglishproficiency 69 67 68Black,non-Hispanicstudents 78 82 79Hispanicstudents 76 76 77White,non-Hispanicstudents 93 93 91
Studentachievementtrend:Readingpercentproficientlevelorabove
0%
25%
50%
75%
100% 888987 200320022001
Grade10Grade8Grade4
n/an/a
Colorado
Colorado Student Assessment Program and Colorado Student Assessment Program - Alternative, used for NCLB accountability
23
MathematicsProficient level or above for: Grade 5 Grade 8 Grade 10Allstudents 87% 69% 64%Economicallydisadvantagedstudents 76 45 39Migrantstudents 67 39 27Studentswithdisabilities 58 24 18StudentswithlimitedEnglishproficiency 71 42 34Black,non-Hispanicstudents 72 44 33Hispanicstudents 76 49 37White,non-Hispanicstudents 93 78 72
Studentachievementtrend:Mathematicspercentproficientlevelorabove
0%
25%
50%
75%
100%
6469
87 200320022001
Grade10Grade8Grade5
n/an/a
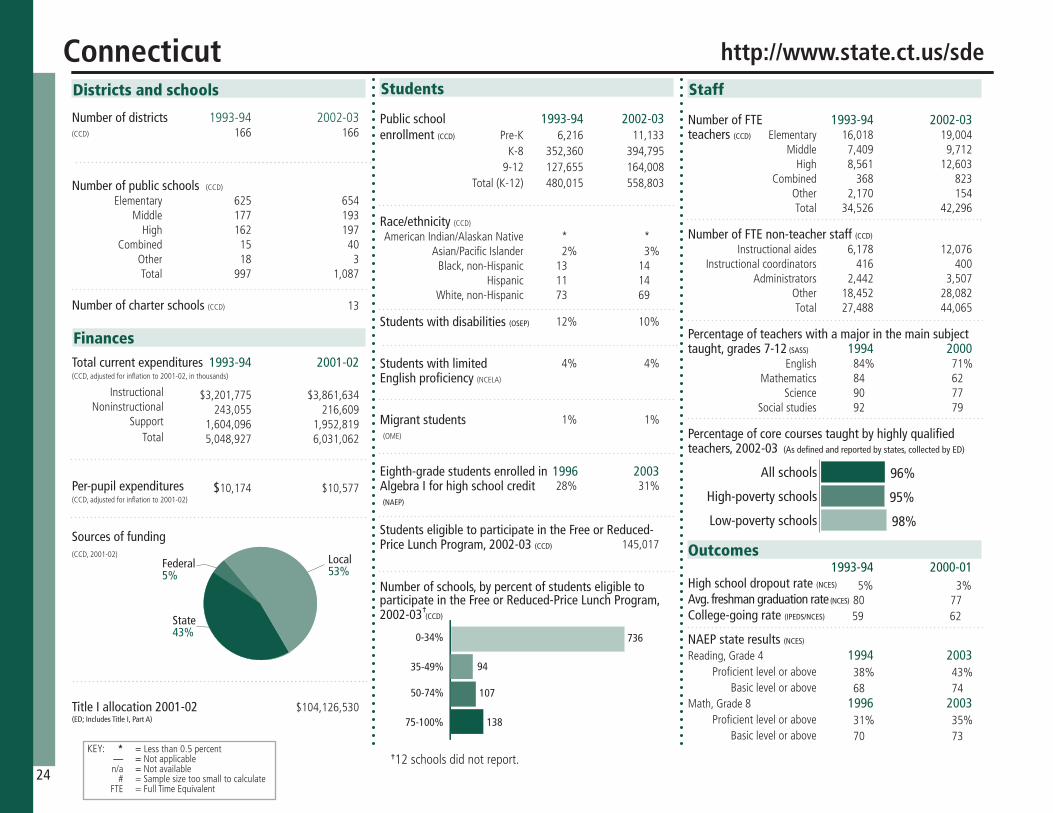
Staff
Number of FTE 1993-94 2002-03teachers (CCD) Elementary Middle High Combined Other Total
Number of FTE non-teacher staff (CCD)
Instructionalaides Instructionalcoordinators Administrators Other Total
Percentage of teachers with a major in the main subject taught, grades 7-12 (SASS) 1994 2000 English Mathematics Science Socialstudies
Percentage of core courses taught by highly qualified teachers, 2002-03 (As defined and reported by states, collected by ED)
Students
Public school 1993-94 2002-03enrollment (CCD) Pre-K K-8 9-12 Total(K-12)
Race/ethnicity (CCD) AmericanIndian/AlaskanNative Asian/PacificIslander Black,non-Hispanic Hispanic White,non-Hispanic
Students with disabilities (OSEP)
Students with limited English proficiency (NCELA)
Migrant students (OME)
Eighth-grade students enrolled in 1996 2003Algebra I for high school credit (NAEP)
Students eligible to participate in the Free or Reduced- Price Lunch Program, 2002-03 (CCD) Outcomes
1993-94 2000-01High school dropout rate (NCES)
Avg. freshman graduation rate (NCES) College-going rate (IPEDS/NCES)
NAEP state results (NCES) Reading,Grade4 1994 2003 Proficientlevelorabove BasicleveloraboveMath,Grade8 1996 2003 Proficientlevelorabove Basiclevelorabove
Number of districts 1993-94 2002-03(CCD)
Number of public schools (CCD)
Elementary Middle High Combined Other Total
Number of charter schools (CCD)
Districts and schools
Number of schools, by percent of students eligible to participate in the Free or Reduced-Price Lunch Program, 2002-03 (CCD)
Sources of funding(CCD,2001-02)
Title I allocation 2001-02 (ED; Includes Title I, Part A)
Total current expenditures 1993-94 2001-02 (CCD,adjustedforinflationto2001-02,inthousands)
Instructional Noninstructional Support Total
Per-pupil expenditures (CCD,adjustedforinflationto2001-02)
KEY: * =Lessthan0.5percent — = NotapplicableK n/a = Notavailable # =Samplesizetoosmalltocalculate FTE =FullTimeEquivalent
Finances
16,018 19,004 7,409 9,712 8,561 12,603 368 823 2,170 154 34,526 42,296
6,178 12,076 416 400 2,442 3,507 18,452 28,082 27,488 44,065
84% 71% 84 62 90 77 92 79
6,216 11,133 352,360 394,795 127,655 164,008 480,015 558,803
* * 2% 3% 13 14 11 14 73 69
12% 10%
4% 4%
1% 1%
28% 31%
145,017
5% 3% 80 77 5962
38% 43% 68 74
31% 35% 70 73
166 166
625 654 177 193 162 197 15 40 18 3 997 1,087
13
Connecticut http://www.state.ct.us/sde
$104,126,530
$3,201,775 $3,861,634 243,055 216,609 1,604,096 1,952,819 5,048,927 6,031,062
$10,174 $10,577
24
0-34%
35-49%
50-74%
75-100%
94
107
138
736
96%
95%
98%Low-poverty schools
High-poverty schools
All schools
Federal5%
State43%
Local53%
^
^12schoolsdidnotreport.

S t u d e n t A c h i e v e m e n t 2 0 0 2 - 0 3S t a t e w i d e A c c o u n t a b i l i t y I n f o r m a t i o n
SeeAppendixBforConnecticut’sdefinitionsofproficientforreadingandmathematicsforgrades4,8,andhighschool.
Seehttp://www.csde.state.ct.us/public/der/edfacts/performance.htmformoredetailsonthestatewideaccountabilitysystem.
State assessment for NCLB accountability:ConnecticutMasteryTest(CMT)State student achievement levels: Basic,BelowBasic,Proficient,Goal,Advanced
NCLB Accountability Goals 2001-02 Annual measurable Target objective starting point (2002-03)Grade4 Reading 57% 55% Mathematics 65 64Grade8 Reading 57 55 Mathematics 65 64 HighschoolReading 62 62 Mathematics 59 59
2002-03 NCLB accountability results, applied to 2003-04 school year AYP outcomes and consequences Title I schools All schools All districtsMadeAYP 341 (71%) 799 (81%) 141 (82%)Identifiedforimprovement:
Year1 77 (15%) 95 (10%) 0Year2 0 0 0Correctiveaction 8 (2%) 8 (1%) 0Restructuring 0 0 0
Exitedimprovementstatus(madeAYPtwice 0 0 0aftermissingtwiceormore,includestotal“made”above)
Other indicator, 2002-03 State target State outcome
ElementaryandMiddleindicator: 70%ormorestudentsatbasicor MetWritingassessment above,orincreasefrompreviousyear.
Highschoolindicator:Graduationrate n/a n/a
NCLB choice participation Number of Title I students Percent of eligible students
TitleIschoolchoice: 260 *Supplementaleducationalservices: 711 1%
ReadingProficient level or above for: Grade 4 Grade 8 Grade 10Allstudents 69% 78% 78%Economicallydisadvantagedstudents 42 53 51Migrantstudents n/a n/a n/aStudentswithdisabilities 28 38 40StudentswithlimitedEnglishproficiency 18 20 27Black,non-Hispanicstudents 42 55 53Hispanicstudents 39 50 50White,non-Hispanicstudents 79 87 84
Studentachievementtrend:Readingpercentproficientlevelorabove
0%
25%
50%
75%
100%7878
697978
697877
71
200320022001
Grade10Grade8Grade4
Connecticut
Connecticut Mastery Test/Academic Performance Test, used for NCLB accountability
25
MathematicsProficient level or above for: Grade 4 Grade 8 Grade 10Allstudents 81% 77% 74%Economicallydisadvantagedstudents 61 50 42Migrantstudents n/a n/a n/aStudentswithdisabilities 47 36 39StudentswithlimitedEnglishproficiency 45 31 32Black,non-Hispanicstudents 59 48 39Hispanicstudents 60 48 42White,non-Hispanicstudents 89 87 86
Studentachievementtrend:Mathematicspercentproficientlevelorabove
0%
25%
50%
75%
100%7781 787780 7776
200320022001
Grade10Grade8Grade4
8174

Staff
Number of FTE 1993-94 2002-03teachers (CCD) Elementary Middle High Combined Other Total
Number of FTE non-teacher staff (CCD)
Instructionalaides Instructionalcoordinators Administrators Other Total
Percentage of teachers with a major in the main subject taught, grades 7-12 (SASS) 1994 2000 English Mathematics Science Socialstudies
Percentage of core courses taught by highly qualified teachers, 2002-03 (As defined and reported by states, collected by ED)
Students
Public school 1993-94 2002-03enrollment (CCD) Pre-K K-8 9-12 Total(K-12)
Race/ethnicity (CCD) AmericanIndian/AlaskanNative Asian/PacificIslander Black,non-Hispanic Hispanic White,non-Hispanic
Students with disabilities (OSEP)
Students with limited English proficiency (NCELA)
Migrant students (OME)
Eighth-grade students enrolled in 1996 2003Algebra I for high school credit (NAEP)
Students eligible to participate in the Free or Reduced- Price Lunch Program, 2002-03 (CCD) Outcomes
1993-94 2000-01High school dropout rate (NCES)
Avg. freshman graduation rate (NCES) College-going rate (IPEDS/NCES)
NAEP state results (NCES) Reading,Grade4 1994 2003 Proficientlevelorabove BasicleveloraboveMath,Grade8 1996 2003 Proficientlevelorabove Basiclevelorabove
Number of districts 1993-94 2002-03(CCD)
Number of public schools (CCD)
Elementary Middle High Combined Other Total
Number of charter schools (CCD)
Districts and schools
Number of schools, by percent of students eligible to participate in the Free or Reduced-Price Lunch Program, 2002-03 (CCD)
Sources of funding(CCD,2001-02)
Title I allocation 2001-02 (ED; Includes Title I, Part A)
Total current expenditures 1993-94 2001-02 (CCD,adjustedforinflationto2001-02,inthousands)
Instructional Noninstructional Support Total
Per-pupil expenditures (CCD,adjustedforinflationto2001-02)
KEY: * =Lessthan0.5percent — = NotapplicableK n/a = Notavailable # =Samplesizetoosmalltocalculate FTE =FullTimeEquivalent
Finances
2,376 3,213 1,741 1,764 1,435 2,178 n/a 361 828 182 6,380 7,698
846 1,388 61 181 491 640 3,862 4,542 5,260 6,751
90% 61% # 74 82 68 77 n/a
565 665 76,052 81,556 28,930 34,121 104,982 115,677
* * 2% 3% 29 31 3 7 66 58
11% 12%
1% 3%
1% 1%
39% 21%
41,319
5% 4% 74 71 6560
23% 33% 52 71
19% 25% 55 68
19 19
86 104 41 44 32 32 18 21 n/a n/a 177 201
11
Delaware http://www.doe.state.de.us
$27,673,805
$510,983 $660,857 34,687 50,033 278,661 361,985 824,332 1,072,875
$7,810 $9,284
26
0-34%
35-49%
50-74%
75-100%
62
48
8
82
85%
85%
95%Low-poverty schools
High-poverty schools
All schools
Federal9%
State64%
Local27%
^
^1schooldidnotreport.
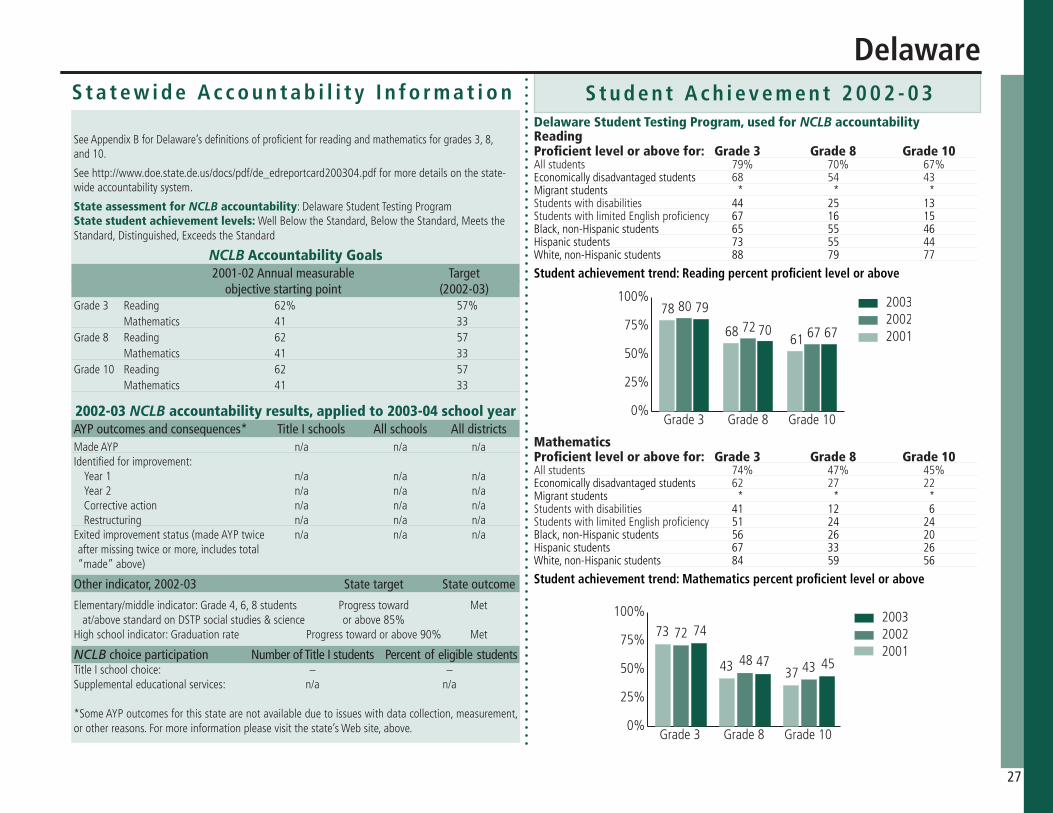
S t u d e n t A c h i e v e m e n t 2 0 0 2 - 0 3S t a t e w i d e A c c o u n t a b i l i t y I n f o r m a t i o n
SeeAppendixBforDelaware’sdefinitionsofproficientforreadingandmathematicsforgrades3,8,and10.
Seehttp://www.doe.state.de.us/docs/pdf/de_edreportcard200304.pdfformoredetailsonthestate-wideaccountabilitysystem.
State assessment for NCLB accountability:DelawareStudentTestingProgramState student achievement levels: WellBelowtheStandard,BelowtheStandard,MeetstheStandard,Distinguished,ExceedstheStandard
NCLB Accountability Goals 2001-02 Annual measurable Target objective starting point (2002-03)Grade3 Reading 62% 57% Mathematics 41 33Grade8 Reading 62 57 Mathematics 41 33 Grade10 Reading 62 57 Mathematics 41 33
2002-03 NCLB accountability results, applied to 2003-04 school year AYP outcomes and consequences* Title I schools All schools All districtsMadeAYP n/a n/a n/aIdentifiedforimprovement:
Year1 n/a n/a n/aYear2 n/a n/a n/aCorrectiveaction n/a n/a n/aRestructuring n/a n/a n/a
Exitedimprovementstatus(madeAYPtwice n/a n/a n/aaftermissingtwiceormore,includestotal“made”above)
Other indicator, 2002-03 State target State outcome
Elementary/middleindicator:Grade4,6,8students Progresstoward Met at/abovestandardonDSTPsocialstudies&science orabove85%Highschoolindicator:Graduationrate Progresstowardorabove90% Met
NCLB choice participation Number of Title I students Percent of eligible students TitleIschoolchoice: – –Supplementaleducationalservices: n/a n/a
*SomeAYPoutcomesforthisstatearenotavailableduetoissueswithdatacollection,measurement,orotherreasons.Formoreinformationpleasevisitthestate’sWebsite,above.
ReadingProficient level or above for: Grade 3 Grade 8 Grade 10 Allstudents 79% 70% 67%Economicallydisadvantagedstudents 68 54 43Migrantstudents * * *Studentswithdisabilities 44 25 13StudentswithlimitedEnglishproficiency 67 16 15Black,non-Hispanicstudents 65 55 46Hispanicstudents 73 55 44White,non-Hispanicstudents 88 79 77
Studentachievementtrend:Readingpercentproficientlevelorabove
0%
25%
50%
75%
100%
6770
79
6772
80
6168
78 200320022001
Grade10Grade8Grade3
Delaware
Delaware Student Testing Program, used for NCLB accountability
27
MathematicsProficient level or above for: Grade 3 Grade 8 Grade 10 Allstudents 74% 47% 45%Economicallydisadvantagedstudents 62 27 22Migrantstudents * * *Studentswithdisabilities 41 12 6StudentswithlimitedEnglishproficiency 51 24 24Black,non-Hispanicstudents 56 26 20Hispanicstudents 67 33 26White,non-Hispanicstudents 84 59 56
Studentachievementtrend:Mathematicspercentproficientlevelorabove
0%
25%
50%
75%
100%
4547
74
4348
72
3743
73200320022001
Grade10Grade8Grade3

Staff
Number of FTE 1993-94 2002-03teachers (CCD) Elementary Middle High Combined Other Total
Number of FTE non-teacher staff (CCD)
Instructionalaides Instructionalcoordinators Administrators Other Total
Percentage of teachers with a major in the main subject taught, grades 7-12 (SASS) 1994 2000 English Mathematics Science Socialstudies
Percentage of core courses taught by highly qualified teachers, 2002-03 (As defined and reported by states, collected by ED)
Students
Public school 1993-94 2002-03enrollment (CCD) Pre-K K-8 9-12 Total(K-12)
Race/ethnicity (CCD) AmericanIndian/AlaskanNative Asian/PacificIslander Black,non-Hispanic Hispanic White,non-Hispanic
Students with disabilities (OSEP)
Students with limited English proficiency (NCELA)
Migrant students (OME)
Eighth-grade students enrolled in 1996 2003Algebra I for high school credit (NAEP)
Students eligible to participate in the Free or Reduced- Price Lunch Program, 2002-03 (CCD) Outcomes
1993-94 2000-01High school dropout rate (NCES)
Avg. freshman graduation rate (NCES) College-going rate (IPEDS/NCES)
NAEP state results (NCES) Reading,Grade4 1994 2003 Proficientlevelorabove BasicleveloraboveMath,Grade8 1996 2003 Proficientlevelorabove Basiclevelorabove
Number of districts 1993-94 2002-03(CCD)
Number of public schools (CCD)
Elementary Middle High Combined Other Total
Number of charter schools (CCD)
Districts and schools
Number of schools, by percent of students eligible to participate in the Free or Reduced-Price Lunch Program, 2002-03 (CCD)
Sources of funding(CCD,2001-02)
Title I allocation 2001-02 (ED; Includes Title I, Part A)
Total current expenditures 1993-94 2001-02 (CCD,adjustedforinflationto2001-02,inthousands)
Instructional Noninstructional Support Total
Per-pupil expenditures (CCD,adjustedforinflationto2001-02)
KEY: * =Lessthan0.5percent — = NotapplicableK n/a = Notavailable # =Samplesizetoosmalltocalculate FTE =FullTimeEquivalent
Finances
2,286 n/a 905 n/a 977 n/a 105 n/a 1,783 n/a 6,056 n/a
366 1,536 168 20 799 333 3,202 4,655 4,535 6,544
90% 68% 82 87 # n/a # 74
5,216 4,703 53,903 50,486 17,854 15,374 71,757 65,860
* * 1% 2% 89 84 6 10 4 4
9% 15%
6% 8%
* 2%
53% 16%
47,189
10% n/a 59 60% 71 48
n/a 11% n/a 32
5% 6% 20 29
1 1
111 119 26 28 20 30 5 8 11 18 173 203
34
DistrictofColumbia http://www.k12.dc.us
$34,870,281
$449,382 $452,905 37,699 27,834 426,240 431,692 913,321 912,431
$11,321 $12,102
28
0-34%
35-49%
50-74%
75-100%
10
61
95
25
43%
37%
44%Low-poverty schools
High-poverty schools
All schools
Federal13%
Local87%
^
^12schoolsdidnotreport.

S t u d e n t A c h i e v e m e n t 2 0 0 2 - 0 3S t a t e w i d e A c c o u n t a b i l i t y I n f o r m a t i o n
SeeAppendixBfortheDistrictofColumbia’sdefinitionsofproficientforreadingandmathematicsforgrades4,8,andhighschool.
Seehttp://silicon.k12.dc.us/NCLB/reportcards.aspformoredetailsonthestatewideaccountabilitysystem.
State assessment for NCLB accountability:Stanford9State student achievement levels: BelowBasic,Basic,Proficient,Advanced
NCLB Accountability Goals 2001-02 Annual measurable Target objective starting point (2002-03)ElementaryReading 30.3% 30.3% Mathematics 38.4 38.4SecondaryReading 19.8 19.8 Mathematics 13.7 13.7 HighschoolReading 19.8 19.8 Mathematics 13.7 13.7
2002-03 NCLB accountability results, applied to 2003-04 school year AYP outcomes and consequences Title I schools All schools All districtsMadeAYP 50(27%) 78 (42%) 0Identifiedforimprovement:
Year1 65 (35%) 65 (35%) 0Year2 14 (8%) 14 (8%) 0Correctiveaction 0 0 0Restructuring 0 0 0
Exitedimprovementstatus(madeAYPtwice 0 0 0aftermissingtwiceormore,includestotal“made”above)
Other indicator, 2002-03 State target State outcome
Elementaryindicator:Attendance Meetorapproach90%. 97schoolsmetMiddleindicator:Attendance Meetorapproach90%. 21schoolsmetHighschoolindicator:Graduationrate n/a n/a
NCLB choice participation Number of Title I students Percent of eligible students
TitleIschoolchoice: 192 *Supplementaleducationalservices: 1,120 2%
ReadingProficient level or above for: Grade 4 Grade 8 High schoolAllstudents 46% 42% 30%Economicallydisadvantagedstudents 48 46 33Migrantstudents 60 65 40Studentswithdisabilities 16 11 7StudentswithlimitedEnglishproficiency 29 13 <5Black,non-Hispanicstudents 44 40 28Hispanicstudents 44 40 20White,non-Hispanicstudents 96 91 86
Studentachievementtrend:Readingpercentproficientlevelorabove
0%
25%
50%
75%
100%
304246
200320022001
HighSchoolGrade8Grade4
n/an/a
DistrictofColumbia
Stanford 9, used for NCLB accountability
29
MathematicsProficient level or above for: Grade 4 Grade 8 High schoolAllstudents 54% 40% 44%Economicallydisadvantagedstudents 58 42 47Migrantstudents 63 58 57Studentswithdisabilities 15 8 10StudentswithlimitedEnglishproficiency 45 27 40Black,non-Hispanicstudents 52 37 41Hispanicstudents 58 43 44White,non-Hispanicstudents 97 93 87
Studentachievementtrend:Mathematicspercentproficientlevelorabove
0%
25%
50%
75%
100%
4440
54
200320022001
HighSchoolGrade8Grade4
n/an/a

Staff
Number of FTE 1993-94 2002-03teachers (CCD) Elementary Middle High Combined Other Total
Number of FTE non-teacher staff (CCD)
Instructionalaides Instructionalcoordinators Administrators Other Total
Percentage of teachers with a major in the main subject taught, grades 7-12 (SASS) 1994 2000 English Mathematics Science Socialstudies
Percentage of core courses taught by highly qualified teachers, 2002-03 (As defined and reported by states, collected by ED)
Students
Public school 1993-94 2002-03enrollment (CCD) Pre-K K-8 9-12 Total(K-12)
Race/ethnicity (CCD) AmericanIndian/AlaskanNative Asian/PacificIslander Black,non-Hispanic Hispanic White,non-Hispanic
Students with disabilities (OSEP)
Students with limited English proficiency (NCELA)
Migrant students (OME)
Eighth-grade students enrolled in 1996 2003Algebra I for high school credit (NAEP)
Students eligible to participate in the Free or Reduced- Price Lunch Program, 2002-03 (CCD) Outcomes
1993-94 2000-01High school dropout rate (NCES)
Avg. freshman graduation rate (NCES) College-going rate (IPEDS/NCES)
NAEP state results (NCES) Reading,Grade4 1994 2003 Proficientlevelorabove BasicleveloraboveMath,Grade8 1996 2003 Proficientlevelorabove Basiclevelorabove
Number of districts 1993-94 2002-03(CCD)
Number of public schools (CCD)
Elementary Middle High Combined Other Total
Number of charter schools (CCD)
Districts and schools
Number of schools, by percent of students eligible to participate in the Free or Reduced-Price Lunch Program, 2002-03 (CCD)
Sources of funding(CCD,2001-02)
Title I allocation 2001-02 (ED; Includes Title I, Part A)
Total current expenditures 1993-94 2001-02 (CCD,adjustedforinflationto2001-02,inthousands)
Instructional Noninstructional Support Total
Per-pupil expenditures (CCD,adjustedforinflationto2001-02)
KEY: * =Lessthan0.5percent — = NotapplicableK n/a = Notavailable # =Samplesizetoosmalltocalculate FTE =FullTimeEquivalent
Finances
55,750 68,661 19,218 26,552 20,830 33,510 6,996 8,590 7,859 913 110,653 138,226
22,238 31,040 801 658 7,436 8,483 85,783 108,683 116,258 148,864
83% 86% 76 67 52 69 86 96
34,793 51,304 1,480,401 1,724,113 525,569 729,149 2,005,970 2,453,262
* * 2% 2% 25 25 14 21 60 52
12% 13%
6% 13%
2% 3%
27% 28%
1,148,685
n/a 4% 66% 61 4958
23% 32% 50 63
17% 23% 54 61
67 67
1,479 1,826 393 511 343 442 300 593 41 10 2,556 3,382
225
Florida http://www.flboe.org
$476,520,104
$7,643,691 $9,161,962 646,235 772,643 4,936,846 5,601,259 13,226,722 15,535,864
$6,482 $6,213
30
0-34%
35-49%
50-74%
75-100%
559
936
712
1,163
91%
93%
92%Low-poverty schools
High-poverty schools
All schools
Federal10%
State45%
Local45%
^
^12schoolsdidnotreport.
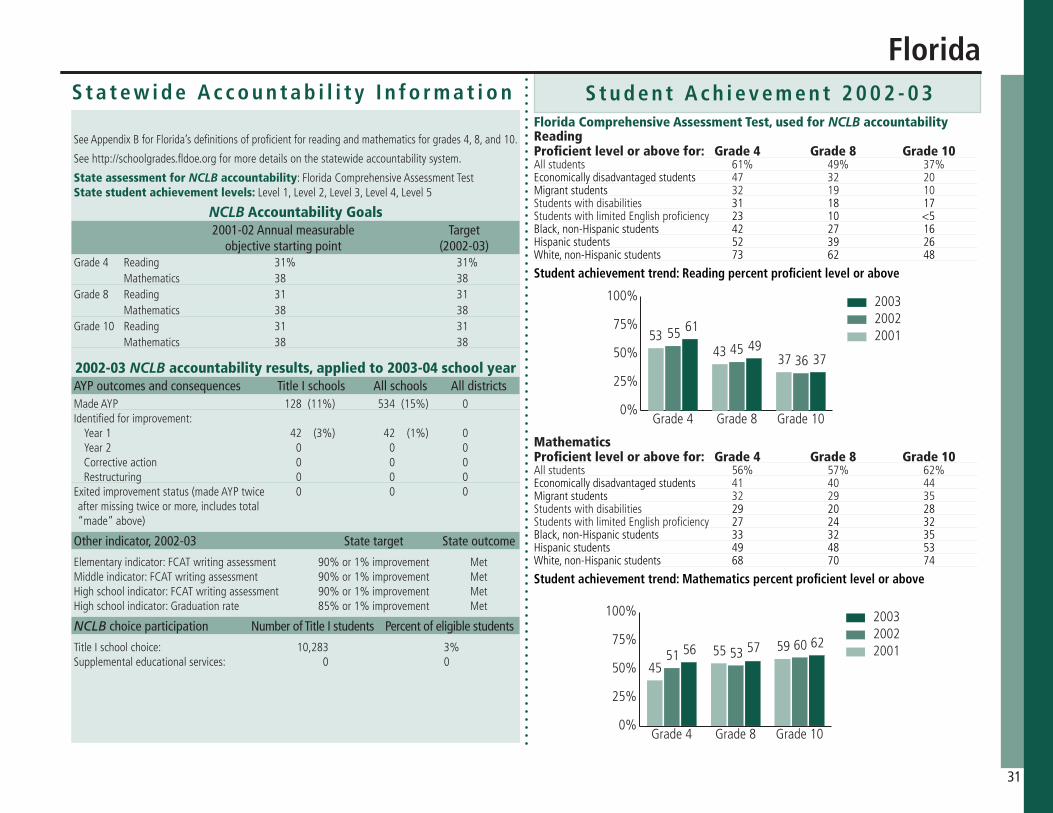
S t u d e n t A c h i e v e m e n t 2 0 0 2 - 0 3S t a t e w i d e A c c o u n t a b i l i t y I n f o r m a t i o n
SeeAppendixBforFlorida’sdefinitionsofproficientforreadingandmathematicsforgrades4,8,and10.
Seehttp://schoolgrades.fldoe.orgformoredetailsonthestatewideaccountabilitysystem.
State assessment for NCLB accountability:FloridaComprehensiveAssessmentTestState student achievement levels: Level1,Level2,Level3,Level4,Level5
NCLB Accountability Goals 2001-02 Annual measurable Target objective starting point (2002-03)Grade4 Reading 31% 31% Mathematics 38 38Grade8 Reading 31 31 Mathematics 38 38 Grade10 Reading 31 31 Mathematics 38 38
2002-03 NCLB accountability results, applied to 2003-04 school year AYP outcomes and consequences Title I schools All schools All districtsMadeAYP 128 (11%) 534 (15%) 0Identifiedforimprovement:
Year1 42 (3%) 42 (1%) 0Year2 0 0 0Correctiveaction 0 0 0Restructuring 0 0 0
Exitedimprovementstatus(madeAYPtwice 0 0 0aftermissingtwiceormore,includestotal“made”above)
Other indicator, 2002-03 State target State outcome
Elementaryindicator:FCATwritingassessment 90%or1%improvement Met Middleindicator:FCATwritingassessment 90%or1%improvement MetHighschoolindicator:FCATwritingassessment 90%or1%improvement MetHighschoolindicator:Graduationrate 85%or1%improvement Met
NCLB choice participation Number of Title I students Percent of eligible students
TitleIschoolchoice: 10,283 3%Supplementaleducationalservices: 0 0
ReadingProficient level or above for: Grade 4 Grade 8 Grade 10Allstudents 61% 49% 37%Economicallydisadvantagedstudents 47 32 20Migrantstudents 32 19 10Studentswithdisabilities 31 18 17StudentswithlimitedEnglishproficiency 23 10 <5Black,non-Hispanicstudents 42 27 16Hispanicstudents 52 39 26White,non-Hispanicstudents 73 62 48
Studentachievementtrend:Readingpercentproficientlevelorabove
0%
25%
50%
75%
100%
3749
61
3645
55
374353
200320022001
Grade10Grade8Grade4
Florida
Florida Comprehensive Assessment Test, used for NCLB accountability
31
MathematicsProficient level or above for: Grade 4 Grade 8 Grade 10Allstudents 56% 57% 62%Economicallydisadvantagedstudents 41 40 44Migrantstudents 32 29 35Studentswithdisabilities 29 20 28StudentswithlimitedEnglishproficiency 27 24 32Black,non-Hispanicstudents 33 32 35Hispanicstudents 49 48 53White,non-Hispanicstudents 68 70 74
Studentachievementtrend:Mathematicspercentproficientlevelorabove
0%
25%
50%
75%
100%
625756 6053515955
45
200320022001
Grade10Grade8Grade4
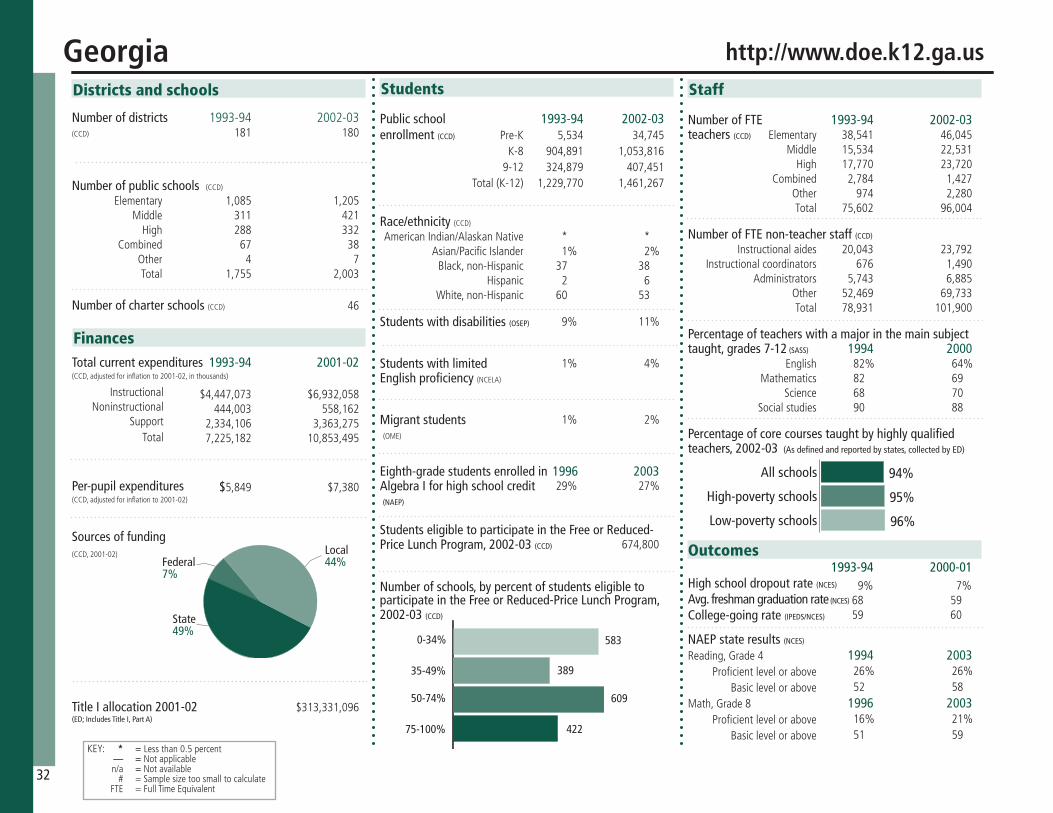
Staff
Number of FTE 1993-94 2002-03teachers (CCD) Elementary Middle High Combined Other Total
Number of FTE non-teacher staff (CCD)
Instructionalaides Instructionalcoordinators Administrators Other Total
Percentage of teachers with a major in the main subject taught, grades 7-12 (SASS) 1994 2000 English Mathematics Science Socialstudies
Percentage of core courses taught by highly qualified teachers, 2002-03 (As defined and reported by states, collected by ED)
Students
Public school 1993-94 2002-03enrollment (CCD) Pre-K K-8 9-12 Total(K-12)
Race/ethnicity (CCD) AmericanIndian/AlaskanNative Asian/PacificIslander Black,non-Hispanic Hispanic White,non-Hispanic
Students with disabilities (OSEP)
Students with limited English proficiency (NCELA)
Migrant students (OME)
Eighth-grade students enrolled in 1996 2003Algebra I for high school credit (NAEP)
Students eligible to participate in the Free or Reduced- Price Lunch Program, 2002-03 (CCD) Outcomes
1993-94 2000-01High school dropout rate (NCES)
Avg. freshman graduation rate (NCES) College-going rate (IPEDS/NCES)
NAEP state results (NCES) Reading,Grade4 1994 2003 Proficientlevelorabove BasicleveloraboveMath,Grade8 1996 2003 Proficientlevelorabove Basiclevelorabove
Number of districts 1993-94 2002-03(CCD)
Number of public schools (CCD)
Elementary Middle High Combined Other Total
Number of charter schools (CCD)
Districts and schools
Number of schools, by percent of students eligible to participate in the Free or Reduced-Price Lunch Program, 2002-03 (CCD)
Sources of funding(CCD,2001-02)
Title I allocation 2001-02 (ED; Includes Title I, Part A)
Total current expenditures 1993-94 2001-02 (CCD,adjustedforinflationto2001-02,inthousands)
Instructional Noninstructional Support Total
Per-pupil expenditures (CCD,adjustedforinflationto2001-02)
KEY: * =Lessthan0.5percent — = NotapplicableK n/a = Notavailable # =Samplesizetoosmalltocalculate FTE =FullTimeEquivalent
Finances
38,541 46,045 15,534 22,531 17,770 23,720 2,784 1,427 974 2,280 75,602 96,004
20,043 23,792 676 1,490 5,743 6,885 52,469 69,733 78,931 101,900
82% 64% 82 69 68 70 90 88
5,534 34,745 904,891 1,053,816 324,879 407,451 1,229,770 1,461,267
* * 1% 2% 37 38 2 6 60 53
9% 11%
1% 4%
1% 2%
29% 27%
674,800
9% 7% 68 59 59 60
26% 26% 52 58
16% 21% 51 59
181 180
1,085 1,205 311 421 288 332 67 38 4 7 1,755 2,003
46
Georgia http://www.doe.k12.ga.us
$313,331,096
$4,447,073 $6,932,058 444,003 558,162 2,334,106 3,363,275 7,225,182 10,853,495
$5,849 $7,380
32
0-34%
35-49%
50-74%
75-100%
389
609
422
583
94%
95%
96%Low-poverty schools
High-poverty schools
All schools
Federal7%
State49%
Local44%

S t u d e n t A c h i e v e m e n t 2 0 0 2 - 0 3S t a t e w i d e A c c o u n t a b i l i t y I n f o r m a t i o n
SeeAppendixBforGeorgia’sdefinitionsofproficientforReadingandmathematicsforgrades4,8,and11.
Seehttp://reportcard.gaosa.org/yr2004/pscformoredetailsonthestatewideaccountabilitysystem.
State assessment for NCLB accountability:Criterion-ReferencedCompetencyTests(CRCT)State student achievement levels: CRCT:DoesNotMeetStandard,MeetsStandard,ExceedsStandard;GHSGT:Failure,Pass,PassPlus
NCLB Accountability Goals 2001-02 Annual measurable Target objective starting point (2002-03)Grade4 Reading 60% 60% Mathematics 50 50Grade8 Reading 60 60 Mathematics 50 50 Grade11 Reading 88 88 Mathematics 81 81
2002-03 NCLB accountability results, applied to 2003-04 school year AYP outcomes and consequences Title I schools All schools All districtsMadeAYP 762 (68%) 1,274 (64%) 12 (7%)Identifiedforimprovement:
Year1 146 (13%) 146 (7%) 0Year2 90 (8%) 90 (5%) 0Correctiveaction 176 (16%) 176 (9%) 0Restructuring 121 (11%) 121 (6%) 0
Exitedimprovementstatus(madeAYPtwice 0 0 0aftermissingtwiceormore,includestotal“made”above)
Other indicator, 2002-03 State target State outcome
Elementaryindicator:LEAchoice – –Middleindicator:LEAchoice – –Highschoolindicator:Graduationrate Meeting60%orprogresstowardgoal. Met.
NCLB choice participation Number of Title I students Percent of eligible students
TitleIschoolchoice: 2,547 *Supplementaleducationalservices: 25,451 4%
ReadingProficient level or above for: Grade 4 Grade 8 Grade 11Allstudents 80% 81% 95%Economicallydisadvantagedstudents 71 71 90Migrantstudents 58 51 84Studentswithdisabilities 51 43 74StudentswithlimitedEnglishproficiency 47 46 67Black,non-Hispanicstudents 73 73 92Hispanicstudents 65 65 84White,non-Hispanicstudents 88 88 97
Studentachievementtrend:Readingpercentproficientlevelorabove
0%
25%
50%
75%
100% 958180
958077
9482
74200320022001
Grade11Grade8Grade4
Georgia
Criterion-Referenced Competency Tests, High School Graduation Test, used for NCLB accountability
33
MathematicsProficient level or above for: Grade 4 Grade 8 Grade 11Allstudents 74% 67% 92%Economicallydisadvantagedstudents 64 53 83Migrantstudents 57 48 78Studentswithdisabilities 42 23 60StudentswithlimitedEnglishproficiency 50 44 75Black,non-Hispanicstudents 62 52 84Hispanicstudents 64 54 85White,non-Hispanicstudents 83 77 96
Studentachievementtrend:Mathematicspercentproficientlevelorabove
0%
25%
50%
75%
100% 92
677491
6566
91
5863
200320022001
Grade11Grade8Grade4

Staff
Number of FTE 1993-94 2002-03teachers (CCD) Elementary Middle High Combined Other Total
Number of FTE non-teacher staff (CCD)
Instructionalaides Instructionalcoordinators Administrators Other Total
Percentage of teachers with a major in the main subject taught, grades 7-12 (SASS) 1994 2000 English Mathematics Science Socialstudies
Percentage of core courses taught by highly qualified teachers, 2002-03 (As defined and reported by states, collected by ED)
Students
Public school 1993-94 2002-03enrollment (CCD) Pre-K K-8 9-12 Total(K-12)
Race/ethnicity (CCD) AmericanIndian/AlaskanNative Asian/PacificIslander Black,non-Hispanic Hispanic White,non-Hispanic
Students with disabilities (OSEP)
Students with limited English proficiency (NCELA)
Migrant students (OME)
Eighth-grade students enrolled in 1996 2003Algebra I for high school credit (NAEP)
Students eligible to participate in the Free or Reduced- Price Lunch Program, 2002-03 (CCD) Outcomes
1993-94 2000-01High school dropout rate (NCES)
Avg. freshman graduation rate (NCES) College-going rate (IPEDS/NCES)
NAEP state results (NCES) Reading,Grade4 1994 2003 Proficientlevelorabove BasicleveloraboveMath,Grade8 1996 2003 Proficientlevelorabove Basiclevelorabove
Number of districts 1993-94 2002-03(CCD)
Number of public schools (CCD)
Elementary Middle High Combined Other Total
Number of charter schools (CCD)
Districts and schools
Number of schools, by percent of students eligible to participate in the Free or Reduced-Price Lunch Program, 2002-03 (CCD)
Sources of funding(CCD,2001-02)
Title I allocation 2001-02 (ED; Includes Title I, Part A)
Total current expenditures 1993-94 2001-02 (CCD,adjustedforinflationto2001-02,inthousands)
Instructional Noninstructional Support Total
Per-pupil expenditures (CCD,adjustedforinflationto2001-02)
KEY: * =Lessthan0.5percent — = NotapplicableK n/a = Notavailable # =Samplesizetoosmalltocalculate FTE =FullTimeEquivalent
Finances
5,629 5,677 1,322 1,815 2,805 3,062 342 268 14 153 10,111 10,973
2,203 2,603 226 524 609 640 5,143 5,963 8,181 9,730
81% 81% 69 76 74 87 86 62
552 1,031 131,051 129,779 48,728 52,922 179,779 182,701
* * 68% 72% 3 2 5 5 24 20
7% 10%
6% 7%
n/a 1%
18% 17%
80,630
n/a 6% 76% 68 62 60
19% 21% 46 53
16% 16% 51 55
1 1
168 183 28 37 33 43 10 19 2 1 241 283
25
Hawaii http://www.k12.hi.us
$33,671,612
$787,661 $815,123 76,988 75,474 413,162 457,784 1,277,811 1,348,381
$7,082 $7,306
34
0-34%
35-49%
50-74%
75-100%
70
96
40
77
87%
84%
Low-poverty schools
High-poverty schools
All schools
Not Available
Local2%
Federal9%
State89%

S t u d e n t A c h i e v e m e n t 2 0 0 2 - 0 3S t a t e w i d e A c c o u n t a b i l i t y I n f o r m a t i o n
SeeAppendixBforHawaii’sdefinitionsofproficientforreadingandmathematicsforgrades3,8,andhighschool.
Seehttp://arch.k12.hi.us/pdf/nclb/2004/NCLB999.pdfformoredetailsonthestatewideaccountabilitysystem.
State assessment for NCLB accountability:HCPSIIStateAssessmentState student achievement levels: WellBelowProficiencyAssessment,ApproachesProficiencyAssessment,MeetsProficiency,ExceedsProficiency
NCLB Accountability Goals 2001-02 Annual measurable Target objective starting point (2002-03)Grade3 Reading 30% 30% Mathematics 10 10Grade8 Reading 30 30 Mathematics 10 10 HighschoolReading 30 30 Mathematics 10 10
2002-03 NCLB accountability results, applied to 2003-04 school year AYP outcomes and consequences Title I schools All schools All districtsMadeAYP 42(31%) 109 (39%) 0Identifiedforimprovement:
Year1 3 (2%) 3 (1%) 0Year2 12 (9%) 12 (4%) 0Correctiveaction 25 (18%) 25 (9%) 0Restructuring 44 (32%) 44 (16%) 0
Exitedimprovementstatus(madeAYPtwice 0 0 0aftermissingtwiceormore,includestotal“made”above)
Other indicator, 2002-03 State target State outcome
Elementaryindicator:Grade-levelretentionrate 3%orless MetMiddleindicator:Grade-levelretentionrate 6%orless MetHighschoolindicator:Graduationrate 70% Met
NCLB choice participation Number of Title I students Percent of Title I students
TitleIschoolchoice: 157 *Supplementaleducationalservices: 2,447 3%
ReadingProficient level or above for: Grade 3 Grade 8 High schoolAllstudents 43% 39% 40%Economicallydisadvantagedstudents 30 26 26Migrantstudents 21 18 20Studentswithdisabilities 9 6 5StudentswithlimitedEnglishproficiency 8 5 7Black,non-Hispanicstudents 36 38 35Hispanicstudents 36 34 31White,non-Hispanicstudents 57 53 52
Studentachievementtrend:Readingpercentproficientlevelorabove
0%
25%
50%
75%
100%
403943 445461
200320022001
HighSchoolGrade8Grade3
n/a
Hawaii
Hawaii Content and Performance Standards II State Assessment, used for NCLB accountability
35
MathematicsProficient level or above for: Grade 3 Grade 8 High schoolAllstudents 24% 17% 18%Economicallydisadvantagedstudents 15 8 9Migrantstudents 12 5 8Studentswithdisabilities 6 <5 <5StudentswithlimitedEnglishproficiency 6 <5 5Black,non-Hispanicstudents 12 7 8Hispanicstudents 15 9 9White,non-Hispanicstudents 32 23 23
Studentachievementtrend:Mathematicspercentproficientlevelorabove
0%
25%
50%
75%
100%
181724
4952
200320022001
HighSchoolGrade8Grade3
n/a65

Staff
Number of FTE 1993-94 2002-03teachers (CCD) Elementary Middle High Combined Other Total
Number of FTE non-teacher staff (CCD)
Instructionalaides Instructionalcoordinators Administrators Other Total
Percentage of teachers with a major in the main subject taught, grades 7-12 (SASS) 1994 2000 English Mathematics Science Socialstudies
Percentage of core courses taught by highly qualified teachers, 2002-03 (As defined and reported by states, collected by ED)
Students
Public school 1993-94 2002-03enrollment (CCD) Pre-K K-8 9-12 Total(K-12)
Race/ethnicity (CCD) AmericanIndian/AlaskanNative Asian/PacificIslander Black,non-Hispanic Hispanic White,non-Hispanic
Students with disabilities (OSEP)
Students with limited English proficiency (NCELA)
Migrant students (OME)
Eighth-grade students enrolled in 1996 2003Algebra I for high school credit (NAEP)
Students eligible to participate in the Free or Reduced- Price Lunch Program, 2002-03 (CCD) Outcomes
1993-94 2000-01High school dropout rate (NCES)
Avg. freshman graduation rate (NCES) College-going rate (IPEDS/NCES)
NAEP state results (NCES) Reading,Grade4 1994 2003 Proficientlevelorabove BasicleveloraboveMath,Grade8 1996 2003 Proficientlevelorabove Basiclevelorabove
Number of districts 1993-94 2002-03(CCD)
Number of public schools (CCD)
Elementary Middle High Combined Other Total
Number of charter schools (CCD)
Districts and schools
Number of schools, by percent of students eligible to participate in the Free or Reduced-Price Lunch Program, 2002-03 (CCD)
Sources of funding(CCD,2001-02)
Title I allocation 2001-02 (ED; Includes Title I, Part A)
Total current expenditures 1993-94 2001-02 (CCD,adjustedforinflationto2001-02,inthousands)
Instructional Noninstructional Support Total
Per-pupil expenditures (CCD,adjustedforinflationto2001-02)
KEY: * =Lessthan0.5percent — = NotapplicableK n/a = Notavailable # =Samplesizetoosmalltocalculate FTE =FullTimeEquivalent
Finances
5,713 6,379 2,635 2,924 3,205 4,081 155 365 300 147 12,007 13,896
1,709 2,641 185 274 709 847 5,373 7,239 7,976 11,001
69% 57% 46 49 77 75 73 66
1,389 2,517 164,828 170,608 69,287 75,241 234,115 245,849
1% 1% 1 1 1 1 7 11 90 86
8% 10%
3% 8%
5% 6%
n/a 28%
90,447
9% 6% 80 80 48 45
n/a 30% n/a 64
n/a 28% n/a 72
113 114
329 350 100 106 142 172 15 28 13 4 599 660
13
Idaho http://www.sde.state.id.us
$32,795,334
$695,625 $905,333 53,749 63,933 350,421 512,538 1,099,794 1,481,804
$4,645 $6,011
36
0-34%
35-49%
50-74%
75-100%
196
168
34
261
98%
98%
Low-poverty schools
High-poverty schools
All schools
Not available
Federal9%
State61%
Local30%
^
^1schooldidnotreport.

S t u d e n t A c h i e v e m e n t 2 0 0 2 - 0 3S t a t e w i d e A c c o u n t a b i l i t y I n f o r m a t i o n
SeeAppendixBforIdaho’sdefinitionsofproficientforreadingandmathematicsforgrades4,8,andhighschool.
Seehttp://www.sde.state.id.us/ipd/reportcard/SchoolReportCard0304.aspformoredetailsonthestatewideaccountabilitysystem.
State assessment for NCLB accountability:IdahoStandardsAchievementTestState student achievement levels: Basic,Proficient,Advanced
NCLB Accountability Goals 2001-02 Annual measurable Target objective starting point (2002-03)Grade4 Reading 66% 66% Mathematics 51 62Grade8 Reading 66 66 Mathematics 51 51 HighschoolReading 66 66 Mathematics 51 51
2002-03 NCLB accountability results, applied to 2003-04 school year AYP outcomes and consequences* Title I schools All schools All districtsMadeAYP n/a n/a n/aIdentifiedforimprovement:
Year1 – – –Year2 – – –Correctiveaction – – –Restructuring – – –
Exitedimprovementstatus(madeAYPtwice – – –aftermissingtwiceormore,includestotal“made”above)
Other indicator, 2002-03 State target State outcomeElementary/middleindicator:LanguageArtsISAT Meetorprogresstowardstandard Metorstudentgrowth. setbyboard.Highschoolindicator:Graduationrate Meetorprogresstowardstandard Met
NCLB choice participation Number of Title I students Percent of eligible students TitleIschoolchoice: 0 –Supplementaleducationalservices: 0 –
*SomeAYPoutcomesforthisstatearenotavailableduetoissueswithdatacollection,measurement,orotherreasons.Formoreinformationpleasevisitthestate’sWebsite,above.
ReadingProficient level or above for: Grade 4 Grade 8 High schoolAllstudents 75% 74% 75%Economicallydisadvantagedstudents 65 61 61Migrantstudents 39 33 32Studentswithdisabilities 36 28 27StudentswithlimitedEnglishproficiency 39 36 29Black,non-Hispanicstudents 75 65 63Hispanicstudents 50 44 40White,non-Hispanicstudents 79 78 79
Studentachievementtrend:Readingpercentproficientlevelorabove
0%
25%
50%
75%
100%
757475200320022001
HighSchoolGrade8Grade4
n/an/a
Idaho
Idaho Standards Achievement Tests, used for NCLB accountability
37
MathematicsProficient level or above for: Grade 4 Grade 8 High schoolAllstudents 77% 53% 71%Economicallydisadvantagedstudents 68 36 57Migrantstudents 51 17 38Studentswithdisabilities 45 12 22StudentswithlimitedEnglishproficiency 49 21 35Black,non-Hispanicstudents 67 37 51Hispanicstudents 58 25 43White,non-Hispanicstudents 81 57 74
Studentachievementtrend:Mathematicspercentproficientlevelorabove
0%
25%
50%
75%
100%
7153
77200320022001
HighSchoolGrade8Grade4
n/an/a

Staff
Number of FTE 1993-94 2002-03teachers (CCD) Elementary Middle High Combined Other Total
Number of FTE non-teacher staff (CCD)
Instructionalaides Instructionalcoordinators Administrators Other Total
Percentage of teachers with a major in the main subject taught, grades 7-12 (SASS) 1994 2000 English Mathematics Science Socialstudies
Percentage of core courses taught by highly qualified teachers, 2002-03 (As defined and reported by states, collected by ED)
Students
Public school 1993-94 2002-03enrollment (CCD) Pre-K K-8 9-12 Total(K-12)
Race/ethnicity (CCD) AmericanIndian/AlaskanNative Asian/PacificIslander Black,non-Hispanic Hispanic White,non-Hispanic
Students with disabilities (OSEP)
Students with limited English proficiency (NCELA)
Migrant students (OME)
Eighth-grade students enrolled in 1996 2003Algebra I for high school credit (NAEP)
Students eligible to participate in the Free or Reduced- Price Lunch Program, 2002-03 (CCD) Outcomes
1993-94 2000-01High school dropout rate (NCES)
Avg. freshman graduation rate (NCES) College-going rate (IPEDS/NCES)
NAEP state results (NCES) Reading,Grade4 1994 2003 Proficientlevelorabove BasicleveloraboveMath,Grade8 1996 2003 Proficientlevelorabove Basiclevelorabove
Number of districts 1993-94 2002-03(CCD)
Number of public schools (CCD)
Elementary Middle High Combined Other Total
Number of charter schools (CCD)
Districts and schools
Number of schools, by percent of students eligible to participate in the Free or Reduced-Price Lunch Program, 2002-03 (CCD)
Sources of funding(CCD,2001-02)
Title I allocation 2001-02 (ED; Includes Title I, Part A)
Total current expenditures 1993-94 2001-02 (CCD,adjustedforinflationto2001-02,inthousands)
Instructional Noninstructional Support Total
Per-pupil expenditures (CCD,adjustedforinflationto2001-02)
KEY: * =Lessthan0.5percent — = NotapplicableK n/a = Notavailable # =Samplesizetoosmalltocalculate FTE =FullTimeEquivalent
Finances
55,317 65,432 17,322 22,421 29,174 36,121 872 1,959 8,190 5,112 110,874 131,045
17,609 32,902 1,507 1,298 6,031 10,333 63,201 82,656 88,348 127,189
89% 70% 82 65 77 93 80 90
42,359 60,524 1,259,394 1,425,283 503,024 595,349 1,762,418 2,020,632
* * 3% 4% 21 21 11 17 65 58
11% 12%
5% 8%
* *
n/a 23%
741,954
7% 6% 76 76 64 60
n/a 31% n/a 61
n/a 29% n/a 66
922 893
2,618 2,619 707 740 645 753 27 123 181 36 4,178 4,271
22
Illinois http://www.isbe.state.il.us
$430,679,234
$7,763,834 $9,804,430 437,918 536,275 4,698,564 6,140,082 12,900,315 16,480,787
$6,814 $7,956
38
0-34%
35-49%
50-74%
75-100%
534
568
672
2,194
98%
95%
100%Low-poverty schools
High-poverty schools
All schools
Federal8%
State34%
Local58%
^
^303schoolsdidnotreport.
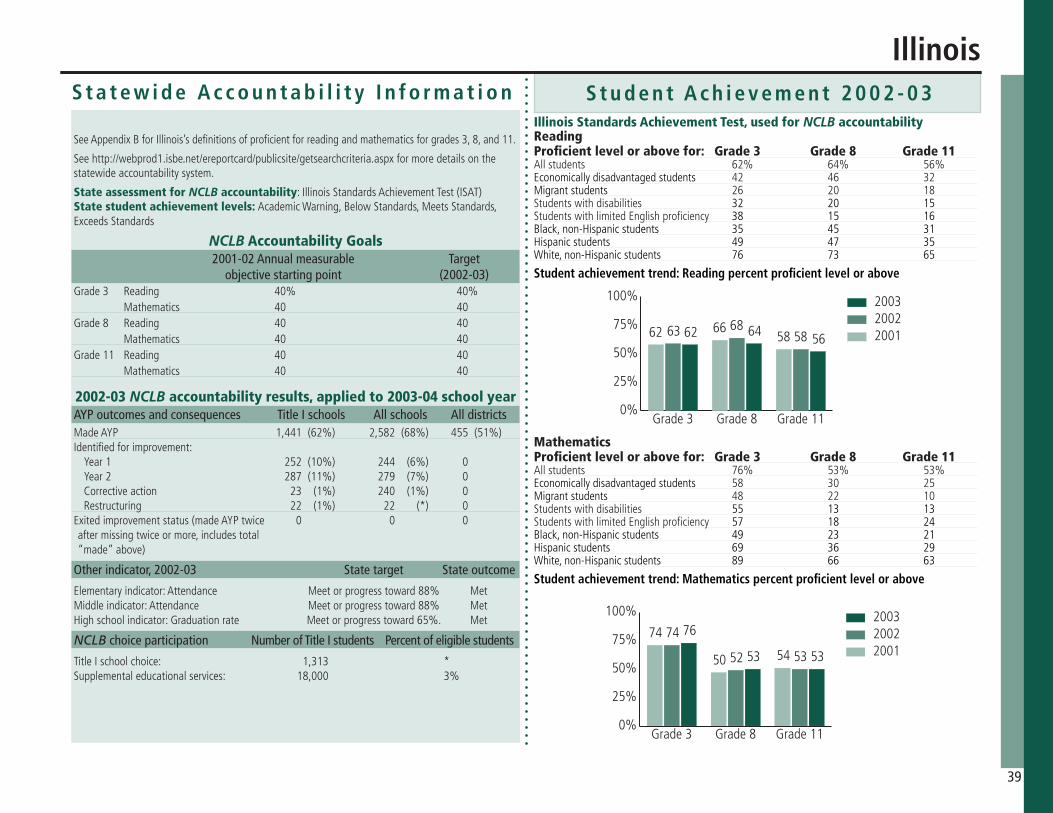
S t u d e n t A c h i e v e m e n t 2 0 0 2 - 0 3S t a t e w i d e A c c o u n t a b i l i t y I n f o r m a t i o n
SeeAppendixBforIllinois’sdefinitionsofproficientforreadingandmathematicsforgrades3,8,and11.
Seehttp://webprod1.isbe.net/ereportcard/publicsite/getsearchcriteria.aspxformoredetailsonthestatewideaccountabilitysystem.
State assessment for NCLB accountability:IllinoisStandardsAchievementTest(ISAT)State student achievement levels: AcademicWarning,BelowStandards,MeetsStandards,ExceedsStandards
NCLB Accountability Goals 2001-02 Annual measurable Target objective starting point (2002-03)Grade3 Reading 40% 40% Mathematics 40 40Grade8 Reading 40 40 Mathematics 40 40 Grade11 Reading 40 40 Mathematics 40 40
2002-03 NCLB accountability results, applied to 2003-04 school year AYP outcomes and consequences Title I schools All schools All districtsMadeAYP 1,441 (62%) 2,582 (68%) 455 (51%)Identifiedforimprovement:
Year1 252 (10%) 244 (6%) 0Year2 287 (11%) 279 (7%) 0Correctiveaction 23 (1%) 240 (1%) 0Restructuring 22 (1%) 22 (*) 0
Exitedimprovementstatus(madeAYPtwice 0 0 0aftermissingtwiceormore,includestotal“made”above)
Other indicator, 2002-03 State target State outcome
Elementaryindicator:Attendance Meetorprogresstoward88% MetMiddleindicator:Attendance Meetorprogresstoward88% MetHighschoolindicator:Graduationrate Meetorprogresstoward65%. Met
NCLB choice participation Number of Title I students Percent of eligible students
TitleIschoolchoice: 1,313 *Supplementaleducationalservices: 18,000 3%
ReadingProficient level or above for: Grade 3 Grade 8 Grade 11Allstudents 62% 64% 56%Economicallydisadvantagedstudents 42 46 32Migrantstudents 26 20 18Studentswithdisabilities 32 20 15StudentswithlimitedEnglishproficiency 38 15 16Black,non-Hispanicstudents 35 45 31Hispanicstudents 49 47 35White,non-Hispanicstudents 76 73 65
Studentachievementtrend:Readingpercentproficientlevelorabove
0%
25%
50%
75%
100%
566462 586863 58
6662
200320022001
Grade11Grade8Grade3
Illinois
Illinois Standards Achievement Test, used for NCLB accountability
39
MathematicsProficient level or above for: Grade 3 Grade 8 Grade 11Allstudents 76% 53% 53%Economicallydisadvantagedstudents 58 30 25Migrantstudents 48 22 10Studentswithdisabilities 55 13 13StudentswithlimitedEnglishproficiency 57 18 24Black,non-Hispanicstudents 49 23 21Hispanicstudents 69 36 29White,non-Hispanicstudents 89 66 63
Studentachievementtrend:Mathematicspercentproficientlevelorabove
0%
25%
50%
75%
100%
5353
76
5352
74
5450
74200320022001
Grade11Grade8Grade3

Staff
Number of FTE 1993-94 2002-03teachers (CCD) Elementary Middle High Combined Other Total
Number of FTE non-teacher staff (CCD)
Instructionalaides Instructionalcoordinators Administrators Other Total
Percentage of teachers with a major in the main subject taught, grades 7-12 (SASS) 1994 2000 English Mathematics Science Socialstudies
Percentage of core courses taught by highly qualified teachers, 2002-03 (As defined and reported by states, collected by ED)
Students
Public school 1993-94 2002-03enrollment (CCD) Pre-K K-8 9-12 Total(K-12)
Race/ethnicity (CCD) AmericanIndian/AlaskanNative Asian/PacificIslander Black,non-Hispanic Hispanic White,non-Hispanic
Students with disabilities (OSEP)
Students with limited English proficiency (NCELA)
Migrant students (OME)
Eighth-grade students enrolled in 1996 2003Algebra I for high school credit (NAEP)
Students eligible to participate in the Free or Reduced- Price Lunch Program, 2002-03 (CCD) Outcomes
1993-94 2000-01High school dropout rate (NCES)
Avg. freshman graduation rate (NCES) College-going rate (IPEDS/NCES)
NAEP state results (NCES) Reading,Grade4 1994 2003 Proficientlevelorabove BasicleveloraboveMath,Grade8 1996 2003 Proficientlevelorabove Basiclevelorabove
Number of districts 1993-94 2002-03(CCD)
Number of public schools (CCD)
Elementary Middle High Combined Other Total
Number of charter schools (CCD)
Districts and schools
Number of schools, by percent of students eligible to participate in the Free or Reduced-Price Lunch Program, 2002-03 (CCD)
Sources of funding(CCD,2001-02)
Title I allocation 2001-02 (ED; Includes Title I, Part A)
Total current expenditures 1993-94 2001-02 (CCD,adjustedforinflationto2001-02,inthousands)
Instructional Noninstructional Support Total
Per-pupil expenditures (CCD,adjustedforinflationto2001-02)
KEY: * =Lessthan0.5percent — = NotapplicableK n/a = Notavailable # =Samplesizetoosmalltocalculate FTE =FullTimeEquivalent
Finances
25,289 28,277 9,848 11,114 15,889 16,166 721 2,041 3,360 2,371 55,107 59,968
13,633 17,426 1,293 1,623 3,611 3,919 40,248 44,062 58,785 67,030
76% 87% 81 72 78 77 89 79
3,971 5,407 669,997 707,112 282,219 288,190 952,216 995,302
* * 1% 1% 11 12 2 4 86 82
11% 13%
1% 2%
1% 2%
21% 24%
325,856
n/a n/a 76% 72% 55 60
33% 33% 66 66
24% 30% 68 73
292 294
1,180 1,165 292 318 348 340 32 85 9 1 1,861 1,909
11
Indiana http://www.doe.state.in.us
$152,669,344
$3,995,708 $4,689,264 284,075 316,010 2,203,966 2,699,273 6,483,749 7,704,547
$6,715 $7,734
40
0-34%
35-49%
50-74%
75-100%
368
294
155
1,060
96%
95%
97%Low-poverty schools
High-poverty schools
All schools
Federal6%
State51%
Local43%
^
^32schoolsdidnotreport.

S t u d e n t A c h i e v e m e n t 2 0 0 2 - 0 3S t a t e w i d e A c c o u n t a b i l i t y I n f o r m a t i o n
SeeAppendixBforIndiana’sdefinitionsofproficientforEnglish/languageartsandmathematicsforgrades3,8,andhighschool.
Seehttp://www.doe.state.in.us/istep/2003/summary.htmlformoredetailsonthestatewideaccount-abilitysystem.
State assessment for NCLB accountability:IndianaStatewideTestingforEducationalProgressPlus(ISTEP+)State student achievement levels: DidNotPass,Pass,PassPlus
NCLB Accountability Goals 2001-02 Annual measurable Target objective starting point (2002-03)Grade3 English/languagearts 58.8% 58.8% Mathematics 57.1 57.1Grade8 English/languagearts 58.8 58.8 Mathematics 57.1 57.1 HighschoolEnglish/languagearts 58.8 58.8 Mathematics 57.1 57.1
2002-03 NCLB accountability results, applied to 2003-04 school year AYP outcomes and consequences* Title I schools All schools All districtsMadeAYP 654 (85%) 1,405 (76%) 161 (55%)Identifiedforimprovement:
Year1 26 (3%) 26 (1%) 23 (8%)Year2 23 (3%) 23 (1%) 0Correctiveaction 18 (2%) 18 (1%) 0Restructuring 10 (1%) 10 (1%) 0
Exitedimprovementstatus(madeAYPtwice n/a n/a n/aaftermissingtwiceormore,includestotal“made”above)
Other indicator, 2002-03 State target State outcome
Elementaryindicator:Attendance Meetorprogresstoward95% MetMiddleindicator:Attendance Meetorprogresstoward95% MetHighschoolindicator:Graduationrate Meetorprogresstoward95% Met
NCLB choice participation Number of Title I students Percent of eligible students
TitleIschoolchoice: 1,199 1%Supplementaleducationalservices: 3,064 3%
*SomeAYPoutcomesforthisstatearenotavailableduetoissueswithdatacollection,measurement,orotherreasons.Formoreinformationpleasevisitthestate’sWebsite,above.
English or language artsProficient level or above for: Grade 3 Grade 8 High schoolAllstudents 72% 64% 68%Economicallydisadvantagedstudents 59 43 48Migrantstudents # # #Studentswithdisabilities 38 17 20StudentswithlimitedEnglishproficiency 51 24 24Black,non-Hispanicstudents 50 36 38Hispanicstudents 56 45 49White,non-Hispanicstudents 76 68 74
Studentachievementtrend:Englishorlanguageartspercentproficientlevelorabove
0%
25%
50%
75%
100%
686472 686866
808064
200320022001
HighSchoolGrade8Grade3
Indiana
Indiana Statewide Testing for Educational Progress Plus, used for NCLB accountability
41
MathematicsProficient level or above for: Grade 3 Grade 8 High schoolAllstudents 67% 66% 68%Economicallydisadvantagedstudents 54 45 47Migrantstudents # # #Studentswithdisabilities 41 22 27StudentswithlimitedEnglishproficiency 52 34 35Black,non-Hispanicstudents 46 33 35Hispanicstudents 55 51 49White,non-Hispanicstudents 70 72 73
Studentachievementtrend:Mathematicspercentproficientlevelorabove
0%
25%
50%
75%
100%
686667 6667715461
74200320022001
HighSchoolGrade8Grade3

Staff
Number of FTE 1993-94 2002-03teachers (CCD) Elementary Middle High Combined Other Total
Number of FTE non-teacher staff (CCD)
Instructionalaides Instructionalcoordinators Administrators Other Total
Percentage of teachers with a major in the main subject taught, grades 7-12 (SASS) 1994 2000 English Mathematics Science Socialstudies
Percentage of core courses taught by highly qualified teachers, 2002-03 (As defined and reported by states, collected by ED)
Students
Public school 1993-94 2002-03enrollment (CCD) Pre-K K-8 9-12 Total(K-12)
Race/ethnicity (CCD) AmericanIndian/AlaskanNative Asian/PacificIslander Black,non-Hispanic Hispanic White,non-Hispanic
Students with disabilities (OSEP)
Students with limited English proficiency (NCELA)
Migrant students (OME)
Eighth-grade students enrolled in 1996 2003Algebra I for high school credit (NAEP)
Students eligible to participate in the Free or Reduced- Price Lunch Program, 2002-03 (CCD) Outcomes
1993-94 2000-01High school dropout rate (NCES)
Avg. freshman graduation rate (NCES) College-going rate (IPEDS/NCES)
NAEP state results (NCES) Reading,Grade4 1994 2003 Proficientlevelorabove BasicleveloraboveMath,Grade8 1996 2003 Proficientlevelorabove Basiclevelorabove
Number of districts 1993-94 2002-03(CCD)
Number of public schools (CCD)
Elementary Middle High Combined Other Total
Number of charter schools (CCD)
Districts and schools
Number of schools, by percent of students eligible to participate in the Free or Reduced-Price Lunch Program, 2002-03 (CCD)
Sources of funding(CCD,2001-02)
Title I allocation 2001-02 (ED; Includes Title I, Part A)
Total current expenditures 1993-94 2001-02 (CCD,adjustedforinflationto2001-02,inthousands)
Instructional Noninstructional Support Total
Per-pupil expenditures (CCD,adjustedforinflationto2001-02)
KEY: * =Lessthan0.5percent — = NotapplicableK n/a = Notavailable # =Samplesizetoosmalltocalculate FTE =FullTimeEquivalent
Finances
14,572 16,089 6,521 7,204 10,389 11,216 133 65 n/a n/a 31,616 34,573
4,945 8,439 372 477 2,496 3,149 20,848 20,788 28,661 32,853
80% 70% 74 73 86 89 81 80
5,430 5,949 333,743 315,773 142,601 152,147 476,344 467,920
* 1% 2% 2 3 4 2 4 93 89
11% 13%
1% 3%
* 2%
20% 19%
137,404
3% 3% 87 83 64 65
35% 35% 69 71
31% 33% 78 76
396 371
852 797 289 293 357 366 18 37 – 7 1,516 1,500
n/a
Iowa http://www.state.ia.us/educate
$62,955,699
$1,994,760 $2,124,947 145,189 259,195 1,095,643 1,181,655 3,235,591 3,565,797
$6,491 $7,338
42
0-34%
35-49%
50-74%
75-100%
296
139
41
1,024
95%
95%
95%Low-poverty schools
High-poverty schools
All schools
Federal7%
State48%
Local45%

S t u d e n t A c h i e v e m e n t 2 0 0 2 - 0 3S t a t e w i d e A c c o u n t a b i l i t y I n f o r m a t i o n
SeeAppendixBforIowa’sdefinitionsofproficientforreadingandmathematicsforgrades4,8,andhighschool.
Seehttp://www.state.ia.us/educate/stateboard/doc/pocketcard03.pdfformoredetailsonthestate-wideaccountabilitysystem.
State assessment for NCLB accountability:IowaTestsofBasicSkills(ITBS)andtheIowaTestsofEducationalDevelopment(ITED)State student achievement levels: Low,Intermediate,High
NCLB Accountability Goals 2001-02 Annual measurable Target objective starting point (2002-03)Grade4 Reading 65% 65% Mathematics 64 64Grade8 Reading 61 61 Mathematics 63 63 HighschoolReading 69 69 Mathematics 69 69
2002-03 NCLB accountability results, applied to 2003-04 school year AYP outcomes and consequences Title I schools All schools All districtsMadeAYP 718 (98%) 1,488 (99%) 371(100%)Identifiedforimprovement:
Year1 12 (2%) 12 (1%) 0Year2 0 0 0Correctiveaction 0 0 0Restructuring 0 0 0
Exitedimprovementstatus(madeAYPtwice 0 0 0aftermissingtwiceormore,includestotal“made”above)
Other indicator, 2002-03 State target State outcome
Elementaryindicator:Attendance Meetorprogresstoward95% MetMiddleindicator:Attendance Meetorprogresstoward95% MetHighschoolindicator:Graduationrate Meetorprogresstoward90% Met
NCLB choice participation Number of Title I students Percent of eligible students
TitleIschoolchoice: 60 *Supplementaleducationalservices: 75 *
ReadingProficient level or above for: Grade 4 Grade 8 High schoolAllstudents 76% 69% 77%Economicallydisadvantagedstudents 61 50 61Migrantstudents 44 30 26Studentswithdisabilities 29 23 28StudentswithlimitedEnglishproficiency 41 27 32Black,non-Hispanicstudents 48 36 50Hispanicstudents 53 43 54White,non-Hispanicstudents 79 72 79
Studentachievementtrend:Readingpercentproficientlevelorabove
0%
25%
50%
75%
100%77
6976 776969 756968
200320022001
HighSchoolGrade8Grade4
Iowa
Iowa Tests of Basic Skills (grades 4, 8) and the Iowa Tests of Educational Development (high school), used for NCLB accountability
43
MathematicsProficient level or above for: Grade 4 Grade 8 High schoolAllstudents 75% 72% 79%Economicallydisadvantagedstudents 59 51 62Migrantstudents 49 39 37Studentswithdisabilities 35 25 33StudentswithlimitedEnglishproficiency 45 34 40Black,non-Hispanicstudents 43 33 44Hispanicstudents 53 43 53White,non-Hispanicstudents 78 74 81
Studentachievementtrend:Mathematicspercentproficientlevelorabove
0%
25%
50%
75%
100%797275 81
7372 797472200320022001
HighSchoolGrade8Grade4

Staff
Number of FTE 1993-94 2002-03teachers (CCD) Elementary Middle High Combined Other Total
Number of FTE non-teacher staff (CCD)
Instructionalaides Instructionalcoordinators Administrators Other Total
Percentage of teachers with a major in the main subject taught, grades 7-12 (SASS) 1994 2000 English Mathematics Science Socialstudies
Percentage of core courses taught by highly qualified teachers, 2002-03 (As defined and reported by states, collected by ED)
Students
Public school 1993-94 2002-03enrollment (CCD) Pre-K K-8 9-12 Total(K-12)
Race/ethnicity (CCD) AmericanIndian/AlaskanNative Asian/PacificIslander Black,non-Hispanic Hispanic White,non-Hispanic
Students with disabilities (OSEP)
Students with limited English proficiency (NCELA)
Migrant students (OME)
Eighth-grade students enrolled in 1996 2003Algebra I for high school credit (NAEP)
Students eligible to participate in the Free or Reduced- Price Lunch Program, 2002-03 (CCD) Outcomes
1993-94 2000-01High school dropout rate (NCES)
Avg. freshman graduation rate (NCES) College-going rate (IPEDS/NCES)
NAEP state results (NCES) Reading,Grade4 1994 2003 Proficientlevelorabove BasicleveloraboveMath,Grade8 1996 2003 Proficientlevelorabove Basiclevelorabove
Number of districts 1993-94 2002-03(CCD)
Number of public schools (CCD)
Elementary Middle High Combined Other Total
Number of charter schools (CCD)
Districts and schools
Number of schools, by percent of students eligible to participate in the Free or Reduced-Price Lunch Program, 2002-03 (CCD)
Sources of funding(CCD,2001-02)
Title I allocation 2001-02 (ED; Includes Title I, Part A)
Total current expenditures 1993-94 2001-02 (CCD,adjustedforinflationto2001-02,inthousands)
Instructional Noninstructional Support Total
Per-pupil expenditures (CCD,adjustedforinflationto2001-02)
KEY: * =Lessthan0.5percent — = NotapplicableK n/a = Notavailable # =Samplesizetoosmalltocalculate FTE =FullTimeEquivalent
Finances
14,836 15,618 5,692 6,504 9,146 10,455 23 67 587 n/a 30,283 32,643
4,178 6,805 166 118 2,103 2,991 19,053 21,354 25,500 31,268
63% 66% 63 58 78 73 73 71
2,432 2,257 324,914 307,786 127,081 143,412 451,995 451,198
1% 1% 2 2 8 9 5 10 84 77
9% 11%
2% 6%
3% 4%
n/a 28%
168,744
n/a 3% 80% 77 57 68
n/a 32% n/a 66
n/a 34% n/a 76
304 304
865 804 235 258 351 364 1 2 4 3 1,456 1,431
18
Kansas http://www.ksde.org
$73,138,975
$1,722,008 $2,017,178 146,144 161,018 1,108,602 1,272,727 2,976,754 3,450,923
$6,505 $7,339
44
0-34%
35-49%
50-74%
75-100%
380
275
114
662
80%
80%
79%Low-poverty schools
High-poverty schools
All schools
Federal8%
State58%
Local34%
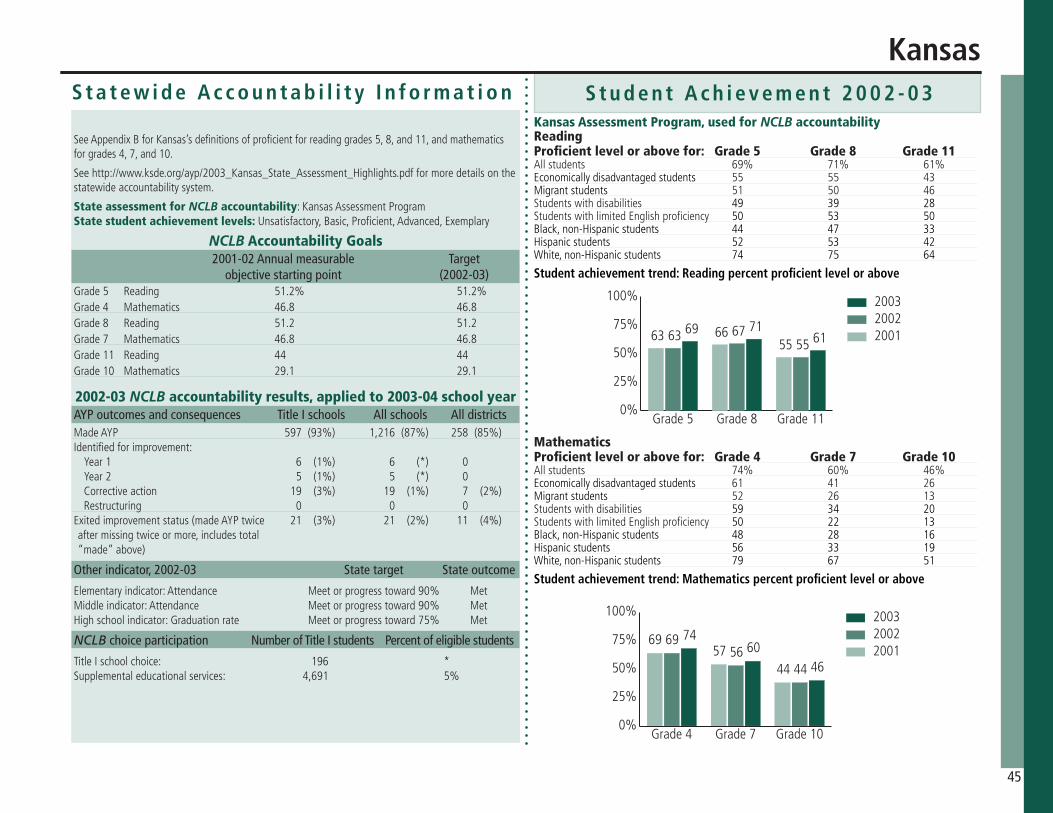
S t u d e n t A c h i e v e m e n t 2 0 0 2 - 0 3S t a t e w i d e A c c o u n t a b i l i t y I n f o r m a t i o n
SeeAppendixBforKansas’sdefinitionsofproficientforreadinggrades5,8,and11,andmathematicsforgrades4,7,and10.
Seehttp://www.ksde.org/ayp/2003_Kansas_State_Assessment_Highlights.pdfformoredetailsonthestatewideaccountabilitysystem.
State assessment for NCLB accountability:KansasAssessmentProgramState student achievement levels: Unsatisfactory,Basic,Proficient,Advanced,Exemplary
NCLB Accountability Goals 2001-02 Annual measurable Target objective starting point (2002-03)Grade5 Reading 51.2% 51.2% Grade4 Mathematics 46.8 46.8Grade8 Reading 51.2 51.2Grade7 Mathematics 46.8 46.8 Grade11 Reading 44 44Grade10 Mathematics 29.1 29.1
2002-03 NCLB accountability results, applied to 2003-04 school year AYP outcomes and consequences Title I schools All schools All districtsMadeAYP 597 (93%) 1,216 (87%) 258 (85%)Identifiedforimprovement:
Year1 6 (1%) 6 (*) 0Year2 5 (1%) 5 (*) 0Correctiveaction 19 (3%) 19 (1%) 7 (2%)Restructuring 0 0 0
Exitedimprovementstatus(madeAYPtwice 21 (3%) 21 (2%) 11 (4%)aftermissingtwiceormore,includestotal“made”above)
Other indicator, 2002-03 State target State outcome
Elementaryindicator:Attendance Meetorprogresstoward90% MetMiddleindicator:Attendance Meetorprogresstoward90% MetHighschoolindicator:Graduationrate Meetorprogresstoward75% Met
NCLB choice participation Number of Title I students Percent of eligible students
TitleIschoolchoice: 196 *Supplementaleducationalservices: 4,691 5%
ReadingProficient level or above for: Grade 5 Grade 8 Grade 11Allstudents 69% 71% 61%Economicallydisadvantagedstudents 55 55 43Migrantstudents 51 50 46Studentswithdisabilities 49 39 28StudentswithlimitedEnglishproficiency 50 53 50Black,non-Hispanicstudents 44 47 33Hispanicstudents 52 53 42White,non-Hispanicstudents 74 75 64
Studentachievementtrend:Readingpercentproficientlevelorabove
0%
25%
50%
75%
100%
617169
556763
556663
200320022001
Grade11Grade8Grade5
Kansas
Kansas Assessment Program, used for NCLB accountability
45
MathematicsProficient level or above for: Grade 4 Grade 7 Grade 10Allstudents 74% 60% 46%Economicallydisadvantagedstudents 61 41 26Migrantstudents 52 26 13Studentswithdisabilities 59 34 20StudentswithlimitedEnglishproficiency 50 22 13Black,non-Hispanicstudents 48 28 16Hispanicstudents 56 33 19White,non-Hispanicstudents 79 67 51
Studentachievementtrend:Mathematicspercentproficientlevelorabove
0%
25%
50%
75%
100%
4660
74
4456
69
4457
69
200320022001
Grade10Grade7Grade4

Staff
Number of FTE 1993-94 2002-03teachers (CCD) Elementary Middle High Combined Other Total
Number of FTE non-teacher staff (CCD)
Instructionalaides Instructionalcoordinators Administrators Other Total
Percentage of teachers with a major in the main subject taught, grades 7-12 (SASS) 1994 2000 English Mathematics Science Socialstudies
Percentage of core courses taught by highly qualified teachers, 2002-03 (As defined and reported by states, collected by ED)
Students
Public school 1993-94 2002-03enrollment (CCD) Pre-K K-8 9-12 Total(K-12)
Race/ethnicity (CCD) AmericanIndian/AlaskanNative Asian/PacificIslander Black,non-Hispanic Hispanic White,non-Hispanic
Students with disabilities (OSEP)
Students with limited English proficiency (NCELA)
Migrant students (OME)
Eighth-grade students enrolled in 1996 2003Algebra I for high school credit (NAEP)
Students eligible to participate in the Free or Reduced- Price Lunch Program, 2002-03 (CCD) Outcomes
1993-94 2000-01High school dropout rate (NCES)
Avg. freshman graduation rate (NCES) College-going rate (IPEDS/NCES)
NAEP state results (NCES) Reading,Grade4 1994 2003 Proficientlevelorabove BasicleveloraboveMath,Grade8 1996 2003 Proficientlevelorabove Basiclevelorabove
Number of districts 1993-94 2002-03(CCD)
Number of public schools (CCD)
Elementary Middle High Combined Other Total
Number of charter schools (CCD)
Districts and schools
Number of schools, by percent of students eligible to participate in the Free or Reduced-Price Lunch Program, 2002-03 (CCD)
Sources of funding(CCD,2001-02)
Title I allocation 2001-02 (ED; Includes Title I, Part A)
Total current expenditures 1993-94 2001-02 (CCD,adjustedforinflationto2001-02,inthousands)
Instructional Noninstructional Support Total
Per-pupil expenditures (CCD,adjustedforinflationto2001-02)
KEY: * =Lessthan0.5percent — = NotapplicableK n/a = Notavailable # =Samplesizetoosmalltocalculate FTE =FullTimeEquivalent
Finances
19,213 19,088 7,410 8,007 10,701 10,773 n/a 579 n/a 2,214 37,324 40,662
9,322 14,078 626 846 2,945 3,722 31,062 36,531 43,955 55,177
63% 70% 79 58 55 65 80 70
15,732 n/a 442,834 440,952 184,356 182,479 627,190 623,431
* * 1% 1% 10 10 * 1 89 87
10% 12%
* 1%
3% 3%
20% 20%
434,012
n/a 5% 79% 70 49 59
26% 31% 56 65
16% 24% 56 66
176 176
814 772 222 233 251 293 10 80 6 3 1,303 1,381
n/a
Kentucky http://www.kde.state.ky.us
$152,145,672
$2,263,697 $2,619,607 197,370 235,471 1,318,201 1,413,529 3,779,268 4,268,607
$5,767 $6,523
46
0-34%
35-49%
50-74%
75-100%
113
260
777
228
95%
97%
93%Low-poverty schools
High-poverty schools
All schools
Federal11%
State60%
Local30%
^
^3schoolsdidnotreport.
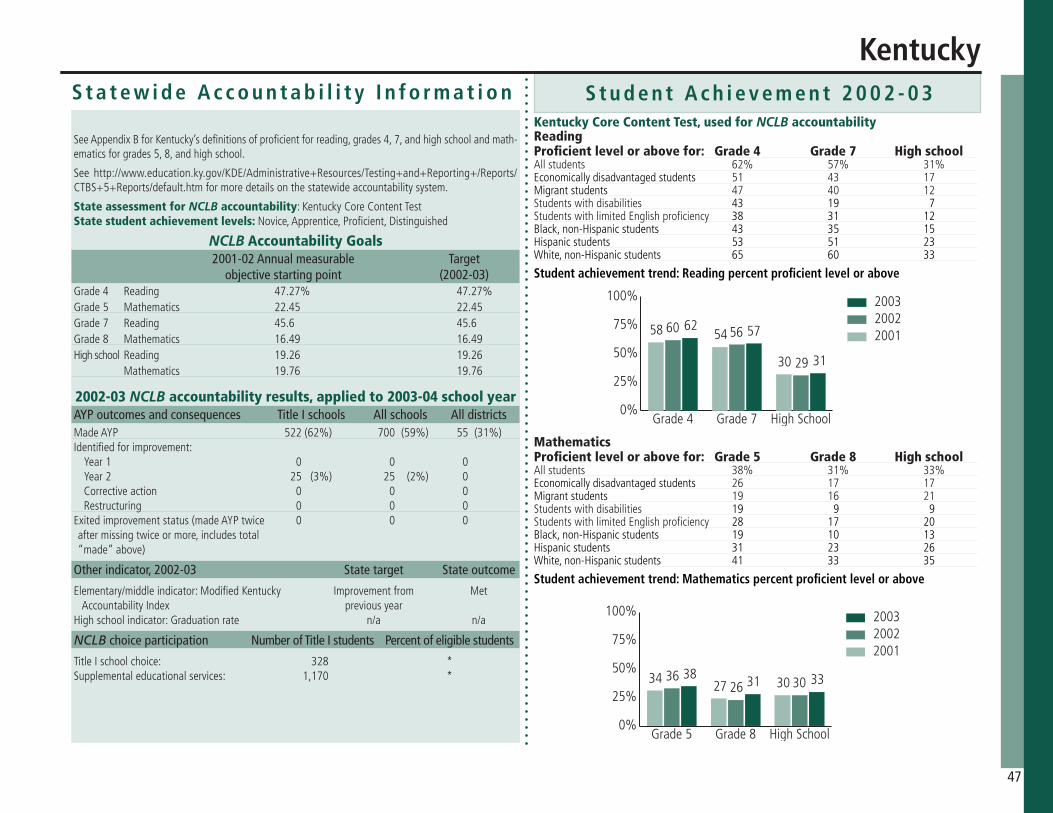
S t u d e n t A c h i e v e m e n t 2 0 0 2 - 0 3S t a t e w i d e A c c o u n t a b i l i t y I n f o r m a t i o n
SeeAppendixBforKentucky’sdefinitionsofproficientforreading,grades4,7,andhighschoolandmath-ematicsforgrades5,8,andhighschool.
See http://www.education.ky.gov/KDE/Administrative+Resources/Testing+and+Reporting+/Reports/CTBS+5+Reports/default.htmformoredetailsonthestatewideaccountabilitysystem.
State assessment for NCLB accountability:KentuckyCoreContentTestState student achievement levels: Novice,Apprentice,Proficient,Distinguished
NCLB Accountability Goals 2001-02 Annual measurable Target objective starting point (2002-03)Grade4 Reading 47.27% 47.27% Grade5 Mathematics 22.45 22.45Grade7 Reading 45.6 45.6Grade8 Mathematics 16.49 16.49 HighschoolReading 19.26 19.26 Mathematics 19.76 19.76
2002-03 NCLB accountability results, applied to 2003-04 school year AYP outcomes and consequences Title I schools All schools All districtsMadeAYP 522(62%) 700 (59%) 55 (31%)Identifiedforimprovement:
Year1 0 0 0Year2 25(3%) 25 (2%) 0Correctiveaction 0 0 0Restructuring 0 0 0
Exitedimprovementstatus(madeAYPtwice 0 0 0aftermissingtwiceormore,includestotal“made”above)
Other indicator, 2002-03 State target State outcome
Elementary/middleindicator:ModifiedKentucky Improvementfrom MetAccountabilityIndex previousyear Highschoolindicator:Graduationrate n/a n/a
NCLB choice participation Number of Title I students Percent of eligible students
TitleIschoolchoice: 328 *Supplementaleducationalservices: 1,170 *
ReadingProficient level or above for: Grade 4 Grade 7 High schoolAllstudents 62% 57% 31%Economicallydisadvantagedstudents 51 43 17Migrantstudents 47 40 12Studentswithdisabilities 43 19 7StudentswithlimitedEnglishproficiency 38 31 12Black,non-Hispanicstudents 43 35 15Hispanicstudents 53 51 23White,non-Hispanicstudents 65 60 33
Studentachievementtrend:Readingpercentproficientlevelorabove
0%
25%
50%
75%
100%
31
5762
29
5660
30
5458
200320022001
HighSchoolGrade7Grade4
Kentucky
Kentucky Core Content Test, used for NCLB accountability
47
MathematicsProficient level or above for: Grade 5 Grade 8 High schoolAllstudents 38% 31% 33%Economicallydisadvantagedstudents 26 17 17Migrantstudents 19 16 21Studentswithdisabilities 19 9 9StudentswithlimitedEnglishproficiency 28 17 20Black,non-Hispanicstudents 19 10 13Hispanicstudents 31 23 26White,non-Hispanicstudents 41 33 35
Studentachievementtrend:Mathematicspercentproficientlevelorabove
0%
25%
50%
75%
100%
3331383026
36 302734
200320022001
HighSchoolGrade8Grade5

Staff
Number of FTE 1993-94 2002-03teachers (CCD) Elementary Middle High Combined Other Total
Number of FTE non-teacher staff (CCD)
Instructionalaides Instructionalcoordinators Administrators Other Total
Percentage of teachers with a major in the main subject taught, grades 7-12 (SASS) 1994 2000 English Mathematics Science Socialstudies
Percentage of core courses taught by highly qualified teachers, 2002-03 (As defined and reported by states, collected by ED)
Students
Public school 1993-94 2002-03enrollment (CCD) Pre-K K-8 9-12 Total(K-12)
Race/ethnicity (CCD) AmericanIndian/AlaskanNative Asian/PacificIslander Black,non-Hispanic Hispanic White,non-Hispanic
Students with disabilities (OSEP)
Students with limited English proficiency (NCELA)
Migrant students (OME)
Eighth-grade students enrolled in 1996 2003Algebra I for high school credit (NAEP)
Students eligible to participate in the Free or Reduced- Price Lunch Program, 2002-03 (CCD) Outcomes
1993-94 2000-01High school dropout rate (NCES)
Avg. freshman graduation rate (NCES) College-going rate (IPEDS/NCES)
NAEP state results (NCES) Reading,Grade4 1994 2003 Proficientlevelorabove BasicleveloraboveMath,Grade8 1996 2003 Proficientlevelorabove Basiclevelorabove
Number of districts 1993-94 2002-03(CCD)
Number of public schools (CCD)
Elementary Middle High Combined Other Total
Number of charter schools (CCD)
Districts and schools
Number of schools, by percent of students eligible to participate in the Free or Reduced-Price Lunch Program, 2002-03 (CCD)
Sources of funding(CCD,2001-02)
Title I allocation 2001-02 (ED; Includes Title I, Part A)
Total current expenditures 1993-94 2001-02 (CCD,adjustedforinflationto2001-02,inthousands)
Instructional Noninstructional Support Total
Per-pupil expenditures (CCD,adjustedforinflationto2001-02)
KEY: * =Lessthan0.5percent — = NotapplicableK n/a = Notavailable # =Samplesizetoosmalltocalculate FTE =FullTimeEquivalent
Finances
22,730 23,805 9,316 9,484 10,891 11,728 3,224 3,597 752 1,449 46,913 50,062
9,431 11,372 492 1,348 3,316 2,919 33,041 36,632 46,280 52,271
65% 60% 63 58 57 45 67 60
12,857 21,856 546,168 513,138 202,283 192,873 748,451 706,011
* 1% 1% 1 45 48 1 2 52 49
9% 11%
1% 1%
1% 1%
14% 11%
443,102
5% 8% 61 64 53 59
15% 20% 40 49
7% 16% 38 57
66 68
758 804 272 285 220 248 102 161 3 24 1,355 1,522
20
Louisiana http://www.doe.state.la.us
$152,145,672
$2,518,505 $2,935,369 380,458 304,938 1,337,205 1,562,258 4,236,169 4,268,607
$5,291 $6,567
48
0-34%
35-49%
50-74%
75-100%
235
485
619
170
86%
78%
90%Low-poverty schools
High-poverty schools
All schools
Federal13%
State49%
Local38%
^
^13schoolsdidnotreport.

S t u d e n t A c h i e v e m e n t 2 0 0 2 - 0 3S t a t e w i d e A c c o u n t a b i l i t y I n f o r m a t i o n
SeeAppendixBforLouisiana’sdefinitionsofproficientforreadingandmathematicsforgrades4,8,andhighschool.
Seehttp://www.doe.state.la.us/lde/pair/1989.aspformoredetailsonthestatewideaccountabilitysystem.
State assessment for NCLB accountability:LouisianaEducationalAssessmentProgramState student achievement levels: Unsatisfactory,ApproachingBasic,Basic,Advanced,Mastery
NCLB Accountability Goals 2001-02 Annual measurable Target objective starting point (2002-03)Grade4 Reading 36.9% 36.9% Mathematics 30.1 30.1Grade8 Reading 36.9 36.9 Mathematics 30.1 30.1 HighschoolReading 36.9 36.9 Mathematics 30.1 30.1
2002-03 NCLB accountability results, applied to 2003-04 school year AYP outcomes and consequences Title I schools All schools All districtsMadeAYP 780 (83%) 1,162 (95%) 49 (72%)Identifiedforimprovement:
Year1 0 0 0Year2 0 0 0Correctiveaction 0 0 0Restructuring 0 0 0
Exitedimprovementstatus(madeAYPtwice 0 0 0aftermissingtwiceormore,includestotal“made”above)
Other indicator, 2002-03 State target State outcome
Elementary/middleindicator:Attendance 90% MetHighschoolindicator:Non-dropoutrate 90% Met
NCLB choice participation Number of Title I students Percent of eligible students
TitleIschoolchoice: n/a n/aSupplementaleducationalservices: n/a n/a
ReadingProficient level or above for: Grade 4 Grade 8 High schoolAllstudents 61% 55% 53%Economicallydisadvantagedstudents 52 42 38Migrantstudents 51 45 42Studentswithdisabilities 30 14 8StudentswithlimitedEnglishproficiency 56 36 31Black,non-Hispanicstudents 47 35 33Hispanicstudents 68 57 49White,non-Hispanicstudents 75 71 68
Studentachievementtrend:Readingpercentproficientlevelorabove
0%
25%
50%
75%
100%
5355615248
57 565159
200320022001
HighSchoolGrade8Grade4
Louisiana
Louisiana Educational Assessment Program, used for NCLB accountability
49
MathematicsProficient level or above for: Grade 4 Grade 8 High schoolAllstudents 60% 52% 59%Economicallydisadvantagedstudents 51 39 45Migrantstudents 56 53 59Studentswithdisabilities 35 18 16StudentswithlimitedEnglishproficiency 61 47 53Black,non-Hispanicstudents 43 32 38Hispanicstudents 68 54 57White,non-Hispanicstudents 76 70 75
Studentachievementtrend:Mathematicspercentproficientlevelorabove
0%
25%
50%
75%
100%
595260
474150 5146
54
200320022001
HighSchoolGrade8Grade4
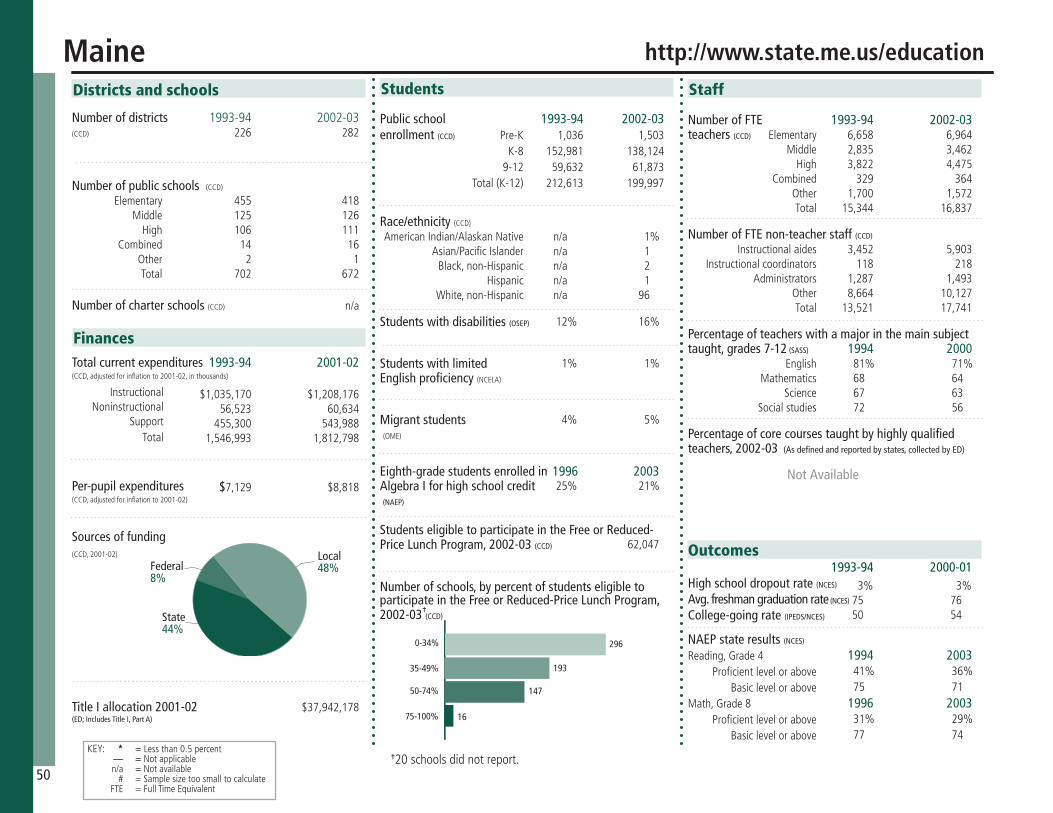
Staff
Number of FTE 1993-94 2002-03teachers (CCD) Elementary Middle High Combined Other Total
Number of FTE non-teacher staff (CCD)
Instructionalaides Instructionalcoordinators Administrators Other Total
Percentage of teachers with a major in the main subject taught, grades 7-12 (SASS) 1994 2000 English Mathematics Science Socialstudies
Percentage of core courses taught by highly qualified teachers, 2002-03 (As defined and reported by states, collected by ED)
Students
Public school 1993-94 2002-03enrollment (CCD) Pre-K K-8 9-12 Total(K-12)
Race/ethnicity (CCD) AmericanIndian/AlaskanNative Asian/PacificIslander Black,non-Hispanic Hispanic White,non-Hispanic
Students with disabilities (OSEP)
Students with limited English proficiency (NCELA)
Migrant students (OME)
Eighth-grade students enrolled in 1996 2003Algebra I for high school credit (NAEP)
Students eligible to participate in the Free or Reduced- Price Lunch Program, 2002-03 (CCD) Outcomes
1993-94 2000-01High school dropout rate (NCES)
Avg. freshman graduation rate (NCES) College-going rate (IPEDS/NCES)
NAEP state results (NCES) Reading,Grade4 1994 2003 Proficientlevelorabove BasicleveloraboveMath,Grade8 1996 2003 Proficientlevelorabove Basiclevelorabove
Number of districts 1993-94 2002-03(CCD)
Number of public schools (CCD)
Elementary Middle High Combined Other Total
Number of charter schools (CCD)
Districts and schools
Number of schools, by percent of students eligible to participate in the Free or Reduced-Price Lunch Program, 2002-03 (CCD)
Sources of funding(CCD,2001-02)
Title I allocation 2001-02 (ED; Includes Title I, Part A)
Total current expenditures 1993-94 2001-02 (CCD,adjustedforinflationto2001-02,inthousands)
Instructional Noninstructional Support Total
Per-pupil expenditures (CCD,adjustedforinflationto2001-02)
KEY: * =Lessthan0.5percent — = NotapplicableK n/a = Notavailable # =Samplesizetoosmalltocalculate FTE =FullTimeEquivalent
Finances
6,658 6,964 2,835 3,462 3,822 4,475 329 364 1,700 1,572 15,344 16,837
3,452 5,903 118 218 1,287 1,493 8,664 10,127 13,521 17,741
81% 71% 68 64 67 63 72 56
1,036 1,503 152,981 138,124 59,632 61,873 212,613 199,997
n/a 1% n/a 1 n/a 2 n/a 1 n/a 96
12% 16%
1% 1%
4% 5%
25% 21%
62,047
3% 3% 75 76 50 54
41% 36% 75 71
31% 29% 77 74
226 282
455 418 125 126 106 111 14 16 2 1 702 672
n/a
Maine http://www.state.me.us/education
$37,942,178
$1,035,170 $1,208,176 56,523 60,634 455,300 543,988 1,546,993 1,812,798
$7,129 $8,818
50
0-34%
35-49%
50-74%
75-100%
193
147
16
296
Not Available
Federal8%
State44%
Local48%
^
^20schoolsdidnotreport.
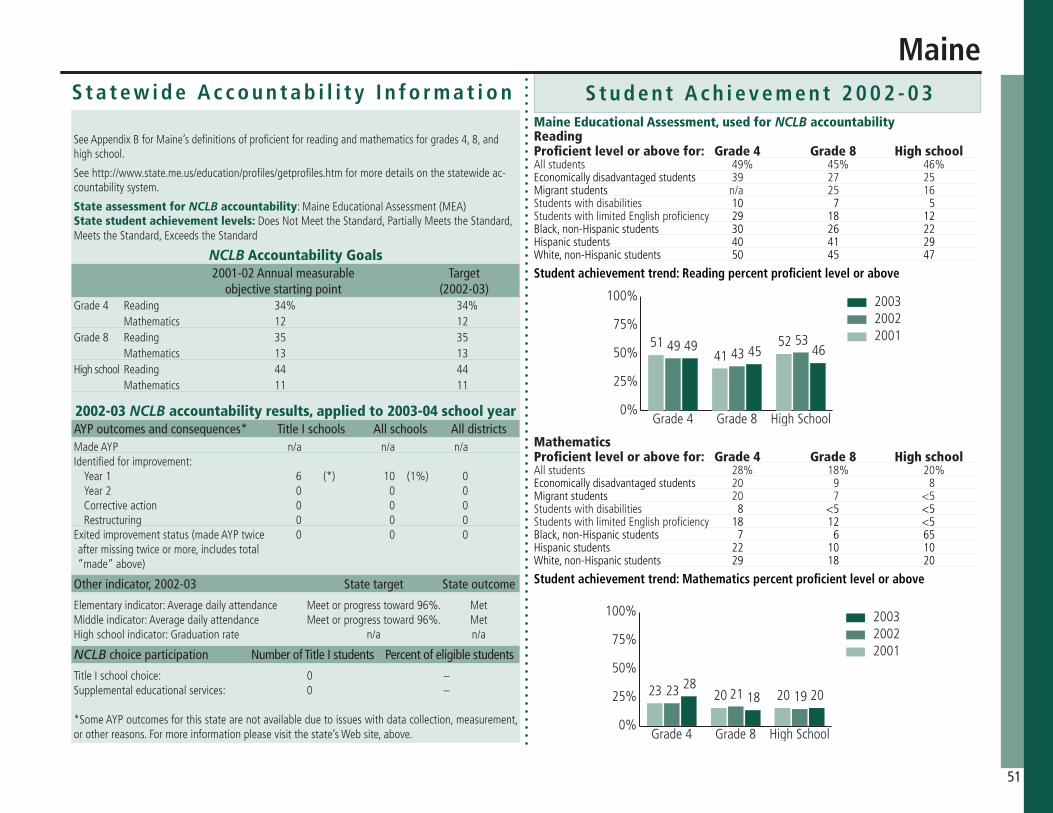
S t u d e n t A c h i e v e m e n t 2 0 0 2 - 0 3S t a t e w i d e A c c o u n t a b i l i t y I n f o r m a t i o n
SeeAppendixBforMaine’sdefinitionsofproficientforreadingandmathematicsforgrades4,8,andhighschool.
Seehttp://www.state.me.us/education/profiles/getprofiles.htmformoredetailsonthestatewideac-countabilitysystem.
State assessment for NCLB accountability:MaineEducationalAssessment(MEA)State student achievement levels: DoesNotMeettheStandard,PartiallyMeetstheStandard,MeetstheStandard,ExceedstheStandard
NCLB Accountability Goals 2001-02 Annual measurable Target objective starting point (2002-03)Grade4 Reading 34% 34% Mathematics 12 12Grade8 Reading 35 35 Mathematics 13 13 HighschoolReading 44 44 Mathematics 11 11
2002-03 NCLB accountability results, applied to 2003-04 school year AYP outcomes and consequences* Title I schools All schools All districtsMadeAYP n/a n/a n/aIdentifiedforimprovement:
Year1 6 (*) 10 (1%) 0Year2 0 0 0Correctiveaction 0 0 0Restructuring 0 0 0
Exitedimprovementstatus(madeAYPtwice 0 0 0aftermissingtwiceormore,includestotal“made”above)
Other indicator, 2002-03 State target State outcome
Elementaryindicator:Averagedailyattendance Meetorprogresstoward96%. MetMiddleindicator:Averagedailyattendance Meetorprogresstoward96%. MetHighschoolindicator:Graduationrate n/a n/a
NCLB choice participation Number of Title I students Percent of eligible students
TitleIschoolchoice: 0 –Supplementaleducationalservices: 0 –
*SomeAYPoutcomesforthisstatearenotavailableduetoissueswithdatacollection,measurement,orotherreasons.Formoreinformationpleasevisitthestate’sWebsite,above.
ReadingProficient level or above for: Grade 4 Grade 8 High schoolAllstudents 49% 45% 46%Economicallydisadvantagedstudents 39 27 25Migrantstudents n/a 25 16Studentswithdisabilities 10 7 5StudentswithlimitedEnglishproficiency 29 18 12Black,non-Hispanicstudents 30 26 22Hispanicstudents 40 41 29White,non-Hispanicstudents 50 45 47
Studentachievementtrend:Readingpercentproficientlevelorabove
0%
25%
50%
75%
100%
464549 534349 52
4151
200320022001
HighSchoolGrade8Grade4
Maine
Maine Educational Assessment, used for NCLB accountability
51
MathematicsProficient level or above for: Grade 4 Grade 8 High schoolAllstudents 28% 18% 20%Economicallydisadvantagedstudents 20 9 8Migrantstudents 20 7 <5Studentswithdisabilities 8 <5 <5StudentswithlimitedEnglishproficiency 18 12 <5Black,non-Hispanicstudents 7 6 65Hispanicstudents 22 10 10White,non-Hispanicstudents 29 18 20
Studentachievementtrend:Mathematicspercentproficientlevelorabove
0%
25%
50%
75%
100%
201828
192123 202023
200320022001
HighSchoolGrade8Grade4

Staff
Number of FTE 1993-94 2002-03teachers (CCD) Elementary Middle High Combined Other Total
Number of FTE non-teacher staff (CCD)
Instructionalaides Instructionalcoordinators Administrators Other Total
Percentage of teachers with a major in the main subject taught, grades 7-12 (SASS) 1994 2000 English Mathematics Science Socialstudies
Percentage of core courses taught by highly qualified teachers, 2002-03 (As defined and reported by states, collected by ED)
Students
Public school 1993-94 2002-03enrollment (CCD) Pre-K K-8 9-12 Total(K-12)
Race/ethnicity (CCD) AmericanIndian/AlaskanNative Asian/PacificIslander Black,non-Hispanic Hispanic White,non-Hispanic
Students with disabilities (OSEP)
Students with limited English proficiency (NCELA)
Migrant students (OME)
Eighth-grade students enrolled in 1996 2003Algebra I for high school credit (NAEP)
Students eligible to participate in the Free or Reduced- Price Lunch Program, 2002-03 (CCD) Outcomes
1993-94 2000-01High school dropout rate (NCES)
Avg. freshman graduation rate (NCES) College-going rate (IPEDS/NCES)
NAEP state results (NCES) Reading,Grade4 1994 2003 Proficientlevelorabove BasicleveloraboveMath,Grade8 1996 2003 Proficientlevelorabove Basiclevelorabove
Number of districts 1993-94 2002-03(CCD)
Number of public schools (CCD)
Elementary Middle High Combined Other Total
Number of charter schools (CCD)
Districts and schools
Number of schools, by percent of students eligible to participate in the Free or Reduced-Price Lunch Program, 2002-03 (CCD)
Sources of funding(CCD,2001-02)
Title I allocation 2001-02 (ED; Includes Title I, Part A)
Total current expenditures 1993-94 2001-02 (CCD,adjustedforinflationto2001-02,inthousands)
Instructional Noninstructional Support Total
Per-pupil expenditures (CCD,adjustedforinflationto2001-02)
KEY: * =Lessthan0.5percent — = NotapplicableK n/a = Notavailable # =Samplesizetoosmalltocalculate FTE =FullTimeEquivalent
Finances
21,532 26,487 9,507 11,896 10,733 14,104 295 638 2,104 2,258 44,171 55,382
7,277 9,726 669 948 3,155 3,963 27,481 32,623 38,582 47,260
86% 71% 73 68 86 84 92 91
17,984 20,397 544,839 587,066 197,072 253,506 741,911 840,572
* * 4% 5% 34 37 3 6 59 52
10% 10%
2% 3%
* *
41% 32%
265,989
5% 4% 79 79 55 55
26% 32% 55 62
24% 30% 57 67
24 24
799 862 209 241 158 205 7 23 2 28 1,175 1,359
n/a
Maryland http://www.msde.state.md.us
$153,983,710
$3,700,987 $4,653,921 310,379 355,058 2,111,805 2,471,745 6,123,170 7,480,724
$7,926 $8,692
52
0-34%
35-49%
50-74%
75-100%
205
245
155
730
65%
47%
76%Low-poverty schools
High-poverty schools
All schools
Federal6%
State37%
Local56%
^
^24schoolsdidnotreport.
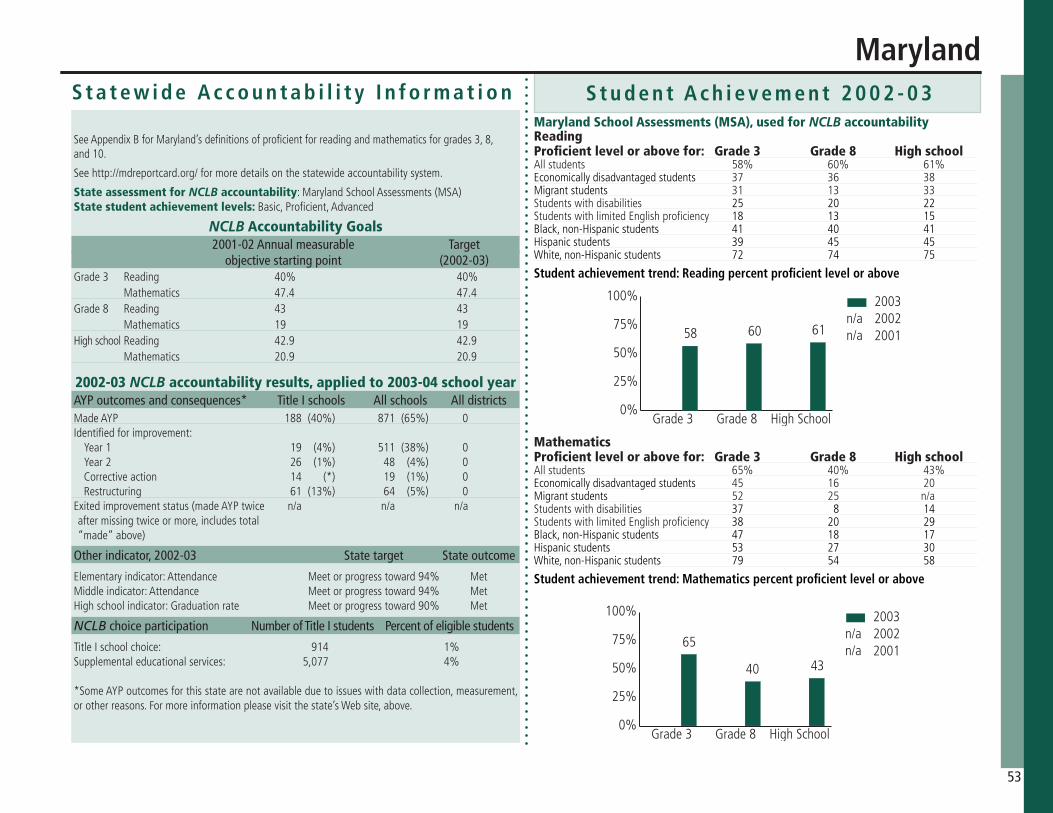
S t u d e n t A c h i e v e m e n t 2 0 0 2 - 0 3S t a t e w i d e A c c o u n t a b i l i t y I n f o r m a t i o n
SeeAppendixBforMaryland’sdefinitionsofproficientforreadingandmathematicsforgrades3,8,and10.
Seehttp://mdreportcard.org/formoredetailsonthestatewideaccountabilitysystem.
State assessment for NCLB accountability:MarylandSchoolAssessments(MSA)State student achievement levels: Basic,Proficient,Advanced
NCLB Accountability Goals 2001-02 Annual measurable Target objective starting point (2002-03)Grade3 Reading 40% 40% Mathematics 47.4 47.4Grade8 Reading 43 43 Mathematics 19 19 HighschoolReading 42.9 42.9 Mathematics 20.9 20.9
2002-03 NCLB accountability results, applied to 2003-04 school year AYP outcomes and consequences* Title I schools All schools All districtsMadeAYP 188(40%) 871(65%) 0Identifiedforimprovement:
Year1 19 (4%) 511(38%) 0Year2 26 (1%) 48 (4%) 0Correctiveaction 14 (*) 19 (1%) 0Restructuring 61(13%) 64 (5%) 0
Exitedimprovementstatus(madeAYPtwice n/a n/a n/aaftermissingtwiceormore,includestotal“made”above)
Other indicator, 2002-03 State target State outcome
Elementaryindicator:Attendance Meetorprogresstoward94% MetMiddleindicator:Attendance Meetorprogresstoward94% MetHighschoolindicator:Graduationrate Meetorprogresstoward90% Met
NCLB choice participation Number of Title I students Percent of eligible students
TitleIschoolchoice: 914 1%Supplementaleducationalservices: 5,077 4%
*SomeAYPoutcomesforthisstatearenotavailableduetoissueswithdatacollection,measurement,orotherreasons.Formoreinformationpleasevisitthestate’sWebsite,above.
ReadingProficient level or above for: Grade 3 Grade 8 High schoolAllstudents 58% 60% 61%Economicallydisadvantagedstudents 37 36 38Migrantstudents 31 13 33Studentswithdisabilities 25 20 22StudentswithlimitedEnglishproficiency 18 13 15Black,non-Hispanicstudents 41 40 41Hispanicstudents 39 45 45White,non-Hispanicstudents 72 74 75
Studentachievementtrend:Readingpercentproficientlevelorabove
0%
25%
50%
75%
100%
616058
200320022001
HighSchoolGrade8Grade3
n/an/a
Maryland
Maryland School Assessments (MSA), used for NCLB accountability
53
MathematicsProficient level or above for: Grade 3 Grade 8 High schoolAllstudents 65% 40% 43%Economicallydisadvantagedstudents 45 16 20Migrantstudents 52 25 n/aStudentswithdisabilities 37 8 14StudentswithlimitedEnglishproficiency 38 20 29Black,non-Hispanicstudents 47 18 17Hispanicstudents 53 27 30White,non-Hispanicstudents 79 54 58
Studentachievementtrend:Mathematicspercentproficientlevelorabove
0%
25%
50%
75%
100%
4340
65
200320022001
HighSchoolGrade8Grade3
n/an/a
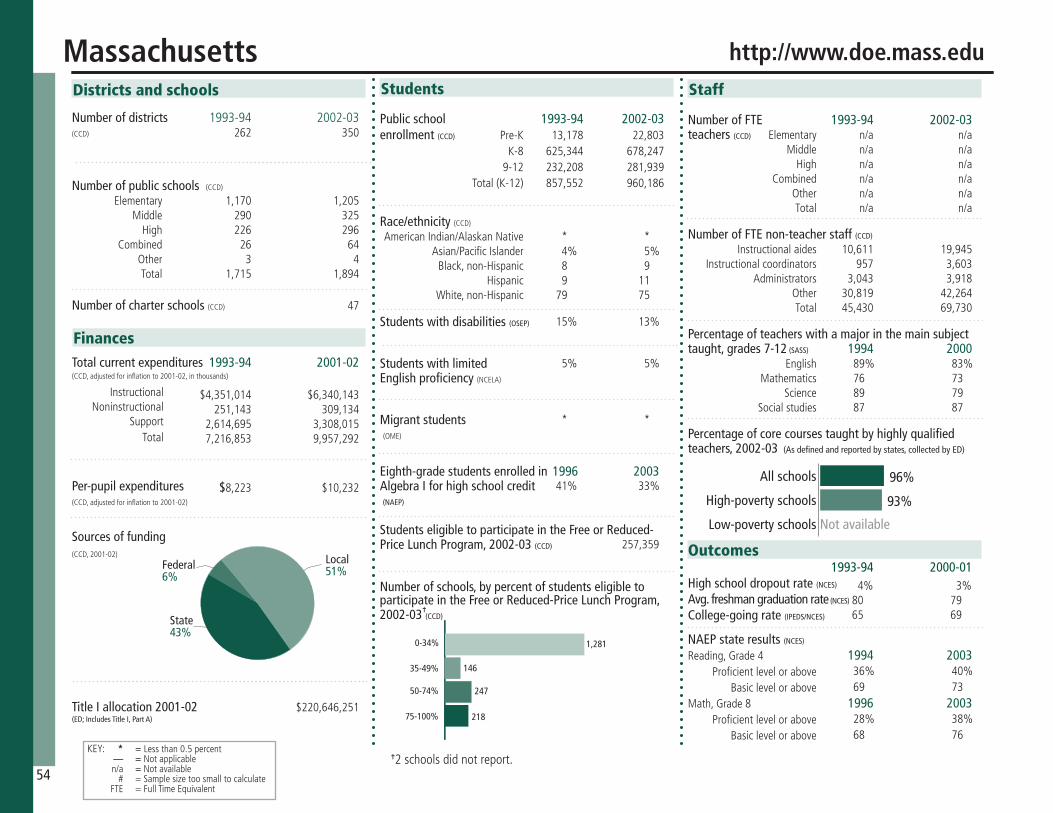
Staff
Number of FTE 1993-94 2002-03teachers (CCD) Elementary Middle High Combined Other Total
Number of FTE non-teacher staff (CCD)
Instructionalaides Instructionalcoordinators Administrators Other Total
Percentage of teachers with a major in the main subject taught, grades 7-12 (SASS) 1994 2000 English Mathematics Science Socialstudies
Percentage of core courses taught by highly qualified teachers, 2002-03 (As defined and reported by states, collected by ED)
Students
Public school 1993-94 2002-03enrollment (CCD) Pre-K K-8 9-12 Total(K-12)
Race/ethnicity (CCD) AmericanIndian/AlaskanNative Asian/PacificIslander Black,non-Hispanic Hispanic White,non-Hispanic
Students with disabilities (OSEP)
Students with limited English proficiency (NCELA)
Migrant students (OME)
Eighth-grade students enrolled in 1996 2003Algebra I for high school credit (NAEP)
Students eligible to participate in the Free or Reduced- Price Lunch Program, 2002-03 (CCD) Outcomes
1993-94 2000-01High school dropout rate (NCES)
Avg. freshman graduation rate (NCES) College-going rate (IPEDS/NCES)
NAEP state results (NCES) Reading,Grade4 1994 2003 Proficientlevelorabove BasicleveloraboveMath,Grade8 1996 2003 Proficientlevelorabove Basiclevelorabove
Number of districts 1993-94 2002-03(CCD)
Number of public schools (CCD)
Elementary Middle High Combined Other Total
Number of charter schools (CCD)
Districts and schools
Number of schools, by percent of students eligible to participate in the Free or Reduced-Price Lunch Program, 2002-03 (CCD)
Sources of funding(CCD,2001-02)
Title I allocation 2001-02 (ED; Includes Title I, Part A)
Total current expenditures 1993-94 2001-02 (CCD,adjustedforinflationto2001-02,inthousands)
Instructional Noninstructional Support Total
Per-pupil expenditures (CCD,adjustedforinflationto2001-02)
KEY: * =Lessthan0.5percent — = NotapplicableK n/a = Notavailable # =Samplesizetoosmalltocalculate FTE =FullTimeEquivalent
Finances
n/a n/a n/a n/a n/a n/a n/a n/a n/a n/a n/a n/a
10,611 19,945 957 3,603 3,043 3,918 30,819 42,264 45,430 69,730
89% 83% 76 73 89 79 87 87
13,178 22,803 625,344 678,247 232,208 281,939 857,552 960,186
* * 4% 5% 8 9 9 11 79 75
15% 13%
5% 5%
* *
41% 33%
257,359
4% 3% 80 79 65 69
36% 40% 69 73
28% 38% 68 76
262 350
1,170 1,205 290 325 226 296 26 64 3 4 1,715 1,894
47
Massachusetts http://www.doe.mass.edu
$220,646,251
$4,351,014 $6,340,143 251,143 309,134 2,614,695 3,308,015 7,216,853 9,957,292
$8,223 $10,232
54
0-34%
35-49%
50-74%
75-100%
146
247
218
1,281
Federal6%
State43%
Local51%
^
^2schoolsdidnotreport.
96%
93%
Low-poverty schools
High-poverty schools
All schools
Not available

S t u d e n t A c h i e v e m e n t 2 0 0 2 - 0 3S t a t e w i d e A c c o u n t a b i l i t y I n f o r m a t i o n
SeeAppendixBforMassachusetts’sdefinitionsofproficientforEnglishLanguageArtsingrades4,7,and10andmathematicsforgradesingrades4,8,and10.
Seehttp://profiles.doe.mass.edu/staterc/formoredetailsonthestatewideaccountabilitysystem.
State assessment for NCLB accountability:MassachusettsComprehensiveAssessmentSystemState student achievement levels: Failing(Highschool)/Warning(Elementary),NeedsIm-provement,Proficient,Advanced
NCLB Accountability Goals 2001-02 Annual measurable Target objective starting point (2002-03)Grade4 EnglishLanguageArts 70.7CPI 75CPI Mathematics 53.0 60.8Grade7 EnglishLanguageArts 70.7 75Grade8 Mathematics 53.0 60.8 HighschoolEnglishLanguageArts 70.7 75 Mathematics 53.0 60.8
2002-03 NCLB accountability results, applied to 2003-04 school year AYP outcomes and consequences* Title I schools All schools All districtsMadeAYP n/a 937(50%) 79(23%)Identifiedforimprovement:
Year1 n/a 256(14%) 0Year2 n/a 170 (9%) 0Correctiveaction n/a 38 (2%) 0Restructuring n/a 0 0
Exitedimprovementstatus(madeAYPtwice n/a n/a n/aaftermissingtwiceormore,includestotal“made”above)
Other indicator, 2002-03 State target State outcome
Elementaryindicator:Attendance 92% MetMiddleindicator:Attendance 92% MetHighschoolindicator:Competencydetermination 70% Met
NCLB choice participation Number of Title I students Percent of eligible students
TitleIschoolchoice: 554 *Supplementaleducationalservices: 6,589 3%
*SomeAYPoutcomesforthisstatearenotavailableduetoissueswithdatacollection,measurement,orotherreasons.Formoreinformationpleasevisitthestate’sWebsite,above.
English or Language ArtsProficient level or above for: Grade 4 Grade 7 High schoolAllstudents 56% 66% 61%Economicallydisadvantagedstudents 30 37 31Migrantstudents 25 16 23Studentswithdisabilities 26 29 26StudentswithlimitedEnglishproficiency 16 19 12Black,non-Hispanicstudents 30 39 35Hispanicstudents 26 31 26White,non-Hispanicstudents 65 75 69
Studentachievementtrend:Englishorlanguageartspercentproficientlevelorabove
0%
25%
50%
75%
100%
616656 5964
54 5167
51
200320022001
HighSchoolGrade7Grade4
Massachusetts
Massachusetts Comprehensive Assessment System, used for NCLB accountability
55
MathematicsProficient level or above for: Grade 4 Grade 8 High schoolAllstudents 40% 37% 51%Economicallydisadvantagedstudents 18 13 27Migrantstudents 17 9 17Studentswithdisabilities 18 8 21StudentswithlimitedEnglishproficiency 14 11 27Black,non-Hispanicstudents 15 11 24Hispanicstudents 15 11 21White,non-Hispanicstudents 48 44 58
Studentachievementtrend:Mathematicspercentproficientlevelorabove
0%
25%
50%
75%
100%
513740 44
3439 453434
200320022001
HighSchoolGrade7Grade4
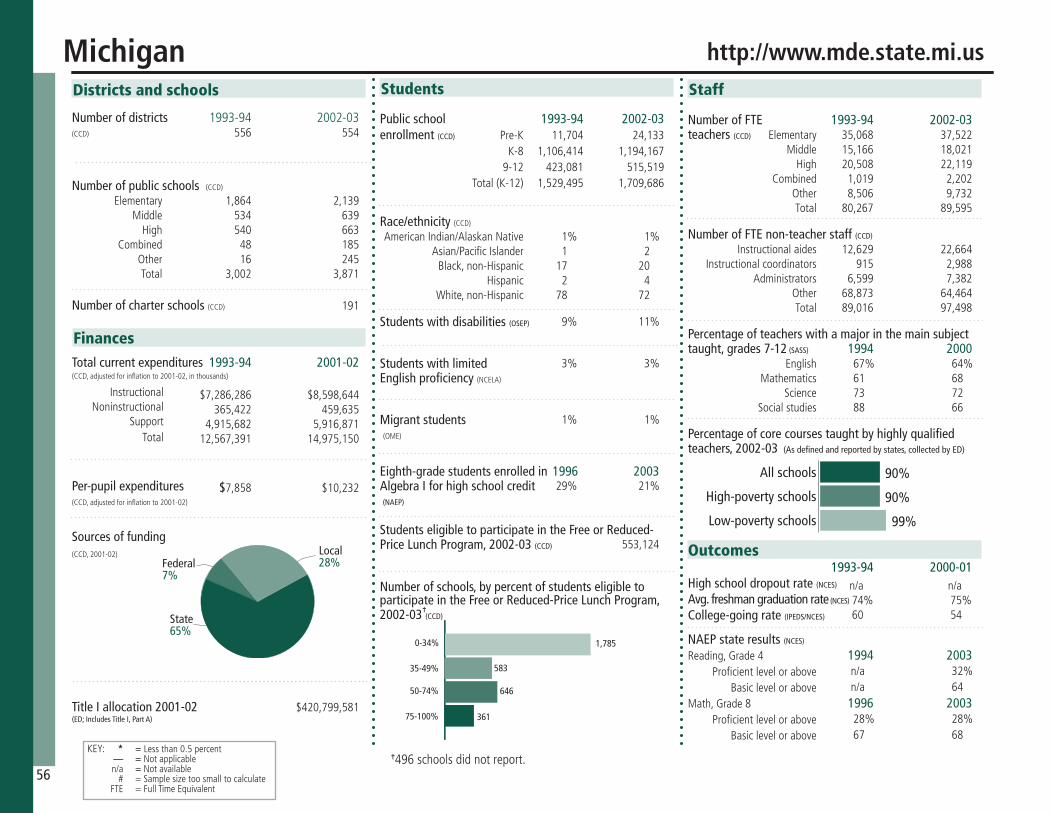
Staff
Number of FTE 1993-94 2002-03teachers (CCD) Elementary Middle High Combined Other Total
Number of FTE non-teacher staff (CCD)
Instructionalaides Instructionalcoordinators Administrators Other Total
Percentage of teachers with a major in the main subject taught, grades 7-12 (SASS) 1994 2000 English Mathematics Science Socialstudies
Percentage of core courses taught by highly qualified teachers, 2002-03 (As defined and reported by states, collected by ED)
Students
Public school 1993-94 2002-03enrollment (CCD) Pre-K K-8 9-12 Total(K-12)
Race/ethnicity (CCD) AmericanIndian/AlaskanNative Asian/PacificIslander Black,non-Hispanic Hispanic White,non-Hispanic
Students with disabilities (OSEP)
Students with limited English proficiency (NCELA)
Migrant students (OME)
Eighth-grade students enrolled in 1996 2003Algebra I for high school credit (NAEP)
Students eligible to participate in the Free or Reduced- Price Lunch Program, 2002-03 (CCD) Outcomes
1993-94 2000-01High school dropout rate (NCES)
Avg. freshman graduation rate (NCES) College-going rate (IPEDS/NCES)
NAEP state results (NCES) Reading,Grade4 1994 2003 Proficientlevelorabove BasicleveloraboveMath,Grade8 1996 2003 Proficientlevelorabove Basiclevelorabove
Number of districts 1993-94 2002-03(CCD)
Number of public schools (CCD)
Elementary Middle High Combined Other Total
Number of charter schools (CCD)
Districts and schools
Number of schools, by percent of students eligible to participate in the Free or Reduced-Price Lunch Program, 2002-03 (CCD)
Sources of funding(CCD,2001-02)
Title I allocation 2001-02 (ED; Includes Title I, Part A)
Total current expenditures 1993-94 2001-02 (CCD,adjustedforinflationto2001-02,inthousands)
Instructional Noninstructional Support Total
Per-pupil expenditures (CCD,adjustedforinflationto2001-02)
KEY: * =Lessthan0.5percent — = NotapplicableK n/a = Notavailable # =Samplesizetoosmalltocalculate FTE =FullTimeEquivalent
Finances
$7,286,286 $8,598,644 365,422 459,635 4,915,682 5,916,871 12,567,391 14,975,150
$7,858 $10,232
35,068 37,522 15,166 18,021 20,508 22,119 1,019 2,202 8,506 9,732 80,267 89,595
12,629 22,664 915 2,988 6,599 7,382 68,873 64,464 89,016 97,498
67% 64% 61 68 73 72 88 66
11,704 24,133 1,106,414 1,194,167 423,081 515,519 1,529,495 1,709,686
1% 1% 1 2 17 20 2 4 78 72
9% 11%
3% 3%
1% 1%
29% 21%
553,124
n/a n/a 74% 75% 60 54
n/a 32% n/a 64
28% 28% 67 68
556 554
1,864 2,139 534 639 540 663 48 185 16 245 3,002 3,871
191
Michigan http://www.mde.state.mi.us
$420,799,581
56
0-34%
35-49%
50-74%
75-100%
583
646
361
1,785
90%
90%
99%Low-poverty schools
High-poverty schools
All schools
Local28%Federal
7%
State65%
^
^496schoolsdidnotreport.

S t u d e n t A c h i e v e m e n t 2 0 0 2 - 0 3S t a t e w i d e A c c o u n t a b i l i t y I n f o r m a t i o n
SeeAppendixBforMichigan’sdefinitionsofproficientforreading/languageartsandmathematicsforgrades4,8,andhighschool.
Seehttp://www.michigan.gov/documents/State_Report_Card_2003-04_120358_7.docformoredetailsonthestatewideaccountabilitysystem.
State assessment for NCLB accountability:MichiganEducationalAssessmentProgramState student achievement levels: BelowBasic,Basic,MetExpectations,ExceedsExpectations
NCLB Accountability Goals 2001-02 Annual measurable Target objective starting point (2002-03)Grade4 Reading/languagearts 38% 38% Mathematics 47 47Grade7 Reading/languagearts 31 31Grade8 Mathematics 31 31 HighschoolReading/languagearts 42 42 Mathematics 33 33
2002-03 NCLB accountability results, applied to 2003-04 school year AYP outcomes and consequences Title I schools All schools All districtsMadeAYP 2,090(39%) 3,168(89%) n/aIdentifiedforimprovement:
Year1 35 (1%) 54 (2%) 0Year2 79 (2%) 120 (3%) 0Correctiveaction 65 (1%) 99 (3%) 0Restructuring 66 (1%) 101 (3%) 0
Exitedimprovementstatus(madeAYPtwice 289 (5%) 438(12%) 0aftermissingtwiceormore,includestotal“made”above)
Other indicator, 2002-03 State target State outcome
Elementaryindicator:Attendance Meetorprogresstoward80% MetMiddleindicator:Attendance Meetorprogresstoward80% MetHighschoolindicator:Graduationrate 80% Met
NCLB choice participation Number of Title I students Percent of eligible students
TitleIschoolchoice: 370 *Supplementaleducationalservices: 11,444 2%
Reading or language artsProficient level or above for: Grade 4 Grade 7 High schoolAllstudents 66% 59% 64%Economicallydisadvantagedstudents 46 37 42Migrantstudents 54 29 22Studentswithdisabilities 53 42 26StudentswithlimitedEnglishproficiency 40 20 25Black,non-Hispanicstudents 42 34 41Hispanicstudents 49 45 51White,non-Hispanicstudents 67 67 69
Studentachievementtrend:Readingorlanguageartspercentproficientlevelorabove
0%
25%
50%
75%
100%
645966 71
5157
200320022001
HighSchoolGrade7Grade4
n/a
Michigan
Michigan Educational Assessment Program, used for NCLB accountability
57
MathematicsProficient level or above for: Grade 4 Grade 8 High schoolAllstudents 66% 54% 56%Economicallydisadvantagedstudents 51 33 20Migrantstudents 47 22 <5Studentswithdisabilities 55 37 14StudentswithlimitedEnglishproficiency 51 30 29Black,non-Hispanicstudents 45 26 17Hispanicstudents 52 35 30White,non-Hispanicstudents 73 61 58
Studentachievementtrend:Mathematicspercentproficientlevelorabove
0%
25%
50%
75%
100%
565466 67
5365
200320022001
HighSchoolGrade8Grade4
n/a

Staff
Number of FTE 1993-94 2002-03teachers (CCD) Elementary Middle High Combined Other Total
Number of FTE non-teacher staff (CCD)
Instructionalaides Instructionalcoordinators Administrators Other Total
Percentage of teachers with a major in the main subject taught, grades 7-12 (SASS) 1994 2000 English Mathematics Science Socialstudies
Percentage of core courses taught by highly qualified teachers, 2002-03 (As defined and reported by states, collected by ED)
Students
Public school 1993-94 2002-03enrollment (CCD) Pre-K K-8 9-12 Total(K-12)
Race/ethnicity (CCD) AmericanIndian/AlaskanNative Asian/PacificIslander Black,non-Hispanic Hispanic White,non-Hispanic
Students with disabilities (OSEP)
Students with limited English proficiency (NCELA)
Migrant students (OME)
Eighth-grade students enrolled in 1996 2003Algebra I for high school credit (NAEP)
Students eligible to participate in the Free or Reduced- Price Lunch Program, 2002-03 (CCD) Outcomes
1993-94 2000-01High school dropout rate (NCES)
Avg. freshman graduation rate (NCES) College-going rate (IPEDS/NCES)
NAEP state results (NCES) Reading,Grade4 1994 2003 Proficientlevelorabove BasicleveloraboveMath,Grade8 1996 2003 Proficientlevelorabove Basiclevelorabove
Number of districts 1993-94 2002-03(CCD)
Number of public schools (CCD)
Elementary Middle High Combined Other Total
Number of charter schools (CCD)
Districts and schools
Number of schools, by percent of students eligible to participate in the Free or Reduced-Price Lunch Program, 2002-03 (CCD)
Sources of funding(CCD,2001-02)
Title I allocation 2001-02 (ED; Includes Title I, Part A)
Total current expenditures 1993-94 2001-02 (CCD,adjustedforinflationto2001-02,inthousands)
Instructional Noninstructional Support Total
Per-pupil expenditures (CCD,adjustedforinflationto2001-02)
KEY: * =Lessthan0.5percent — = NotapplicableK n/a = Notavailable # =Samplesizetoosmalltocalculate FTE =FullTimeEquivalent
Finances
21,654 24,061 7,969 9,584 12,690 16,025 355 1,501 4,288 1,636 46,956 52,808
6,089 14,758 487 439 2,872 3,220 18,455 34,086 27,903 52,503
84% 92% 94 90 97 93 89 94
6,656 10,037 570,324 557,664 233,253 279,190 803,577 836,854
2% 2% 4 5 4 7 2 4 89 81
9% 11%
3% 6%
1% 1%
34% 22%
231,450
5% 4% 89 84 53 64
33% 37% 65 69
34% 44% 75 82
400 417
888 1,024 220 290 371 646 15 207 3 15 1,497 2,182
89
Minnesota http://www.educ.state.mn.us
$112,964,619
$3,530,240 $4,192,253 224,024 281,475 1,786,512 2,112,832 5,540,775 6,586,560
$6,839 $7,736
58
0-34%
35-49%
50-74%
75-100%
379
241
195
1,323
96%
94%
97%Low-poverty schools
High-poverty schools
All schools
Local33%Federal
6%
State61%
^
^44schoolsdidnotreport.

S t u d e n t A c h i e v e m e n t 2 0 0 2 - 0 3S t a t e w i d e A c c o u n t a b i l i t y I n f o r m a t i o n
SeeAppendixBforMinnesota’sdefinitionsofproficientforreadingandmathematicsforgrade3.
Seehttp://education.state.mn.us/html/intro_sch_dist_data.htmformoredetailsonthestatewideaccountabilitysystem.
State assessment for NCLB accountability:MinnesotaComprehensiveAssessments(MCAs)State student achievement levels: Level1,Level2,Level3,Level4,Level5
NCLB Accountability Goals 2001-02 Annual measurable Target objective starting point (2002-03)Grade3 Reading 62.9% 62.9% Mathematics 65.4 65.4Grade Reading Mathematics Grade Reading Mathematics
2002-03 NCLB accountability results, applied to 2003-04 school year AYP outcomes and consequences Title I schools All schools All districtsMadeAYP 824(90%) 1,692(92%) 361(89%)Identifiedforimprovement:
Year1 23 (3%) 23 (1%) 0Year2 15 (2%) 15 (1%) 0Correctiveaction 0 0 0Restructuring 0 0 0
Exitedimprovementstatus(madeAYPtwice 30 (3%) 30 (2%) 0aftermissingtwiceormore,includestotal“made”above)
Other indicator, 2002-03 State target State outcome
Elementaryindicator:Attendance Meetorprogresstoward94.5% MetMiddleindicator:Attendance Meetorprogresstoward94.5% MetHighschoolindicator:Graduationrate Meetorgrowthtowards87.4% Met
NCLB choice participation Number of Title I students Percent of eligible students
TitleIschoolchoice: 306 *Supplementaleducationalservices: 1,498 1%
ReadingProficient level or above for: Grade 3 Grade Grade Allstudents 76% - -Economicallydisadvantagedstudents 57 - -Migrantstudents 36 - -Studentswithdisabilities 44 - -StudentswithlimitedEnglishproficiency 38 - -Black,non-Hispanicstudents 47 - -Hispanicstudents 47 - -White,non-Hispanicstudents 82 - -
Studentachievementtrend:Readingpercentproficientlevelorabove
0%
25%
50%
75%
100%76
4949
200320022001
HighSchoolGrade8Grade3n/a n/a
L
Minnesota
Minnesota Comprehensive Assessments, used for NCLB accountability
59
MathematicsProficient level or above for: Grade 3 Grade Grade Allstudents 74% - -Economicallydisadvantagedstudents 57 - -Migrantstudents 38 - -Studentswithdisabilities 48 - -StudentswithlimitedEnglishproficiency 43 - -Black,non-Hispanicstudents 44 - -Hispanicstudents 47 - -White,non-Hispanicstudents 81 - -
Studentachievementtrend:Mathematicspercentproficientlevelorabove
0%
25%
50%
75%
100%
74
4853
200320022001
HighSchoolGrade8Grade3n/a n/a
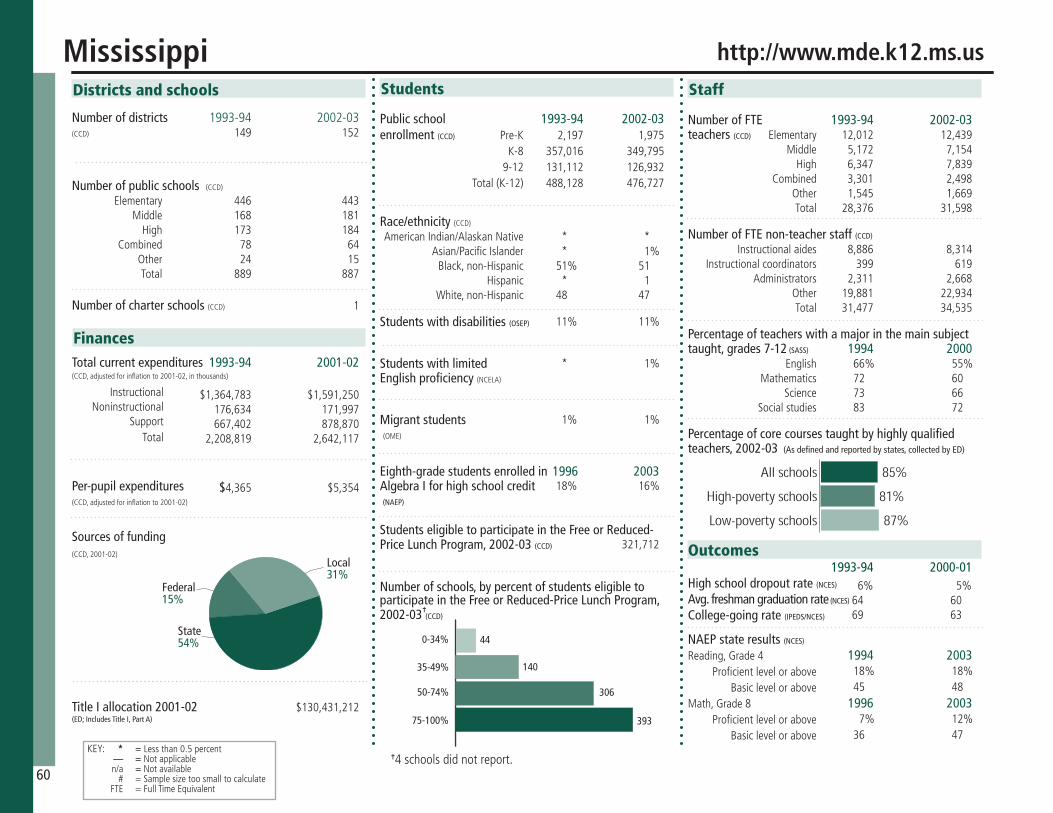
Staff
Number of FTE 1993-94 2002-03teachers (CCD) Elementary Middle High Combined Other Total
Number of FTE non-teacher staff (CCD)
Instructionalaides Instructionalcoordinators Administrators Other Total
Percentage of teachers with a major in the main subject taught, grades 7-12 (SASS) 1994 2000 English Mathematics Science Socialstudies
Percentage of core courses taught by highly qualified teachers, 2002-03 (As defined and reported by states, collected by ED)
Students
Public school 1993-94 2002-03enrollment (CCD) Pre-K K-8 9-12 Total(K-12)
Race/ethnicity (CCD) AmericanIndian/AlaskanNative Asian/PacificIslander Black,non-Hispanic Hispanic White,non-Hispanic
Students with disabilities (OSEP)
Students with limited English proficiency (NCELA)
Migrant students (OME)
Eighth-grade students enrolled in 1996 2003Algebra I for high school credit (NAEP)
Students eligible to participate in the Free or Reduced- Price Lunch Program, 2002-03 (CCD) Outcomes
1993-94 2000-01High school dropout rate (NCES)
Avg. freshman graduation rate (NCES) College-going rate (IPEDS/NCES)
NAEP state results (NCES) Reading,Grade4 1994 2003 Proficientlevelorabove BasicleveloraboveMath,Grade8 1996 2003 Proficientlevelorabove Basiclevelorabove
Number of districts 1993-94 2002-03(CCD)
Number of public schools (CCD)
Elementary Middle High Combined Other Total
Number of charter schools (CCD)
Districts and schools
Number of schools, by percent of students eligible to participate in the Free or Reduced-Price Lunch Program, 2002-03 (CCD)
Sources of funding(CCD,2001-02)
Title I allocation 2001-02 (ED; Includes Title I, Part A)
Total current expenditures 1993-94 2001-02 (CCD,adjustedforinflationto2001-02,inthousands)
Instructional Noninstructional Support Total
Per-pupil expenditures (CCD,adjustedforinflationto2001-02)
KEY: * =Lessthan0.5percent — = NotapplicableK n/a = Notavailable # =Samplesizetoosmalltocalculate FTE =FullTimeEquivalent
Finances
12,012 12,439 5,172 7,154 6,347 7,839 3,301 2,498 1,545 1,669 28,376 31,598
8,886 8,314 399 619 2,311 2,668 19,881 22,934 31,477 34,535
66% 55% 72 60 73 66 83 72
2,197 1,975 357,016 349,795 131,112 126,932 488,128 476,727
* * * 1% 51% 51 * 1 48 47
11% 11%
* 1%
1% 1%
18% 16%
321,712
6% 5% 64 60 69 63
18% 18% 45 48
7% 12% 36 47
149 152
446 443 168 181 173 184 78 64 24 15 889 887
1
Mississippi http://www.mde.k12.ms.us
$130,431,212
$1,364,783 $1,591,250 176,634 171,997 667,402 878,870 2,208,819 2,642,117
$4,365 $5,354
60
0-34%
35-49%
50-74%
75-100%
140
306
393
44
85%
81%
87%Low-poverty schools
High-poverty schools
All schools
Local31%
Federal15%
State54%
^
^4schoolsdidnotreport.

S t u d e n t A c h i e v e m e n t 2 0 0 2 - 0 3S t a t e w i d e A c c o u n t a b i l i t y I n f o r m a t i o n
SeeAppendixBforMississippi’sdefinitionsofproficientforreadingandmathematicsforgrades4,8,andhighschool.
Seehttp://www.mde.k12.ms.us/Account/RC4B/RC4B.htmformoredetailsonthestatewideaccount-abilitysystem.
State assessment for NCLB accountability:MississippiCurriculumTestState student achievement levels: Minimal,Basic,Proficient,Advanced
NCLB Accountability Goals 2001-02 Annual measurable Target objective starting point (2002-03)Grade4 Reading 66% 66% Mathematics 49 49Grade8 Reading 30 30 Mathematics 23 23 HighschoolReading 16 16 Mathematics 5 5
2002-03 NCLB accountability results, applied to 2003-04 school year AYP outcomes and consequences Title I schools All schools All districtsMadeAYP 0 650(75%) 70(46%)Identifiedforimprovement:
Year1 3 (*) 3 (*) 0Year2 1 (*) 1 (*) 0Correctiveaction 3 (*) 3 (*) 0Restructuring 0 0 0
Exitedimprovementstatus(madeAYPtwice 0 0 0aftermissingtwiceormore,includestotal“made”above)
Other indicator, 2002-03 State target State outcome
Elementaryindicator:Attendancerate 93% MetMiddleindicator:Attendancerate 93% MetHighschoolindicator:Graduationrate 72% Met
NCLB choice participation Number of Title I students Percent of eligible students
TitleIschoolchoice: 7 *Supplementaleducationalservices: 200 *
ReadingProficient level or above for: Grade 4 Grade 8 High schoolAllstudents 87% 57% 35%Economicallydisadvantagedstudents 82 43 20Migrantstudents 76 40 38Studentswithdisabilities 83 42 13StudentswithlimitedEnglishproficiency 89 34 47Black,non-Hispanicstudents 80 40 18Hispanicstudents 91 56 35White,non-Hispanicstudents 95 73 50
Studentachievementtrend:Readingpercentproficientlevelorabove
0%
25%
50%
75%
100%
35
57
87
28
48
84 200320022001
HighSchoolGrade8Grade4
n/a
Mississippi
Mississippi Curriculum Test, used for NCLB accountability
61
MathematicsProficient level or above for: Grade 4 Grade 8 High schoolAllstudents 74% 48% 45%Economicallydisadvantagedstudents 65 35 30Migrantstudents 55 45 64Studentswithdisabilities 70 34 26StudentswithlimitedEnglishproficiency 66 33 36Black,non-Hispanicstudents 61 31 27Hispanicstudents 80 49 54White,non-Hispanicstudents 88 65 60
Studentachievementtrend:Mathematicspercentproficientlevelorabove
0%
25%
50%
75%
100%
4548
74
45
72200320022001
HighSchoolGrade8Grade4
n/a
n/a n/a
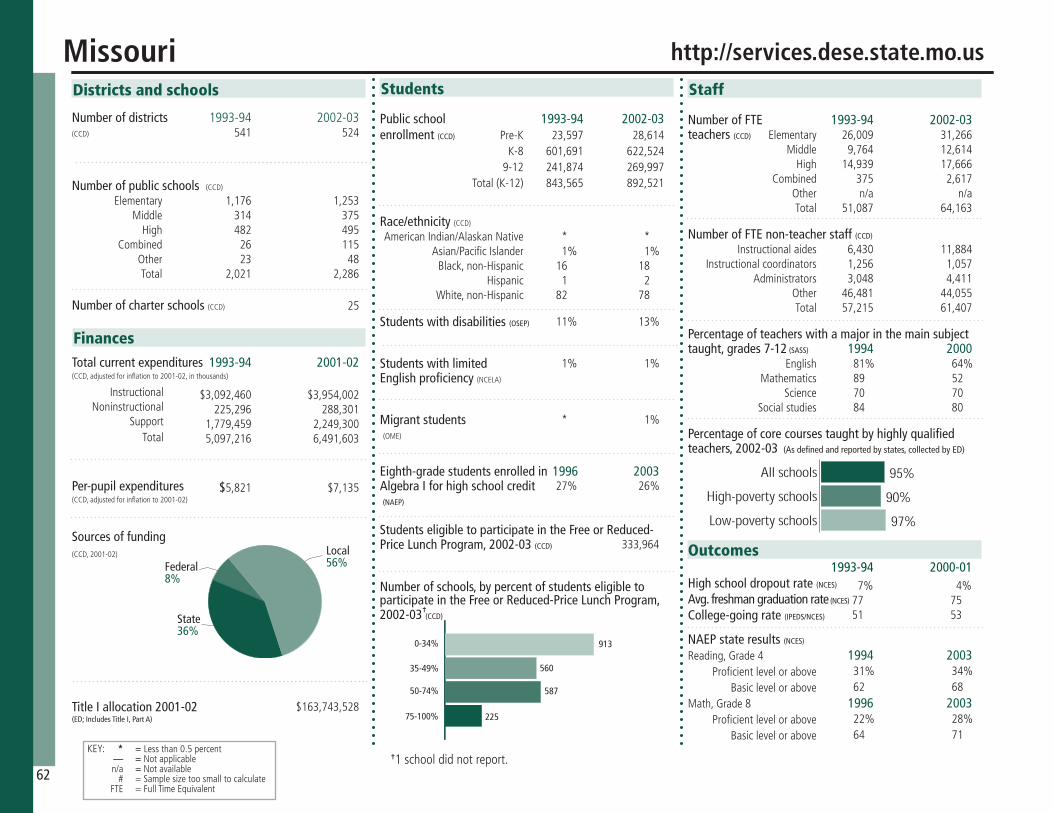
Staff
Number of FTE 1993-94 2002-03teachers (CCD) Elementary Middle High Combined Other Total
Number of FTE non-teacher staff (CCD)
Instructionalaides Instructionalcoordinators Administrators Other Total
Percentage of teachers with a major in the main subject taught, grades 7-12 (SASS) 1994 2000 English Mathematics Science Socialstudies
Percentage of core courses taught by highly qualified teachers, 2002-03 (As defined and reported by states, collected by ED)
Students
Public school 1993-94 2002-03enrollment (CCD) Pre-K K-8 9-12 Total(K-12)
Race/ethnicity (CCD) AmericanIndian/AlaskanNative Asian/PacificIslander Black,non-Hispanic Hispanic White,non-Hispanic
Students with disabilities (OSEP)
Students with limited English proficiency (NCELA)
Migrant students (OME)
Eighth-grade students enrolled in 1996 2003Algebra I for high school credit (NAEP)
Students eligible to participate in the Free or Reduced- Price Lunch Program, 2002-03 (CCD) Outcomes
1993-94 2000-01High school dropout rate (NCES)
Avg. freshman graduation rate (NCES) College-going rate (IPEDS/NCES)
NAEP state results (NCES) Reading,Grade4 1994 2003 Proficientlevelorabove BasicleveloraboveMath,Grade8 1996 2003 Proficientlevelorabove Basiclevelorabove
Number of districts 1993-94 2002-03(CCD)
Number of public schools (CCD)
Elementary Middle High Combined Other Total
Number of charter schools (CCD)
Districts and schools
Number of schools, by percent of students eligible to participate in the Free or Reduced-Price Lunch Program, 2002-03 (CCD)
Sources of funding(CCD,2001-02)
Title I allocation 2001-02 (ED; Includes Title I, Part A)
Total current expenditures 1993-94 2001-02 (CCD,adjustedforinflationto2001-02,inthousands)
Instructional Noninstructional Support Total
Per-pupil expenditures (CCD,adjustedforinflationto2001-02)
KEY: * =Lessthan0.5percent — = NotapplicableK n/a = Notavailable # =Samplesizetoosmalltocalculate FTE =FullTimeEquivalent
Finances
26,009 31,266 9,764 12,614 14,939 17,666 375 2,617 n/a n/a 51,087 64,163
6,430 11,884 1,256 1,057 3,048 4,411 46,481 44,055 57,215 61,407
81% 64% 89 52 70 70 84 80
23,597 28,614 601,691 622,524 241,874 269,997 843,565 892,521
* * 1% 1% 16 18 1 2 82 78
11% 13%
1% 1%
* 1%
27% 26%
333,964
7% 4% 77 75 51 53
31% 34% 62 68
22% 28% 64 71
541 524
1,176 1,253 314 375 482 495 26 115 23 48 2,021 2,286
25
Missouri http://services.dese.state.mo.us
$163,743,528
$3,092,460 $3,954,002 225,296 288,301 1,779,459 2,249,300 5,097,216 6,491,603
$5,821 $7,135
62
0-34%
35-49%
50-74%
75-100%
560
587
225
913
95%
90%
97%Low-poverty schools
High-poverty schools
All schools
Local56%Federal
8%
State36%
^
^1schooldidnotreport.
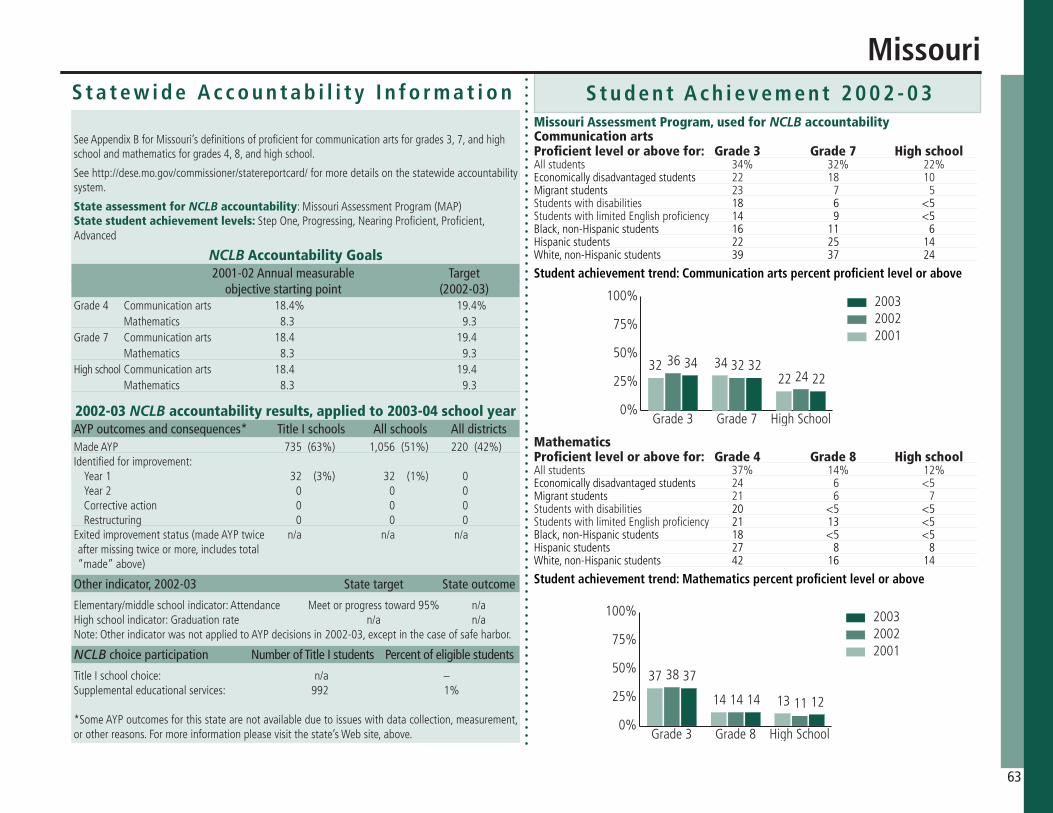
S t u d e n t A c h i e v e m e n t 2 0 0 2 - 0 3S t a t e w i d e A c c o u n t a b i l i t y I n f o r m a t i o n
SeeAppendixBforMissouri’sdefinitionsofproficientforcommunicationartsforgrades3,7,andhighschoolandmathematicsforgrades4,8,andhighschool.
Seehttp://dese.mo.gov/commissioner/statereportcard/formoredetailsonthestatewideaccountabilitysystem.
State assessment for NCLB accountability:MissouriAssessmentProgram(MAP)State student achievement levels: StepOne,Progressing,NearingProficient,Proficient,Advanced
NCLB Accountability Goals 2001-02 Annual measurable Target objective starting point (2002-03)Grade4 Communicationarts 18.4% 19.4% Mathematics 8.3 9.3Grade7 Communicationarts 18.4 19.4 Mathematics 8.3 9.3 HighschoolCommunicationarts 18.4 19.4 Mathematics 8.3 9.3
2002-03 NCLB accountability results, applied to 2003-04 school year AYP outcomes and consequences* Title I schools All schools All districtsMadeAYP 735(63%) 1,056(51%) 220(42%)Identifiedforimprovement:
Year1 32 (3%) 32 (1%) 0Year2 0 0 0Correctiveaction 0 0 0Restructuring 0 0 0
Exitedimprovementstatus(madeAYPtwice n/a n/a n/aaftermissingtwiceormore,includestotal“made”above)
Other indicator, 2002-03 State target State outcome
Elementary/middleschoolindicator:Attendance Meetorprogresstoward95% n/aHighschoolindicator:Graduationrate n/a n/aNote:OtherindicatorwasnotappliedtoAYPdecisionsin2002-03,exceptinthecaseofsafeharbor.
NCLB choice participation Number of Title I students Percent of eligible students
TitleIschoolchoice: n/a –Supplementaleducationalservices: 992 1%
*SomeAYPoutcomesforthisstatearenotavailableduetoissueswithdatacollection,measurement,orotherreasons.Formoreinformationpleasevisitthestate’sWebsite,above.
Communication artsProficient level or above for: Grade 3 Grade 7 High schoolAllstudents 34% 32% 22%Economicallydisadvantagedstudents 22 18 10Migrantstudents 23 7 5Studentswithdisabilities 18 6 <5StudentswithlimitedEnglishproficiency 14 9 <5Black,non-Hispanicstudents 16 11 6Hispanicstudents 22 25 14White,non-Hispanicstudents 39 37 24
Studentachievementtrend:Communicationartspercentproficientlevelorabove
0%
25%
50%
75%
100%
223234
243236
223432
200320022001
HighSchoolGrade7Grade3
Missouri
Missouri Assessment Program, used for NCLB accountability
63
MathematicsProficient level or above for: Grade 4 Grade 8 High schoolAllstudents 37% 14% 12%Economicallydisadvantagedstudents 24 6 <5Migrantstudents 21 6 7Studentswithdisabilities 20 <5 <5StudentswithlimitedEnglishproficiency 21 13 <5Black,non-Hispanicstudents 18 <5 <5Hispanicstudents 27 8 8White,non-Hispanicstudents 42 16 14
Studentachievementtrend:Mathematicspercentproficientlevelorabove
0%
25%
50%
75%
100%
1214
37
1114
38
1314
37
200320022001
HighSchoolGrade8Grade3
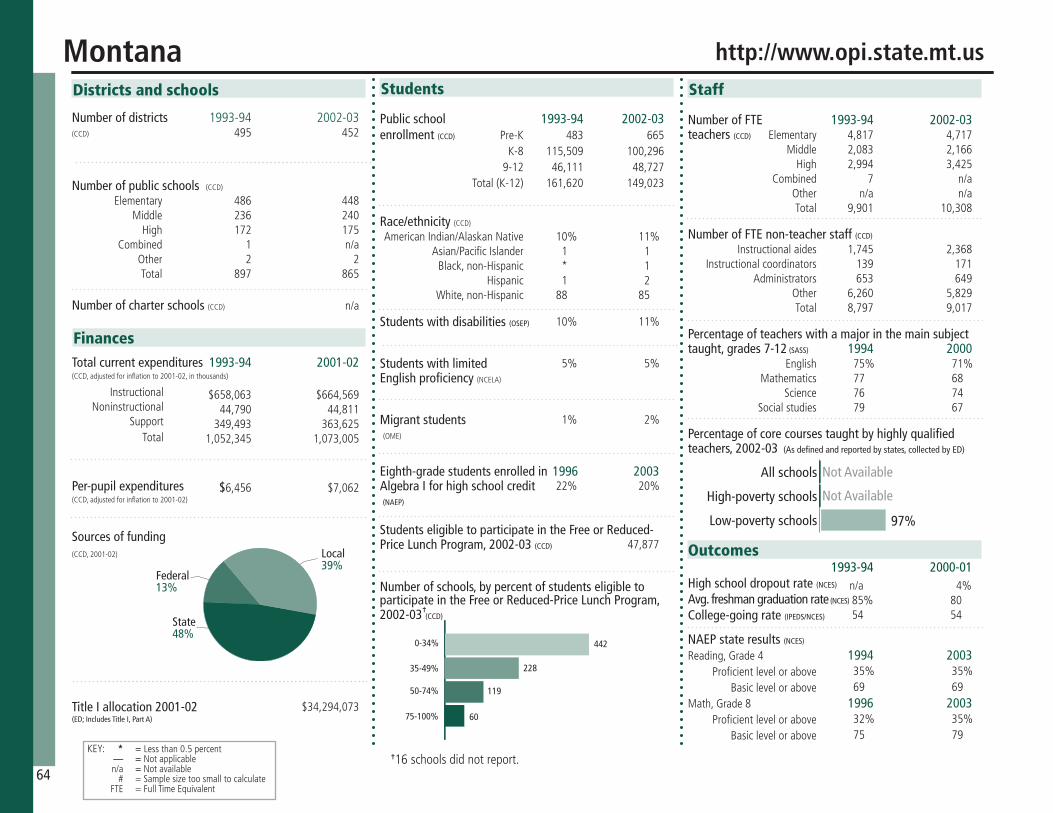
Staff
Number of FTE 1993-94 2002-03teachers (CCD) Elementary Middle High Combined Other Total
Number of FTE non-teacher staff (CCD)
Instructionalaides Instructionalcoordinators Administrators Other Total
Percentage of teachers with a major in the main subject taught, grades 7-12 (SASS) 1994 2000 English Mathematics Science Socialstudies
Percentage of core courses taught by highly qualified teachers, 2002-03 (As defined and reported by states, collected by ED)
Students
Public school 1993-94 2002-03enrollment (CCD) Pre-K K-8 9-12 Total(K-12)
Race/ethnicity (CCD) AmericanIndian/AlaskanNative Asian/PacificIslander Black,non-Hispanic Hispanic White,non-Hispanic
Students with disabilities (OSEP)
Students with limited English proficiency (NCELA)
Migrant students (OME)
Eighth-grade students enrolled in 1996 2003Algebra I for high school credit (NAEP)
Students eligible to participate in the Free or Reduced- Price Lunch Program, 2002-03 (CCD) Outcomes
1993-94 2000-01High school dropout rate (NCES)
Avg. freshman graduation rate (NCES) College-going rate (IPEDS/NCES)
NAEP state results (NCES) Reading,Grade4 1994 2003 Proficientlevelorabove BasicleveloraboveMath,Grade8 1996 2003 Proficientlevelorabove Basiclevelorabove
Number of districts 1993-94 2002-03(CCD)
Number of public schools (CCD)
Elementary Middle High Combined Other Total
Number of charter schools (CCD)
Districts and schools
Number of schools, by percent of students eligible to participate in the Free or Reduced-Price Lunch Program, 2002-03 (CCD)
Sources of funding(CCD,2001-02)
Title I allocation 2001-02 (ED; Includes Title I, Part A)
Total current expenditures 1993-94 2001-02 (CCD,adjustedforinflationto2001-02,inthousands)
Instructional Noninstructional Support Total
Per-pupil expenditures (CCD,adjustedforinflationto2001-02)
KEY: * =Lessthan0.5percent — = NotapplicableK n/a = Notavailable # =Samplesizetoosmalltocalculate FTE =FullTimeEquivalent
Finances
4,817 4,717 2,083 2,166 2,994 3,425 7 n/a n/a n/a 9,901 10,308
1,745 2,368 139 171 653 649 6,260 5,829 8,797 9,017
75% 71% 77 68 76 74 79 67
483 665 115,509 100,296 46,111 48,727 161,620 149,023
10% 11% 1 1 * 1 1 2 88 85
10% 11%
5% 5%
1% 2%
22% 20%
47,877
n/a 4% 85% 80 54 54
35% 35% 69 69
32% 35% 75 79
495 452
486 448 236 240 172 175 1 n/a 2 2 897 865
n/a
Montana http://www.opi.state.mt.us
$34,294,073
$658,063 $664,569 44,790 44,811 349,493 363,625 1,052,345 1,073,005
$6,456 $7,062
64
0-34%
35-49%
50-74%
75-100%
228
119
60
442
97%Low-poverty schools
High-poverty schools
All schools
Not Available
Not Available
Local39%
Federal13%
State48%
^
^16schoolsdidnotreport.
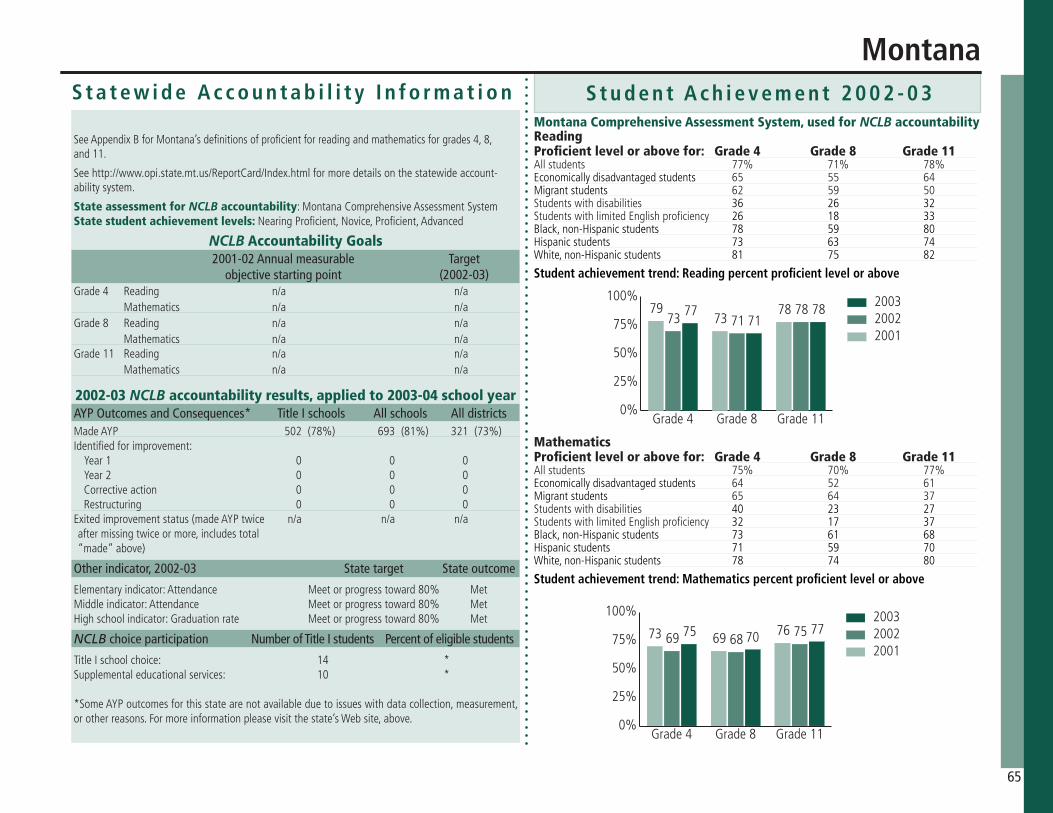
S t u d e n t A c h i e v e m e n t 2 0 0 2 - 0 3S t a t e w i d e A c c o u n t a b i l i t y I n f o r m a t i o n
SeeAppendixBforMontana’sdefinitionsofproficientforreadingandmathematicsforgrades4,8,and11.
Seehttp://www.opi.state.mt.us/ReportCard/Index.htmlformoredetailsonthestatewideaccount-abilitysystem.
State assessment for NCLB accountability:MontanaComprehensiveAssessmentSystemState student achievement levels: NearingProficient,Novice,Proficient,Advanced
NCLB Accountability Goals 2001-02 Annual measurable Target objective starting point (2002-03)Grade4 Reading n/a n/a Mathematics n/a n/aGrade8 Reading n/a n/a Mathematics n/a n/a Grade11 Reading n/a n/a Mathematics n/a n/a
2002-03 NCLB accountability results, applied to 2003-04 school year AYP Outcomes and Consequences* Title I schools All schools All districtsMadeAYP 502(78%) 693(81%) 321(73%)Identifiedforimprovement:
Year1 0 0 0Year2 0 0 0Correctiveaction 0 0 0Restructuring 0 0 0
Exitedimprovementstatus(madeAYPtwice n/a n/a n/aaftermissingtwiceormore,includestotal“made”above)
Other indicator, 2002-03 State target State outcome
Elementaryindicator:Attendance Meetorprogresstoward80% MetMiddleindicator:Attendance Meetorprogresstoward80% MetHighschoolindicator:Graduationrate Meetorprogresstoward80% Met
NCLB choice participation Number of Title I students Percent of eligible students
TitleIschoolchoice: 14 *Supplementaleducationalservices: 10 *
*SomeAYPoutcomesforthisstatearenotavailableduetoissueswithdatacollection,measurement,orotherreasons.Formoreinformationpleasevisitthestate’sWebsite,above.
ReadingProficient level or above for: Grade 4 Grade 8 Grade 11Allstudents 77% 71% 78%Economicallydisadvantagedstudents 65 55 64Migrantstudents 62 59 50Studentswithdisabilities 36 26 32StudentswithlimitedEnglishproficiency 26 18 33Black,non-Hispanicstudents 78 59 80Hispanicstudents 73 63 74White,non-Hispanicstudents 81 75 82
Studentachievementtrend:Readingpercentproficientlevelorabove
0%
25%
50%
75%
100%78
7177 78
717378
7379 2003
20022001
Grade11Grade8Grade4
Montana
Montana Comprehensive Assessment System, used for NCLB accountability
65
MathematicsProficient level or above for: Grade 4 Grade 8 Grade 11Allstudents 75% 70% 77%Economicallydisadvantagedstudents 64 52 61Migrantstudents 65 64 37Studentswithdisabilities 40 23 27StudentswithlimitedEnglishproficiency 32 17 37Black,non-Hispanicstudents 73 61 68Hispanicstudents 71 59 70White,non-Hispanicstudents 78 74 80
Studentachievementtrend:Mathematicspercentproficientlevelorabove
0%
25%
50%
75%
100%777075 756869 766973
200320022001
Grade11Grade8Grade4

Staff
Number of FTE 1993-94 2002-03teachers (CCD) Elementary Middle High Combined Other Total
Number of FTE non-teacher staff (CCD)
Instructionalaides Instructionalcoordinators Administrators Other Total
Percentage of teachers with a major in the main subject taught, grades 7-12 (SASS) 1994 2000 English Mathematics Science Socialstudies
Percentage of core courses taught by highly qualified teachers, 2002-03 (As defined and reported by states, collected by ED)
Students
Public school 1993-94 2002-03enrollment (CCD) Pre-K K-8 9-12 Total(K-12)
Race/ethnicity (CCD) AmericanIndian/AlaskanNative Asian/PacificIslander Black,non-Hispanic Hispanic White,non-Hispanic
Students with disabilities (OSEP)
Students with limited English proficiency (NCELA)
Migrant students (OME)
Eighth-grade students enrolled in 1996 2003Algebra I for high school credit (NAEP)
Students eligible to participate in the Free or Reduced- Price Lunch Program, 2002-03 (CCD) Outcomes
1993-94 2000-01High school dropout rate (NCES)
Avg. freshman graduation rate (NCES) College-going rate (IPEDS/NCES)
NAEP state results (NCES) Reading,Grade4 1994 2003 Proficientlevelorabove BasicleveloraboveMath,Grade8 1996 2003 Proficientlevelorabove Basiclevelorabove
Number of districts 1993-94 2002-03(CCD)
Number of public schools (CCD)
Elementary Middle High Combined Other Total
Number of charter schools (CCD)
Districts and schools
Number of schools, by percent of students eligible to participate in the Free or Reduced-Price Lunch Program, 2002-03 (CCD)
Sources of funding(CCD,2001-02)
Title I allocation 2001-02 (ED; Includes Title I, Part A)
Total current expenditures 1993-94 2001-02 (CCD,adjustedforinflationto2001-02,inthousands)
Instructional Noninstructional Support Total
Per-pupil expenditures (CCD,adjustedforinflationto2001-02)
KEY: * =Lessthan0.5percent — = NotapplicableK n/a = Notavailable # =Samplesizetoosmalltocalculate FTE =FullTimeEquivalent
Finances
9,874 10,447 2,796 2,913 6,874 7,072 76 141 n/a n/a 19,620 20,573
3,325 4,692 212 408 1,540 1,573 12,139 13,027 17,216 19,700
83% 84% 83 89 79 80 90 81
3,577 5,491 199,849 189,622 81,671 90,289 281,520 279,911
1% 2% 1 2 6 7 4 9 88 81
11% 13%
1% 4%
2% 6%
25% 28%
92,423
5% 4% 89 84 60 59
34% 32% 66 66
31% 32% 76 74
695 557
925 806 102 98 316 300 n/a 42 3 4 1,346 1,250
n/a
Nebraska http://www.nde.state.ne.us
$37,640,058
$1,205,147 $1,390,961 164,796 156,434 568,224 659,551 1,938,168 2,205,946
$6,798 $7,741
66
0-34%
35-49%
50-74%
75-100%
269
203
55
707
90%
82%
93%Low-poverty schools
High-poverty schools
All schools
Local57%Federal
8%
State36%
^
^16schoolsdidnotreport.

S t u d e n t A c h i e v e m e n t 2 0 0 2 - 0 3S t a t e w i d e A c c o u n t a b i l i t y I n f o r m a t i o n
SeeAppendixBforNebraska’sdefinitionsofproficientforreadingandmathematicsforgrades4,8,andhighschool.
Seehttp://reportcard.nde.state.ne.us/Main/PDFDownload.aspformoredetailsonthestatewideac-countabilitysystem.
State assessment for NCLB accountability:School-basedTeacher-ledAssessmentandReportingSystem(STARS)State student achievement levels: Basic,Progressing,Proficient,Advanced
NCLB Accountability Goals 2001-02 Annual measurable Target objective starting point (2002-03)Grade4 Reading 62% 62% Mathematics 65 65Grade8 Reading 61 61 Mathematics 58 58 HighschoolReading 66 66 Mathematics 62 62
2002-03 NCLB accountability results, applied to 2003-04 school year AYP outcomes and consequences Title I schools All schools All districtsMadeAYP 0 275(50%) 50(31%)Identifiedforimprovement:
Year1 2 (*) 2 (*) 0Year2 1 (*) 1 (*) 0Correctiveaction 3 (*) 3 (*) 0Restructuring 0 0 0
Exitedimprovementstatus(madeAYPtwice 0 0 0aftermissingtwiceormore,includestotal “made”above)
Other indicator, 2002-03 State target State outcome
Elementaryindicator:Writingassessment Meetorprogresstoward62% MetMiddleindicator:Writingassessment Meetorprogresstoward62% MetHighschoolindicator:Graduationrate Meetorprogresstoward83.97% Met
NCLB choice participation Number of Title I students Percent of eligible students
TitleIschoolchoice: 0 –Supplementaleducationalservices: 0 –
ReadingProficient level or above for: Grade 4 Grade 8 High schoolAllstudents 83% 80% 77%Economicallydisadvantagedstudents 72 67 60Migrantstudents 60 46 33Studentswithdisabilities 56 42 35StudentswithlimitedEnglishproficiency 51 44 36Black,non-Hispanicstudents 66 62 53Hispanicstudents 71 62 51White,non-Hispanicstudents 86 83 80
Studentachievementtrend:Readingpercentproficientlevelorabove
0%
25%
50%
75%
100%778083
636062
200320022001
HighSchoolGrade8Grade4
n/a
Nebraska
School-based Teacher-led Assessment and Reporting System, used for NCLB accountability
67
MathematicsProficient level or above for: Grade 4 Grade 8 High schoolAllstudents 82% 75% 65%Economicallydisadvantagedstudents 71 60 48Migrantstudents 63 46 32Studentswithdisabilities 57 36 23StudentswithlimitedEnglishproficiency 58 37 32Black,non-Hispanicstudents 68 55 36Hispanicstudents 70 53 38White,non-Hispanicstudents 84 79 69
Studentachievementtrend:Mathematicspercentproficientlevelorabove
0%
25%
50%
75%
100%
657582
717278200320022001
HighSchoolGrade8Grade4
n/a

Staff
Number of FTE 1993-94 2002-03teachers (CCD) Elementary Middle High Combined Other Total
Number of FTE non-teacher staff (CCD)
Instructionalaides Instructionalcoordinators Administrators Other Total
Percentage of teachers with a major in the main subject taught, grades 7-12 (SASS) 1994 2000 English Mathematics Science Socialstudies
Percentage of core courses taught by highly qualified teachers, 2002-03 (As defined and reported by states, collected by ED)
Students
Public school 1993-94 2002-03enrollment (CCD) Pre-K K-8 9-12 Total(K-12)
Race/ethnicity (CCD) AmericanIndian/AlaskanNative Asian/PacificIslander Black,non-Hispanic Hispanic White,non-Hispanic
Students with disabilities (OSEP)
Students with limited English proficiency (NCELA)
Migrant students (OME)
Eighth-grade students enrolled in 1996 2003Algebra I for high school credit (NAEP)
Students eligible to participate in the Free or Reduced- Price Lunch Program, 2002-03 (CCD) Outcomes
1993-94 2000-01High school dropout rate (NCES)
Avg. freshman graduation rate (NCES) College-going rate (IPEDS/NCES)
NAEP state results (NCES) Reading,Grade4 1994 2003 Proficientlevelorabove BasicleveloraboveMath,Grade8 1996 2003 Proficientlevelorabove Basiclevelorabove
Number of districts 1993-94 2002-03(CCD)
Number of public schools (CCD)
Elementary Middle High Combined Other Total
Number of charter schools (CCD)
Districts and schools
Number of schools, by percent of students eligible to participate in the Free or Reduced-Price Lunch Program, 2002-03 (CCD)
Sources of funding(CCD,2001-02)
Title I allocation 2001-02 (ED; Includes Title I, Part A)
Total current expenditures 1993-94 2001-02 (CCD,adjustedforinflationto2001-02,inthousands)
Instructional Noninstructional Support Total
Per-pupil expenditures (CCD,adjustedforinflationto2001-02)
KEY: * =Lessthan0.5percent — = NotapplicableK n/a = Notavailable # =Samplesizetoosmalltocalculate FTE =FullTimeEquivalent
Finances
6,968 10,484 2,113 3,662 2,584 4,413 84 116 n/a n/a 11,749 18,675
1,257 3,220 87 254 919 1,285 7,576 8,645 9,839 13,404
85% 70% 74 38 88 78 86 73
1,237 2,426 173,091 267,067 60,727 98,118 233,818 365,185
2% 2% 4 6 9 10 14 29 70 53
10% 10%
6% 14%
1% *
n/a 32%
125,660
10% 5% 73 70 38 40
n/a 20% n/a 52
n/a 21% n/a 60
17 17
255 326 57 84 54 99 4 10 2 8 372 527
13
Nevada http://www.nde.state.nv.us
$40,690,971
$837,716 $1,353,806 47,856 71,003 521,430 74,190 1,407,001 1,498,999
$5,967 $6,079
68
0-34%
35-49%
50-74%
75-100%
84
87
70
202
50%
50%
62%Low-poverty schools
High-poverty schools
All schools
Local62%Federal
6%
State32%
^
^84schoolsdidnotreport.

S t u d e n t A c h i e v e m e n t 2 0 0 2 - 0 3S t a t e w i d e A c c o u n t a b i l i t y I n f o r m a t i o n
SeeAppendixBforNevada’sdefinitionsofproficientforreadingandmathematicsforgrades3,8,andhighschool.
Seehttp://www.nevadareportcard.com/formoredetailsonthestatewideaccountabilitysystem.
State assessment for NCLB accountability:NevadaCriterionReferenceTestsState student achievement levels: ApproachesStandard,Developing/Emergent,MeetsStan-dard,ExceedsStandard
NCLB Accountability Goals 2001-02 Annual measurable Target objective starting point (2002-03)Grade3 Reading 32.4% 27.5% Mathematics 37.3 34.5Grade8 Reading 37 37 Mathematics 38 32 HighschoolReading 91 73.5 Mathematics 58 42.8
2002-03 NCLB accountability results, applied to 2003-04 school year AYP outcomes and consequences* Title I schools All schools All districtsMadeAYP n/a 330(60%) 0Identifiedforimprovement:
Year1 n/a 18 (3%) 1 (6%)Year2 n/a 7 (1%) 0Correctiveaction n/a 0 0Restructuring n/a 0 0
Exitedimprovementstatus(madeAYPtwice n/a 0 0aftermissingtwiceormore,includestotal“made”above)
Other indicator, 2002-03 State target State outcome
Elementaryindicator:Attendance Meetorprogresstoward90% MetMiddleindicator:Attendance Meetorprogresstoward90% MetHighschoolindicator:Graduationrate Meetorprogresstoward50% Met
NCLB choice participation Number of Title I students Percent of eligible students
TitleIschoolchoice: 252 *Supplementaleducationalservices: 259 *
*SomeAYPoutcomesforthisstatearenotavailableduetoissueswithdatacollection,measurement,orotherreasons.Formoreinformationpleasevisitthestate’sWebsite,above.
ReadingProficient level or above for: Grade 3 Grade 8 High schoolAllstudents 51% 56% 81%Economicallydisadvantagedstudents 35 45 72Migrantstudents 16 0 77Studentswithdisabilities 17 15 39StudentswithlimitedEnglishproficiency 24 17 35Black,non-Hispanicstudents 37 43 72Hispanicstudents 34 41 67White,non-Hispanicstudents 62 65 89
Studentachievementtrend:Readingpercentproficientlevelorabove
0%
25%
50%
75%
100%81
5651 5551
200320022001
HighSchoolGrade8Grade3
n/a
n/a
Nevada
Nevada Criterion Reference Tests, used for NCLB accountability
69
MathematicsProficient level or above for: Grade 3 Grade High schoolAllstudents 51% - 55%Economicallydisadvantagedstudents 37 - 38Migrantstudents 16 - 27Studentswithdisabilities 17 - 15StudentswithlimitedEnglishproficiency 30 - 18Black,non-Hispanicstudents 35 - 31Hispanicstudents 37 - 33White,non-Hispanicstudents 61 - 66
Studentachievementtrend:Mathematicspercentproficientlevelorabove
0%
25%
50%
75%
100%
555139
50
200320022001
HighSchoolGrade8Grade3
n/a
n/a

Staff
Number of FTE 1993-94 2002-03teachers (CCD) Elementary Middle High Combined Other Total
Number of FTE non-teacher staff (CCD)
Instructionalaides Instructionalcoordinators Administrators Other Total
Percentage of teachers with a major in the main subject taught, grades 7-12 (SASS) 1994 2000 English Mathematics Science Socialstudies
Percentage of core courses taught by highly qualified teachers, 2002-03 (As defined and reported by states, collected by ED)
Students
Public school 1993-94 2002-03enrollment (CCD) Pre-K K-8 9-12 Total(K-12)
Race/ethnicity (CCD) AmericanIndian/AlaskanNative Asian/PacificIslander Black,non-Hispanic Hispanic White,non-Hispanic
Students with disabilities (OSEP)
Students with limited English proficiency (NCELA)
Migrant students (OME)
Eighth-grade students enrolled in 1996 2003Algebra I for high school credit (NAEP)
Students eligible to participate in the Free or Reduced- Price Lunch Program, 2002-03 (CCD) Outcomes
1993-94 2000-01High school dropout rate (NCES)
Avg. freshman graduation rate (NCES) College-going rate (IPEDS/NCES)
NAEP state results (NCES) Reading,Grade4 1994 2003 Proficientlevelorabove BasicleveloraboveMath,Grade8 1996 2003 Proficientlevelorabove Basiclevelorabove
Number of districts 1993-94 2002-03(CCD)
Number of public schools (CCD)
Elementary Middle High Combined Other Total
Number of charter schools (CCD)
Districts and schools
Number of schools, by percent of students eligible to participate in the Free or Reduced-Price Lunch Program, 2002-03 (CCD)
Sources of funding(CCD,2001-02)
Title I allocation 2001-02 (ED; Includes Title I, Part A)
Total current expenditures 1993-94 2001-02 (CCD,adjustedforinflationto2001-02,inthousands)
Instructional Noninstructional Support Total
Per-pupil expenditures (CCD,adjustedforinflationto2001-02)
KEY: * =Lessthan0.5percent — = NotapplicableK n/a = Notavailable # =Samplesizetoosmalltocalculate FTE =FullTimeEquivalent
Finances
5,767 6,845 2,711 3,619 3,493 4,465 n/a n/a n/a n/a 11,971 14,929
2,902 6,050 128 196 807 1,028 6,093 7,836 9,930 15,110
90% 73% 76 69 91 90 90 88
1,292 1,923 134,367 141,139 49,098 63,988 183,465 205,127
* * 1% 2% 1 1 1 2 97 94
11% 12%
1% 2%
* *
n/a 27%
32,132
n/a 5% 81% 78 56 59
36% 40% 70 75
n/a 35% n/a 79
178 178
293 298 91 96 77 78 n/a n/a n/a 1 461 473
0
NewHampshire http://www.ed.state.nh.us
$29,733,465
$827,873 $1,064,917 45,576 52,283 415,900 524,179 1,289,349 1,641,379
$6,955 $7,935
70
0-34%
35-49%
50-74%
75-100%
39
14
1
404
86%
84%
88%Low-poverty schools
High-poverty schools
All schools
Local43%Federal
5%
State52%
^
^15schoolsdidnotreport.

S t u d e n t A c h i e v e m e n t 2 0 0 2 - 0 3S t a t e w i d e A c c o u n t a b i l i t y I n f o r m a t i o n
SeeAppendixBforNewHampshire’sdefinitionsofbasicforreadingandmathematicsforgrades3,6,andhighschool.
Seehttp://www.ed.state.nh.us/education/doe/organization/curriculum/Assessment/materials04.htmformoredetailsonthestatewideaccountabilitysystem.
State assessment for NCLB accountability:NewHampshireEducationalImprovementAssessmentProgramState student achievement levels: Novice,Basic,Proficient,Advanced
NCLB Accountability Goals 2001-02 Annual measurable Target objective starting point (2002-03)Grade3 Reading 60% 60% Mathematics 64 64Grade6 Reading 60 60 Mathematics 64 64 HighschoolReading 70 70 Mathematics 52 52
2002-03 NCLB accountability results, applied to 2003-04 school year AYP outcomes and consequences Title I schools All schools All districtsMadeAYP 201(75%) 321(69%) 118(73%)Identifiedforimprovement:
Year1 4 (*) 4 (*) 0Year2 2 (*) 2 (*) 0Correctiveaction 0 0 0Restructuring 0 0 0
Exitedimprovementstatus(madeAYPtwice 3 (*) 3 (*) 0aftermissingtwiceormore,includestotal“made”above)
Other indicator, 2002-03 State target State outcome
Elementaryindicator:Attendance Meetorprogresstoward90% MetMiddleindicator:Attendance Meetorprogresstoward90% MetHighschoolindicator:Graduationrate Meetorprogresstoward75% Met
NCLB choice participation Number of Title I students Percent of eligible students
TitleIschoolchoice: 1 *Supplementaleducationalservices: 15 *
ReadingProficient level or above for: Grade 3 Grade 6 High schoolAllstudents 77% 72% 70%Economicallydisadvantagedstudents 58 53 51Migrantstudents # # #Studentswithdisabilities 31 26 25StudentswithlimitedEnglishproficiency 43 26 16Black,non-Hispanicstudents 62 60 47Hispanicstudents 57 54 47White,non-Hispanicstudents 77 72 71
Studentachievementtrend:Readingpercentproficientlevelorabove
0%
25%
50%
75%
100%
707277
200320022001
HighSchoolGrade6Grade3
n/an/a
NewHampshire
New Hampshire Educational Improvement Assessment Program, used for NCLB accountability
71
MathematicsProficient level or above for: Grade 3 Grade 6 High schoolAllstudents 80% 74% 63%Economicallydisadvantagedstudents 67 57 44Migrantstudents # # #Studentswithdisabilities 52 35 20StudentswithlimitedEnglishproficiency 58 36 29Black,non-Hispanicstudents 64 51 41Hispanicstudents 64 56 41White,non-Hispanicstudents 80 74 64
Studentachievementtrend:Mathematicspercentproficientlevelorabove
0%
25%
50%
75%
100%
637480 2003
20022001
HighSchoolGrade6Grade3
n/an/a
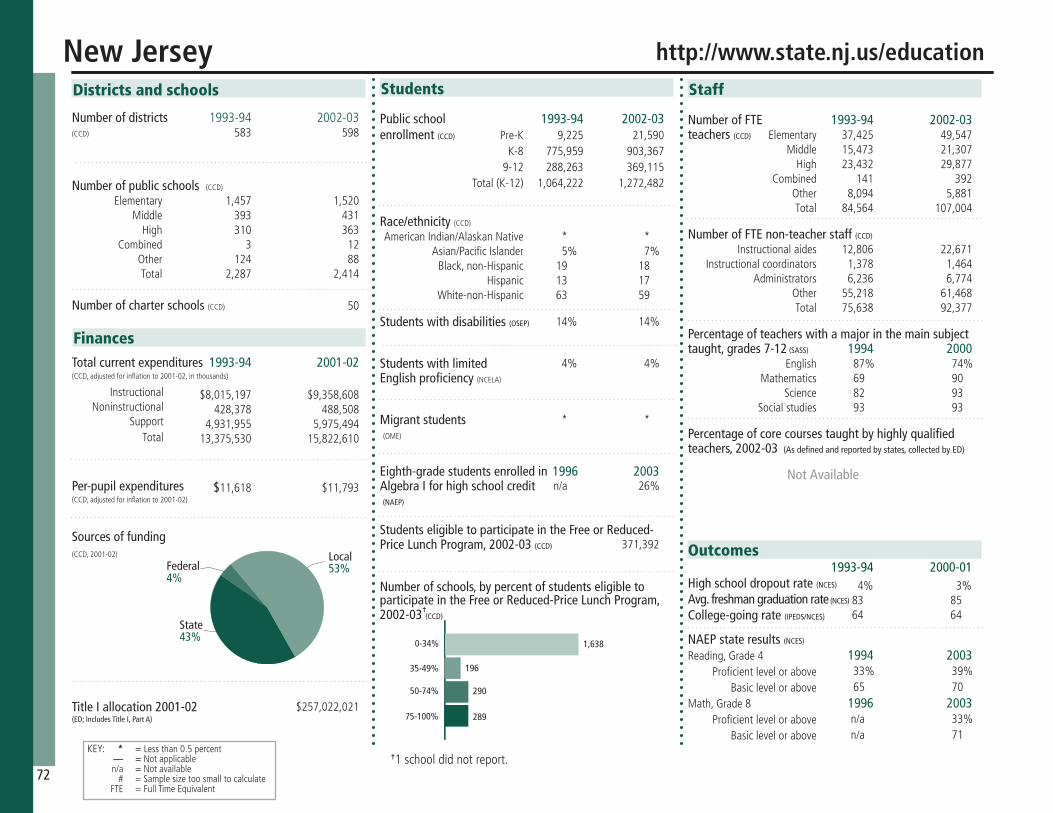
Staff
Number of FTE 1993-94 2002-03teachers (CCD) Elementary Middle High Combined Other Total
Number of FTE non-teacher staff (CCD)
Instructionalaides Instructionalcoordinators Administrators Other Total
Percentage of teachers with a major in the main subject taught, grades 7-12 (SASS) 1994 2000 English Mathematics Science Socialstudies
Percentage of core courses taught by highly qualified teachers, 2002-03 (As defined and reported by states, collected by ED)
Students
Public school 1993-94 2002-03enrollment (CCD) Pre-K K-8 9-12 Total(K-12)
Race/ethnicity (CCD) AmericanIndian/AlaskanNative Asian/PacificIslander Black,non-Hispanic Hispanic White-non-Hispanic
Students with disabilities (OSEP)
Students with limited English proficiency (NCELA)
Migrant students (OME)
Eighth-grade students enrolled in 1996 2003Algebra I for high school credit (NAEP)
Students eligible to participate in the Free or Reduced- Price Lunch Program, 2002-03 (CCD) Outcomes
1993-94 2000-01High school dropout rate (NCES)
Avg. freshman graduation rate (NCES) College-going rate (IPEDS/NCES)
NAEP state results (NCES) Reading,Grade4 1994 2003 Proficientlevelorabove BasicleveloraboveMath,Grade8 1996 2003 Proficientlevelorabove Basiclevelorabove
Number of districts 1993-94 2002-03(CCD)
Number of public schools (CCD)
Elementary Middle High Combined Other Total
Number of charter schools (CCD)
Districts and schools
Number of schools, by percent of students eligible to participate in the Free or Reduced-Price Lunch Program, 2002-03 (CCD)
Sources of funding(CCD,2001-02)
Title I allocation 2001-02 (ED; Includes Title I, Part A)
Total current expenditures 1993-94 2001-02 (CCD,adjustedforinflationto2001-02,inthousands)
Instructional Noninstructional Support Total
Per-pupil expenditures (CCD,adjustedforinflationto2001-02)
KEY: * =Lessthan0.5percent — = NotapplicableK n/a = Notavailable # =Samplesizetoosmalltocalculate FTE =FullTimeEquivalent
Finances
37,425 49,547 15,473 21,307 23,432 29,877 141 392 8,094 5,881 84,564 107,004
12,806 22,671 1,378 1,464 6,236 6,774 55,218 61,468 75,638 92,377
87% 74% 69 90 82 93 93 93
9,225 21,590 775,959 903,367 288,263 369,115 1,064,222 1,272,482
* * 5% 7% 19 18 13 17 63 59
14% 14%
4% 4%
* *
n/a 26%
371,392
4% 3% 83 85 64 64
33% 39% 65 70
n/a 33% n/a 71
583 598
1,457 1,520 393 431 310 363 3 12 124 88 2,287 2,414
50
NewJersey http://www.state.nj.us/education
$257,022,021
$8,015,197 $9,358,608 428,378 488,508 4,931,955 5,975,494 13,375,530 15,822,610
$11,618 $11,793
72
0-34%
35-49%
50-74%
75-100%
196
290
289
1,638
Not Available
Local53%Federal
4%
State43%
^
^1schooldidnotreport.
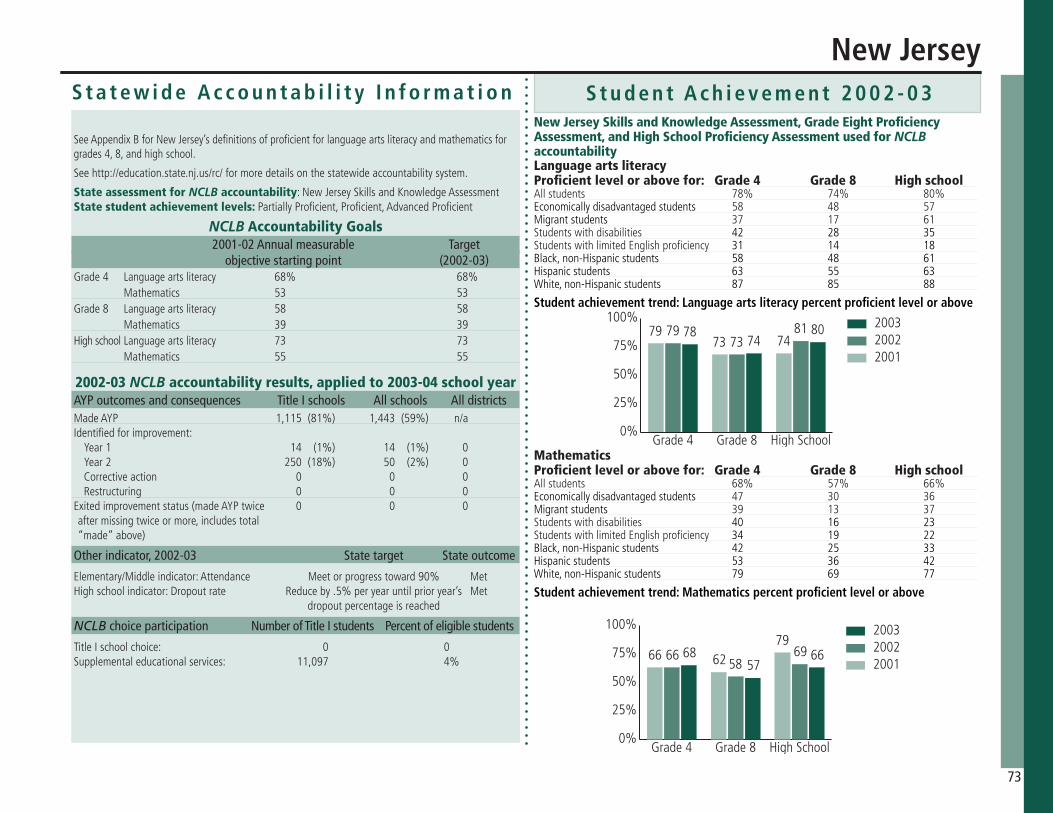
S t u d e n t A c h i e v e m e n t 2 0 0 2 - 0 3S t a t e w i d e A c c o u n t a b i l i t y I n f o r m a t i o n
SeeAppendixBforNewJersey’sdefinitionsofproficientforlanguageartsliteracyandmathematicsforgrades4,8,andhighschool.
Seehttp://education.state.nj.us/rc/formoredetailsonthestatewideaccountabilitysystem.
State assessment for NCLB accountability:NewJerseySkillsandKnowledgeAssessmentState student achievement levels: PartiallyProficient,Proficient,AdvancedProficient
NCLB Accountability Goals 2001-02 Annual measurable Target objective starting point (2002-03)Grade4 Languageartsliteracy 68% 68% Mathematics 53 53Grade8 Languageartsliteracy 58 58 Mathematics 39 39 HighschoolLanguageartsliteracy 73 73 Mathematics 55 55
2002-03 NCLB accountability results, applied to 2003-04 school year AYP outcomes and consequences Title I schools All schools All districtsMadeAYP 1,115(81%) 1,443(59%) n/aIdentifiedforimprovement:
Year1 14 (1%) 14 (1%) 0Year2 250(18%) 50 (2%) 0Correctiveaction 0 0 0Restructuring 0 0 0
Exitedimprovementstatus(madeAYPtwice 0 0 0aftermissingtwiceormore,includestotal“made”above)
Other indicator, 2002-03 State target State outcome
Elementary/Middleindicator:Attendance Meetorprogresstoward90% MetHighschoolindicator:Dropoutrate Reduceby.5%peryearuntilprioryear’s Met dropoutpercentageisreached
NCLB choice participation Number of Title I students Percent of eligible students
TitleIschoolchoice: 0 0Supplementaleducationalservices: 11,097 4%
Language arts literacyProficient level or above for: Grade 4 Grade 8 High schoolAllstudents 78% 74% 80%Economicallydisadvantagedstudents 58 48 57Migrantstudents 37 17 61Studentswithdisabilities 42 28 35StudentswithlimitedEnglishproficiency 31 14 18Black,non-Hispanicstudents 58 48 61Hispanicstudents 63 55 63White,non-Hispanicstudents 87 85 88
Studentachievementtrend:Languageartsliteracypercentproficientlevelorabove
0%
25%
50%
75%
100%80
7478 81
7379
747379
200320022001
HighSchoolGrade8Grade4
NewJersey
New Jersey Skills and Knowledge Assessment, Grade Eight Proficiency Assessment, and High School Proficiency Assessment used for NCLB accountability
73
MathematicsProficient level or above for: Grade 4 Grade 8 High schoolAllstudents 68% 57% 66%Economicallydisadvantagedstudents 47 30 36Migrantstudents 39 13 37Studentswithdisabilities 40 16 23StudentswithlimitedEnglishproficiency 34 19 22Black,non-Hispanicstudents 42 25 33Hispanicstudents 53 36 42White,non-Hispanicstudents 79 69 77
Studentachievementtrend:Mathematicspercentproficientlevelorabove
0%
25%
50%
75%
100%
6657
68 6958
6679
6266
200320022001
HighSchoolGrade8Grade4

Staff
Number of FTE 1993-94 2002-03teachers (CCD) Elementary Middle High Combined Other Total
Number of FTE non-teacher staff (CCD)
Instructionalaides Instructionalcoordinators Administrators Other Total
Percentage of teachers with a major in the main subject taught, grades 7-12 (SASS) 1994 2000 English Mathematics Science Socialstudies
Percentage of core courses taught by highly qualified teachers, 2002-03 (As defined and reported by states, collected by ED)
Students
Public school 1993-94 2002-03enrollment (CCD) Pre-K K-8 9-12 Total(K-12)
Race/ethnicity (CCD) AmericanIndian/AlaskanNative Asian/PacificIslander Black,non-Hispanic Hispanic White-non-Hispanic
Students with disabilities (OSEP)
Students with limited English proficiency (NCELA)
Migrant students (OME)
Eighth-grade students enrolled in 1996 2003Algebra I for high school credit (NAEP)
Students eligible to participate in the Free or Reduced- Price Lunch Program, 2002-03 (CCD) Outcomes
1993-94 2000-01High school dropout rate (NCES)
Avg. freshman graduation rate (NCES) College-going rate (IPEDS/NCES)
NAEP state results (NCES) Reading,Grade4 1994 2003 Proficientlevelorabove BasicleveloraboveMath,Grade8 1996 2003 Proficientlevelorabove Basiclevelorabove
Number of districts 1993-94 2002-03(CCD)
Number of public schools (CCD)
Elementary Middle High Combined Other Total
Number of charter schools (CCD)
Districts and schools
Number of schools, by percent of students eligible to participate in the Free or Reduced-Price Lunch Program, 2002-03 (CCD)
Sources of funding(CCD,2001-02)
Title I allocation 2001-02 (ED; Includes Title I, Part A)
Total current expenditures 1993-94 2001-02 (CCD,adjustedforinflationto2001-02,inthousands)
Instructional Noninstructional Support Total
Per-pupil expenditures (CCD,adjustedforinflationto2001-02)
KEY: * =Lessthan0.5percent — = NotapplicableK n/a = Notavailable # =Samplesizetoosmalltocalculate FTE =FullTimeEquivalent
Finances
9,029 10,279 4,020 4,685 4,338 5,657 54 218 964 334 18,404 21,172
4,066 5,158 468 660 1,278 1,849 12,478 14,987 18,290 22,654
76% 65% 69 52 71 55 60 39
1,933 3,529 224,354 220,967 87,768 95,767 312,122 316,734
10% 11% 1 1 2 2 46 52 40 34
12% 13%
25% 20%
1% 1%
22% 20%
182,469
8% 5% 67 66 54 59
21% 19% 49 48
14% 15% 51 52
88 89
420 444 139 163 125 161 9 24 15 9 708 801
27
NewMexico http://sde.state.nm.us
$82,193,013
$992,210 $1,232,319 97,902 101,976 604,163 869,870 1,694,275 2,204,165
$5,256 $6,882
74
0-34%
35-49%
50-74%
75-100%
86
245
314
155
77%
71%
77%Low-poverty schools
High-poverty schools
All schools
Federal14%
Local14%
State72%
^
^1schooldidnotreport.

S t u d e n t A c h i e v e m e n t 2 0 0 2 - 0 3S t a t e w i d e A c c o u n t a b i l i t y I n f o r m a t i o n
SeeAppendixBforNewMexico’sdefinitionsofproficientforreadingandmathematicsforgrades4,8,and10.
State assessment for NCLB accountability:–State student achievement levels: BeginningProficiency,NearingProficient,Proficient,Advanced
NCLB Accountability Goals 2001-02 Annual measurable Target objective starting point (2002-03)Grade4 Reading n/a n/a Mathematics n/a n/aGrade8 Reading n/a n/a Mathematics n/a n/a Grade10 Reading n/a n/a Mathematics n/a n/a
2002-03 NCLB accountability results, applied to 2003-04 school year AYP outcomes and consequences* Title I schools All schools All districtsMadeAYP n/a n/a n/aIdentifiedforimprovement:
Year1 n/a n/a n/aYear2 n/a n/a n/aCorrectiveaction n/a n/a n/aRestructuring n/a n/a n/a
Exitedimprovementstatus(madeAYPtwice n/a n/a n/aaftermissingtwiceormore,includestotal“made”above)
Other indicator, 2002-03 State Target State OutcomeElementaryindicator:n/a n/a n/aMiddleindicator:n/a n/a n/aHighschoolindicator:n/a n/a n/a
NCLB choice participation Number of Title I students Percent of eligible students TitleIschoolchoice: n/a n/aSupplementaleducationalservices: n/a n/a
*SomeAYPoutcomesforthisstatearenotavailableduetoissueswithdatacollection,measurement,orotherreasons.Formoreinformationpleasevisitthestate’sWebsite,above.
ReadingProficient level or above for: Grade 4 Grade 8 Grade 10Allstudents 70% 69% 91%Economicallydisadvantagedstudents 53 50 81Migrantstudents 35 33 51Studentswithdisabilities 44 41 70StudentswithlimitedEnglishproficiency 37 30 68Black,non-Hispanicstudents 63 63 91Hispanicstudents 64 61 88White,non-Hispanicstudents 83 84 98
Studentachievementtrend:Readingpercentproficientlevelorabove
0%
25%
50%
75%
100% 91
6970200320022001
Grade10Grade8Grade4
n/an/a
NewMexico
New Mexico Standards Based Assessment, not used for NCLB accountability
75
MathematicsProficient level or above for: Grade 4 Grade 8 Grade 10Allstudents 65% 64% 84%Economicallydisadvantagedstudents 49 45 71Migrantstudents 32 34 56Studentswithdisabilities 45 37 56StudentswithlimitedEnglishproficiency 36 30 60Black,non-Hispanicstudents 57 54 78Hispanicstudents 58 55 79White,non-Hispanicstudents 79 80 93
Studentachievementtrend:Mathematicspercentproficientlevelorabove
0%
25%
50%
75%
100%84
6465
200320022001
Grade10Grade8Grade4
n/an/a

Staff
Number of FTE 1993-94 2002-03teachers (CCD) Elementary Middle High Combined Other Total
Number of FTE non-teacher staff (CCD)
Instructionalaides Instructionalcoordinators Administrators Other Total
Percentage of teachers with a major in the main subject taught, grades 7-12 (SASS) 1994 2000 English Mathematics Science Socialstudies
Percentage of core courses taught by highly qualified teachers, 2002-03 (As defined and reported by states, collected by ED)
Students
Public school 1993-94 2002-03enrollment (CCD) Pre-K K-8 9-12 Total(K-12)
Race/ethnicity (CCD) AmericanIndian/AlaskanNative Asian/PacificIslander Black,non-Hispanic Hispanic White-non-Hispanic
Students with disabilities (OSEP)
Students with limited English proficiency (NCELA)
Migrant students (OME)
Eighth-grade students enrolled in 1996 2003Algebra I for high school credit (NAEP)
Students eligible to participate in the Free or Reduced- Price Lunch Program, 2002-03 (CCD) Outcomes
1993-94 2000-01High school dropout rate (NCES)
Avg. freshman graduation rate (NCES) College-going rate (IPEDS/NCES)
NAEP state results (NCES) Reading,Grade4 1994 2003 Proficientlevelorabove BasicleveloraboveMath,Grade8 1996 2003 Proficientlevelorabove Basiclevelorabove
Number of districts 1993-94 2002-03(CCD)
Number of public schools (CCD)
Elementary Middle High Combined Other Total
Number of charter schools (CCD)
Districts and schools
Number of schools, by percent of students eligible to participate in the Free or Reduced-Price Lunch Program, 2002-03 (CCD)
Sources of funding(CCD,2001-02)
Title I allocation 2001-02 (ED; Includes Title I, Part A)
Total current expenditures 1993-94 2001-02 (CCD,adjustedforinflationto2001-02,inthousands)
Instructional Noninstructional Support Total
Per-pupil expenditures (CCD,adjustedforinflationto2001-02)
KEY: * =Lessthan0.5percent — = NotapplicableK n/a = Notavailable # =Samplesizetoosmalltocalculate FTE =FullTimeEquivalent
Finances
82,229 61,708 32,788 28,471 42,222 38,080 5,027 5,253 17,147 77,414 179,413 210,926
26,272 42,479 2,176 2,167 9,755 11,366 135,987 161,100 174,190 217,112
89% 81% 84 79 85 86 87 95
31,687 41,752 1,813,727 1,901,889 743,933 802,393 2,557,660 2,704,282
* * 5% 6% 20 20 17 19 58 54
10% 12%
7% 6%
* 1%
10% 9%
484,488
n/a 4% 68% 62 70 64
27% 34% 57 67
22% 32% 61 71
714 703
2,423 2,521 669 758 710 797 135 152 139 242 4,076 4,470
37
NewYork http://www.nysed.gov
$1,027,698,775
$19,054,911 $22,001,202 801,393 866,866 8,384,585 9,350,907 28,240,888 32,218,975
$10,330 $11,218
76
0-34%
35-49%
50-74%
75-100%
460
354
240
2,031
Not Available
Federal6%
State48%
Local46%
^
^1,385schoolsdidnotreport.
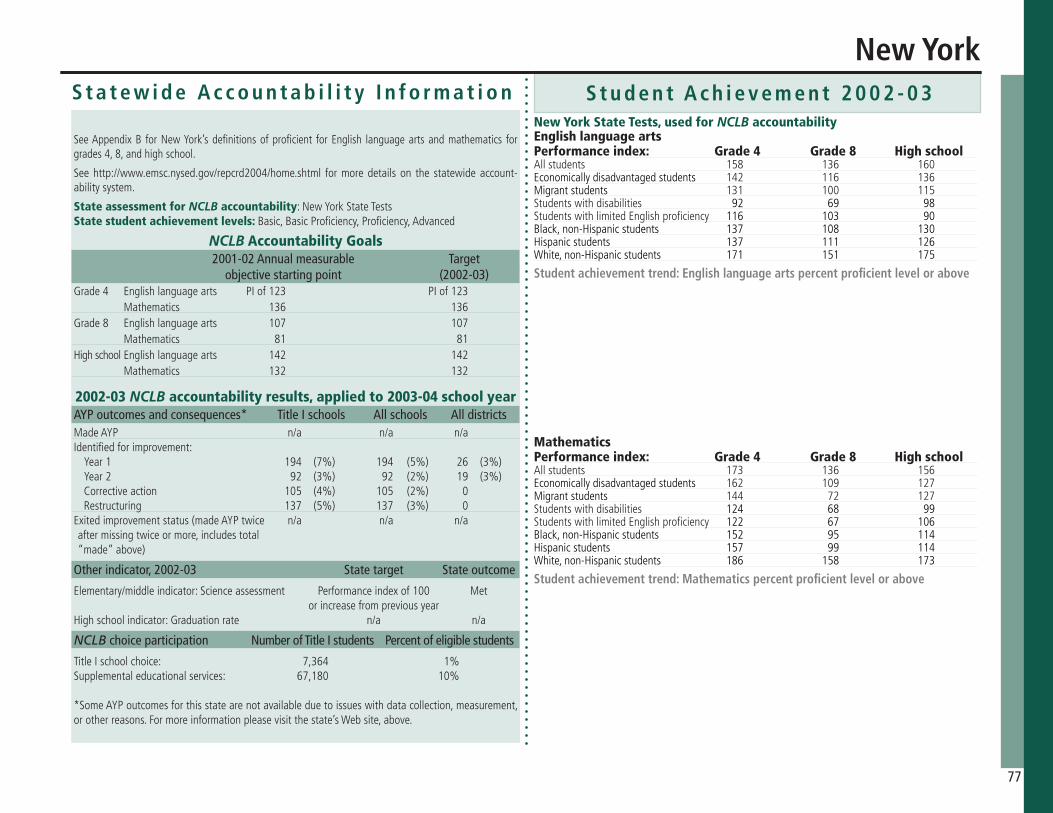
S t u d e n t A c h i e v e m e n t 2 0 0 2 - 0 3S t a t e w i d e A c c o u n t a b i l i t y I n f o r m a t i o n
SeeAppendixB forNewYork’sdefinitionsofproficient forEnglish languageartsandmathematics forgrades4,8,andhighschool.
Seehttp://www.emsc.nysed.gov/repcrd2004/home.shtml formoredetailson the statewideaccount-abilitysystem.
State assessment for NCLB accountability:NewYorkStateTestsState student achievement levels: Basic,BasicProficiency,Proficiency,Advanced
NCLB Accountability Goals 2001-02 Annual measurable Target objective starting point (2002-03)Grade4 Englishlanguagearts PIof123 PIof123 Mathematics 136 136Grade8 Englishlanguagearts 107 107 Mathematics 81 81 HighschoolEnglishlanguagearts 142 142 Mathematics 132 132
2002-03 NCLB accountability results, applied to 2003-04 school year AYP outcomes and consequences* Title I schools All schools All districtsMadeAYP n/a n/a n/aIdentifiedforimprovement:
Year1 194 (7%) 194 (5%) 26 (3%)Year2 92 (3%) 92 (2%) 19 (3%)Correctiveaction 105 (4%) 105 (2%) 0Restructuring 137 (5%) 137 (3%) 0
Exitedimprovementstatus(madeAYPtwice n/a n/a n/aaftermissingtwiceormore,includestotal“made”above)
Other indicator, 2002-03 State target State outcome
Elementary/middleindicator:Scienceassessment Performanceindexof100 Met orincreasefrompreviousyearHighschoolindicator:Graduationrate n/a n/a
NCLB choice participation Number of Title I students Percent of eligible students
TitleIschoolchoice: 7,364 1%Supplementaleducationalservices: 67,180 10%
*SomeAYPoutcomesforthisstatearenotavailableduetoissueswithdatacollection,measurement,orotherreasons.Formoreinformationpleasevisitthestate’sWebsite,above.
English language artsPerformance index: Grade 4 Grade 8 High schoolAllstudents 158 136 160Economicallydisadvantagedstudents 142 116 136Migrantstudents 131 100 115Studentswithdisabilities 92 69 98StudentswithlimitedEnglishproficiency 116 103 90Black,non-Hispanicstudents 137 108 130Hispanicstudents 137 111 126White,non-Hispanicstudents 171 151 175
Studentachievementtrend:Englishlanguageartspercentproficientlevelorabove
NewYork
New York State Tests, used for NCLB accountability
77
MathematicsPerformance index: Grade 4 Grade 8 High schoolAllstudents 173 136 156Economicallydisadvantagedstudents 162 109 127Migrantstudents 144 72 127Studentswithdisabilities 124 68 99StudentswithlimitedEnglishproficiency 122 67 106Black,non-Hispanicstudents 152 95 114Hispanicstudents 157 99 114White,non-Hispanicstudents 186 158 173
Studentachievementtrend:Mathematicspercentproficientlevelorabove
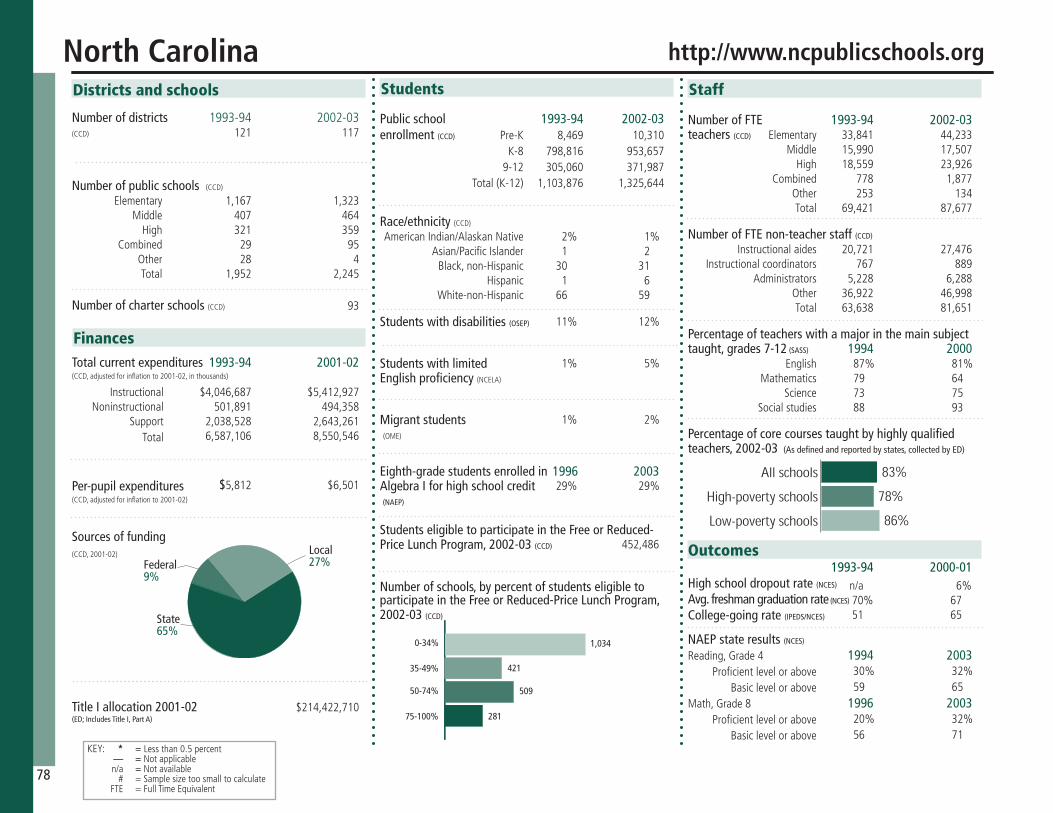
Staff
Number of FTE 1993-94 2002-03teachers (CCD) Elementary Middle High Combined Other Total
Number of FTE non-teacher staff (CCD)
Instructionalaides Instructionalcoordinators Administrators Other Total
Percentage of teachers with a major in the main subject taught, grades 7-12 (SASS) 1994 2000 English Mathematics Science Socialstudies
Percentage of core courses taught by highly qualified teachers, 2002-03 (As defined and reported by states, collected by ED)
Students
Public school 1993-94 2002-03enrollment (CCD) Pre-K K-8 9-12 Total(K-12)
Race/ethnicity (CCD) AmericanIndian/AlaskanNative Asian/PacificIslander Black,non-Hispanic Hispanic White-non-Hispanic
Students with disabilities (OSEP)
Students with limited English proficiency (NCELA)
Migrant students (OME)
Eighth-grade students enrolled in 1996 2003Algebra I for high school credit (NAEP)
Students eligible to participate in the Free or Reduced- Price Lunch Program, 2002-03 (CCD) Outcomes
1993-94 2000-01High school dropout rate (NCES)
Avg. freshman graduation rate (NCES) College-going rate (IPEDS/NCES)
NAEP state results (NCES) Reading,Grade4 1994 2003 Proficientlevelorabove BasicleveloraboveMath,Grade8 1996 2003 Proficientlevelorabove Basiclevelorabove
Number of districts 1993-94 2002-03(CCD)
Number of public schools (CCD)
Elementary Middle High Combined Other Total
Number of charter schools (CCD)
Districts and schools
Number of schools, by percent of students eligible to participate in the Free or Reduced-Price Lunch Program, 2002-03 (CCD)
Sources of funding(CCD,2001-02)
Title I allocation 2001-02 (ED; Includes Title I, Part A)
Total current expenditures 1993-94 2001-02 (CCD,adjustedforinflationto2001-02,inthousands)
Instructional Noninstructional Support Total
Per-pupil expenditures (CCD,adjustedforinflationto2001-02)
KEY: * =Lessthan0.5percent — = NotapplicableK n/a = Notavailable # =Samplesizetoosmalltocalculate FTE =FullTimeEquivalent
Finances
33,841 44,233 15,990 17,507 18,559 23,926 778 1,877 253 134 69,421 87,677
20,721 27,476 767 889 5,228 6,288 36,922 46,998 63,638 81,651
87% 81% 79 64 73 75 88 93
8,469 10,310 798,816 953,657 305,060 371,987 1,103,876 1,325,644
2% 1% 1 2 30 31 1 6 66 59
11% 12%
1% 5%
1% 2%
29% 29%
452,486
n/a 6% 70% 67 51 65
30% 32% 59 65
20% 32% 56 71
121 117
1,167 1,323 407 464 321 359 29 95 28 4 1,952 2,245
93
NorthCarolina http://www.ncpublicschools.org
$214,422,710
$4,046,687 $5,412,927 501,891 494,358 2,038,528 2,643,261 6,587,106 8,550,546
$5,812 $6,501
78
0-34%
35-49%
50-74%
75-100%
421
509
281
1,034
83%
78%
86%Low-poverty schools
High-poverty schools
All schools
Federal9%
State65%
Local27%

S t u d e n t A c h i e v e m e n t 2 0 0 2 - 0 3S t a t e w i d e A c c o u n t a b i l i t y I n f o r m a t i o n
SeeAppendixBforNorthCarolina’sdefinitionsofproficientforreadingandmathematicsforgrades4,8,andhighschool.
Seehttp://www.ncreportcards.org/src/stateDetails.jsp?Page=1&pYear=2003-2004formoredetailsonthestatewideaccountabilitysystem.
State assessment for NCLB accountability:End-of-GradeMathematics/ReadingState student achievement levels: LevelI,LevelII,LevelIII,LevelIV
NCLB Accountability Goals 2001-02 Annual measurable Target objective starting point (2002-03)Grade4 Reading 68.9% 68.9% Mathematics 74.6 74.6Grade8 Reading 68.9 68.9 Mathematics 74.6 74.6 HighschoolReading 52 52 Mathematics 54.9 54.9
2002-03 NCLB accountability results, applied to 2003-04 school year AYP outcomes and consequences* Title I schools All schools All districtsMadeAYP 617(55%) 1,031(47%) 2 (2%)Identifiedforimprovement:
Year1 36 (3%) 1,195(53%) 115(54%)Year2 0 0 0Correctiveaction 0 0 0Restructuring 0 0 0
Exitedimprovementstatus(madeAYPtwice n/a n/a n/aaftermissingtwiceormore,includestotal“made”above)
Other indicator, 2002-03 State target State outcome
Elementary/Middleindicator:Attendance Meetoratleast.1%progress Met toward90%Highschoolindicator:Graduationrate Meetoratleast.1%progress Met toward90%.
NCLB choice participation Number of Title I students Percent of eligible students
TitleIschoolchoice: 337 *Supplementaleducationalservices: 362 *
*SomeAYPoutcomesforthisstatearenotavailableduetoissueswithdatacollection,measurement,orotherreasons.Formoreinformationpleasevisitthestate’sWebsite,above.
ReadingProficient level or above for: Grade 4 Grade 8 High schoolAllstudents 81% 86% 64%Economicallydisadvantagedstudents 70 74 43Migrantstudents 60 57 27Studentswithdisabilities 48 50 21StudentswithlimitedEnglishproficiency 48 41 25Black,non-Hispanicstudents 71 76 43Hispanicstudents 64 65 44White,non-Hispanicstudents 89 92 75
Studentachievementtrend:Readingpercentproficientlevelorabove
0%
25%
50%
75%
100%
64
868169
8577
6883
74200320022001
HighSchoolGrade8Grade4
NorthCarolina
North Carolina End-of-Grade/Course Tests, used for NCLB accountability
79
MathematicsProficient level or above for: Grade 4 Grade 8 High schoolAllstudents 92% 82% 69%Economicallydisadvantagedstudents 87 70 50Migrantstudents 80 64 44Studentswithdisabilities 71 46 26StudentswithlimitedEnglishproficiency 72 52 41Black,non-Hispanicstudents 87 69 48Hispanicstudents 82 68 53White,non-Hispanicstudents 95 90 79
Studentachievementtrend:Mathematicspercentproficientlevelorabove
0%
25%
50%
75%
100%
6982
92798389
768087 200320022001
HighSchoolGrade8Grade4

Staff
Number of FTE 1993-94 2002-03teachers (CCD) Elementary Middle High Combined Other Total
Number of FTE non-teacher staff (CCD)
Instructionalaides Instructionalcoordinators Administrators Other Total
Percentage of teachers with a major in the main subject taught, grades 7-12 (SASS) 1994 2000 English Mathematics Science Socialstudies
Percentage of core courses taught by highly qualified teachers, 2002-03 (As defined and reported by states, collected by ED)
Students
Public school 1993-94 2002-03enrollment (CCD) Pre-K K-8 9-12 Total(K-12)
Race/ethnicity (CCD) AmericanIndian/AlaskanNative Asian/PacificIslander Black,non-Hispanic Hispanic White-non-Hispanic
Students with disabilities (OSEP)
Students with limited English proficiency (NCELA)
Migrant students (OME)
Eighth-grade students enrolled in 1996 2003Algebra I for high school credit (NAEP)
Students eligible to participate in the Free or Reduced- Price Lunch Program, 2002-03 (CCD) Outcomes
1993-94 2000-01High school dropout rate (NCES)
Avg. freshman graduation rate (NCES) College-going rate (IPEDS/NCES)
NAEP state results (NCES) Reading,Grade4 1994 2003 Proficientlevelorabove BasicleveloraboveMath,Grade8 1996 2003 Proficientlevelorabove Basiclevelorabove
Number of districts 1993-94 2002-03(CCD)
Number of public schools (CCD)
Elementary Middle High Combined Other Total
Number of charter schools (CCD)
Districts and schools
Number of schools, by percent of students eligible to participate in the Free or Reduced-Price Lunch Program, 2002-03 (CCD)
Sources of funding(CCD,2001-02)
Title I allocation 2001-02 (ED; Includes Title I, Part A)
Total current expenditures 1993-94 2001-02 (CCD,adjustedforinflationto2001-02,inthousands)
Instructional Noninstructional Support Total
Per-pupil expenditures (CCD,adjustedforinflationto2001-02)
KEY: * =Lessthan0.5percent — = NotapplicableK n/a = Notavailable # =Samplesizetoosmalltocalculate FTE =FullTimeEquivalent
Finances
3,974 3,880 848 1,031 2,716 2,799 94 19 123 349 7,755 8,078
1,290 1,798 58 126 654 829 4,023 4,259 6,025 7,012
80% 66% 87 83 85 85 77 74
615 773 83,512 68,316 35,000 35,136 118,512 103,452
6% 8% 1 1 1 1 1 1 91 89
9% 12%
7% 6%
1% 1%
20% 18%
29,270
3% 2% 88 85 68 69
38% 32% 73 69
33% 36% 77 81
251 222
352 306 34 38 204 181 9 1 2 2 601 528
n/a
NorthDakota http://www.dpi.state.nd.us
$26,529,973
$410,032 $436,583 57,624 54,996 201,080 219,585 668,736 711,164
$5,614 $6,709
80
0-34%
35-49%
50-74%
75-100%
131
75
22
300
91%
94%
91%Low-poverty schools
High-poverty schools
All schools
Federal14%
State38%
Local48%

S t u d e n t A c h i e v e m e n t 2 0 0 2 - 0 3S t a t e w i d e A c c o u n t a b i l i t y I n f o r m a t i o n
SeeAppendixBforNorthDakota’sdefinitionsofproficientforreadingandmathematicsforgrades4,8,andhighschool.
Seehttp://www.dpi.state.nd.us/dpi/reports/profile/0304/ProfileDistrict/99999.pdfformoredetailsonthestatewideaccountabilitysystem.
State assessment for NCLB accountability:NorthDakotaStateAssessmentState student achievement levels: Novice,PartiallyProficient,Proficient,Advanced
NCLB Accountability Goals 2001-02 Annual measurable Target objective starting point (2002-03)Grade4 Reading 65.1% 68% Mathematics 45.7 50.2Grade8 Reading 64.1 64.6 Mathematics 33.3 38.9 HighschoolReading 42.9 47.7 Mathematics 24.1 30.4
2002-03 NCLB accountability results, applied to 2003-04 school year AYP outcomes and consequences* Title I schools All schools All districtsMadeAYP n/a 451(91%) 178(89%)Identifiedforimprovement:
Year1 23 (5%) 23 (5%) 0Year2 1 (*) 1 (*) 0Correctiveaction 22 (4%) 22 (4%) 0Restructuring 0 0 0
Exitedimprovementstatus(madeAYPtwice 6 (1%) 6 (1%) 0aftermissingtwiceormore,includestotal“made”above)
Other indicator, 2002-03 State target State outcome
Elementaryindicator:Attendance 93% Met Middleindicator:Attendance 93% MetHighschoolindicator:Graduationrate 89.90% Met
NCLB choice participation Number of Title I students Percent of eligible students
TitleIschoolchoice: 0 0Supplementaleducationalservices: 118 1%
*SomeAYPoutcomesforthisstatearenotavailableduetoissueswithdatacollection,measurement,orotherreasons.Formoreinformationpleasevisitthestate’sWebsite,above.
ReadingProficient level or above for: Grade 4 Grade 8 High schoolAllstudents 74% 69% 52%Economicallydisadvantagedstudents 64 55 36Migrantstudents n/a 42 n/aStudentswithdisabilities 38 22 9StudentswithlimitedEnglishproficiency 39 22 7Black,non-Hispanicstudents 67 58 24Hispanicstudents 56 58 36White,non-Hispanicstudents 77 72 54
Studentachievementtrend:Readingpercentproficientlevelorabove
0%
25%
50%
75%
100%
5259
74
49
6774200320022001
HighSchoolGrade8Grade4
n/a
NorthDakota
North Dakota State Assessment, used for NCLB accountability
81
MathematicsProficient level or above for: Grade 4 Grade 8 High schoolAllstudents 58% 44% 33%Economicallydisadvantagedstudents 45 29 18Migrantstudents n/a 8 n/aStudentswithdisabilities 24 7 <5StudentswithlimitedEnglishproficiency 22 9 8Black,non-Hispanicstudents 40 23 10Hispanicstudents 42 26 17White,non-Hispanicstudents 61 47 34
Studentachievementtrend:Mathematicspercentproficientlevelorabove
0%
25%
50%
75%
100%
3344
58
3442
57
200320022001
HighSchoolGrade8Grade4
n/a
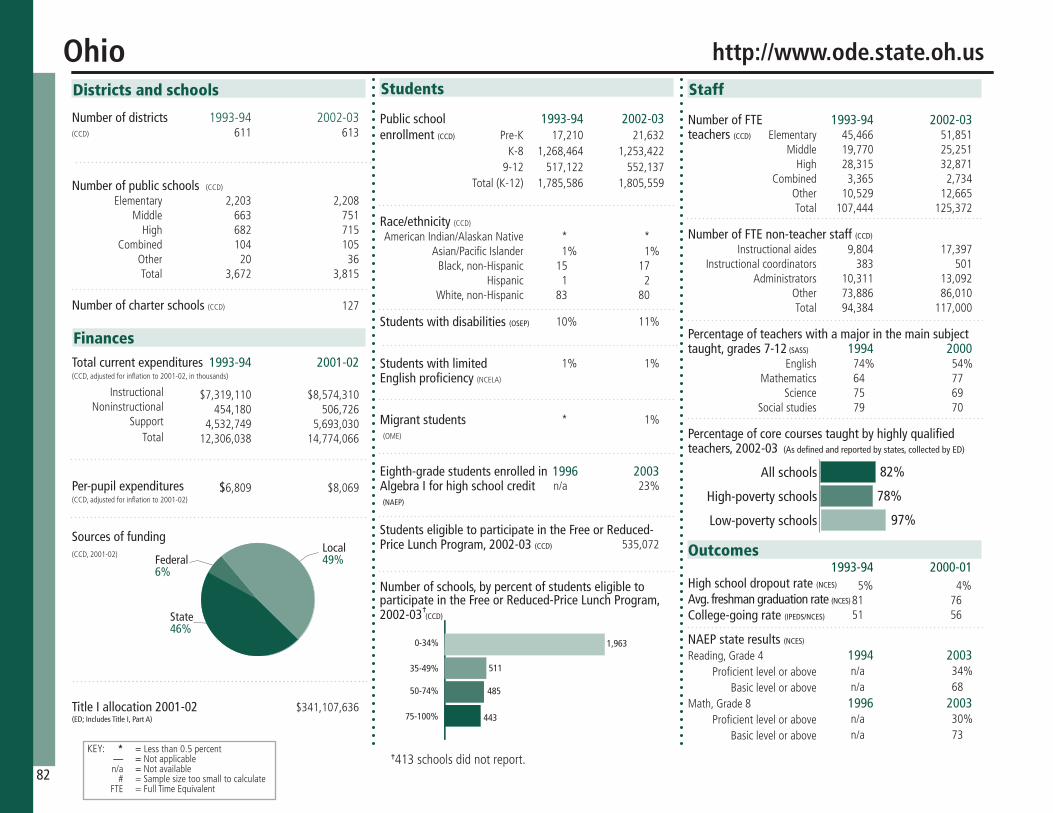
Staff
Number of FTE 1993-94 2002-03teachers (CCD) Elementary Middle High Combined Other Total
Number of FTE non-teacher staff (CCD)
Instructionalaides Instructionalcoordinators Administrators Other Total
Percentage of teachers with a major in the main subject taught, grades 7-12 (SASS) 1994 2000 English Mathematics Science Socialstudies
Percentage of core courses taught by highly qualified teachers, 2002-03 (As defined and reported by states, collected by ED)
Students
Public school 1993-94 2002-03enrollment (CCD) Pre-K K-8 9-12 Total(K-12)
Race/ethnicity (CCD) AmericanIndian/AlaskanNative Asian/PacificIslander Black,non-Hispanic Hispanic White,non-Hispanic
Students with disabilities (OSEP)
Students with limited English proficiency (NCELA)
Migrant students (OME)
Eighth-grade students enrolled in 1996 2003Algebra I for high school credit (NAEP)
Students eligible to participate in the Free or Reduced- Price Lunch Program, 2002-03 (CCD) Outcomes
1993-94 2000-01High school dropout rate (NCES)
Avg. freshman graduation rate (NCES) College-going rate (IPEDS/NCES)
NAEP state results (NCES) Reading,Grade4 1994 2003 Proficientlevelorabove BasicleveloraboveMath,Grade8 1996 2003 Proficientlevelorabove Basiclevelorabove
Number of districts 1993-94 2002-03(CCD)
Number of public schools (CCD)
Elementary Middle High Combined Other Total
Number of charter schools (CCD)
Districts and schools
Number of schools, by percent of students eligible to participate in the Free or Reduced-Price Lunch Program, 2002-03 (CCD)
Sources of funding(CCD,2001-02)
Title I allocation 2001-02 (ED; Includes Title I, Part A)
Total current expenditures 1993-94 2001-02 (CCD,adjustedforinflationto2001-02,inthousands)
Instructional Noninstructional Support Total
Per-pupil expenditures (CCD,adjustedforinflationto2001-02)
KEY: * =Lessthan0.5percent — = NotapplicableK n/a = Notavailable # =Samplesizetoosmalltocalculate FTE =FullTimeEquivalent
Finances
45,466 51,851 19,770 25,251 28,315 32,871 3,365 2,734 10,529 12,665 107,444 125,372
9,804 17,397 383 501 10,311 13,092 73,886 86,010 94,384 117,000
74% 54% 64 77 75 69 79 70
17,210 21,632 1,268,464 1,253,422 517,122 552,137 1,785,586 1,805,559
* * 1% 1% 15 17 1 2 83 80
10% 11%
1% 1%
* 1%
n/a 23%
535,072
5% 4% 81 76 51 56
n/a 34% n/a 68
n/a 30% n/a 73
611 613
2,203 2,208 663 751 682 715 104 105 20 36 3,672 3,815
127
Ohio http://www.ode.state.oh.us
$341,107,636
$7,319,110 $8,574,310 454,180 506,726 4,532,749 5,693,030 12,306,038 14,774,066
$6,809 $8,069
82
0-34%
35-49%
50-74%
75-100%
511
485
443
1,963
82%
78%
97%Low-poverty schools
High-poverty schools
All schools
Federal6%
State46%
Local49%
^
^413schoolsdidnotreport.

S t u d e n t A c h i e v e m e n t 2 0 0 2 - 0 3S t a t e w i d e A c c o u n t a b i l i t y I n f o r m a t i o n
SeeAppendixBforOhio’sdefinitionsofproficientforreadingandmathematicsforgrades4,6,and9.
Seehttp://www.ode.state.oh.us/reportcard/state_report_card/src2004.pdfformoredetailsonthestatewideaccountabilitysystem.
State assessment for NCLB accountability:OhioProficiencyTestState student achievement levels: BelowBasic,Basic,Proficient,Advanced
NCLB Accountability Goals 2001-02 Annual measurable Target objective starting point (2002-03)Grade4 Reading 40.5% 40.5% Mathematics 35.9 35.9Grade6 Reading 36 36 Mathematics 36.8 36.8 Grade9 Reading 78 78 Mathematics 53.1 53.1
2002-03 NCLB accountability results, applied to 2003-04 school year AYP outcomes and consequences* Title I schools All schools All districtsMadeAYP 2,027(78%) 3,031(80%) 294(48%)Identifiedforimprovement:
Year1 71 (3%) 71 (2%) 0Year2 37 (1%) 37 (1%) 0Correctiveaction 47 (2%) 47 (1%) 0Restructuring 34 (1%) 34 (*) 0
Exitedimprovementstatus(madeAYPtwice n/a n/a n/aaftermissingtwiceormore,includestotal“made”above)
Other indicator, 2002-03 State target State outcome
Elementaryindicator:Attendance 93% MetMiddleindicator:Attendance 93% MetHighschoolindicator:Graduationrate 73.6% Met
NCLB choice participation Number of Title I students Percent of eligible students
TitleIschoolchoice: 1,300 *Supplementaleducationalservices: 3,508 1%
*SomeAYPoutcomesforthisstatearenotavailableduetoissueswithdatacollection,measurement,orotherreasons.Formoreinformationpleasevisitthestate’sWebsite,above.
ReadingProficient level or above for: Grade 4 Grade 6 Grade 9Allstudents 66% 65% 87%Economicallydisadvantagedstudents 49 46 75Migrantstudents 27 26 45Studentswithdisabilities 36 30 51StudentswithlimitedEnglishproficiency 42 32 51Black,non-Hispanicstudents 44 40 75Hispanicstudents 54 48 75White,non-Hispanicstudents 72 71 90
Studentachievementtrend:Readingpercentproficientlevelorabove
0%
25%
50%
75%
100%87
6566 5666 5856
200320022001
Grade9Grade6Grade4n/an/a
Ohio
Ohio Proficiency Test, used for NCLB accountability
83
MathematicsProficient level or above for: Grade 4 Grade 6 Grade 9Allstudents 59% 53% 71%Economicallydisadvantagedstudents 40 32 51Migrantstudents 25 24 35Studentswithdisabilities 34 25 36StudentswithlimitedEnglishproficiency 42 36 45Black,non-Hispanicstudents 32 25 42Hispanicstudents 46 41 53White,non-Hispanicstudents 65 59 78
Studentachievementtrend:Mathematicspercentproficientlevelorabove
0%
25%
50%
75%
100%
715359 5962 6159
200320022001
Grade9Grade6Grade4n/an/a
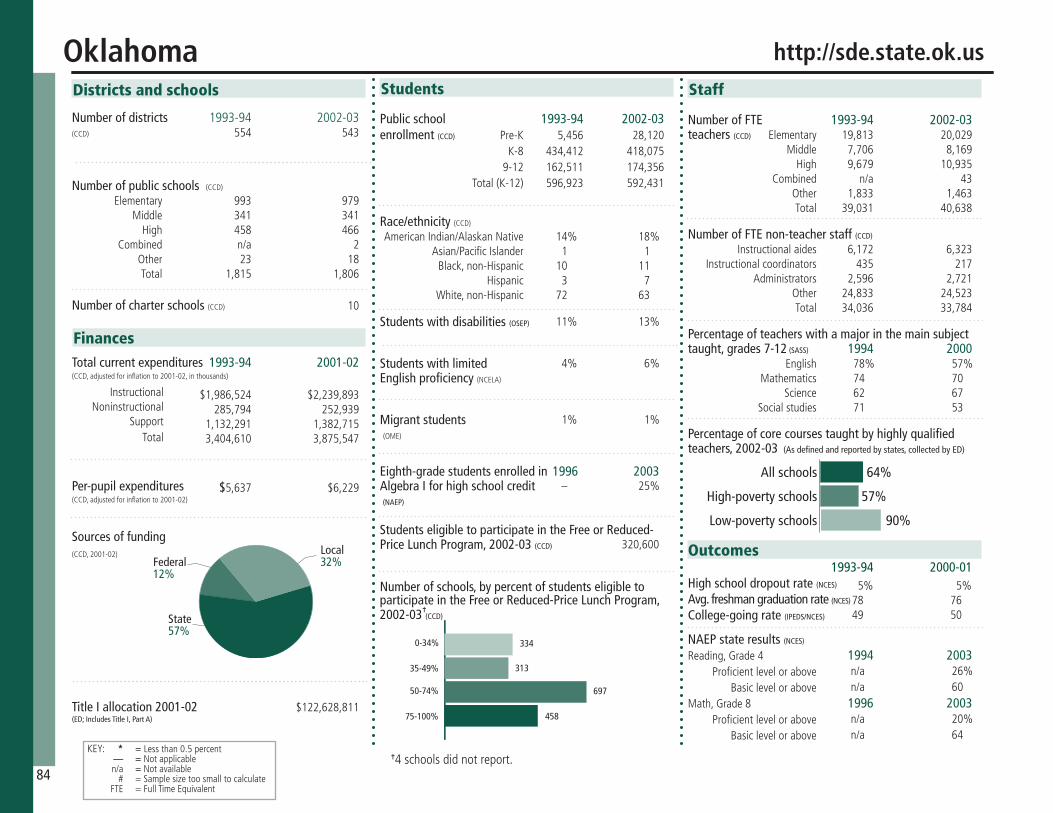
Staff
Number of FTE 1993-94 2002-03teachers (CCD) Elementary Middle High Combined Other Total
Number of FTE non-teacher staff (CCD)
Instructionalaides Instructionalcoordinators Administrators Other Total
Percentage of teachers with a major in the main subject taught, grades 7-12 (SASS) 1994 2000 English Mathematics Science Socialstudies
Percentage of core courses taught by highly qualified teachers, 2002-03 (As defined and reported by states, collected by ED)
Students
Public school 1993-94 2002-03enrollment (CCD) Pre-K K-8 9-12 Total(K-12)
Race/ethnicity (CCD) AmericanIndian/AlaskanNative Asian/PacificIslander Black,non-Hispanic Hispanic White,non-Hispanic
Students with disabilities (OSEP)
Students with limited English proficiency (NCELA)
Migrant students (OME)
Eighth-grade students enrolled in 1996 2003Algebra I for high school credit (NAEP)
Students eligible to participate in the Free or Reduced- Price Lunch Program, 2002-03 (CCD) Outcomes
1993-94 2000-01High school dropout rate (NCES)
Avg. freshman graduation rate (NCES) College-going rate (IPEDS/NCES)
NAEP state results (NCES) Reading,Grade4 1994 2003 Proficientlevelorabove BasicleveloraboveMath,Grade8 1996 2003 Proficientlevelorabove Basiclevelorabove
Number of districts 1993-94 2002-03(CCD)
Number of public schools (CCD)
Elementary Middle High Combined Other Total
Number of charter schools (CCD)
Districts and schools
Number of schools, by percent of students eligible to participate in the Free or Reduced-Price Lunch Program, 2002-03 (CCD)
Sources of funding(CCD,2001-02)
Title I allocation 2001-02 (ED; Includes Title I, Part A)
Total current expenditures 1993-94 2001-02 (CCD,adjustedforinflationto2001-02,inthousands)
Instructional Noninstructional Support Total
Per-pupil expenditures (CCD,adjustedforinflationto2001-02)
KEY: * =Lessthan0.5percent — = NotapplicableK n/a = Notavailable # =Samplesizetoosmalltocalculate FTE =FullTimeEquivalent
Finances
19,813 20,029 7,706 8,169 9,679 10,935 n/a 43 1,833 1,463 39,031 40,638
6,172 6,323 435 217 2,596 2,721 24,833 24,523 34,036 33,784
78% 57% 74 70 62 67 71 53
5,456 28,120 434,412 418,075 162,511 174,356 596,923 592,431
14% 18% 1 1 10 11 3 7 72 63
11% 13%
4% 6%
1% 1%
– 25%
320,600
5% 5% 78 76 49 50
n/a 26% n/a 60
n/a 20% n/a 64
554 543
993 979 341 341 458 466 n/a 2 23 18 1,815 1,806
10
Oklahoma http://sde.state.ok.us
$122,628,811
$1,986,524 $2,239,893 285,794 252,939 1,132,291 1,382,715 3,404,610 3,875,547
$5,637 $6,229
84
0-34%
35-49%
50-74%
75-100%
313
697
458
334
64%
57%
90%Low-poverty schools
High-poverty schools
All schools
Federal12%
State57%
Local32%
^
^4schoolsdidnotreport.

S t u d e n t A c h i e v e m e n t 2 0 0 2 - 0 3S t a t e w i d e A c c o u n t a b i l i t y I n f o r m a t i o n
SeeAppendixBforOklahoma’sdefinitionsofproficientforreadingandmathematicsforgrades5,8,andhighschool.
Seehttp://sde.state.ok.us/home/defaultie.htmlformoredetailsonthestatewideaccountabilitysystem.
State assessment for NCLB accountability:OklahomaCoreCurriculumTestsState student achievement levels: Unsatisfactory,LimitedKnowledge,Satisfactory,Advanced
NCLB Accountability Goals 2001-02 Annual measurable Target objective starting point (2002-03)Grade5 Reading API:622 API:622 Mathematics 648 648Grade8 Reading 622 622 Mathematics 648 648 HighschoolReading 622 622 Mathematics 648 648
2002-03 NCLB accountability results, applied to 2003-04 school year AYP outcomes and consequences* Title I schools All schools All districtsMadeAYP 828(75%) 1,416 (79%) 164(30%)Identifiedforimprovement:
Year1 23 (2%) 28 (2%) 0Year2 2 (*) 2 (*) 0Correctiveaction 8 (1%) 8 (*) 0Restructuring 10 (1%) 11 (1%) 0
Exitedimprovementstatus(madeAYPtwice n/a 9 (1%) n/aaftermissingtwiceormore,includestotal“made”above)
Other indicator, 2002-03 State target State outcome
Elementaryindicator:Attendance Meetorprogresstoward91.2% MetMiddleindicator:Attendance Meetorprogresstoward91.2% MetHighschoolindicator:Graduationrate Meetorprogresstoward68.8% Met
NCLB choice participation Number of Title I students Percent of eligible students
TitleIschoolchoice: 714 *Supplementaleducationalservices: 1,467 1%
*SomeAYPoutcomesforthisstatearenotavailableduetoissueswithdatacollection,measurement,orotherreasons.Formoreinformationpleasevisitthestate’sWebsite,above.
ReadingProficient level or above for: Grade 5 Grade 8 High schoolAllstudents 65% 71% 56%Economicallydisadvantagedstudents 64 68 48Migrantstudents 59 74 28Studentswithdisabilities 19 22 10StudentswithlimitedEnglishproficiency 38 41 19Black,non-Hispanicstudents 52 57 37Hispanicstudents 59 63 44White,non-Hispanicstudents 80 84 68
Studentachievementtrend:Readingpercentproficientlevelorabove
0%
25%
50%
75%
100%
567165 62
7063 647066
200320022001
HighSchoolGrade8Grade5
Oklahoma
Oklahoma Core Curriculum Tests, used for NCLB accountability
85
MathematicsProficient level or above for: Grade 5 Grade 8 High schoolAllstudents 65% 65% 13%Economicallydisadvantagedstudents 63 61 9Migrantstudents 69 61 6Studentswithdisabilities 23 18 <5StudentswithlimitedEnglishproficiency 48 43 7Black,non-Hispanicstudents 50 48 5Hispanicstudents 64 59 8White,non-Hispanicstudents 78 78 17
Studentachievementtrend:Mathematicspercentproficientlevelorabove
0%
25%
50%
75%
100%
13
6565 6463 6364
200320022001
HighSchoolGrade8Grade5n/an/a

Staff
Number of FTE 1993-94 2002-03teachers (CCD) Elementary Middle High Combined Other Total
Number of FTE non-teacher staff (CCD)
Instructionalaides Instructionalcoordinators Administrators Other Total
Percentage of teachers with a major in the main subject taught, grades 7-12 (SASS) 1994 2000 English Mathematics Science Socialstudies
Percentage of core courses taught by highly qualified teachers, 2002-03 (As defined and reported by states, collected by ED)
Students
Public school 1993-94 2002-03enrollment (CCD) Pre-K K-8 9-12 Total(K-12)
Race/ethnicity (CCD) AmericanIndian/AlaskanNative Asian/PacificIslander Black,non-Hispanic Hispanic White,non-Hispanic
Students with disabilities (OSEP)
Students with limited English proficiency (NCELA)
Migrant students (OME)
Eighth-grade students enrolled in 1996 2003Algebra I for high school credit (NAEP)
Students eligible to participate in the Free or Reduced- Price Lunch Program, 2002-03 (CCD) Outcomes
1993-94 2000-01High school dropout rate (NCES)
Avg. freshman graduation rate (NCES) College-going rate (IPEDS/NCES)
NAEP state results (NCES) Reading,Grade4 1994 2003 Proficientlevelorabove BasicleveloraboveMath,Grade8 1996 2003 Proficientlevelorabove Basiclevelorabove
Number of districts 1993-94 2002-03(CCD)
Number of public schools (CCD)
Elementary Middle High Combined Other Total
Number of charter schools (CCD)
Districts and schools
Number of schools, by percent of students eligible to participate in the Free or Reduced-Price Lunch Program, 2002-03 (CCD)
Sources of funding(CCD,2001-02)
Title I allocation 2001-02 (ED; Includes Title I, Part A)
Total current expenditures 1993-94 2001-02 (CCD,adjustedforinflationto2001-02,inthousands)
Instructional Noninstructional Support Total
Per-pupil expenditures (CCD,adjustedforinflationto2001-02)
KEY: * =Lessthan0.5percent — = NotapplicableK n/a = Notavailable # =Samplesizetoosmalltocalculate FTE =FullTimeEquivalent
Finances
12,635 12,309 5,246 5,886 7,273 7,917 493 496 841 518 26,488 27,126
5,236 8,313 338 434 2,292 2,298 16,038 16,871 23,904 27,916
61% 68% 61 60 93 74 79 57
837 420 365,488 378,573 147,819 168,902 513,307 547,475
2% 2% 3 4 2 3 6 12 87 78
10% 11%
4% 9%
5% 7%
28% 25%
211,674
7% 5% 73 68 57 51
n/a 31% n/a 64
26% 32% 67 70
271 198
758 747 198 221 206 244 40 45 13 5 1,215 1,262
21
Oregon http://www.ode.state.or.us
$94,338,878
$2,187,431 $2,476,323 124,060 141,139 1,340,531 1,597,050 3,652,023 4,214,512
$7,069 $7,642
86
0-34%
35-49%
50-74%
75-100%
291
366
93
461
82%
72%
86%Low-poverty schools
High-poverty schools
All schools
Federal8%
State56%
Local36%
^
^51schoolsdidnotreport.

S t u d e n t A c h i e v e m e n t 2 0 0 2 - 0 3S t a t e w i d e A c c o u n t a b i l i t y I n f o r m a t i o n
SeeAppendixBforOregon’sdefinitionsofproficientforreadingandmathematicsforgrades3,8,andhighschool.
Seehttp://www.ode.state.or.us/data/annreportcard/rptcard2004.pdfformoredetailsonthestatewideaccountabilitysystem.
State assessment for NCLB accountability:OregonStateAssessmentsState student achievement levels: VeryLow,Low,NearlyMeets,MeetsStandards,ExceedsStandards
NCLB Accountability Goals 2001-02 Annual measurable Target objective starting point (2002-03)Grade3 Reading 40% 40% Mathematics 39 39Grade8 Reading 40 40 Mathematics 39 39 HighschoolReading 40 40 Mathematics 39 39
2002-03 NCLB accountability results, applied to 2003-04 school year AYP outcomes and consequences Title I schools All schools All districtsMadeAYP 446(82%) 839(72%) 101(51%)Identifiedforimprovement:
Year1 2 (*) 2 (*) 1 (1%)Year2 3 (*) 3 (1%) 1 (1%)Correctiveaction 2 (*) 2 (*) 0Restructuring 0 0 0
Exitedimprovementstatus(madeAYPtwice 0 0 0aftermissingtwiceormore,includestotal“made”above)
Other indicator, 2002-03 State target State outcome
Elementaryindicator:Attendance 92% n/aMiddleindicator:Attendance 92% n/aHighschoolindicator:Graduationrate 68.1% Met
NCLB choice participation Number of Title I students Percent of eligible students
TitleIschoolchoice: 873 1%Supplementaleducationalservices: 537 *
ReadingProficient level or above for: Grade 3 Grade 8 High schoolAllstudents 83% 60% 52%Economicallydisadvantagedstudents 77 41 30Migrantstudents 50 22 12Studentswithdisabilities 49 17 12StudentswithlimitedEnglishproficiency 53 22 10Black,non-Hispanicstudents 77 40 26Hispanicstudents 60 32 22White,non-Hispanicstudents 87 65 56
Studentachievementtrend:Readingpercentproficientlevelorabove
0%
25%
50%
75%
100%
5260
83
5364
85
5262
84 200320022001
HighSchoolGrade8Grade3
Oregon
Oregon State Assessments, used for NCLB accountability
87
MathematicsProficient level or above for: Grade 3 Grade 8 High schoolAllstudents 78% 59% 45%Economicallydisadvantagedstudents 70 39 23Migrantstudents 48 24 12Studentswithdisabilities 51 17 9StudentswithlimitedEnglishproficiency 51 28 15Black,non-Hispanicstudents 64 63 20Hispanicstudents 55 31 17White,non-Hispanicstudents 83 63 48
Studentachievementtrend:Mathematicspercentproficientlevelorabove
0%
25%
50%
75%
100%
4559
78
4558
77
4255
75200320022001
HighSchoolGrade8Grade3
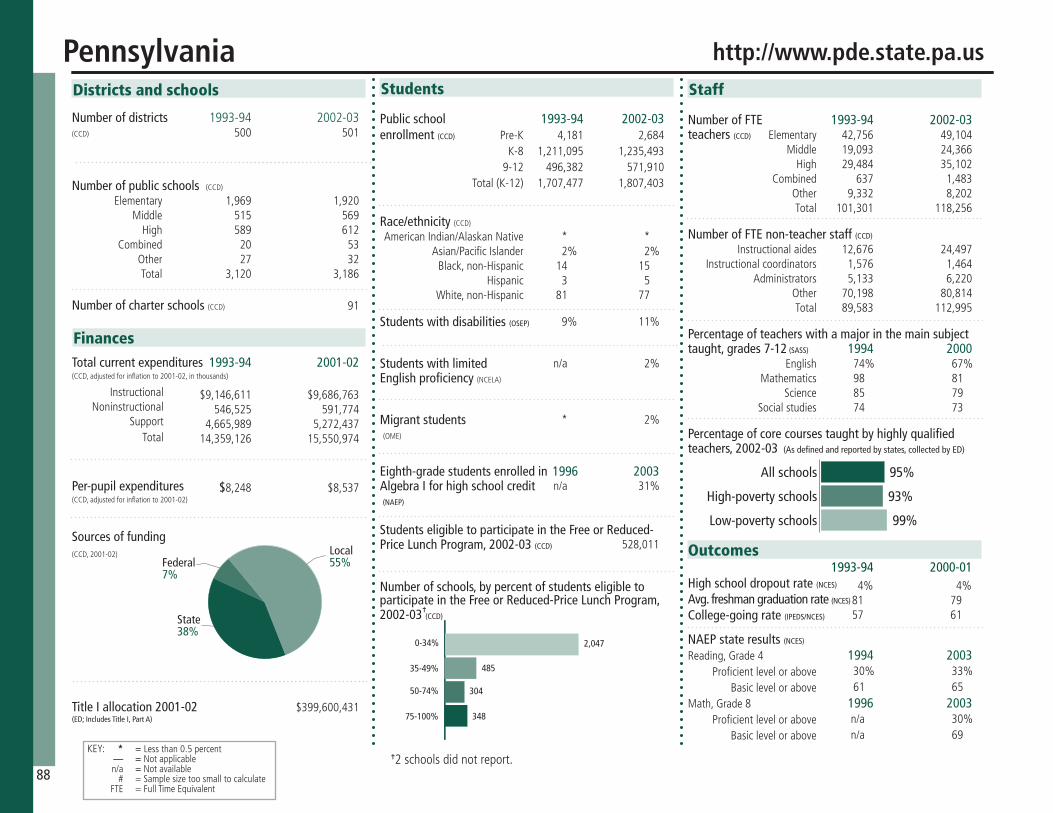
Staff
Number of FTE 1993-94 2002-03teachers (CCD) Elementary Middle High Combined Other Total
Number of FTE non-teacher staff (CCD)
Instructionalaides Instructionalcoordinators Administrators Other Total
Percentage of teachers with a major in the main subject taught, grades 7-12 (SASS) 1994 2000 English Mathematics Science Socialstudies
Percentage of core courses taught by highly qualified teachers, 2002-03 (As defined and reported by states, collected by ED)
Students
Public school 1993-94 2002-03enrollment (CCD) Pre-K K-8 9-12 Total(K-12)
Race/ethnicity (CCD) AmericanIndian/AlaskanNative Asian/PacificIslander Black,non-Hispanic Hispanic White,non-Hispanic
Students with disabilities (OSEP)
Students with limited English proficiency (NCELA)
Migrant students (OME)
Eighth-grade students enrolled in 1996 2003Algebra I for high school credit (NAEP)
Students eligible to participate in the Free or Reduced- Price Lunch Program, 2002-03 (CCD) Outcomes
1993-94 2000-01High school dropout rate (NCES)
Avg. freshman graduation rate (NCES) College-going rate (IPEDS/NCES)
NAEP state results (NCES) Reading,Grade4 1994 2003 Proficientlevelorabove BasicleveloraboveMath,Grade8 1996 2003 Proficientlevelorabove Basiclevelorabove
Number of districts 1993-94 2002-03(CCD)
Number of public schools (CCD)
Elementary Middle High Combined Other Total
Number of charter schools (CCD)
Districts and schools
Number of schools, by percent of students eligible to participate in the Free or Reduced-Price Lunch Program, 2002-03 (CCD)
Sources of funding(CCD,2001-02)
Title I allocation 2001-02 (ED; Includes Title I, Part A)
Total current expenditures 1993-94 2001-02 (CCD,adjustedforinflationto2001-02,inthousands)
Instructional Noninstructional Support Total
Per-pupil expenditures (CCD,adjustedforinflationto2001-02)
KEY: * =Lessthan0.5percent — = NotapplicableK n/a = Notavailable # =Samplesizetoosmalltocalculate FTE =FullTimeEquivalent
Finances
42,756 49,104 19,093 24,366 29,484 35,102 637 1,483 9,332 8,202 101,301 118,256
12,676 24,497 1,576 1,464 5,133 6,220 70,198 80,814 89,583 112,995
74% 67% 98 81 85 79 74 73
4,181 2,684 1,211,095 1,235,493 496,382 571,910 1,707,477 1,807,403
* * 2% 2% 14 15 3 5 81 77
9% 11%
n/a 2%
* 2%
n/a 31%
528,011
4% 4% 81 79 57 61
30% 33% 61 65
n/a 30% n/a 69
500 501
1,969 1,920 515 569 589 612 20 53 27 32 3,120 3,186
91
Pennsylvania http://www.pde.state.pa.us
$399,600,431
$9,146,611 $9,686,763 546,525 591,774 4,665,989 5,272,437 14,359,126 15,550,974
$8,248 $8,537
88
0-34%
35-49%
50-74%
75-100%
485
304
348
2,047
95%
93%
99%Low-poverty schools
High-poverty schools
All schools
Federal7%
State38%
Local55%
^
^2schoolsdidnotreport.
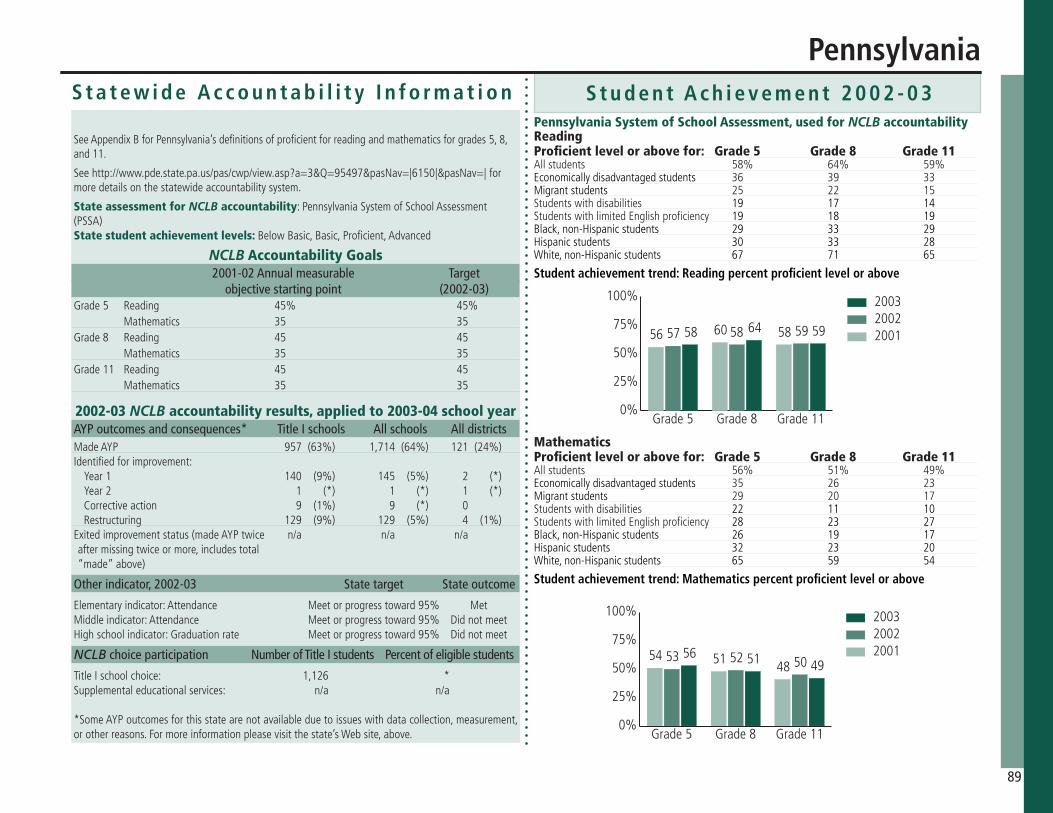
S t u d e n t A c h i e v e m e n t 2 0 0 2 - 0 3S t a t e w i d e A c c o u n t a b i l i t y I n f o r m a t i o n
SeeAppendixBforPennsylvania’sdefinitionsofproficientforreadingandmathematicsforgrades5,8,and11.
Seehttp://www.pde.state.pa.us/pas/cwp/view.asp?a=3&Q=95497&pasNav=|6150|&pasNav=|formoredetailsonthestatewideaccountabilitysystem.
State assessment for NCLB accountability:PennsylvaniaSystemofSchoolAssessment(PSSA)State student achievement levels: BelowBasic,Basic,Proficient,Advanced
NCLB Accountability Goals 2001-02 Annual measurable Target objective starting point (2002-03)Grade5 Reading 45% 45% Mathematics 35 35Grade8 Reading 45 45 Mathematics 35 35 Grade11 Reading 45 45 Mathematics 35 35
2002-03 NCLB accountability results, applied to 2003-04 school year AYP outcomes and consequences* Title I schools All schools All districtsMadeAYP 957(63%) 1,714(64%) 121(24%)Identifiedforimprovement:
Year1 140 (9%) 145 (5%) 2 (*)Year2 1 (*) 1 (*) 1 (*)Correctiveaction 9 (1%) 9 (*) 0Restructuring 129 (9%) 129 (5%) 4 (1%)
Exitedimprovementstatus(madeAYPtwice n/a n/a n/aaftermissingtwiceormore,includestotal“made”above)
Other indicator, 2002-03 State target State outcome
Elementaryindicator:Attendance Meetorprogresstoward95% MetMiddleindicator:Attendance Meetorprogresstoward95% DidnotmeetHighschoolindicator:Graduationrate Meetorprogresstoward95% Didnotmeet
NCLB choice participation Number of Title I students Percent of eligible students
TitleIschoolchoice: 1,126 *Supplementaleducationalservices: n/a n/a
*SomeAYPoutcomesforthisstatearenotavailableduetoissueswithdatacollection,measurement,orotherreasons.Formoreinformationpleasevisitthestate’sWebsite,above.
ReadingProficient level or above for: Grade 5 Grade 8 Grade 11Allstudents 58% 64% 59%Economicallydisadvantagedstudents 36 39 33Migrantstudents 25 22 15Studentswithdisabilities 19 17 14StudentswithlimitedEnglishproficiency 19 18 19Black,non-Hispanicstudents 29 33 29Hispanicstudents 30 33 28White,non-Hispanicstudents 67 71 65
Studentachievementtrend:Readingpercentproficientlevelorabove
0%
25%
50%
75%
100%
596458 595857 586056
200320022001
Grade11Grade8Grade5
Pennsylvania
Pennsylvania System of School Assessment, used for NCLB accountability
89
MathematicsProficient level or above for: Grade 5 Grade 8 Grade 11Allstudents 56% 51% 49%Economicallydisadvantagedstudents 35 26 23Migrantstudents 29 20 17Studentswithdisabilities 22 11 10StudentswithlimitedEnglishproficiency 28 23 27Black,non-Hispanicstudents 26 19 17Hispanicstudents 32 23 20White,non-Hispanicstudents 65 59 54
Studentachievementtrend:Mathematicspercentproficientlevelorabove
0%
25%
50%
75%
100%
495156505253
485154
200320022001
Grade11Grade8Grade5
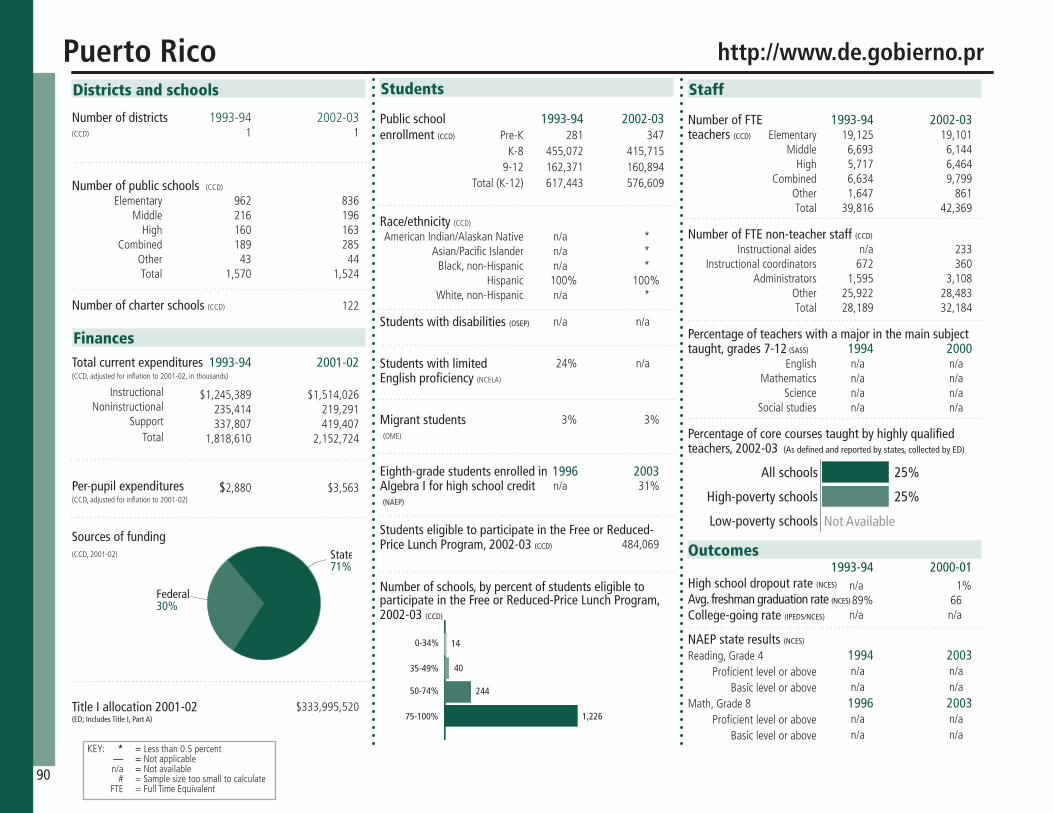
Staff
Number of FTE 1993-94 2002-03teachers (CCD) Elementary Middle High Combined Other Total
Number of FTE non-teacher staff (CCD)
Instructionalaides Instructionalcoordinators Administrators Other Total
Percentage of teachers with a major in the main subject taught, grades 7-12 (SASS) 1994 2000 English Mathematics Science Socialstudies
Percentage of core courses taught by highly qualified teachers, 2002-03 (As defined and reported by states, collected by ED)
Students
Public school 1993-94 2002-03enrollment (CCD) Pre-K K-8 9-12 Total(K-12)
Race/ethnicity (CCD) AmericanIndian/AlaskanNative Asian/PacificIslander Black,non-Hispanic Hispanic White,non-Hispanic
Students with disabilities (OSEP)
Students with limited English proficiency (NCELA)
Migrant students (OME)
Eighth-grade students enrolled in 1996 2003Algebra I for high school credit (NAEP)
Students eligible to participate in the Free or Reduced- Price Lunch Program, 2002-03 (CCD) Outcomes
1993-94 2000-01High school dropout rate (NCES)
Avg. freshman graduation rate (NCES) College-going rate (IPEDS/NCES)
NAEP state results (NCES) Reading,Grade4 1994 2003 Proficientlevelorabove BasicleveloraboveMath,Grade8 1996 2003 Proficientlevelorabove Basiclevelorabove
Number of districts 1993-94 2002-03(CCD)
Number of public schools (CCD)
Elementary Middle High Combined Other Total
Number of charter schools (CCD)
Districts and schools
Number of schools, by percent of students eligible to participate in the Free or Reduced-Price Lunch Program, 2002-03 (CCD)
Sources of funding(CCD,2001-02)
Title I allocation 2001-02 (ED; Includes Title I, Part A)
Total current expenditures 1993-94 2001-02 (CCD,adjustedforinflationto2001-02,inthousands)
Instructional Noninstructional Support Total
Per-pupil expenditures (CCD,adjustedforinflationto2001-02)
KEY: * =Lessthan0.5percent — = NotapplicableK n/a = Notavailable # =Samplesizetoosmalltocalculate FTE =FullTimeEquivalent
Finances
19,125 19,101 6,693 6,144 5,717 6,464 6,634 9,799 1,647 861 39,816 42,369
n/a 233 672 360 1,595 3,108 25,922 28,483 28,189 32,184
n/a n/a n/a n/a n/a n/a n/a n/a
281 347 455,072 415,715 162,371 160,894 617,443 576,609
n/a * n/a * n/a * 100% 100% n/a *
n/a n/a
24% n/a
3% 3%
n/a 31%
484,069
n/a 1% 89% 66 n/a n/a
n/a n/a n/a n/a
n/a n/a n/a n/a
1 1
962 836 216 196 160 163 189 285 43 44 1,570 1,524
122
PuertoRico http://www.de.gobierno.pr
$333,995,520
$1,245,389 $1,514,026 235,414 219,291 337,807 419,407 1,818,610 2,152,724
$2,880 $3,563
90
0-34%
35-49%
50-74%
75-100%
40
244
1,226
14
25%
25%
Low-poverty schools
High-poverty schools
All schools
Not Available
State71%
Federal30%

S t u d e n t A c h i e v e m e n t 2 0 0 2 - 0 3S t a t e w i d e A c c o u n t a b i l i t y I n f o r m a t i o n
SeeAppendixBforPuertoRico’sdefinitionsofproficientforreadingandmathematicsforgrades3,8,and11.
Seehttp://www.de.gobierno.prformoredetailsonthestatewideaccountabilitysystem.
State assessment for NCLB accountability:PruebasPuertorriqueñasdeAprovechamientoAcadémicoState student achievement levels: Basic,Proficient,Advanced
NCLB Accountability Goals 2001-02 Annual measurable Target objective starting point (2002-03)Grade3 Reading 52% 52% Mathematics 39 39Grade8 Reading 52 52 Mathematics 39 39 Grade11 Reading 52 52 Mathematics 39 39
2002-03 NCLB accountability results, applied to 2003-04 school year AYP outcomes and consequences* Title I schools All schools All districtsMadeAYP n/a n/a n/aIdentifiedforimprovement:
Year1 n/a n/a n/aYear2 n/a n/a n/aCorrectiveaction n/a n/a n/aRestructuring n/a n/a n/a
Exitedimprovementstatus(madeAYPtwice n/a n/a n/aaftermissingtwiceormore,includestotal“made”above)
Other indicator, 2002-03 State target State outcome
Elementaryindicator:Englishlanguageproficiency n/a n/aMiddleindicator:Englishlanguageproficiency n/a n/aHighschoolindicator:Englishlanguageproficiency n/a n/a
NCLB choice participation Number of Title I students Percent of eligible students
TitleIschoolchoice: 0 0Supplementaleducationalservices: 4,698 1%
*SomeAYPoutcomesforthisstatearenotavailableduetoissueswithdatacollection,measurement,orotherreasons.Formoreinformationpleasevisitthestate’sWebsite,above.
ReadingProficient level or above for: Grade 3 Grade 8 Grade 11Allstudents 53% 37% 54%Economicallydisadvantagedstudents 52 34 51Migrantstudents 50 35 50Studentswithdisabilities 44 15 17StudentswithlimitedSpanishproficiency 45 26 48Black,non-Hispanicstudents - - -Hispanicstudents 54 37 55White,non-Hispanicstudents 51 37 56
Studentachievementtrend:Readingpercentproficientlevelorabove
0%
25%
50%
75%
100%
54
3753
200320022001
Grade11Grade8Grade3
n/an/a
PuertoRico
Pruebas Puertorriqueñas de Aprovechamiento Académico, used for NCLB accountability
91
MathematicsProficient level or above for: Grade 3 Grade 8 Grade 11Allstudents 59% 35% 35%Economicallydisadvantagedstudents 57 34 34Migrantstudents 58 35 35Studentswithdisabilities 51 22 19StudentswithlimitedSpanishproficiency 51 32 38Black,non-Hispanicstudents - - -Hispanicstudents 59 35 35White,non-Hispanicstudents 56 38 39
Studentachievementtrend:Mathematicspercentproficientlevelorabove
0%
25%
50%
75%
100%
3535
59
200320022001
Grade11Grade8Grade3
n/an/a

Staff
Number of FTE 1993-94 2002-03teachers (CCD) Elementary Middle High Combined Other Total
Number of FTE non-teacher staff (CCD)
Instructionalaides Instructionalcoordinators Administrators Other Total
Percentage of teachers with a major in the main subject taught, grades 7-12 (SASS) 1994 2000 English Mathematics Science Socialstudies
Percentage of core courses taught by highly qualified teachers, 2002-03 (As defined and reported by states, collected by ED)
Students
Public school 1993-94 2002-03enrollment (CCD) Pre-K K-8 9-12 Total(K-12)
Race/ethnicity (CCD) AmericanIndian/AlaskanNative Asian/PacificIslander Black,non-Hispanic Hispanic White,non-Hispanic
Students with disabilities (OSEP)
Students with limited English proficiency (NCELA)
Migrant students (OME)
Eighth-grade students enrolled in 1996 2003Algebra I for high school credit (NAEP)
Students eligible to participate in the Free or Reduced- Price Lunch Program, 2002-03 (CCD) Outcomes
1993-94 2000-01High school dropout rate (NCES)
Avg. freshman graduation rate (NCES) College-going rate (IPEDS/NCES)
NAEP state results (NCES) Reading,Grade4 1994 2003 Proficientlevelorabove BasicleveloraboveMath,Grade8 1996 2003 Proficientlevelorabove Basiclevelorabove
Number of districts 1993-94 2002-03(CCD)
Number of public schools (CCD)
Elementary Middle High Combined Other Total
Number of charter schools (CCD)
Districts and schools
Number of schools, by percent of students eligible to participate in the Free or Reduced-Price Lunch Program, 2002-03 (CCD)
Sources of funding(CCD,2001-02)
Title I allocation 2001-02 (ED; Includes Title I, Part A)
Total current expenditures 1993-94 2001-02 (CCD,adjustedforinflationto2001-02,inthousands)
Instructional Noninstructional Support Total
Per-pupil expenditures (CCD,adjustedforinflationto2001-02)
KEY: * =Lessthan0.5percent — = NotapplicableK n/a = Notavailable # =Samplesizetoosmalltocalculate FTE =FullTimeEquivalent
Finances
4,637 n/a 2,239 n/a 2,821 n/a 19 n/a 107 n/a 9,823 n/a
1,320 2,344 78 67 524 651 3,697 4,516 5,619 7,578
94% 74% 81 82 94 81 93 80
465 1,209 103,603 111,204 38,470 46,661 142,073 157,865
* 1% 3% 3 7 8 9 16 81 72
13% 17%
5% 7%
* *
32% n/a
53,084
5% 5% 74 74 65 66
32% 30% 65 63
20% 24% 60 63
36 36
212214 5157 4147 24 34 309 326
7
RhodeIsland http://www.ridoe.net
$34,250,118
$844,602 $989,404 32,448 40,573 390,456 503,479 1,267,505 1,533,456
$8,701 $9,703
92
0-34%
35-49%
50-74%
75-100%
31
33
56
198
63%
58%
Low-poverty schools
High-poverty schools
All schools
Not Available
Federal6%
State42%
Local52%
^
^8schoolsdidnotreport.
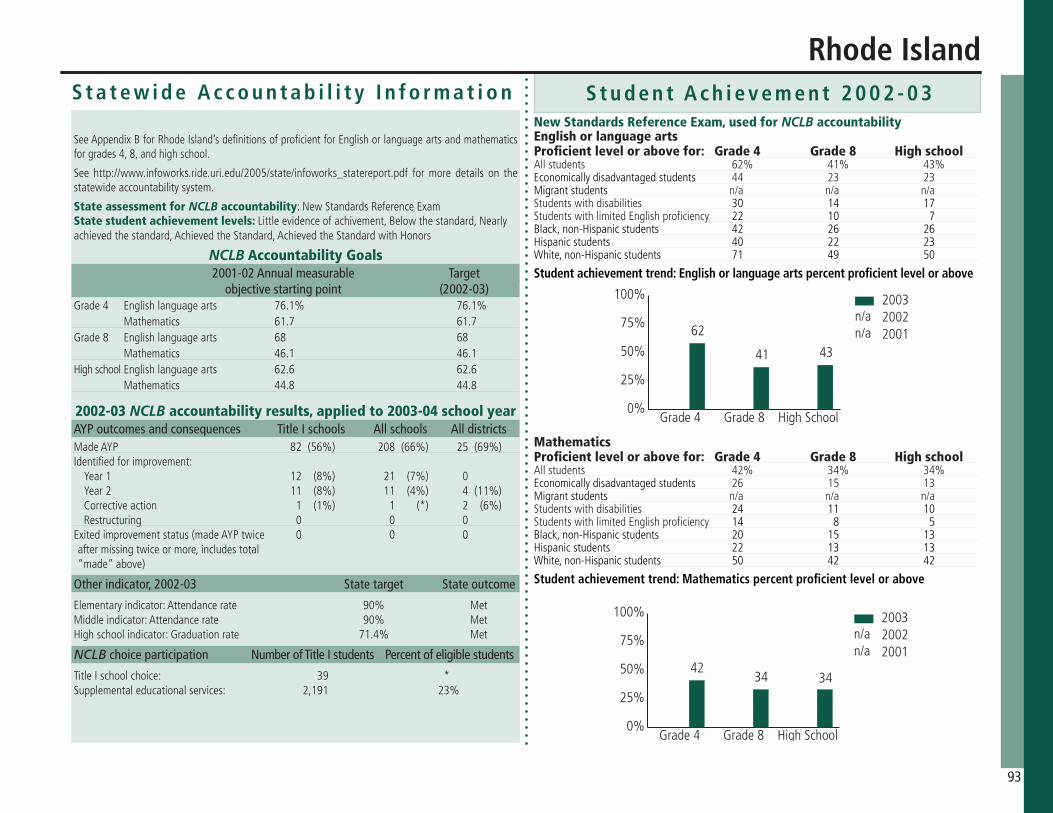
S t u d e n t A c h i e v e m e n t 2 0 0 2 - 0 3S t a t e w i d e A c c o u n t a b i l i t y I n f o r m a t i o n
MathematicsProficient level or above for: Grade 4 Grade 8 High schoolAllstudents 42% 34% 34%Economicallydisadvantagedstudents 26 15 13Migrantstudents n/a n/a n/aStudentswithdisabilities 24 11 10StudentswithlimitedEnglishproficiency 14 8 5Black,non-Hispanicstudents 20 15 13Hispanicstudents 22 13 13White,non-Hispanicstudents 50 42 42
Studentachievementtrend:Mathematicspercentproficientlevelorabove
SeeAppendixBforRhodeIsland’sdefinitionsofproficientforEnglishorlanguageartsandmathematicsforgrades4,8,andhighschool.
See http://www.infoworks.ride.uri.edu/2005/state/infoworks_statereport.pdf for more details on thestatewideaccountabilitysystem.
State assessment for NCLB accountability:NewStandardsReferenceExamState student achievement levels: Littleevidenceofachivement,Belowthestandard,Nearlyachievedthestandard,AchievedtheStandard,AchievedtheStandardwithHonors
NCLB Accountability Goals 2001-02 Annual measurable Target objective starting point (2002-03)Grade4 Englishlanguagearts 76.1% 76.1% Mathematics 61.7 61.7Grade8 Englishlanguagearts 68 68 Mathematics 46.1 46.1 HighschoolEnglishlanguagearts 62.6 62.6 Mathematics 44.8 44.8
2002-03 NCLB accountability results, applied to 2003-04 school year AYP outcomes and consequences Title I schools All schools All districtsMadeAYP 82(56%) 208(66%) 25(69%)Identifiedforimprovement:
Year1 12 (8%) 21 (7%) 0Year2 11 (8%) 11 (4%) 4(11%)Correctiveaction 1 (1%) 1 (*) 2 (6%)Restructuring 0 0 0
Exitedimprovementstatus(madeAYPtwice 0 0 0aftermissingtwiceormore,includestotal“made”above)
Other indicator, 2002-03 State target State outcome
Elementaryindicator:Attendancerate 90% MetMiddleindicator:Attendancerate 90% MetHighschoolindicator:Graduationrate 71.4% Met
NCLB choice participation Number of Title I students Percent of eligible students
TitleIschoolchoice: 39 *Supplementaleducationalservices: 2,191 23%
English or language artsProficient level or above for: Grade 4 Grade 8 High schoolAllstudents 62% 41% 43%Economicallydisadvantagedstudents 44 23 23Migrantstudents n/a n/a n/aStudentswithdisabilities 30 14 17StudentswithlimitedEnglishproficiency 22 10 7Black,non-Hispanicstudents 42 26 26Hispanicstudents 40 22 23White,non-Hispanicstudents 71 49 50
Studentachievementtrend:Englishorlanguageartspercentproficientlevelorabove
0%
25%
50%
75%
100%
4341
62
200320022001
HighSchoolGrade8Grade4
n/an/a
RhodeIsland
New Standards Reference Exam, used for NCLB accountability
93
0%
25%
50%
75%
100%
343442
200320022001
HighSchoolGrade8Grade4
n/an/a

Staff
Number of FTE 1993-94 2002-03teachers (CCD) Elementary Middle High Combined Other Total
Number of FTE non-teacher staff (CCD)
Instructionalaides Instructionalcoordinators Administrators Other Total
Percentage of teachers with a major in the main subject taught, grades 7-12 (SASS) 1994 2000 English Mathematics Science Socialstudies
Percentage of core courses taught by highly qualified teachers, 2002-03 (As defined and reported by states, collected by ED)
Students
Public school 1993-94 2002-03enrollment (CCD) Pre-K K-8 9-12 Total(K-12)
Race/ethnicity (CCD) AmericanIndian/AlaskanNative Asian/PacificIslander Black,non-Hispanic Hispanic White,non-Hispanic
Students with disabilities (OSEP)
Students with limited English proficiency (NCELA)
Migrant students (OME)
Eighth-grade students enrolled in 1996 2003Algebra I for high school credit (NAEP)
Students eligible to participate in the Free or Reduced- Price Lunch Program, 2002-03 (CCD) Outcomes
1993-94 2000-01High school dropout rate (NCES)
Avg. freshman graduation rate (NCES) College-going rate (IPEDS/NCES)
NAEP state results (NCES) Reading,Grade4 1994 2003 Proficientlevelorabove BasicleveloraboveMath,Grade8 1996 2003 Proficientlevelorabove Basiclevelorabove
Number of districts 1993-94 2002-03(CCD)
Number of public schools (CCD)
Elementary Middle High Combined Other Total
Number of charter schools (CCD)
Districts and schools
Number of schools, by percent of students eligible to participate in the Free or Reduced-Price Lunch Program, 2002-03 (CCD)
Sources of funding(CCD,2001-02)
Title I allocation 2001-02 (ED; Includes Title I, Part A)
Total current expenditures 1993-94 2001-02 (CCD,adjustedforinflationto2001-02,inthousands)
Instructional Noninstructional Support Total
Per-pupil expenditures (CCD,adjustedforinflationto2001-02)
KEY: * =Lessthan0.5percent — = NotapplicableK n/a = Notavailable # =Samplesizetoosmalltocalculate FTE =FullTimeEquivalent
Finances
17,975 22,221 9,412 10,399 10,036 11,796 80 342 1,117 1,880 38,620 46,578
6,891 1,947 503 741 2,429 3,440 24,375 10,459 34,198 16,587
78% 68% 72 79 74 75 72 83
7,407 19,949 459,707 478,984 176,745 191,743 636,452 670,727
* * 1% 1% 41 41 1 3 57 54
11% 14%
* 1%
* *
27% 24%
343,810
n/a 3% 67% 57 58 66
20% 25% 48 59
14% 26% 48 67
95 89
589609 239247 195203 1112 1310 1,0471,081
10
SouthCarolina http://www.sde.state.sc.us
$142,363,522
$2,114,689 $2,857,016 224,942 257,624 1,233,218 1,630,168 3,572,849 4,744,808
$5,550 $7,017
94
0-34%
35-49%
50-74%
75-100%
221
365
254
221
Not Available
Federal9%
State51%
Local40%
^
^20schoolsdidnotreport.

S t u d e n t A c h i e v e m e n t 2 0 0 2 - 0 3S t a t e w i d e A c c o u n t a b i l i t y I n f o r m a t i o n
SeeAppendixBforSouthCarolina’sdefinitionsofproficientforEnglish/languageartsandmathematicsforgrades4,8,andhighschool.
Seehttp://www.myscschools.com/reportcard/2003/formoredetailsonthestatewideaccountabilitysystem.
State assessment for NCLB accountability:PalmettoAchievementChallengeTest(PACT)State student achievement levels: BelowBasic,Basic,Proficient,Advanced
NCLB Accountability Goals 2001-02 Annual measurable Target objective starting point (2002-03)Grade4 English/languagearts 17.6% 17.6% Mathematics 15.5 15.5Grade8 English/languagearts 17.6 17.6 Mathematics 15.5 15.5 HighschoolEnglish/languagearts 17.6 17.6 Mathematics 15.5 15.5
2002-03 NCLB accountability results, applied to 2003-04 school year AYP outcomes and consequences Title I schools All schools All districtsMadeAYP 110(20%) 584(55%) 79(89%)Identifiedforimprovement:
Year1 64(12%) 64 (6%) 6 (7%)Year2 11 (2%) 11 (1%) 0Correctiveaction 15 (3%) 15 (1%) 1 (1%)Restructuring 0 0 0
Exitedimprovementstatus(madeAYPtwice 0 0 0aftermissingtwiceormore,includestotal“made”above)
Other indicator, 2002-03 State target State outcome
Elementaryindicator:Attendance Meetorexceed95.3% MetMiddleindicator:Attendance Meetorexceed95.3% MetHighschoolindicator:Graduationrate Meetorprogresstoward77.3% Met
NCLB choice participation Number of Title I students Percent of eligible students
TitleIschoolchoice: 1,770 4%Supplementaleducationalservices: 1,477 14%
English or language artsProficient level or above for: Grade 4 Grade 8 High schoolAllstudents 32% 20% 29%Economicallydisadvantagedstudents 18 9 16Migrantstudents 14 <5 11Studentswithdisabilities 35 <5 6StudentswithlimitedEnglishproficiency 7 <5 7Black,non-Hispanicstudents 17 8 16Hispanicstudents 22 13 19White,non-Hispanicstudents 43 29 40
Studentachievementtrend:Englishorlanguageartspercentproficientlevelorabove
0%
25%
50%
75%
100%
2920
32 273424
37
200320022001
HighSchoolGrade8Grade4n/a n/a
SouthCarolina
Palmetto Achievement Challenge Test (PACT), used for NCLB accountability
95
MathematicsProficient level or above for: Grade 4 Grade 8 High schoolAllstudents 33% 19% 31%Economicallydisadvantagedstudents 20 8 17Migrantstudents 12 12 15Studentswithdisabilities 37 3 8StudentswithlimitedEnglishproficiency 14 8 12Black,non-Hispanicstudents 17 6 41Hispanicstudents 26 14 22White,non-Hispanicstudents 47 28 43
Studentachievementtrend:Mathematicspercentproficientlevelorabove
0%
25%
50%
75%
100%
3119
3319
36
1826
200320022001
HighSchoolGrade8Grade4n/an/a

Staff
Number of FTE 1993-94 2002-03teachers (CCD) Elementary Middle High Combined Other Total
Number of FTE non-teacher staff (CCD)
Instructionalaides Instructionalcoordinators Administrators Other Total
Percentage of teachers with a major in the main subject taught, grades 7-12 (SASS) 1994 2000 English Mathematics Science Socialstudies
Percentage of core courses taught by highly qualified teachers, 2002-03 (As defined and reported by states, collected by ED)
Students
Public school 1993-94 2002-03enrollment (CCD) Pre-K K-8 9-12 Total(K-12)
Race/ethnicity (CCD) AmericanIndian/AlaskanNative Asian/PacificIslander Black,non-Hispanic Hispanic White,non-Hispanic
Students with disabilities (OSEP)
Students with limited English proficiency (NCELA)
Migrant students (OME)
Eighth-grade students enrolled in 1996 2003Algebra I for high school credit (NAEP)
Students eligible to participate in the Free or Reduced- Price Lunch Program, 2002-03 (CCD) Outcomes
1993-94 2000-01High school dropout rate (NCES)
Avg. freshman graduation rate (NCES) College-going rate (IPEDS/NCES)
NAEP state results (NCES) Reading,Grade4 1994 2003 Proficientlevelorabove BasicleveloraboveMath,Grade8 1996 2003 Proficientlevelorabove Basiclevelorabove
Number of districts 1993-94 2002-03(CCD)
Number of public schools (CCD)
Elementary Middle High Combined Other Total
Number of charter schools (CCD)
Districts and schools
Number of schools, by percent of students eligible to participate in the Free or Reduced-Price Lunch Program, 2002-03 (CCD)
Sources of funding(CCD,2001-02)
Title I allocation 2001-02 (ED; Includes Title I, Part A)
Total current expenditures 1993-94 2001-02 (CCD,adjustedforinflationto2001-02,inthousands)
Instructional Noninstructional Support Total
Per-pupil expenditures (CCD,adjustedforinflationto2001-02)
KEY: * =Lessthan0.5percent — = NotapplicableK n/a = Notavailable # =Samplesizetoosmalltocalculate FTE =FullTimeEquivalent
Finances
4,627 4,406 2,067 1,903 2,756 2,780 n/a 100 107 69 9,557 9,257
1,801 3,312 14 376 947 858 4,882 5,228 7,644 9,774
73% 74% 67 76 72 72 61 68
612 2,246 100,054 85,195 39,971 40,598 140,025 125,793
13% 11% 1 1 1 1 1 2 85 85
9% 11%
3% 3%
1% 2%
n/a 24%
38,800
5% 4% 92 77 50 64
n/a 33% n/a 68
n/a 35% n/a 78
173 178
373368 191171 187177 n/a20 232 774738
n/a
SouthDakota http://www.state.sd.us/deca
$27,405,068
$461,663 $484,985 41,349 44,415 245,763 289,896 748,774 819,296
$5,242 $6,424
96
0-34%
35-49%
50-74%
75-100%
136
111
69
330
86%
16%
91%Low-poverty schools
High-poverty schools
All schools
Federal14%
State36%
Local50%
^
^92schoolsdidnotreport.
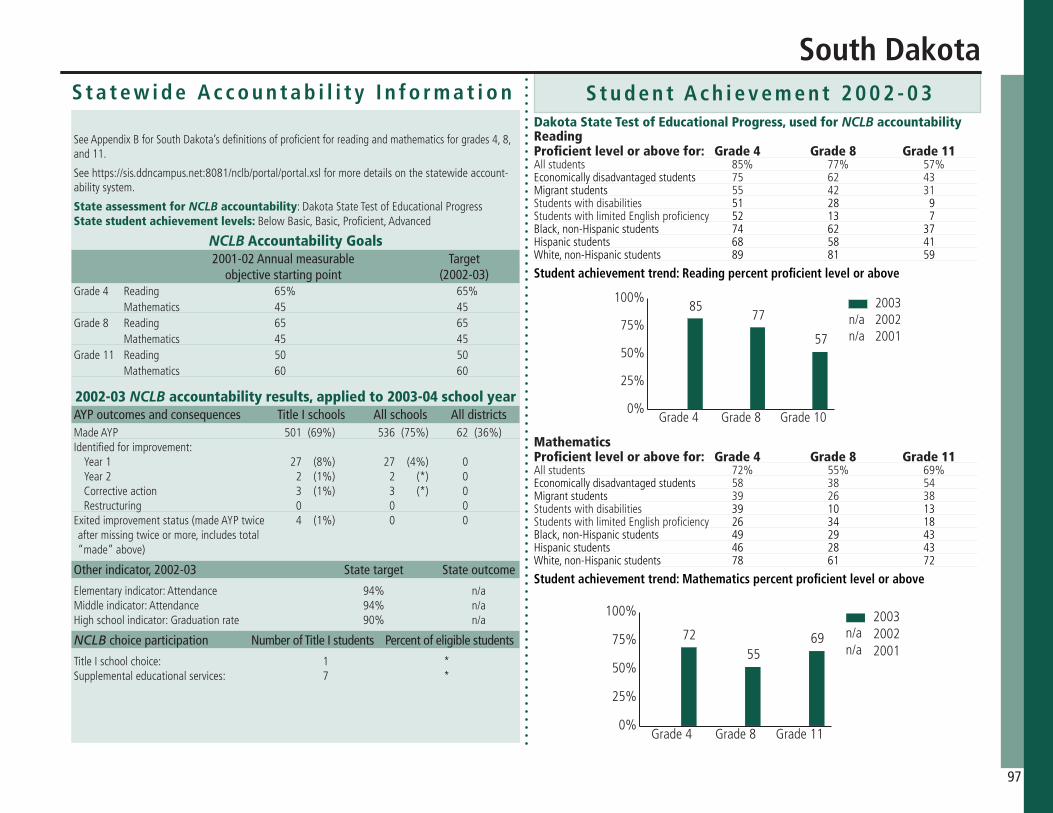
S t u d e n t A c h i e v e m e n t 2 0 0 2 - 0 3S t a t e w i d e A c c o u n t a b i l i t y I n f o r m a t i o n
SeeAppendixBforSouthDakota’sdefinitionsofproficientforreadingandmathematicsforgrades4,8,and11.
Seehttps://sis.ddncampus.net:8081/nclb/portal/portal.xslformoredetailsonthestatewideaccount-abilitysystem.
State assessment for NCLB accountability:DakotaStateTestofEducationalProgressState student achievement levels: BelowBasic,Basic,Proficient,Advanced
NCLB Accountability Goals 2001-02 Annual measurable Target objective starting point (2002-03)Grade4 Reading 65% 65% Mathematics 45 45Grade8 Reading 65 65 Mathematics 45 45 Grade11 Reading 50 50 Mathematics 60 60
2002-03 NCLB accountability results, applied to 2003-04 school year AYP outcomes and consequences Title I schools All schools All districtsMadeAYP 501(69%) 536(75%) 62(36%)Identifiedforimprovement:
Year1 27 (8%) 27 (4%) 0Year2 2 (1%) 2 (*) 0Correctiveaction 3 (1%) 3 (*) 0Restructuring 0 0 0
Exitedimprovementstatus(madeAYPtwice 4 (1%) 0 0aftermissingtwiceormore,includestotal“made”above)
Other indicator, 2002-03 State target State outcome
Elementaryindicator:Attendance 94% n/aMiddleindicator:Attendance 94% n/aHighschoolindicator:Graduationrate 90% n/a
NCLB choice participation Number of Title I students Percent of eligible students
TitleIschoolchoice: 1 *Supplementaleducationalservices: 7 *
ReadingProficient level or above for: Grade 4 Grade 8 Grade 11Allstudents 85% 77% 57%Economicallydisadvantagedstudents 75 62 43Migrantstudents 55 42 31Studentswithdisabilities 51 28 9StudentswithlimitedEnglishproficiency 52 13 7Black,non-Hispanicstudents 74 62 37Hispanicstudents 68 58 41White,non-Hispanicstudents 89 81 59
Studentachievementtrend:Readingpercentproficientlevelorabove
0%
25%
50%
75%
100%
57
7785 2003
20022001
Grade10Grade8Grade4
n/an/a
SouthDakota
Dakota State Test of Educational Progress, used for NCLB accountability
97
MathematicsProficient level or above for: Grade 4 Grade 8 Grade 11Allstudents 72% 55% 69%Economicallydisadvantagedstudents 58 38 54Migrantstudents 39 26 38Studentswithdisabilities 39 10 13StudentswithlimitedEnglishproficiency 26 34 18Black,non-Hispanicstudents 49 29 43Hispanicstudents 46 28 43White,non-Hispanicstudents 78 61 72
Studentachievementtrend:Mathematicspercentproficientlevelorabove
0%
25%
50%
75%
100%
6955
72200320022001
Grade11Grade8Grade4
n/an/a
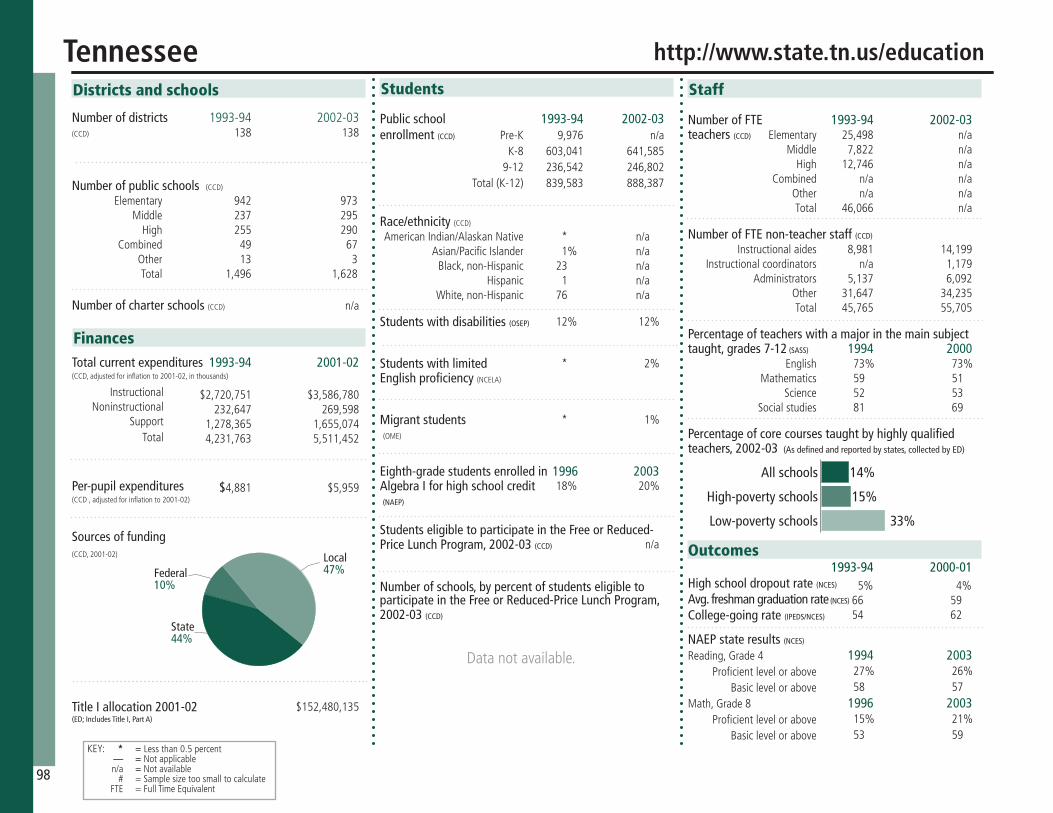
Staff
Number of FTE 1993-94 2002-03teachers (CCD) Elementary Middle High Combined Other Total
Number of FTE non-teacher staff (CCD)
Instructionalaides Instructionalcoordinators Administrators Other Total
Percentage of teachers with a major in the main subject taught, grades 7-12 (SASS) 1994 2000 English Mathematics Science Socialstudies
Percentage of core courses taught by highly qualified teachers, 2002-03 (As defined and reported by states, collected by ED)
Students
Public school 1993-94 2002-03enrollment (CCD) Pre-K K-8 9-12 Total(K-12)
Race/ethnicity (CCD) AmericanIndian/AlaskanNative Asian/PacificIslander Black,non-Hispanic Hispanic White,non-Hispanic
Students with disabilities (OSEP)
Students with limited English proficiency (NCELA)
Migrant students (OME)
Eighth-grade students enrolled in 1996 2003Algebra I for high school credit (NAEP)
Students eligible to participate in the Free or Reduced- Price Lunch Program, 2002-03 (CCD) Outcomes
1993-94 2000-01High school dropout rate (NCES)
Avg. freshman graduation rate (NCES) College-going rate (IPEDS/NCES)
NAEP state results (NCES) Reading,Grade4 1994 2003 Proficientlevelorabove BasicleveloraboveMath,Grade8 1996 2003 Proficientlevelorabove Basiclevelorabove
Number of districts 1993-94 2002-03(CCD)
Number of public schools (CCD)
Elementary Middle High Combined Other Total
Number of charter schools (CCD)
Districts and schools
Number of schools, by percent of students eligible to participate in the Free or Reduced-Price Lunch Program, 2002-03 (CCD)
Sources of funding(CCD,2001-02)
Title I allocation 2001-02 (ED; Includes Title I, Part A)
Total current expenditures 1993-94 2001-02 (CCD,adjustedforinflationto2001-02,inthousands)
Instructional Noninstructional Support Total
Per-pupil expenditures (CCD,adjustedforinflationto2001-02)
KEY: * =Lessthan0.5percent — = NotapplicableK n/a = Notavailable # =Samplesizetoosmalltocalculate FTE =FullTimeEquivalent
Finances
25,498 n/a 7,822 n/a 12,746 n/a n/a n/a n/a n/a 46,066 n/a
8,981 14,199 n/a 1,179 5,137 6,092 31,647 34,235 45,765 55,705
73% 73% 59 51 52 53 81 69
9,976 n/a 603,041 641,585 236,542 246,802 839,583 888,387
* n/a 1% n/a 23 n/a 1 n/a 76 n/a
12% 12%
* 2%
* 1%
18% 20%
n/a
5% 4% 66 59 54 62
27% 26% 58 57
15% 21% 53 59
138 138
942973 237295 255290 4967 133 1,4961,628
n/a
Tennessee http://www.state.tn.us/education
$152,480,135
$2,720,751 $3,586,780 232,647 269,598 1,278,365 1,655,074 4,231,763 5,511,452
$4,881 $5,959
98
Datanotavailable.
14%
15%
33%Low-poverty schools
High-poverty schools
All schools
Federal10%
State44%
Local47%

S t u d e n t A c h i e v e m e n t 2 0 0 2 - 0 3S t a t e w i d e A c c o u n t a b i l i t y I n f o r m a t i o n
SeeAppendixBforTennessee’sdefinitionsofproficientforreading/languageartsandmathematicsforgrades3,8,andhighschool.
Seehttp://evaas.sasinschool.com/tn_reportcard/welcome.jspformoredetailsonthestatewideac-countabilitysystem.
State assessment for NCLB accountability:TennesseeAchievementTestState student achievement levels: BelowProficient,Proficient,Advanced
NCLB Accountability Goals 2001-02 Annual measurable Target objective starting point (2002-03)Grade3 Reading/languagearts 77.1% 77.1% Mathematics 72.4 72.4Grade8 Reading/languagearts 77.1 77.1 Mathematics 72.4 72.4 HighschoolReading/languagearts 86 86 Mathematics 65.4 65.4
2002-03 NCLB accountability results, applied to 2003-04 school year AYP outcomes and consequences* Title I schools All schools All districtsMadeAYP n/a 832(50%)11(8%)Identifiedforimprovement:
Year1 n/a 0 0Year2 n/a 0 0Correctiveaction n/a 33 (2%) 0Restructuring n/a 28 (2%) 0
Exitedimprovementstatus(madeAYPtwice n/a 0 0aftermissingtwiceormore,includestotal“made”above)
Other indicator, 2002-03 State target State outcome
Elementaryindicator:Attendance 92.5% MetMiddleindicator:Attendance 92.5% MetHighschoolindicator:Graduationrate 76% Met
NCLB choice participation Number of Title I students Percent of eligible students
TitleIschoolchoice: 839 *Supplementaleducationalservices: 4,870 2%
*SomeAYPoutcomesforthisstatearenotavailableduetoissueswithdatacollection,measurement,orotherreasons.Formoreinformationpleasevisitthestate’sWebsite,above.
Reading or language artsProficient level or above for: Grade 3 Grade 8 High schoolAllstudents 81% 80% 89%Economicallydisadvantagedstudents 71 67 80Migrantstudents 48 39 61Studentswithdisabilities 34 29 48StudentswithlimitedEnglishproficiency 48 21 59Black,non-Hispanicstudents 69 65 79Hispanicstudents 67 63 89White,non-Hispanicstudents 86 85 91
Studentachievementtrend:Readingorlanguageartspercentproficientlevelorabove
0%
25%
50%
75%
100% 898081 2003
20022001
HighSchoolGrade8Grade3
n/an/a
Tennessee
Tennessee Achievement Test, used for NCLB accountability
99
MathematicsProficient level or above for: Grade 3 Grade 8 High schoolAllstudents 80% 79% 77%Economicallydisadvantagedstudents 70 66 65Migrantstudents 57 51 94Studentswithdisabilities 41 30 41StudentswithlimitedEnglishproficiency 57 44 63Black,non-Hispanicstudents 64 61 56Hispanicstudents 70 70 72White,non-Hispanicstudents 86 86 84
Studentachievementtrend:Mathematicspercentproficientlevelorabove
0%
25%
50%
75%
100%777980 2003
20022001
HighSchoolGrade8Grade3
n/an/a
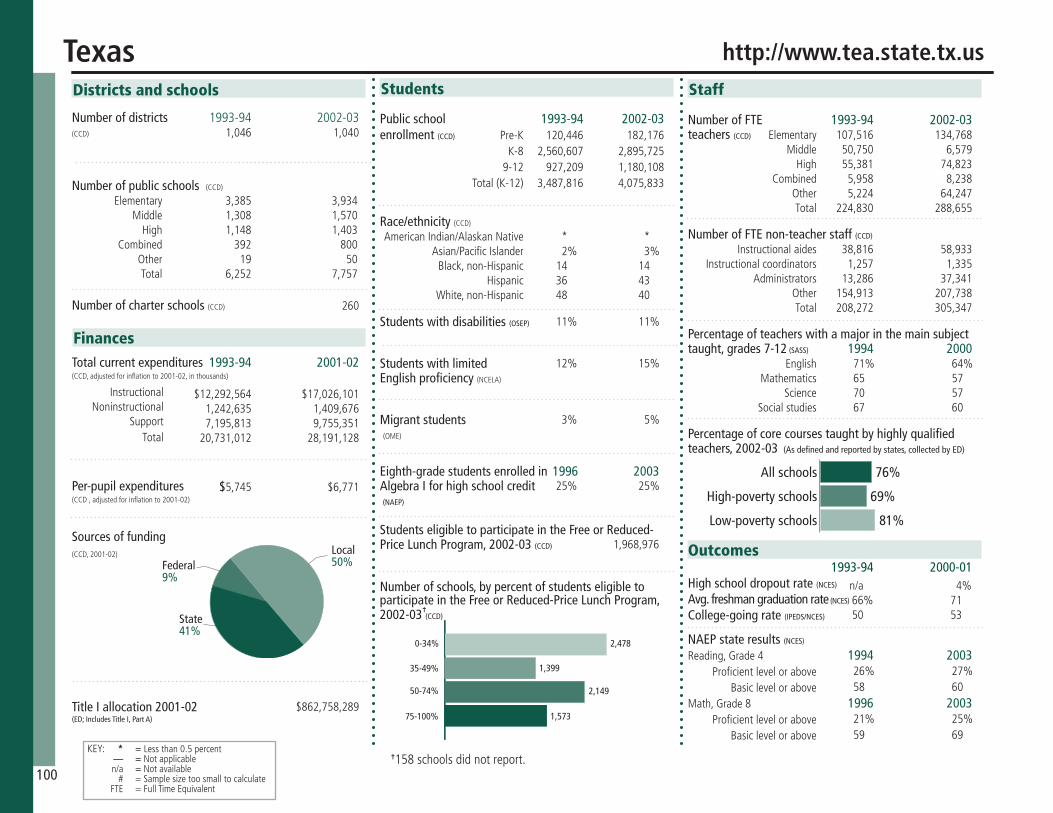
Staff
Number of FTE 1993-94 2002-03teachers (CCD) Elementary Middle High Combined Other Total
Number of FTE non-teacher staff (CCD)
Instructionalaides Instructionalcoordinators Administrators Other Total
Percentage of teachers with a major in the main subject taught, grades 7-12 (SASS) 1994 2000 English Mathematics Science Socialstudies
Percentage of core courses taught by highly qualified teachers, 2002-03 (As defined and reported by states, collected by ED)
Students
Public school 1993-94 2002-03enrollment (CCD) Pre-K K-8 9-12 Total(K-12)
Race/ethnicity (CCD) AmericanIndian/AlaskanNative Asian/PacificIslander Black,non-Hispanic Hispanic White,non-Hispanic
Students with disabilities (OSEP)
Students with limited English proficiency (NCELA)
Migrant students (OME)
Eighth-grade students enrolled in 1996 2003Algebra I for high school credit (NAEP)
Students eligible to participate in the Free or Reduced- Price Lunch Program, 2002-03 (CCD) Outcomes
1993-94 2000-01High school dropout rate (NCES)
Avg. freshman graduation rate (NCES) College-going rate (IPEDS/NCES)
NAEP state results (NCES) Reading,Grade4 1994 2003 Proficientlevelorabove BasicleveloraboveMath,Grade8 1996 2003 Proficientlevelorabove Basiclevelorabove
Number of districts 1993-94 2002-03(CCD)
Number of public schools (CCD)
Elementary Middle High Combined Other Total
Number of charter schools (CCD)
Districts and schools
Number of schools, by percent of students eligible to participate in the Free or Reduced-Price Lunch Program, 2002-03 (CCD)
Sources of funding(CCD,2001-02)
Title I allocation 2001-02 (ED; Includes Title I, Part A)
Total current expenditures 1993-94 2001-02 (CCD,adjustedforinflationto2001-02,inthousands)
Instructional Noninstructional Support Total
Per-pupil expenditures (CCD,adjustedforinflationto2001-02)
KEY: * =Lessthan0.5percent — = NotapplicableK n/a = Notavailable # =Samplesizetoosmalltocalculate FTE =FullTimeEquivalent
Finances
107,516 134,768 50,750 6,579 55,381 74,823 5,958 8,238 5,224 64,247 224,830 288,655
38,816 58,933 1,257 1,335 13,286 37,341 154,913 207,738 208,272 305,347
71% 64% 65 57 70 57 67 60
120,446 182,176 2,560,607 2,895,725 927,209 1,180,108 3,487,816 4,075,833
* * 2% 3% 14 14 36 43 48 40
11% 11%
12% 15%
3% 5%
25% 25%
1,968,976
n/a 4% 66% 71 50 53
26% 27% 58 60
21% 25% 59 69
1,046 1,040
3,3853,934 1,3081,570 1,1481,403 392800 1950 6,2527,757
260
Texas http://www.tea.state.tx.us
$862,758,289
$12,292,564 $17,026,101 1,242,635 1,409,676 7,195,813 9,755,351 20,731,012 28,191,128
$5,745 $6,771
100
0-34%
35-49%
50-74%
75-100%
1,399
2,149
1,573
2,478
76%
69%
81%Low-poverty schools
High-poverty schools
All schools
Federal9%
State41%
Local50%
^
^158schoolsdidnotreport.
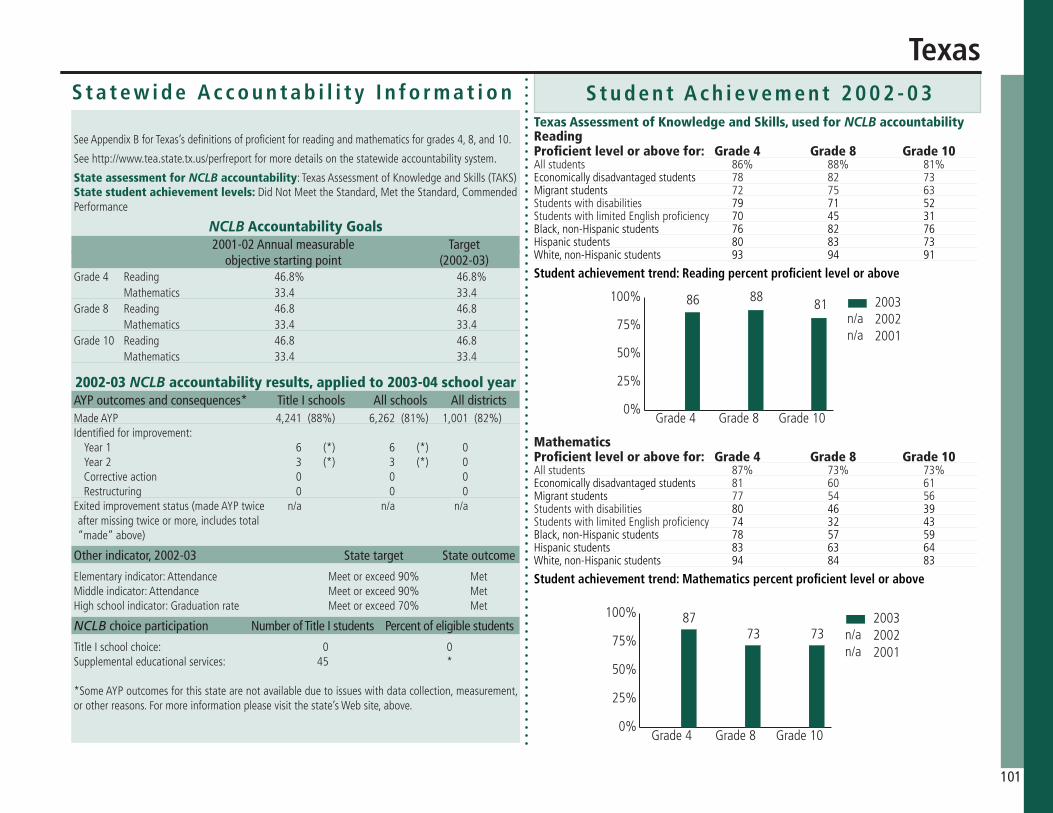
S t u d e n t A c h i e v e m e n t 2 0 0 2 - 0 3S t a t e w i d e A c c o u n t a b i l i t y I n f o r m a t i o n
SeeAppendixBforTexas’sdefinitionsofproficientforreadingandmathematicsforgrades4,8,and10.
Seehttp://www.tea.state.tx.us/perfreportformoredetailsonthestatewideaccountabilitysystem.
State assessment for NCLB accountability:TexasAssessmentofKnowledgeandSkills(TAKS)State student achievement levels: DidNotMeettheStandard,MettheStandard,CommendedPerformance
NCLB Accountability Goals 2001-02 Annual measurable Target objective starting point (2002-03)Grade4 Reading 46.8% 46.8% Mathematics 33.4 33.4Grade8 Reading 46.8 46.8 Mathematics 33.4 33.4 Grade10 Reading 46.8 46.8 Mathematics 33.4 33.4
2002-03 NCLB accountability results, applied to 2003-04 school year AYP outcomes and consequences* Title I schools All schools All districtsMadeAYP 4,241(88%) 6,262(81%) 1,001(82%)Identifiedforimprovement:
Year1 6 (*) 6 (*) 0Year2 3 (*) 3 (*) 0Correctiveaction 0 0 0Restructuring 0 0 0
Exitedimprovementstatus(madeAYPtwice n/a n/a n/aaftermissingtwiceormore,includestotal“made”above)
Other indicator, 2002-03 State target State outcome
Elementaryindicator:Attendance Meetorexceed90% MetMiddleindicator:Attendance Meetorexceed90% MetHighschoolindicator:Graduationrate Meetorexceed70% Met
NCLB choice participation Number of Title I students Percent of eligible students
TitleIschoolchoice: 0 0Supplementaleducationalservices: 45 *
*SomeAYPoutcomesforthisstatearenotavailableduetoissueswithdatacollection,measurement,orotherreasons.Formoreinformationpleasevisitthestate’sWebsite,above.
ReadingProficient level or above for: Grade 4 Grade 8 Grade 10Allstudents 86% 88% 81%Economicallydisadvantagedstudents 78 82 73Migrantstudents 72 75 63Studentswithdisabilities 79 71 52StudentswithlimitedEnglishproficiency 70 45 31Black,non-Hispanicstudents 76 82 76Hispanicstudents 80 83 73White,non-Hispanicstudents 93 94 91
Studentachievementtrend:Readingpercentproficientlevelorabove
0%
25%
50%
75%
100%818886 2003
20022001
Grade10Grade8Grade4
n/an/a
Texas
Texas Assessment of Knowledge and Skills, used for NCLB accountability
101
MathematicsProficient level or above for: Grade 4 Grade 8 Grade 10Allstudents 87% 73% 73%Economicallydisadvantagedstudents 81 60 61Migrantstudents 77 54 56Studentswithdisabilities 80 46 39StudentswithlimitedEnglishproficiency 74 32 43Black,non-Hispanicstudents 78 57 59Hispanicstudents 83 63 64White,non-Hispanicstudents 94 84 83
Studentachievementtrend:Mathematicspercentproficientlevelorabove
0%
25%
50%
75%
100%
737387 2003
20022001
Grade10Grade8Grade4
n/an/a
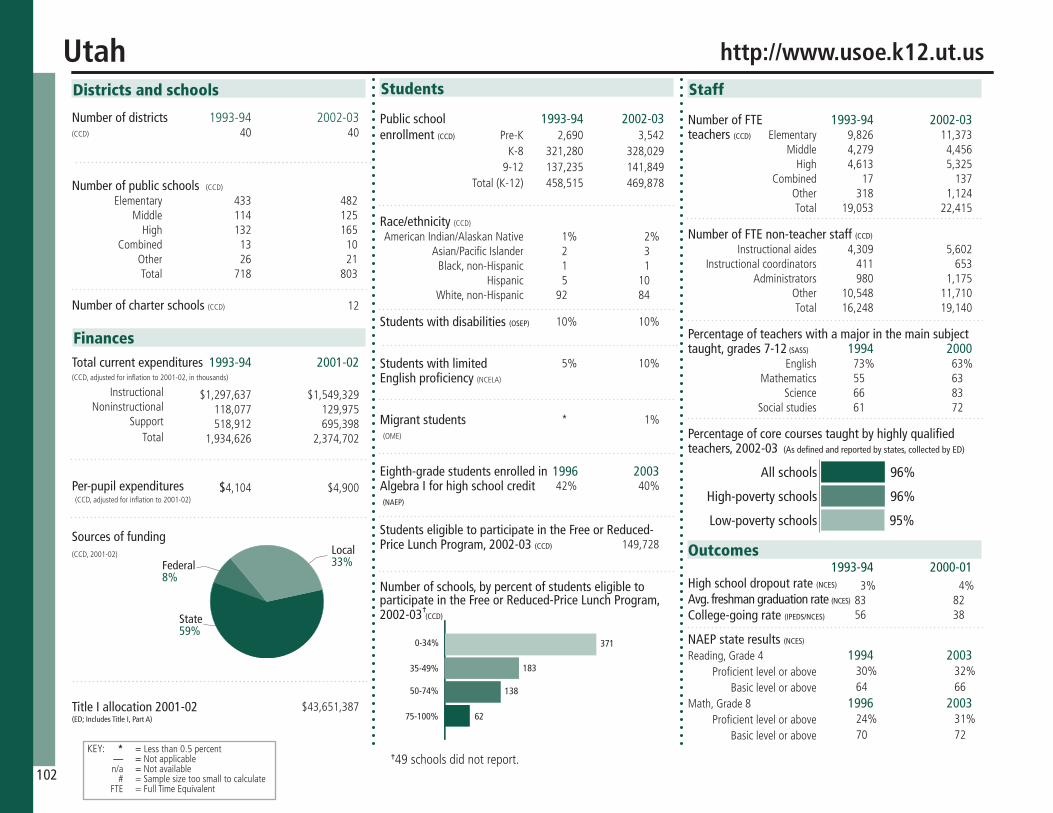
Staff
Number of FTE 1993-94 2002-03teachers (CCD) Elementary Middle High Combined Other Total
Number of FTE non-teacher staff (CCD)
Instructionalaides Instructionalcoordinators Administrators Other Total
Percentage of teachers with a major in the main subject taught, grades 7-12 (SASS) 1994 2000 English Mathematics Science Socialstudies
Percentage of core courses taught by highly qualified teachers, 2002-03 (As defined and reported by states, collected by ED)
Students
Public school 1993-94 2002-03enrollment (CCD) Pre-K K-8 9-12 Total(K-12)
Race/ethnicity (CCD) AmericanIndian/AlaskanNative Asian/PacificIslander Black,non-Hispanic Hispanic White,non-Hispanic
Students with disabilities (OSEP)
Students with limited English proficiency (NCELA)
Migrant students (OME)
Eighth-grade students enrolled in 1996 2003Algebra I for high school credit (NAEP)
Students eligible to participate in the Free or Reduced- Price Lunch Program, 2002-03 (CCD) Outcomes
1993-94 2000-01High school dropout rate (NCES)
Avg. freshman graduation rate (NCES) College-going rate (IPEDS/NCES)
NAEP state results (NCES) Reading,Grade4 1994 2003 Proficientlevelorabove BasicleveloraboveMath,Grade8 1996 2003 Proficientlevelorabove Basiclevelorabove
Number of districts 1993-94 2002-03(CCD)
Number of public schools (CCD)
Elementary Middle High Combined Other Total
Number of charter schools (CCD)
Districts and schools
Number of schools, by percent of students eligible to participate in the Free or Reduced-Price Lunch Program, 2002-03 (CCD)
Sources of funding(CCD,2001-02)
Title I allocation 2001-02 (ED; Includes Title I, Part A)
Total current expenditures 1993-94 2001-02 (CCD,adjustedforinflationto2001-02,inthousands)
Instructional Noninstructional Support Total
Per-pupil expenditures (CCD,adjustedforinflationto2001-02)
KEY: * =Lessthan0.5percent — = NotapplicableK n/a = Notavailable # =Samplesizetoosmalltocalculate FTE =FullTimeEquivalent
Finances
9,826 11,373 4,279 4,456 4,613 5,325 17 137 318 1,124 19,053 22,415
4,309 5,602 411 653 980 1,175 10,548 11,710 16,248 19,140
73% 63% 55 63 66 83 61 72
2,690 3,542 321,280 328,029 137,235 141,849 458,515 469,878
1% 2% 2 3 1 1 5 10 92 84
10% 10%
5% 10%
* 1%
42% 40%
149,728
3% 4% 83 82 56 38
30% 32% 64 66
24% 31% 70 72
40 40
433482 114125 132165 1310 2621 718803
12
Utah http://www.usoe.k12.ut.us
$43,651,387
$1,297,637 $1,549,329 118,077 129,975 518,912 695,398 1,934,626 2,374,702
$4,104 $4,900
102
0-34%
35-49%
50-74%
75-100%
183
138
62
371
96%
96%
95%Low-poverty schools
High-poverty schools
All schools
Federal8%
State59%
Local33%
^
^49schoolsdidnotreport.

S t u d e n t A c h i e v e m e n t 2 0 0 2 - 0 3S t a t e w i d e A c c o u n t a b i l i t y I n f o r m a t i o n
SeeAppendixBforUtah’sdefinitionsofproficientforlanguageartsandmathematicsforgrades4,8,10.
Seehttp://www.usoe.k12.ut.us/default/annual_report_03_04.pdfformoredetailsonthestatewideaccountabilitysystem.
State assessment for NCLB accountability:UtahPerformanceAssessmentSystemforStudentsState student achievement levels: Minimal,Partial,Sufficient,Substantial
NCLB Accountability Goals 2001-02 Annual measurable Target objective starting point (2002-03)Grade4 Languagearts 65% 65% Mathematics 57 57Grade8 Languagearts 64 65 Mathematics 35 57 Grade10 Languagearts 64 64 Mathematics 35 35
2002-03 NCLB accountability results, applied to 2003-04 school year AYP outcomes and consequences* Title I schools All schools All districtsMadeAYP 143(67%) 600(73%) 42(81%)Identifiedforimprovement:
Year1 72(33%) 227(27%) 10(19%)Year2 0 0 0Correctiveaction 0 0 0Restructuring 0 0 0
Exitedimprovementstatus(madeAYPtwice n/a n/a n/aaftermissingtwiceormore,includestotal“made”above)
Other indicator, 2002-03 State target State outcome
Elementaryindicator:Attendance Meetorprogresstoward93% MetMiddleindicator:Attendance Meetorprogresstoward93% MetHighschoolindicator:Graduationor Meetorprogresstoward85.7%(graduation) attendance or93%(attendance) Met
NCLB choice participation Number of Title I students Percent of eligible students
TitleIschoolchoice: n/a n/aSupplementaleducationalservices: n/a n/a
*SomeAYPoutcomesforthisstatearenotavailableduetoissueswithdatacollection,measurement,orotherreasons.Formoreinformationpleasevisitthestate’sWebsite,above.
Language artsProficient level or above for: Grade 4 Grade 8 Grade 10Allstudents 79% 72% 80%Economicallydisadvantagedstudents 65 54 65Migrantstudents 48 31 40Studentswithdisabilities 38 28 37StudentswithlimitedEnglishproficiency 12 33 43Black,non-Hispanicstudents 61 53 57Hispanicstudents 52 43 51White,non-Hispanicstudents 82 76 83
Studentachievementtrend:Languageartspercentproficientlevelorabove
0%
25%
50%
75%
100%80
72798082 2003
20022001
Grade10Grade8Grade4n/a n/a n/an/a
Utah
Utah Performance Assessment System for Students, used for NCLB accountability
103
MathematicsProficient level or above for: Grade 4 Grade 8 Grade 10Allstudents 73% 73% 49%Economicallydisadvantagedstudents 62 56 40Migrantstudents 47 40 30Studentswithdisabilities 38 32 27StudentswithlimitedEnglishproficiency 52 40 26Black,non-Hispanicstudents 56 47 22Hispanicstudents 50 46 31White,non-Hispanicstudents 77 77 55
Studentachievementtrend:Mathematicspercentproficientlevelorabove
0%
25%
50%
75%
100%
49
7373200320022001
Grade10Grade8Grade4
n/an/a
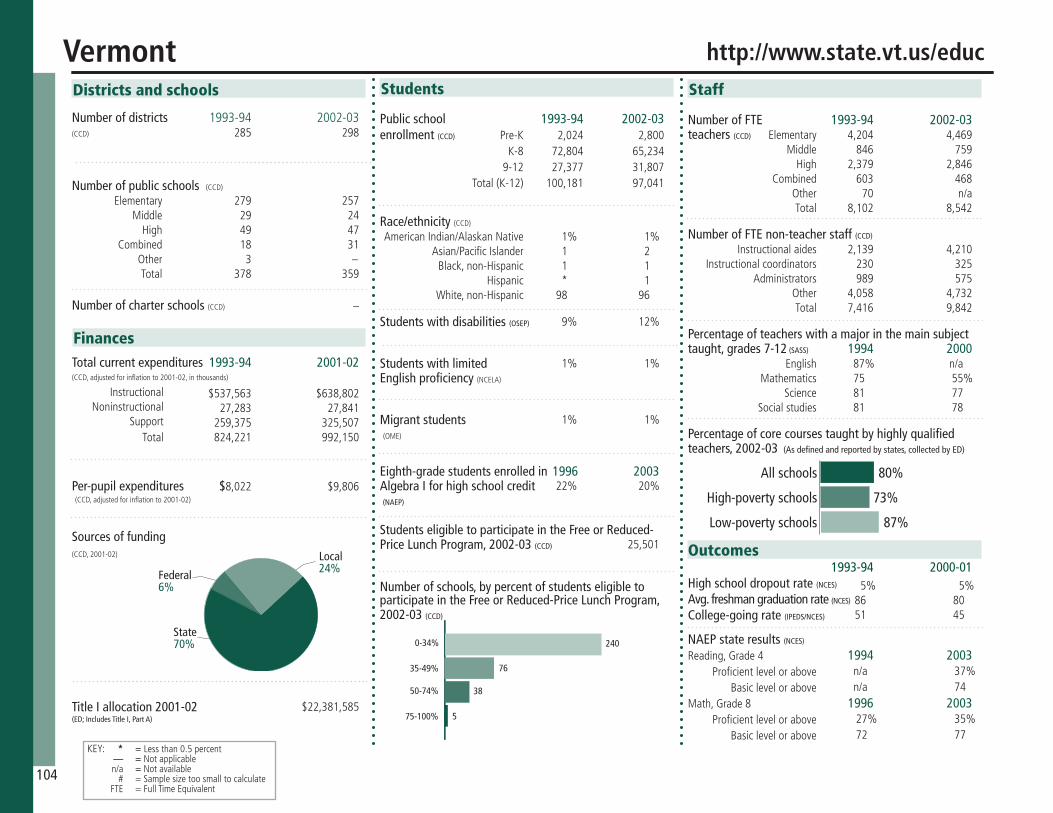
Staff
Number of FTE 1993-94 2002-03teachers (CCD) Elementary Middle High Combined Other Total
Number of FTE non-teacher staff (CCD)
Instructionalaides Instructionalcoordinators Administrators Other Total
Percentage of teachers with a major in the main subject taught, grades 7-12 (SASS) 1994 2000 English Mathematics Science Socialstudies
Percentage of core courses taught by highly qualified teachers, 2002-03 (As defined and reported by states, collected by ED)
Students
Public school 1993-94 2002-03enrollment (CCD) Pre-K K-8 9-12 Total(K-12)
Race/ethnicity (CCD) AmericanIndian/AlaskanNative Asian/PacificIslander Black,non-Hispanic Hispanic White,non-Hispanic
Students with disabilities (OSEP)
Students with limited English proficiency (NCELA)
Migrant students (OME)
Eighth-grade students enrolled in 1996 2003Algebra I for high school credit (NAEP)
Students eligible to participate in the Free or Reduced- Price Lunch Program, 2002-03 (CCD) Outcomes
1993-94 2000-01High school dropout rate (NCES)
Avg. freshman graduation rate (NCES) College-going rate (IPEDS/NCES)
NAEP state results (NCES) Reading,Grade4 1994 2003 Proficientlevelorabove BasicleveloraboveMath,Grade8 1996 2003 Proficientlevelorabove Basiclevelorabove
Number of districts 1993-94 2002-03(CCD)
Number of public schools (CCD)
Elementary Middle High Combined Other Total
Number of charter schools (CCD)
Districts and schools
Number of schools, by percent of students eligible to participate in the Free or Reduced-Price Lunch Program, 2002-03 (CCD)
Sources of funding(CCD,2001-02)
Title I allocation 2001-02 (ED; Includes Title I, Part A)
Total current expenditures 1993-94 2001-02 (CCD,adjustedforinflationto2001-02,inthousands)
Instructional Noninstructional Support Total
Per-pupil expenditures (CCD,adjustedforinflationto2001-02)
KEY: * =Lessthan0.5percent — = NotapplicableK n/a = Notavailable # =Samplesizetoosmalltocalculate FTE =FullTimeEquivalent
Finances
4,204 4,469 846 759 2,379 2,846 603 468 70 n/a 8,102 8,542
2,139 4,210 230 325 989 575 4,058 4,732 7,416 9,842
87% n/a 75 55% 81 77 81 78
2,024 2,800 72,804 65,234 27,377 31,807 100,181 97,041
1% 1% 1 2 1 1 * 1 98 96
9% 12%
1% 1%
1% 1%
22% 20%
25,501
5% 5% 86 80 51 45
n/a 37% n/a 74
27% 35% 72 77
285 298
279 257 29 24 49 47 18 31 3– 378 359
–
Vermont http://www.state.vt.us/educ
$22,381,585
$537,563 $638,802 27,283 27,841 259,375 325,507 824,221 992,150
$8,022 $9,806
104
0-34%
35-49%
50-74%
75-100%
76
38
5
240
80%
73%
87%Low-poverty schools
High-poverty schools
All schools
Local24%Federal
6%
State70%

S t u d e n t A c h i e v e m e n t 2 0 0 2 - 0 3S t a t e w i d e A c c o u n t a b i l i t y I n f o r m a t i o n
SeeAppendixBforVermont’sdefinitionsofproficientforEnglishandlanguagearts:ReadingbasicunderstandingandMathematics:Mathskillsforgrades4,8,and10.
Seehttp://crs.uvm.edu/schlrpt/cfusion/schlrpt04/vermont.cfmformoredetailsontheVermont’ssystem.
State assessment for NCLB accountability:NewStandardsReferenceExaminationsState student achievement levels: LittleEvidenceofAchievement,BelowtheStandard,NearlyAchievestheStandard,AchievestheStandard,AchievestheStandardwithHonors
NCLB Accountability Goals 2001-02 Annual measurable Target objective starting point (2002-03)Grade4 English&languagearts 300 300 Mathematics 175 175Grade8 English&languagearts 300 300 Mathematics 175 175 Grade10 English&languagearts 300 300 Mathematics 175 175
2002-03 NCLB accountability results, applied to 2003-04 school year AYP outcomes and consequences Title I schools All schools All districtsMadeAYP 183(86%) 267(87%) 19(32%)Identifiedforimprovement:
Year1 2 (1%) 3 (1%) 0Year2 1 (*) 4 (1%) 0Correctiveaction 1 (*) 2 (1%) 0Restructuring 0 0 0
Exitedimprovementstatus(madeAYPtwice 0 0 0aftermissingtwiceormore,includestotal“made”above)
Other indicator, 2002-03 State target State outcome
Elementaryindicator:VT-Dev.Read.Assessment Lessthan15%ofstudents MetMiddleindicator:NewStandardsReferenceExam inlowesttwoproficiencylevels MetHighschoolindicator:Graduationrateor 75%orlessthan15%ofstudents Met NSREReading:BasicUnderstandingperformance inlowesttwoproficiencylevels
NCLB choice participation Number of Title I students Percent of eligible students
TitleIschoolchoice: 0 0Supplementaleducationalservices: 0 0
English and language arts: Reading basic understandingProficient level or above for: Grade 4 Grade 8 Grade 10Allstudents 81% 62% 55%Economicallydisadvantagedstudents 70 46 36Migrantstudents # # #Studentswithdisabilities 48 24 14StudentswithlimitedEnglishproficiency 62 15 11Black,non-Hispanicstudents 78 53 37Hispanicstudents 75 60 39White,non-Hispanicstudents 81 62 55
Studentachievementtrend:Englishandlanguagearts:Readingbasicunderstandingpercentproficientlevelorabove
Vermont
New Standards Reference Examinations, used for NCLB accountability
105
Mathematics: Math skillsProficient level or above for: Grade 4 Grade 8 Grade 10Allstudents 73% 67% 62%Economicallydisadvantagedstudents 60 51 43Migrantstudents # # #Studentswithdisabilities 43 29 21StudentswithlimitedEnglishproficiency 56 42 26Black,non-Hispanicstudents 60 50 37Hispanicstudents 62 60 45White,non-Hispanicstudents 74 68 63
Studentachievementtrend:Mathematics:Mathskillspercentproficientlevelorabove
0%
25%
50%
75%
100%
626773200320022001
Grade10Grade8Grade4
n/an/a
0%
25%
50%
75%
100%
5562
81 200320022001
Grade10Grade8Grade4
n/an/a

Staff
Number of FTE 1993-94 2002-03teachers (CCD) Elementary Middle High Combined Other Total
Number of FTE non-teacher staff (CCD)
Instructionalaides Instructionalcoordinators Administrators Other Total
Percentage of teachers with a major in the main subject taught, grades 7-12 (SASS) 1994 2000 English Mathematics Science Socialstudies
Percentage of core courses taught by highly qualified teachers, 2002-03 (As defined and reported by states, collected by ED)
Students
Public school 1993-94 2002-03enrollment (CCD) Pre-K K-8 9-12 Total(K-12)
Race/ethnicity (CCD) AmericanIndian/AlaskanNative Asian/PacificIslander Black,non-Hispanic Hispanic White,non-Hispanic
Students with disabilities (OSEP)
Students with limited English proficiency (NCELA)
Migrant students (OME)
Eighth-grade students enrolled in 1996 2003Algebra I for high school credit (NAEP)
Students eligible to participate in the Free or Reduced- Price Lunch Program, 2002-03 (CCD) Outcomes
1993-94 2000-01High school dropout rate (NCES)
Avg. freshman graduation rate (NCES) College-going rate (IPEDS/NCES)
NAEP state results (NCES) Reading,Grade4 1994 2003 Proficientlevelorabove BasicleveloraboveMath,Grade8 1996 2003 Proficientlevelorabove Basiclevelorabove
Number of districts 1993-94 2002-03(CCD)
Number of public schools (CCD)
Elementary Middle High Combined Other Total
Number of charter schools (CCD)
Districts and schools
Number of schools, by percent of students eligible to participate in the Free or Reduced-Price Lunch Program, 2002-03 (CCD)
Sources of funding(CCD,2001-02)
Title I allocation 2001-02 (ED; Includes Title I, Part A)
Total current expenditures 1993-94 2001-02 (CCD,adjustedforinflationto2001-02,inthousands)
Instructional Noninstructional Support Total
Per-pupil expenditures (CCD,adjustedforinflationto2001-02)
KEY: * =Lessthan0.5percent — = NotapplicableK n/a = Notavailable # =Samplesizetoosmalltocalculate FTE =FullTimeEquivalent
Finances
28,540 44,038 12,131 20,273 27,535 26,895 575 561 1,440 8,153 70,221 99,920
11,209 2,632 1,077 1,465 5,183 5,963 41,705 53,015 59,174 63,075
93% 63% 69 59 67 74 84 77
3,186 14,507 734,673 815,946 278,009 345,720 1,012,682 1,161,666
* * 3% 5% 26 27 3 6 68 62
11% 12%
n/a 4%
* *
29% 28%
355,212
5% 4% 76 78 53 53
26% 35% 57 69
21% 31% 58 72
141 135
1,0931,160 308341 286315 1322 448 1,7441,846
7
Virginia http://www.pen.k12.va.us
$174,346,805
$4,192,655 $5,373,764 361,991 340,875 2,411,355 3,003,915 6,966,001 8,718,554
$6,663 $7,496
106
0-34%
35-49%
50-74%
75-100%
347
384
134
899
92%
93%
92%Low-poverty schools
High-poverty schools
All schools
Local53%Federal
6%
State41%
^
^82schoolsdidnotreport.

S t u d e n t A c h i e v e m e n t 2 0 0 2 - 0 3S t a t e w i d e A c c o u n t a b i l i t y I n f o r m a t i o n
SeeAppendixBforVirginia’sdefinitionsofproficientforEnglishandmathematicsforgrades3,8,and11.
Seehttp://www.pen.k12.va.us/VDOE/src/vasrc-reportcard-intropage.shtmlformoredetailsonthestatewideaccountabilitysystem.
State assessment for NCLB accountability:StandardsofLearningAssessmentsState student achievement levels: Fails/Doesnotmeetthestandard,Pass/Proficient,Pass/Advanced
NCLB Accountability Goals 2001-02 Annual measurable Target objective starting point (2002-03)Grade3 English 60.7% 61% Mathematics 58.4 59Grade8 English 60.7 61 Mathematics 58.4 59 Grade11 English 60.7 61 Mathematics 58.4 59
2002-03 NCLB accountability results, applied to 2003-04 school year AYP outcomes and consequences* Title I schools All schools All districtsMadeAYP 457(58%) 1,064(59%) 109(83%)Identifiedforimprovement:
Year1 22 (3%) 22 (1%) 0Year2 22 (3%) 22 (1%) 0Correctiveaction 0 0 0Restructuring 0 0 0
Exitedimprovementstatus(madeAYPtwice n/a n/a n/aaftermissingtwiceormore,includestotal“made”above)
Other indicator, 2002-03 State target State outcome
Elementaryindicator:Attendancerate 94% MetMiddleindicator:Attendancerate 94% MetHighschoolindicator:Graduationrate 51.7% Met
NCLB choice participation Number of Title I students Percent of eligible students
TitleIschoolchoice: 432 *Supplementaleducationalservices: 1,301 1%
*SomeAYPoutcomesforthisstatearenotavailableduetoissueswithdatacollection,measurement,orotherreasons.Formoreinformationpleasevisitthestate’sWebsite,above.
EnglishProficient level or above for: Grade 3 Grade 8 Grade 11Allstudents 72% 70% 92%Economicallydisadvantagedstudents 57 50 86Migrantstudents 47 46 76Studentswithdisabilities 54 37 73StudentswithlimitedEnglishproficiency 56 35 79Black,non-Hispanicstudents 58 52 86Hispanicstudents 62 53 88White,non-Hispanicstudents 79 78 95
Studentachievementtrend:Englishpercentproficientlevelorabove
0%
25%
50%
75%
100% 92
7072 7071 7364
200320022001
Grade11Grade8Grade3n/an/a
Virginia
Standards of Learning Assessments, used for NCLB accountability
107
MathematicsProficient level or above for: Grade 3 Grade 8 Grade 11Allstudents 83% 75% 80%Economicallydisadvantagedstudents 72 59 69Migrantstudents 63 59 73Studentswithdisabilities 64 39 54StudentswithlimitedEnglishproficiency 75 65 74Black,non-Hispanicstudents 72 59 65Hispanicstudents 78 68 73White,non-Hispanicstudents 88 81 84
Studentachievementtrend:Mathematicspercentproficientlevelorabove
0%
25%
50%
75%
100%8075
8370
8068
77200320022001
Grade11Grade8Grade3n/a n/a

Staff
Number of FTE 1993-94 2002-03teachers (CCD) Elementary Middle High Combined Other Total
Number of FTE non-teacher staff (CCD)
Instructionalaides Instructionalcoordinators Administrators Other Total
Percentage of teachers with a major in the main subject taught, grades 7-12 (SASS) 1994 2000 English Mathematics Science Socialstudies
Percentage of core courses taught by highly qualified teachers, 2002-03 (As defined and reported by states, collected by ED)
Students
Public school 1993-94 2002-03enrollment (CCD) Pre-K K-8 9-12 Total(K-12)
Race/ethnicity (CCD) AmericanIndian/AlaskanNative Asian/PacificIslander Black,non-Hispanic Hispanic White,non-Hispanic
Students with disabilities (OSEP)
Students with limited English proficiency (NCELA)
Migrant students (OME)
Eighth-grade students enrolled in 1996 2003Algebra I for high school credit (NAEP)
Students eligible to participate in the Free or Reduced- Price Lunch Program, 2002-03 (CCD) Outcomes
1993-94 2000-01High school dropout rate (NCES)
Avg. freshman graduation rate (NCES) College-going rate (IPEDS/NCES)
NAEP state results (NCES) Reading,Grade4 1994 2003 Proficientlevelorabove BasicleveloraboveMath,Grade8 1996 2003 Proficientlevelorabove Basiclevelorabove
Number of districts 1993-94 2002-03(CCD)
Number of public schools (CCD)
Elementary Middle High Combined Other Total
Number of charter schools (CCD)
Districts and schools
Number of schools, by percent of students eligible to participate in the Free or Reduced-Price Lunch Program, 2002-03 (CCD)
Sources of funding(CCD,2001-02)
Title I allocation 2001-02 (ED; Includes Title I, Part A)
Total current expenditures 1993-94 2001-02 (CCD,adjustedforinflationto2001-02,inthousands)
Instructional Noninstructional Support Total
Per-pupil expenditures (CCD,adjustedforinflationto2001-02)
KEY: * =Lessthan0.5percent — = NotapplicableK n/a = Notavailable # =Samplesizetoosmalltocalculate FTE =FullTimeEquivalent
Finances
22,655 25,666 8,655 10,760 10,728 13,460 979 1,087 2,507 1,980 45,524 52,953
7,940 10,116 656 2,394 3,455 3,754 30,391 43,523 42,442 59,787
64% 65% 49 55 83 79 75 77
5,087 9,802 655,337 687,389 255,528 317,607 910,865 1,004,996
3% 3% 6 8 4 6 7 12 80 73
9% 10%
3% 7%
3% 5%
26% 20%
347,562
n/a n/a 80% 69% 57 45
27% 33% 59 67
26% 32% 67 72
296 296
1,0871,180 298358 371476 90154 1439 1,8602,207
–
Washington http://www.k12.wa.us
$142,698,964
$3,739,586 $4,227,572 289,051 345,126 2,234,928 2,531,023 6,263,564 7,103,721
$6,839 $7,039
108
0-34%
35-49%
50-74%
75-100%
392
405
186
878
82%
85%
79%Low-poverty schools
High-poverty schools
All schools
Local29%Federal
9%
State62%
^
^346schoolsdidnotreport.

S t u d e n t A c h i e v e m e n t 2 0 0 2 - 0 3S t a t e w i d e A c c o u n t a b i l i t y I n f o r m a t i o n
SeeAppendixBforWashington’sdefinitionsofproficientforreadingandmathematicsforgrades4,7,andhighschool.
Seehttp://reportcard.ospi.k12.wa.us/Reports/WASLTrend.aspx?&schoolId=1&reportLevel=Stateformoredetailsonthestatewideaccountabilitysystem.
State assessment for NCLB accountability:WashingtonAssessmentofStudentLearning(WASL)State student achievement levels: Level1,Level2,Level3,Level4
NCLB Accountability Goals 2001-02 Annual measurable Target objective starting point (2002-03)Grade4 Reading 52.2% 52.2% Mathematics 29.7 29.7Grade7 Reading 30.1 30.1 Mathematics 17.3 17.3 HighschoolReading 48.6 48.6 Mathematics 24.8 24.8
2002-03 NCLB accountability results, applied to 2003-04 school year AYP outcomes and consequences Title I schools All schools All districtsMadeAYP 725(79%) 1,563(72%) 173(66%)Identifiedforimprovement:
Year1 11 (1%) 17 (1%) 0Year2 30 (3%) 30 (1%) 0Correctiveaction 4 (*) 4 (*) 0Restructuring 0 0 0
Exitedimprovementstatus(madeAYPtwice 13 (1%) 13 (1%) 0aftermissingtwiceormore,includestotal“made”above)
Other indicator, 2002-03 State target State outcome
Elementary/middleindicator:Attendance Meetorprogresstowardunexcused Met absencerateof1%orlessHighschoolindicator:Graduationrate 73%orhigher Met
NCLB choice participation Number of Title I students Percent of eligible students
TitleIschoolchoice: 377 *Supplementaleducationalservices: 250 *
ReadingProficient level or above for: Grade 4 Grade 7 High schoolAllstudents 67% 48% 60%Economicallydisadvantagedstudents 52 30 43Migrantstudents 30 13 29Studentswithdisabilities 31 10 12StudentswithlimitedEnglishproficiency 24 7 12Black,non-Hispanicstudents 52 28 37Hispanicstudents 41 24 35White,non-Hispanicstudents 73 53 65
Studentachievementtrend:Readingpercentproficientlevelorabove
0%
25%
50%
75%
100%
6048
6759
44
66 63
40
67
200320022001
HighSchoolGrade7Grade4
Washington
Washington Assessment of Student Learning, used for NCLB accountability
109
MathematicsProficient level or above for: Grade 4 Grade 7 High schoolAllstudents 55% 37% 40%Economicallydisadvantagedstudents 40 20 24Migrantstudents 24 8 16Studentswithdisabilities 25 5 4StudentswithlimitedEnglishproficiency 20 6 8Black,non-Hispanicstudents 36 14 14Hispanicstudents 31 15 16White,non-Hispanicstudents 62 42 44
Studentachievementtrend:Mathematicspercentproficientlevelorabove
0%
25%
50%
75%
100%
4037
55
3830
5239
2743
200320022001
HighSchoolGrade7Grade4
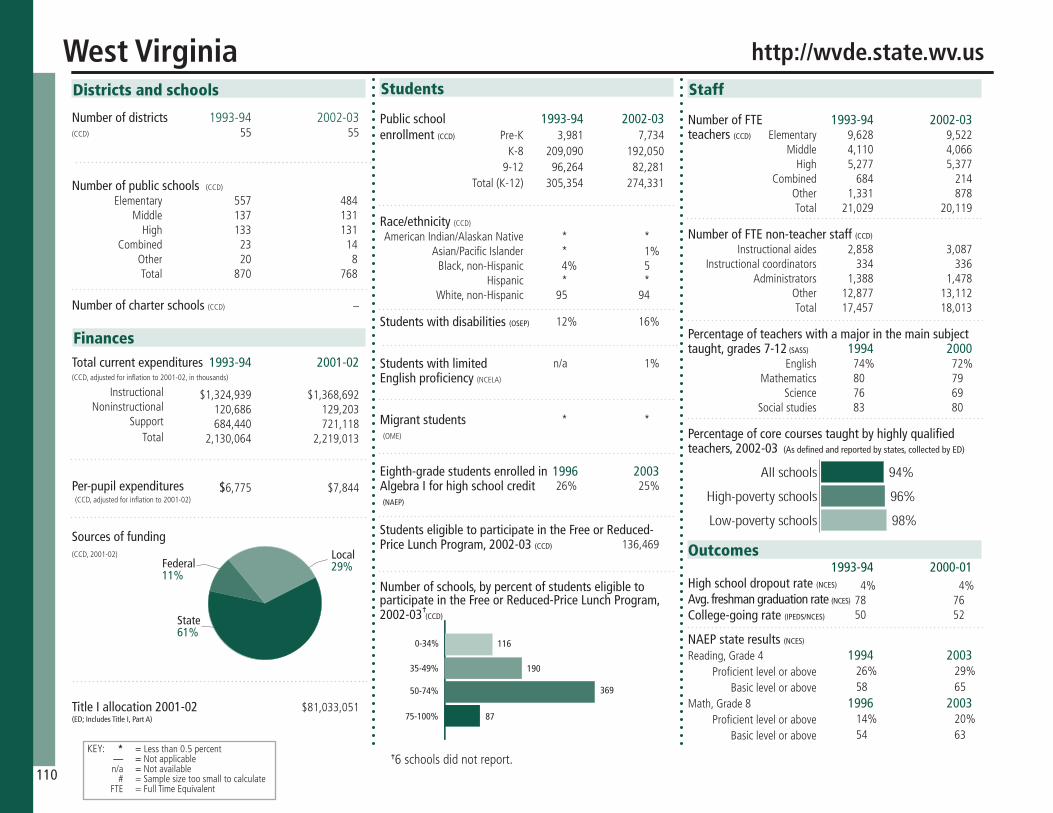
Staff
Number of FTE 1993-94 2002-03teachers (CCD) Elementary Middle High Combined Other Total
Number of FTE non-teacher staff (CCD)
Instructionalaides Instructionalcoordinators Administrators Other Total
Percentage of teachers with a major in the main subject taught, grades 7-12 (SASS) 1994 2000 English Mathematics Science Socialstudies
Percentage of core courses taught by highly qualified teachers, 2002-03 (As defined and reported by states, collected by ED)
Students
Public school 1993-94 2002-03enrollment (CCD) Pre-K K-8 9-12 Total(K-12)
Race/ethnicity (CCD) AmericanIndian/AlaskanNative Asian/PacificIslander Black,non-Hispanic Hispanic White,non-Hispanic
Students with disabilities (OSEP)
Students with limited English proficiency (NCELA)
Migrant students (OME)
Eighth-grade students enrolled in 1996 2003Algebra I for high school credit (NAEP)
Students eligible to participate in the Free or Reduced- Price Lunch Program, 2002-03 (CCD) Outcomes
1993-94 2000-01High school dropout rate (NCES)
Avg. freshman graduation rate (NCES) College-going rate (IPEDS/NCES)
NAEP state results (NCES) Reading,Grade4 1994 2003 Proficientlevelorabove BasicleveloraboveMath,Grade8 1996 2003 Proficientlevelorabove Basiclevelorabove
Number of districts 1993-94 2002-03(CCD)
Number of public schools (CCD)
Elementary Middle High Combined Other Total
Number of charter schools (CCD)
Districts and schools
Number of schools, by percent of students eligible to participate in the Free or Reduced-Price Lunch Program, 2002-03 (CCD)
Sources of funding(CCD,2001-02)
Title I allocation 2001-02 (ED; Includes Title I, Part A)
Total current expenditures 1993-94 2001-02 (CCD,adjustedforinflationto2001-02,inthousands)
Instructional Noninstructional Support Total
Per-pupil expenditures (CCD,adjustedforinflationto2001-02)
KEY: * =Lessthan0.5percent — = NotapplicableK n/a = Notavailable # =Samplesizetoosmalltocalculate FTE =FullTimeEquivalent
Finances
9,628 9,522 4,110 4,066 5,277 5,377 684 214 1,331 878 21,029 20,119
2,858 3,087 334 336 1,388 1,478 12,877 13,112 17,457 18,013
74% 72% 80 79 76 69 83 80
3,981 7,734 209,090 192,050 96,264 82,281 305,354 274,331
* * * 1% 4% 5 * * 95 94
12% 16%
n/a 1%
* *
26% 25%
136,469
4% 4% 78 76 50 52
26% 29% 58 65
14% 20% 54 63
55 55
557484 137131 133131 2314 208 870768
–
WestVirginia http://wvde.state.wv.us
$81,033,051
$1,324,939 $1,368,692 120,686 129,203 684,440 721,118 2,130,064 2,219,013
$6,775 $7,844
110
0-34%
35-49%
50-74%
75-100%
190
369
87
116
94%
96%
98%Low-poverty schools
High-poverty schools
All schools
Local29%Federal
11%
State61%
^
^6schoolsdidnotreport.
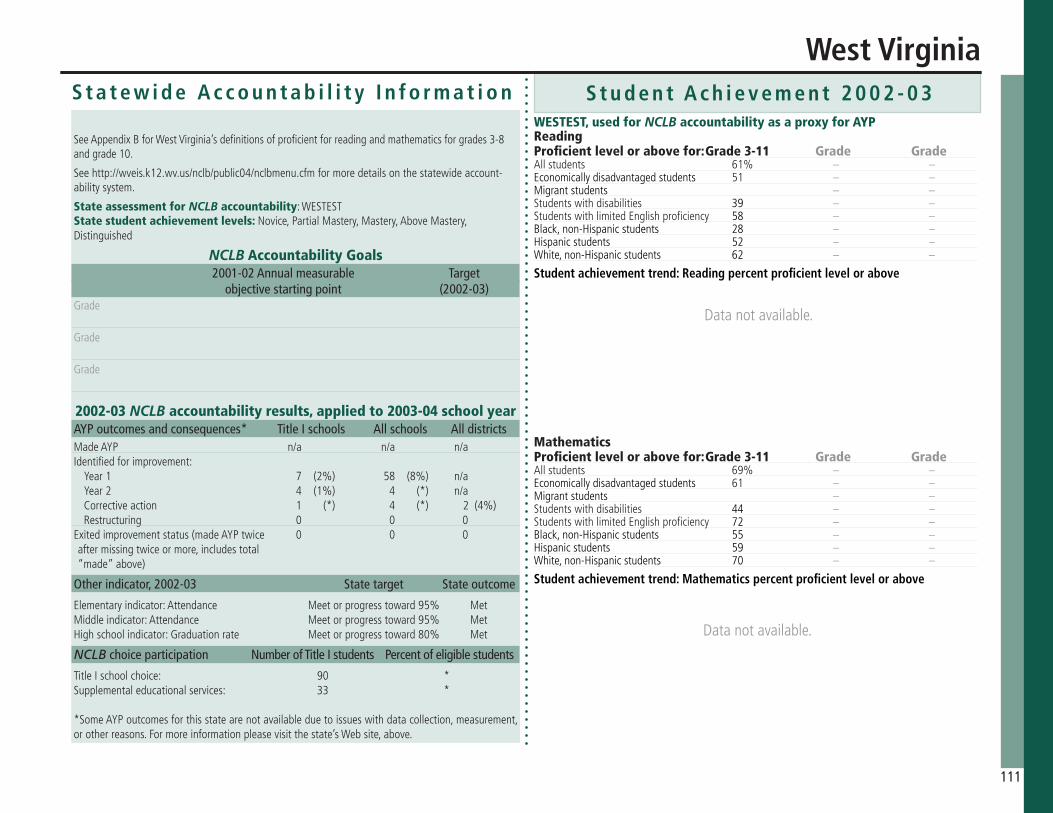
S t u d e n t A c h i e v e m e n t 2 0 0 2 - 0 3S t a t e w i d e A c c o u n t a b i l i t y I n f o r m a t i o n
SeeAppendixBforWestVirginia’sdefinitionsofproficientforreadingandmathematicsforgrades3-8andgrade10.
Seehttp://wveis.k12.wv.us/nclb/public04/nclbmenu.cfmformoredetailsonthestatewideaccount-abilitysystem.
State assessment for NCLB accountability:WESTESTState student achievement levels: Novice,PartialMastery,Mastery,AboveMastery,Distinguished
NCLB Accountability Goals 2001-02 Annual measurable Target objective starting point (2002-03)Grade Grade Grade
2002-03 NCLB accountability results, applied to 2003-04 school year AYP outcomes and consequences* Title I schools All schools All districtsMadeAYP n/a n/a n/aIdentifiedforimprovement:
Year1 7 (2%) 58 (8%) n/aYear2 4 (1%) 4 (*) n/aCorrectiveaction 1 (*) 4 (*)2(4%)Restructuring 0 0 0
Exitedimprovementstatus(madeAYPtwice 0 0 0aftermissingtwiceormore,includestotal“made”above)
Other indicator, 2002-03 State target State outcome
Elementaryindicator:Attendance Meetorprogresstoward95% MetMiddleindicator:Attendance Meetorprogresstoward95% MetHighschoolindicator:Graduationrate Meetorprogresstoward80% Met
NCLB choice participation Number of Title I students Percent of eligible students
TitleIschoolchoice: 90 *Supplementaleducationalservices: 33 *
*SomeAYPoutcomesforthisstatearenotavailableduetoissueswithdatacollection,measurement,orotherreasons.Formoreinformationpleasevisitthestate’sWebsite,above.
ReadingProficient level or above for: Grade 3-11 Grade Grade Allstudents 61% – –Economicallydisadvantagedstudents 51 – –Migrantstudents – –Studentswithdisabilities 39 – –StudentswithlimitedEnglishproficiency 58 – –Black,non-Hispanicstudents 28 – –Hispanicstudents 52 – –White,non-Hispanicstudents 62 – –
Studentachievementtrend:Readingpercentproficientlevelorabove
Datanotavailable.
WestVirginia
WESTEST, used for NCLB accountability as a proxy for AYP
111
MathematicsProficient level or above for: Grade 3-11 Grade GradeAllstudents 69% – –Economicallydisadvantagedstudents 61 – –Migrantstudents – –Studentswithdisabilities 44 – –StudentswithlimitedEnglishproficiency 72 – –Black,non-Hispanicstudents 55 – –Hispanicstudents 59 – –White,non-Hispanicstudents 70 – –
Studentachievementtrend:Mathematicspercentproficientlevelorabove
Datanotavailable.

Staff
Number of FTE 1993-94 2002-03teachers (CCD) Elementary Middle High Combined Other Total
Number of FTE non-teacher staff (CCD)
Instructionalaides Instructionalcoordinators Administrators Other Total
Percentage of teachers with a major in the main subject taught, grades 7-12 (SASS) 1994 2000 English Mathematics Science Socialstudies
Percentage of core courses taught by highly qualified teachers, 2002-03 (As defined and reported by states, collected by ED)
Students
Public school 1993-94 2002-03enrollment (CCD) Pre-K K-8 9-12 Total(K-12)
Race/ethnicity (CCD) AmericanIndian/AlaskanNative Asian/PacificIslander Black,non-Hispanic Hispanic White,non-Hispanic
Students with disabilities (OSEP)
Students with limited English proficiency (NCELA)
Migrant students (OME)
Eighth-grade students enrolled in 1996 2003Algebra I for high school credit (NAEP)
Students eligible to participate in the Free or Reduced- Price Lunch Program, 2002-03 (CCD) Outcomes
1993-94 2000-01High school dropout rate (NCES)
Avg. freshman graduation rate (NCES) College-going rate (IPEDS/NCES)
NAEP state results (NCES) Reading,Grade4 1994 2003 Proficientlevelorabove BasicleveloraboveMath,Grade8 1996 2003 Proficientlevelorabove Basiclevelorabove
Number of districts 1993-94 2002-03(CCD)
Number of public schools (CCD)
Elementary Middle High Combined Other Total
Number of charter schools (CCD)
Districts and schools
Number of schools, by percent of students eligible to participate in the Free or Reduced-Price Lunch Program, 2002-03 (CCD)
Sources of funding(CCD,2001-02)
Title I allocation 2001-02 (ED; Includes Title I, Part A)
Total current expenditures 1993-94 2001-02 (CCD,adjustedforinflationto2001-02,inthousands)
Instructional Noninstructional Support Total
Per-pupil expenditures (CCD,adjustedforinflationto2001-02)
KEY: * =Lessthan0.5percent — = NotapplicableK n/a = Notavailable # =Samplesizetoosmalltocalculate FTE =FullTimeEquivalent
Finances
24,508 28,447 10,278 12,052 15,742 18,092 523 1,334 1,771 461 52,822 60,385
7,565 12,851 314 1,663 3,973 3,461 23,966 34,902 35,818 52,877
75% 81% 76 75 68 82 85 85
17,270 26,092 578,447 565,592 248,284 289,333 826,731 854,925
3% 1% 1 3 1 10 6 5 89 79
10% 11%
2% 4%
* *
25% 22%
242,158
3% 2% 85 83 60 57
35% 33% 71 68
32% 35% 75 75
427 437
1,2351,251 347390 424511 2367 313 2,0322,232
128
Wisconsin http://www.dpi.state.wi.us
$149,746,614
$4,205,737 $4,705,538 198,240 243,733 2,215,036 2,642,906 6,619,013 7,592,177
$7,842 $8,634
112
0-34%
35-49%
50-74%
75-100%
338
210
146
1,441
99%
97%
Low-poverty schools
High-poverty schools
All schools
Not Available
Local41%Federal
6%
State54%
^
^97schoolsdidnotreport.
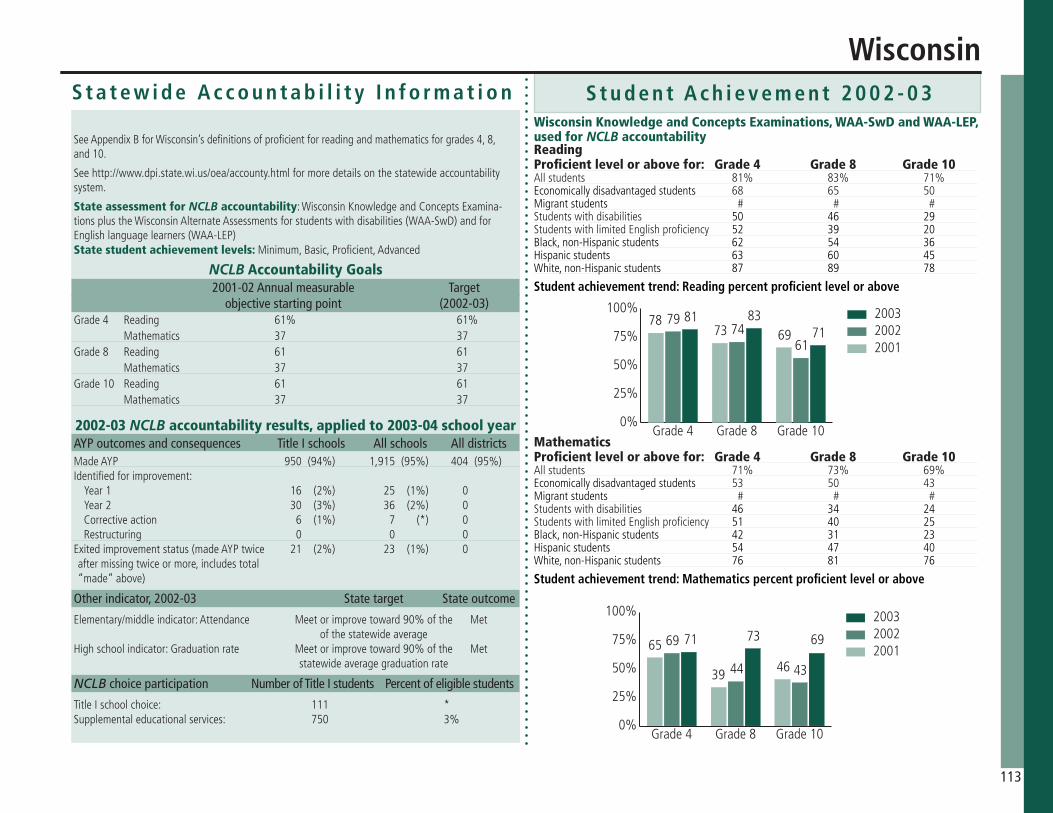
S t u d e n t A c h i e v e m e n t 2 0 0 2 - 0 3S t a t e w i d e A c c o u n t a b i l i t y I n f o r m a t i o n
SeeAppendixBforWisconsin’sdefinitionsofproficientforreadingandmathematicsforgrades4,8,and10.
Seehttp://www.dpi.state.wi.us/oea/accounty.htmlformoredetailsonthestatewideaccountabilitysystem.
State assessment for NCLB accountability:WisconsinKnowledgeandConceptsExamina-tionsplustheWisconsinAlternateAssessmentsforstudentswithdisabilities(WAA-SwD)andforEnglishlanguagelearners(WAA-LEP)State student achievement levels: Minimum,Basic,Proficient,Advanced
NCLB Accountability Goals 2001-02 Annual measurable Target objective starting point (2002-03)Grade4 Reading 61% 61% Mathematics 37 37Grade8 Reading 61 61 Mathematics 37 37 Grade10 Reading 61 61 Mathematics 37 37
2002-03 NCLB accountability results, applied to 2003-04 school year AYP outcomes and consequences Title I schools All schools All districtsMadeAYP 950(94%) 1,915(95%) 404(95%)Identifiedforimprovement:
Year1 16 (2%) 25 (1%) 0Year2 30 (3%) 36 (2%) 0Correctiveaction 6 (1%) 7 (*) 0Restructuring 0 0 0
Exitedimprovementstatus(madeAYPtwice 21 (2%) 23 (1%) 0aftermissingtwiceormore,includestotal“made”above)
Other indicator, 2002-03 State target State outcome
Elementary/middleindicator:Attendance Meetorimprovetoward90%ofthe Met ofthestatewideaverageHighschoolindicator:Graduationrate Meetorimprovetoward90%ofthe Met statewideaveragegraduationrate
NCLB choice participation Number of Title I students Percent of eligible students
TitleIschoolchoice: 111 *Supplementaleducationalservices: 750 3%
ReadingProficient level or above for: Grade 4 Grade 8 Grade 10Allstudents 81% 83% 71%Economicallydisadvantagedstudents 68 65 50Migrantstudents # # #Studentswithdisabilities 50 46 29StudentswithlimitedEnglishproficiency 52 39 20Black,non-Hispanicstudents 62 54 36Hispanicstudents 63 60 45White,non-Hispanicstudents 87 89 78
Studentachievementtrend:Readingpercentproficientlevelorabove
0%
25%
50%
75%
100%
718381
6174
796973
78 200320022001
Grade10Grade8Grade4
Wisconsin
Wisconsin Knowledge and Concepts Examinations, WAA-SwD and WAA-LEP, used for NCLB accountability
113
MathematicsProficient level or above for: Grade 4 Grade 8 Grade 10Allstudents 71% 73% 69%Economicallydisadvantagedstudents 53 50 43Migrantstudents # # #Studentswithdisabilities 46 34 24StudentswithlimitedEnglishproficiency 51 40 25Black,non-Hispanicstudents 42 31 23Hispanicstudents 54 47 40White,non-Hispanicstudents 76 81 76
Studentachievementtrend:Mathematicspercentproficientlevelorabove
0%
25%
50%
75%
100%
697371
4344
69
4639
65
200320022001
Grade10Grade8Grade4
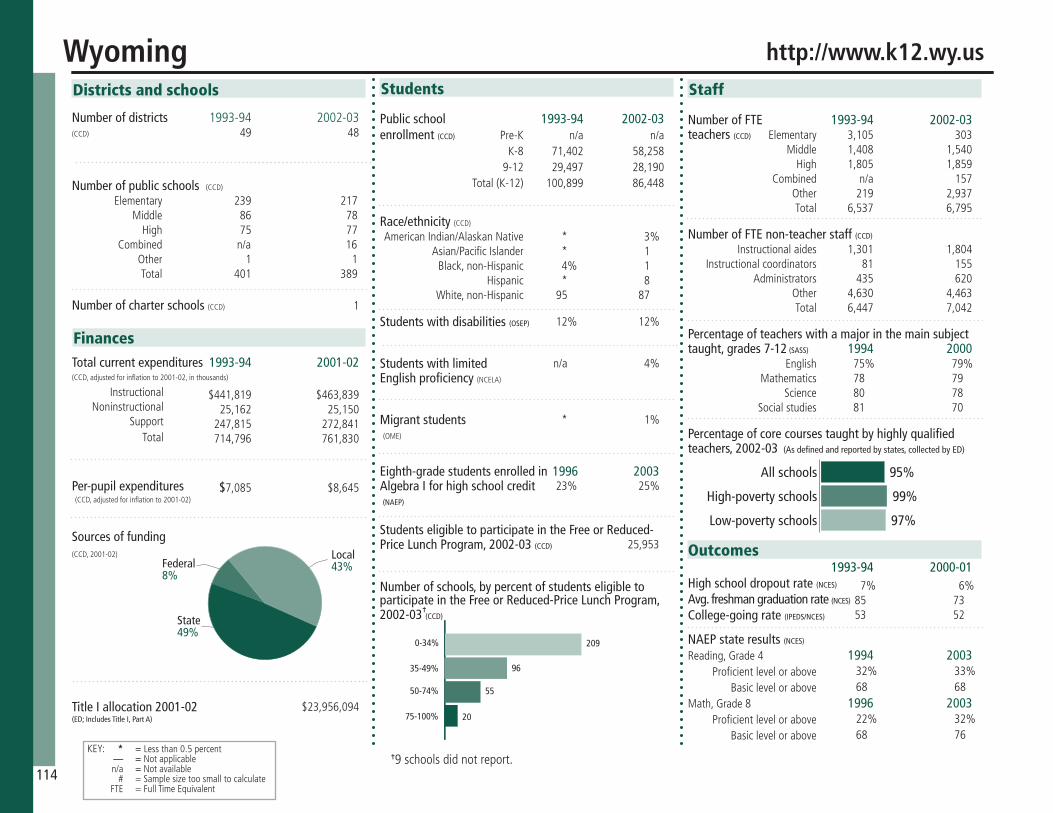
Staff
Number of FTE 1993-94 2002-03teachers (CCD) Elementary Middle High Combined Other Total
Number of FTE non-teacher staff (CCD)
Instructionalaides Instructionalcoordinators Administrators Other Total
Percentage of teachers with a major in the main subject taught, grades 7-12 (SASS) 1994 2000 English Mathematics Science Socialstudies
Percentage of core courses taught by highly qualified teachers, 2002-03 (As defined and reported by states, collected by ED)
Students
Public school 1993-94 2002-03enrollment (CCD) Pre-K K-8 9-12 Total(K-12)
Race/ethnicity (CCD) AmericanIndian/AlaskanNative Asian/PacificIslander Black,non-Hispanic Hispanic White,non-Hispanic
Students with disabilities (OSEP)
Students with limited English proficiency (NCELA)
Migrant students (OME)
Eighth-grade students enrolled in 1996 2003Algebra I for high school credit (NAEP)
Students eligible to participate in the Free or Reduced- Price Lunch Program, 2002-03 (CCD) Outcomes
1993-94 2000-01High school dropout rate (NCES)
Avg. freshman graduation rate (NCES) College-going rate (IPEDS/NCES)
NAEP state results (NCES) Reading,Grade4 1994 2003 Proficientlevelorabove BasicleveloraboveMath,Grade8 1996 2003 Proficientlevelorabove Basiclevelorabove
Number of districts 1993-94 2002-03(CCD)
Number of public schools (CCD)
Elementary Middle High Combined Other Total
Number of charter schools (CCD)
Districts and schools
Number of schools, by percent of students eligible to participate in the Free or Reduced-Price Lunch Program, 2002-03 (CCD)
Sources of funding(CCD,2001-02)
Title I allocation 2001-02 (ED; Includes Title I, Part A)
Total current expenditures 1993-94 2001-02 (CCD,adjustedforinflationto2001-02,inthousands)
Instructional Noninstructional Support Total
Per-pupil expenditures (CCD,adjustedforinflationto2001-02)
KEY: * =Lessthan0.5percent — = NotapplicableK n/a = Notavailable # =Samplesizetoosmalltocalculate FTE =FullTimeEquivalent
Finances
3,105 303 1,408 1,540 1,805 1,859 n/a 157 219 2,937 6,537 6,795
1,301 1,804 81 155 435 620 4,630 4,463 6,447 7,042
75% 79% 78 79 80 78 81 70
n/a n/a 71,402 58,258 29,497 28,190 100,899 86,448
* 3% * 1 4% 1 * 8 95 87
12% 12%
n/a 4%
* 1%
23% 25%
25,953
7% 6% 85 73 53 52
32% 33% 68 68
22% 32% 68 76
49 48
239217 8678 7577 n/a16 11 401389
1
Wyoming http://www.k12.wy.us
$23,956,094
$441,819 $463,839 25,162 25,150 247,815 272,841 714,796 761,830
$7,085 $8,645
114
0-34%
35-49%
50-74%
75-100%
96
55
20
209
95%
99%
97%Low-poverty schools
High-poverty schools
All schools
Local43%Federal
8%
State49%
^
^9schoolsdidnotreport.
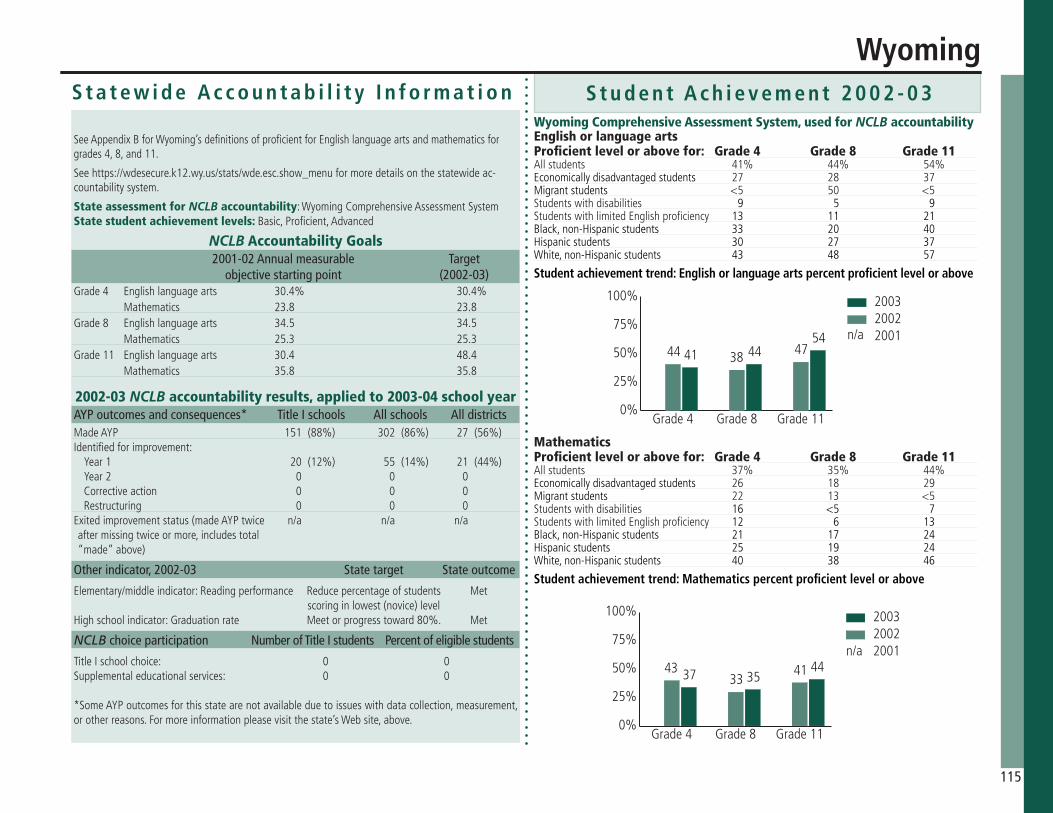
S t u d e n t A c h i e v e m e n t 2 0 0 2 - 0 3S t a t e w i d e A c c o u n t a b i l i t y I n f o r m a t i o n
SeeAppendixBforWyoming’sdefinitionsofproficientforEnglishlanguageartsandmathematicsforgrades4,8,and11.
Seehttps://wdesecure.k12.wy.us/stats/wde.esc.show_menuformoredetailsonthestatewideac-countabilitysystem.
State assessment for NCLB accountability:WyomingComprehensiveAssessmentSystemState student achievement levels: Basic,Proficient,Advanced
NCLB Accountability Goals 2001-02 Annual measurable Target objective starting point (2002-03)Grade4 Englishlanguagearts 30.4% 30.4% Mathematics 23.8 23.8Grade8 Englishlanguagearts 34.5 34.5 Mathematics 25.3 25.3 Grade11 Englishlanguagearts 30.4 48.4 Mathematics 35.8 35.8
2002-03 NCLB accountability results, applied to 2003-04 school year AYP outcomes and consequences* Title I schools All schools All districtsMadeAYP 151(88%) 302(86%) 27(56%)Identifiedforimprovement:
Year1 20(12%) 55(14%) 21(44%)Year2 0 0 0Correctiveaction 0 0 0Restructuring 0 0 0
Exitedimprovementstatus(madeAYPtwice n/a n/a n/aaftermissingtwiceormore,includestotal“made”above)
Other indicator, 2002-03 State target State outcome
Elementary/middleindicator:Readingperformance Reducepercentageofstudents Met scoringinlowest(novice)levelHighschoolindicator:Graduationrate Meetorprogresstoward80%. Met
NCLB choice participation Number of Title I students Percent of eligible students
TitleIschoolchoice: 0 0Supplementaleducationalservices: 0 0
*SomeAYPoutcomesforthisstatearenotavailableduetoissueswithdatacollection,measurement,orotherreasons.Formoreinformationpleasevisitthestate’sWebsite,above.
English or language artsProficient level or above for: Grade 4 Grade 8 Grade 11Allstudents 41% 44% 54%Economicallydisadvantagedstudents 27 28 37Migrantstudents <5 50 <5Studentswithdisabilities 9 5 9StudentswithlimitedEnglishproficiency 13 11 21Black,non-Hispanicstudents 33 20 40Hispanicstudents 30 27 37White,non-Hispanicstudents 43 48 57
Studentachievementtrend:Englishorlanguageartspercentproficientlevelorabove
0%
25%
50%
75%
100%
544441 473844
200320022001
Grade11Grade8Grade4
n/a
Wyoming
Wyoming Comprehensive Assessment System, used for NCLB accountability
115
MathematicsProficient level or above for: Grade 4 Grade 8 Grade 11Allstudents 37% 35% 44%Economicallydisadvantagedstudents 26 18 29Migrantstudents 22 13 <5Studentswithdisabilities 16 <5 7StudentswithlimitedEnglishproficiency 12 6 13Black,non-Hispanicstudents 21 17 24Hispanicstudents 25 19 24White,non-Hispanicstudents 40 38 46
Studentachievementtrend:Mathematicspercentproficientlevelorabove
0%
25%
50%
75%
100%
443537 41
3343
200320022001
Grade11Grade8Grade4
n/a
116
117
Districts and schools
Number of districtsSource: U.S. Department of Education, National Center for Education Statistics, Common Core of Data, 1993-94 and 2002-03.
Notes: Common Core of Data is referred to as CCD throughout report. This total reflects all regular local school districts that are not a component of a supervisory union, with a student membership (enrollment) greater than zero. Not included are supervisory union administra-tive centers, regional education service agencies, state or federal agencies providing elemen-tary and/or secondary level instruction, or other education agencies, such as charter schools. The data was downloaded from CCD in July 2004.
Number of public schoolsSource: U.S. Department of Education, National Center for Education Statistics, Common Core of Data, 1993-94 and 2002-03.
Notes: All regular and special education schools offering free, public elementary or second-ary education with student membership (enrollment) greater than zero are included. A school is classified as combined if it provides instruction at both the elementary (grade 6 or below) and the secondary (grade 9 or above) levels. The data was downloaded from CCD in July 2004.
Number of charter schoolsSource: U.S. Department of Education, National Center for Education Statistics, Common Core of Data, 2002-03.
Notes: This reflects all charter schools with a student membership (enrollment) greater than zero. These numbers may not match the number of charter schools listed on state Web sites due to differences in data collection. The data was downloaded from CCD in July 2004.
Finances
Total current expendituresSource: U.S. Department of Education, National Center for Education Statistics: Revenues and expenditures for public elementary and secondary education: school year 1993-94. Available http://nces.ed.gov/pubs/96303.pdf.
Cohen, C., and Johnson, F. (2004). Revenues and Expenditures for Public Elementary and Secondary Education: School Year 2001-02 (NCES 2004-341). U.S. Department of Education, National Center for Education Statistics. Washington, D.C. Available http://nces.ed.gov/pubs2004/2004341.pdf.
Note: This reflects data reported to the U. S. Department of Education, National Center for Education Statistics, Common Core of Data (CCD), National Public Education Financial
Survey. 1993-94 data has been adjusted for inflation to 2001-02 rates. All numbers are expressed in thousands.
Per pupil expenditures Source: Cohen, C., and Johnson, F. (2004). Revenues and Expenditures for Public Elementary and Secondary Education: School Year 2001-02 (NCES 2004-341). U.S. Department of Education National Center for Education Statistics. Washington, D.C. Available http://nces.ed.gov/pubs2004/2004341.pdf.
Note: National Center for Education Statistics is referred to as NCES throughout report. Expenditures include current expenditures, based on membership, covering day-to-day op-erations of public elementary and secondary schools, except those associated with repaying debts, capital outlays (e.g., purchases of land, school construction and repair, and equip-ment), and programs outside the scope of preschool to grade 12, such as adult education, community colleges, and community services. Expenditures for items lasting more than one year (e.g., school buses and computers) are not included in current expenditures.
Sources of fundingSource: Cohen, C., and Johnson, F. (2004). Revenues and Expenditures for Public Elementary and Secondary Education: School Year 2001-02 (NCES 2004-341). U.S. Department of Education National Center for Education Statistics. Washington, D.C. Available http://nces.ed.gov/pubs2004/2004341.pdf.
Title I allocation 2001-02Source: U. S. Department of Education, Budget Office, Funds for State Formula-Allocat-ed and Selected Student Aid Programs, 2002. Available http://www.ed.gov/about/overview/budget/statetables/06stbystate.pdf.
Note: This total includes only Title I, Part A, ESEA Title I Grants to Local Education Agencies.
Public school enrollmentSource: U.S. Department of Education, National Center for Education Statistics, Common Core of Data, 1993-94 and 2002-03.
Notes: These numbers do not include ungraded students. The data was downloaded from CCD in July 2004.
Race and ethnicitySource: U.S. Department of Education, National Center for Education Statistics, Common Core of Data, 1993–94 and 2002-03.
Note: The data was downloaded from CCD in July 2004.
Appendix A: Sources
118
Students with disabilitiesSource: U.S. Department of Education, Office of Special Education Programs, 2002-03 school year. Available: http://www.ideadata.org/tables26th/ar_aa10.xls.
U.S. Department of Education. To Assure the Free Appropriate Public Education of All Children with Disabilities. Seventeenth Annual Report to Congress on the Implementation of the Individuals with Disabilities Education Act, 1995.
Notes: Office of Special Education Programs is referred to as OSEP throughout report. The figures shown represent children ages 6 to 17 served under IDEA, Part B.
Students with limited English proficiencySource: National Clearinghouse for English Language Acquisition and Language Instruction Educational Programs, State-specific numbers and statistics. Washington, D.C. Available: http://www.ncela.gwu.edu/stats.
U.S. Department of Education, National Clearinghouse for Bilingual Education. 1993-94.
Notes: Data reflects the number of LEP students enrolled in public schools.
Migratory studentsSource: U.S. Department of Education, Office of Migrant Education, 1993-94, 2002-03.
Notes: Office of Migrant Education is referred to as OME throughout report. The figures shown represent the “12-month” count of students identified for the Migrant program. The 12-month count is the unduplicated number of eligible children ages 3-21 who partici-pate in either a regular year (Category 1) or summer (Category 2) program. The data was obtained from OME in March 2005.
Eighth-grade student enrolled in Algebra I for high school creditSource: U.S. Department of Education, National Center for Education Statistics, National Assessment of Educational Progress, 1996 and 2003. Available: http://nces.ed.gov/nation-sreportcard.
Note: The data was downloaded from NCES in June 2005.
Students eligible to participate in the Free or Reduced-Price Lunch Pro-gram, 2002-03Source: U.S. Department of Education, National Center for Education Statistics, Common Core of Data, 2002-03.
Note: The data was downloaded from CCD in July 2004.
Number of schools, by percent of students eligible for the Free or Re-duced-Price Lunch ProgramSource: U.S. Department of Education, National Center for Education Statistics, Common Core of Data, 2002-03.
Notes: The figures shown represent the percentage of students in all schools, including all regular local school districts and schools with a specific vocational and alternative education purpose, eligible to participate in the Free and Reduced-Price Lunch Program under the Na-tional School Lunch Act. The National School Lunch Program is run by the Department of Agriculture’s Food and Nutrition Service. The data was downloaded from CCD in July 2004.
Number of Full Time equivalent (FTE) teachers Source: U.S. Department of Education, National Center for Education Statistics, Common Core of Data, 1993-94 and 2002-03.
Notes: FTE teacher counts are based on NCES definitions in the Digest of Education Sta-tistics. A school is classified as combined if it provides instruction at both the elementary (grade 6 or below) and the secondary (grade 9 or above) levels. The data was downloaded from CCD in June 2005.
Number of Full Time Equivalent (FTE) non-teacher staffSource: U.S. Department of Education, National Center for Education Statistics, Common Core of Data, 1993-94 and 2002-03.
Notes: FTE teacher counts are based on NCES definitions in the Digest of Education Statistics. Administrators includes both LEA and school administrators. Other includes library support staff, LEA administrative support staff, school administrative support staff, and all other support staff, guidance counselors, librarians, and student support services staff. The data was downloaded from CCD in June 2005.
Percentage of teachers with a major in the main subject taught, grades 7-12Source: U.S. Department of Education, National Center for Education Statistics, Schools and Staffing Survey, 1994 and 2000.
Notes: Schools and Staffing Survey is referred to as SASS throughout report. The data was downloaded from SASS in May 2004.
Percentage of core courses taught by highly qualified teachers, 2002-03Source: U.S. Department of Education, Consolidated State Performance Report for State Formula Grant Programs Under the Elementary and Secondary Education Act as Amended by the No Child Left Behind Act of 2001, OMB Number: 1810-0614, Sec-tion IV, Highly Qualified Teachers. Washington, D.C., 2004. Please note that the data also
119
incorporates edits from state departments of education, which may or may not be reflected in the state’s Consolidated State Performance Report submitted to the U.S. Department of Education.
U.S. Department of Education, Consolidated State Application for State Grants under Title IX, Part C, Section 9302 of the Elementary and Secondary Education Act (Public Law 107-110), Section 3(a). Washington, D.C., 2003.
Notes: Within the guidelines put forth within the No Child Left Behind Act of 2001, Section 9101(23) of ESEA, each state defines how teachers are classified as highly quali-fied.
High school dropout rateSource: U.S. Department of Education, National Center for Education Statistics, Common Core of Data, 1993-94, 2000-01.
Notes: Only states whose definitions complied with NCES’s definition were included. Annual or “event” rate is the percentage of 9-12 students dropping out during one school year. The data was downloaded from CCD in July 2004.
Averaged freshman graduation rateSource: U.S. Department of Education, National Center for Education Statistics, Common Core of Data, 1993-94, 1994-95, 2000-01, and 2001-02, based on calculations published in Seastrom, M., Hoffman, L., Chapman, C., and Stillwell, R. (2005). The Averaged Fresh-man Graduation Rate for Public High Schools From the Common Core of Data: School Years 2001-02 and 2002-03 (NCES 2006-601). U.S. Department of Education. Washington, D.C.: National Center for Education Statistics.
Postsecondary enrollment Source: U.S. Department of Education, National Center for Education Statistics, Common Core of Data, Private School Universe Survey, 1993; and Integrated Postsecondary Education Data System (IPEDS) Fall Enrollment, 1994, Survey.
U.S. Department of Education, National Center for Education Statistics, Common Core of Data survey (Digest of Education Statistics, 2003, table 104); Private School Universe Survey, 1999 (Digest of Education Statistics, 2002, table 63); and Integrated Postsecondary Educa-tion Data System (IPEDS) Fall Enrollment, 2000, Survey (Digest of Education Statistics, 2002, table 204).
NAEP State ResultsSource: The Nation’s Report Card: Mathematics Highlights 2003. U.S. Department of Education, National Center for Education Statistics, National Assessment of Educational Progress, 2003. Available: http://nces.ed.gov/nationsreportcard/pdf/main2003/2004451.pdf.
The Nation’s Report Card: Reading Highlights 2003. U.S. Department of Education, National Center for Education Statistics, National Assessment of Educational Progress, 2003. Available: http://nces.ed.gov/nationsreportcard/pdf/main2003/2004452.pdf.
Notes: The National Assessment of Educational Progress is referred to as NAEP through-out report. Data reported for public schools only. Some states did not satisfy one of the guidelines for school sample participation rates. Puerto Rico did not participate in these assessments. See Appendix C for further information and definitions of proficient and basic. Prior to 1996, accommodations were not permitted for students with disabilities so caution should be used when comparing results. Data for 1994 (reading) and 1996 (mathematics) NAEP are given for the purpose of trend analyses, as these years are closest to the 1993-94 baseline used for the remainder of the report.
Statewide Accountability InformationSource: Results from an unpublished 50-state survey conducted by CCSSO in July 2005. Rolf Blank et al. For more information, visit the states’ Web page or contact the author at: [email protected].
NCLB Accountability GoalsSource: Council of Chief State School Officers, Accountability Profiles. 2005. Available: http://accountability.ccsso.org, with edits by states.
2002-03 NCLB accountability results, applied to 2003-04 school yearSource: U.S. Department of Education, Consolidated State Performance Report for State Formula Grant Programs Under the Elementary and Secondary Education Act as Amended by the No Child Left Behind Act of 2001, OMB Number: 1810-0614, Section II, Schools in Need of Improvement. Washington, D.C., 2004. Please note that the data also incorporates edits from state departments of education, which may or may not be reflected in the state’s Consolidated State Performance Report submitted to the U.S. Department of Education.
Other indicator, 2002-03Source: Council of Chief State School Officers, Accountability Profiles. 2005. Available: http://accountability.ccsso.org, with edits by states.
NCLB choice participationSource: U.S. Department of Education, Consolidated State Performance Report for State Formula Grant Programs Under the Elementary and Secondary Education Act as Amended by the No Child Left Behind Act of 2001, OMB Number: 1810-0614, Section III, School Choice and Supplemental Educational Services. Washington, D.C., 2004. Please note that the data also incorporates edits from state departments of education, which may

120
or may not be reflected in the state’s Consolidated State Performance Report submitted to the U.S. Department of Education.
Student Achievement 2002-03Source: U.S. Department of Education, Consolidated State Performance Report for State Formula Grant Programs Under the Elementary and Secondary Education Act as Amended by the No Child Left Behind Act of 2001, OMB Number: 1810-0614, Section I, Student Academic Achievement. Washington, D.C., 2004. Please note that the data also incorporates edits from state departments of education, which may or may not be reflected in the state’s Consolidated State Performance Report submitted to the U.S. Department of Education.
Notes: Trend results for 2000-01 through 2002-03 reported in bar graphs for states with consistent tests and proficiency levels over two or more years and in Table 4 on page xvi.
121
Alabama Not available.
Alaska Reading: A student who scores at the proficient level based on the scale scores, established in state regulation, in reading combined with writing or language arts.
Mathematics: A student who scores at the proficient level based on the scale scores estab-lished in state regulation.
ArizonaMeets Standard: This level denotes demonstration of solid academic performance on challenging subject matter reflected by the content standards. This includes knowledge of subject matter, application of such knowledge to real-world situations, and content relevant analytical skills. Attainment of at least this level is the expectation for all Arizona students
ArkansasProficient: Proficient students demonstrate solid academic performance for the grade tested and are well-prepared for the next level of schooling. They can use Arkansas’s established reading and writing or mathematics skills and knowledge to solve problems and complete tasks on their own. Students can tie ideas together and explain the ways their ideas are connected.
California Proficient: In reading-language arts and mathematics in grades 2-8 would be based on the percentage of students scoring at the proficient or advanced level on the California Stan-dards Tests (CSTs). These tests assess how well students are mastering the state’s rigorous academic content standards, which lay out what students should know and be able to do at each grade level.
At the high school level, the definition of “proficient” in reading and math would be tied to scores on the California High School Exit Exam, which is a pass/fail test. “Cut scores” for achieving proficiency at the high school level would be equivalent to achieving proficiency on the California standards-based tests in reading-language arts and math.
Colorado Proficient: Students understand directions, recognize author’s point of view, explain reac-tions, define problems or solutions, make predictions and draw conclusions, differentiate among printed materials, discriminate among various media, extract information from com-plex stimulus, identify character’s reactions or motives, identify sequences, support opinions, classify familiar vocabulary, and interpret poetry in a concrete manner.
Connecticut Reading: Proficient: Students who score at this level can comprehend most grade-level or
Appendix B: State definitions of proficient*
*Please visit each state’s Web site for additional information.
below-grade-level textbooks and other materials. They can generally determine the main idea, have an adequate understanding of the author’s purpose and are able to make some judgments about a test’s quality and themes.
Mathematics: Proficient: Students who score at this level demonstrate adequately developed conceptual understanding and computational skills, and adequately developed problem-solving skills.
Delaware Meets Standard: The performance levels for reading, writing and math at grades 3, 5, 8, and 10 and science and social studies grades 4, 6, 8 and 11 were set through a standard setting process detailed in the Report and Recommendations to the Delaware State Board of Education for Establishing Proficiency Levels for the Delaware Student Testing Program in Reading, Writing, and Mathematics, August 1999. The DSTP scale scores for reading and math are reported on a developmental scale ranging from 150 to 800. The determination of the DSTP scale scores for grades 3, 5, 8, and 10 has been done using a procedure that involves linking to the Stanford Achievement Test, version 9, (Stan-ford 9) scores for reading and math. The DSTP in reading and math contains a portion of the Stanford 9. The scaling for grades 4, 6, and 7 is parallel to that at grades 3, 5, 8, and 10. Determination of five levels of performance for reading and math at grades 4, 6, and 7 will be done using a statistical model. For writing, raw scores are used to determine performance levels at grades 3, 5, 8, and 10 and the performance levels at grades 4, 6, and 7 can easily replicate those at grades 3, 5, 8, and 10.
District of Columbia Proficient: Percentage that scored at or above the state proficiency standard. Students who are not tested are included in this computation as being not proficient.
FloridaLevel 4: Performance at this level indicates that the student has success with the challenging content of the Sunshine State Standards. A Level 4 student answers most of the questions correctly but may have only some success with questions that reflect the most challenging content.
GeorgiaMeets Standard: CRCT: Scores from 300-349 indicate “Meets Standard,” which represents the “Proficient” student achievement level
Hawaii Meets Proficiency: Assessment results indicate that the student has demonstrated the knowl-edge and skills required to meet the content standards for this grade. The student is ready to work on higher levels of this content area.
122
Idaho Proficient: Student demonstrates thorough knowledge and mastery of skills that allows him or her to function independently on all major concepts related to his or her current educa-tional level.
IllinoisMeets Standards: Student work demonstrates proficient knowledge and skills in the subject. Students effectively apply knowledge and skills to solve problems.
Indiana Pass: Solid academic performance for each grade assessed. Students reaching this level have demonstrated competency over challenging subject matter, including subject-matter knowledge, application of such knowledge to real-world situations, and analytical skills ap-propriate to the subject matter.
Iowa Grade 4 Reading: Intermediate: Understands some factual information; sometimes can draw conclusions and make inferences about the motives and feelings of the characters; and is beginning to be able to identify the main idea, evaluate the style and structure of the text, and interpret nonliteral language.
Grade 4 Mathematics: Intermediate: Is beginning to develop an understanding of most math concepts and to develop the ability to solve complex word problems, use a variety of estima-tion methods, and interpret data from graphs and tables.
Grade 8 Reading: Intermediate: Understands some factual information; sometimes can draw conclusions; makes inferences about the motives and feelings of characters; and applies what has been read to new situations; and sometimes can identify the main idea, evaluate the style and structure of the text, and interpret nonliteral language.
Grade 8 Mathematics: Intermediate: Is beginning to develop an understanding of most math concepts and to develop the ability to solve complex word problems, use a variety of estima-tion methods, and interpret data from graphs and tables.
Grade 11 Reading: Intermediate: Understands some factual information; sometimes can make inferences about the characters; identify the main idea, and identifies author viewpoint and style; occasionally can interpret nonliteral language and judge the validity of conclusion.
Grade 11 Mathematics: Intermediate: Is beginning to develop the ability to apply a variety of math concepts and procedures, make inferences about qualitative information, and solve a variety of novel, quantitative reasoning problems.
Kansas Proficient: Mastery of core skills is apparent. Knowledge and skills can be applied in most contexts. Ability to apply learned rules to most situations is evident. Adequate command of difficult or challenging content and applications is competently demonstrated. There is evidence of solid performance.
Kentucky Proficient: Proficient as defined in Kentucky has been demonstrated to be a very high stan-dard for student achievement, especially in comparison to standards typically set by other states. In Kentucky, Proficiency requires students to know content beyond basic knowledge and to apply their knowledge to solve problems. Students performing at the Proficient level are able to: * demonstrate broad content knowledge and apply it; * communicate in an ac-curate, clear, and organized way with relevant details and evidence; * use appropriate strate-gies to solve problems and make decisions; * demonstrate effective use of critical thinking skills.
Louisiana Basic: These standards have been shown to be high; for example, equipercentile equating of the standards has shown that Louisiana’s “Basic” is somewhat more rigorous than NAEP’s “Basic.” In addition, representatives from Louisiana’s business community and higher educa-tion have validated the use of “Basic” as the state’s proficiency goal
Maine Meets the standard: The student’s work demonstrates consistent accomplishment of content knowledge, analysis, problem-solving, and communication skills..
Maryland Proficient: Achieved the cut score on the assessment, as determined by the state.
Massachusetts Proficient: Students at this level demonstrate a solid understanding of challenging subject matter and solve a wide variety of problems
Michigan Proficient: A realistic and rigorous level of achievement indicating proficiency in meeting the needs of students..
Minnesota Level 3: A score at or above Level 3 (scale score 1,420-1,499) represents state expectations for achievement of all students. Students who score at Level 3 are working successfully on grade-level material. This level corresponds to a “proficient” level of achievement for NCLB.
Mississippi Mississippi Curriculum Test, Proficient: Students at the proficient level demonstrate solid academic performance and mastery of the content area knowledge and skills required for
123
success at the next grade. Students who perform at this level are well prepared to begin work on even more challenging material that is required at the next grade.
Algebra I and English II Test, Proficient: Students at the proficient level demonstrate solid academic performance and mastery of the knowledge and skills required for success in a more advanced course in the content area.
Missouri Communication Arts: Proficient: In reading, students compare and contrast; interpret and use textual elements; predict; draw inferences and conclusions; determine word meaning; iden-tify synonyms and antonyms; identify main idea and details. In writing, they use some details and organization; write complete sentences; generally follow rules of standard English.
Grade 4 Mathematics: Proficient: Students communicate math processes; add and subtract common fractions and decimals (money only); use standard units of measurement; identify attributes of planes and solid figures; create and interpret data from graphs; recognize, extend, and describe pictorial or numeric patterns; apply strategies to solve multi-step and logic problems.
Grade 8 Mathematics: Proficient: Students communicate math processes; recognize transformations; solve problems using units of measurement; interpret data from multiple representations; extend and describe patterns and relationships using algebraic expressions; develop and apply number theory concepts; use inductive and deductive reasoning to solve problems. Grade 10 Mathematics: Proficient: Students communicate math processes; usually analyze and evaluate information; estimate; recognize reasonableness; identify needed informa-tion; make predictions; find probability; identify various representations of data; represent situations algebraically; apply properties of real numbers; use multiple strategies to solve problems.
Montana Proficient: A student demonstrates competency including subject matter knowledge, the ap-plication of subject knowledge to real world situations, and the analytical skills appropriate to this subject.
Nebraska Proficient: In the STARS (School-based Teacher-led Assessment and Reporting System) as-sessment system, student performance achievement levels are determined for each class-room assessment according to criteria established under the quality indicators. This process must be conducted in a technically appropriate manner and is reviewed by the external assessment reviewers.
Nevada Not available.
New Hampshire Grade 3 Reading or Language Arts: Proficient: Students at this level demonstrate an overall understanding of the materials they read, hear, and view. They are able to identify main ideas and draw conclusions. Their responses show thought and are supported with some de-tail. When writing, they communicate competently and are able to adequately develop and support their ideas. Although they demonstrate a firm grounding in the mechanics of written expression, they may make errors in spelling and grammar. However, these do not interfere with a reader’s ability to understand the text.
Grade 3 Mathematics: Proficient: Students at this level are able to estimate and compute solutions to problems and communicate their understanding of mathematics. They can, with reasonable accuracy, add three-digit whole numbers; subtract any two-digit numbers; and multiply whole numbers up to five. They are able to: Demonstrate and understanding of place value as well as the relationship between simple fractions and decimals; read charts and graphs; make measurements; and recognize and extend patterns.
Grade 6 Reading or Language Arts: Proficient: Students at this level demonstrate an overall understanding of literacy, narrative, factual, informational, and practical works. They extract main ideas, analyze text, evaluate and organize information, draw conclusions, and make inferences and interpretations. They critically evaluate materials they read, hear, and view. They effectively organize, develop, and support ideas so that a reader can easily understand the intent of their writing. They demonstrate a firm grounding in the mechanics of written expression; however, they may still make some errors.
Grade 6 Mathematics: Proficient: Students at this level demonstrate an overall understand-ing of mathematical concepts and skills. They make few, if any, errors in computation. They use tables and graphs to organize, present, and interpret data. They employ appropriate strategies to solve a wide range of problems. They clearly communicate their solutions and problem-solving strategies.
Grade 10 Reading or Language Arts: Proficient: Students at this level demonstrate a solid understanding of a wide range of literary, narrative, factual, informational, and practical works. They make meaningful connections between and among ideas and concepts in materials they read, hear, and view. They evaluate and organize information, make and com-municate informed judgments, and provide evidence for inferences and interpretations. Their writing is clear, logical, and shows evidence of fluency and style. They effectively control the mechanics of language including spelling, capitalization, grammar, and punctuation.
Grade 10 Mathematics: Proficient: Students at this level demonstrate a solid understand-ing of mathematical concepts and skills. Their work displays a high degree of accuracy. They make meaningful connections among important concepts in algebra, geometry, measure-

124
ment, and probability and statistics. They identify and use appropriate information to solve problems. They provide supporting evidence for inferences and solutions. They communicate mathematical ideas effectively, with sufficient substance and detail to convey understanding.
New Jersey Proficient: Proficient means a score achieved by a student at or above the cut score which demarks a solid understanding of the math content measured by an individual section on any state assessment
New Mexico Not available.
New York Proficiency: The state has defined proficiency as the performance of a student who scores Level 3 on the grade 4 or 8 English language arts assessment, shows Level 3 growth on the NYSESLAT, scores between 65 and 84 on a Regents examination, or passes an approved alternative to a Regents examination
North Carolina Level III: Students performing at this level consistently demonstrate mastery of grade level subject matter and course subject matter and skills and are well prepared for the next grade or course level work.
North Dakota Proficient: The definition of proficiency was established in narrative form by the state content and achievement standards drafting committees in 1999. These narratives guided the state standards-setting committees who established the state’s achievement cut-scores for the North Dakota State Assessment in 2001-02. The standards-setting committees drafted sup-porting narrative that aligned to the final cut-scores and became the operative definition for all reports.
Ohio Not available.
Oklahoma Not available.
Oregon Meets Standard: Specific cut score on state multiple-choice math test plus specific cut score (composite of five trait scores) on math problem solving assessment.
Pennsylvania Proficient: Satisfactory academic performance. Proficient work indicates a solid understand-ing and adequate display of the skills included in the Pennsylvania Academic Content Standards.
Puerto Rico Not available.
Rhode Island Achieved Standard: Students demonstrate the ability to apply concepts and processes ef-fectively and accurately. Students communicate ideas in clear and effective ways.
South Carolina Proficient: Proficient: A student who performs at the proficient level on the PACT has met expectations for student performance based on the curriculum standards approved by the state board of education. The student is well prepared for work at the next grade. The profi-cient level represents the long-term goal for student performance in South Carolina.
South Dakota Not available.
Tennessee Proficient: Student performs at or above the cut scores set by the state.
Texas Met the Standard: Student performed at a level that was at or somewhat above the state passing standard. Performance showed a sufficient understanding of the knowledge and skills tested at grade level.
Utah Sufficient: A student scoring at this level is proficient on the measured standards and objec-tives of the Core Curriculum in this subject. The student’s performance indicates sufficient understanding and application of key curriculum concepts
Vermont Meets Standard: English or Language Arts:(1) Reading: Basic Understanding: Students must demonstrate the ability to comprehend a variety of materials of varying length and complexity. (2) Reading: Analysis and Interpretation: Students must demonstrate the ability to analyze and interpret what they read in the process of becoming critical readers. (3) Writing Effectiveness: Students must demonstrate the ability to write effectively in a variety of formats for a variety of purposes, audiences, and contexts. (4) Writing Conventions: Students must demonstrate control of the conventions (usage, spelling and punctuation) of the English language according to current standards of correct-ness.
Meets Standards: Mathematics:(1) Concepts: Showing that the student understands mathematical processes and ideas. (2) Skills: Showing that the student can perform the mathematical routine or technique cor-rectly.
125
(3) Problem Solving: Showing that the student can choose and apply appropriate skills and concepts, and reason mathematically. Students solve increasingly complex situations by formulating, implementing and drawing conclusions from the problem solution.
Virginia Pass/Proficient: Students who attain a scaled score of 399 or below on any of the Standards of Learning tests receive a rating of “fails/does not meet the standards.” Those with a scaled score of 400 to 499 receive a rating of “pass/proficient”, and those with a scaled sc ore of 500 to 600 receive a rating of “pass/advanced.”
Washington Meet the Standard: Students performing at this level demonstrate mastery of the Essential Academic Learning Requirements for the subject and grade level.
West Virginia Mastery: Student demonstrates knowledge, comprehension, and application of skills, which meet the standard.
Wisconsin Proficient: Demonstrates competency in the academic knowledge and skills tested
Wyoming Students at the proficient level use concepts and skills to acquire, analyze, and communicate information and ideas.

126

127
National Assessment for Educational Progress—Definitions and Further Information*Mathematics Achievement Levels—Grade 4Basic Fourth-grade students performing at the Basic level should show some evidence of understanding the mathematical concepts and procedures in the five NAEP content strands. Fourth-graders performing at the Basic level should be able to estimate and use basic facts to perform simple computations with whole numbers; show some understanding of frac-tions and decimals; and solve some simple real-world problems in all NAEP content areas. Students at this level should be able to use—though not always accurately—four-function calculators, rulers, and geometric shapes. Their written responses are often minimal and presented without supporting information.
Proficient Fourth-grade students performing at the Proficient level should consistently apply integrated procedural knowledge and conceptual understanding to problem solving in the five NAEP content strands. Fourth-graders performing at the Proficient level should be able to use whole numbers to estimate, compute, and determine whether results are reasonable. They should have a conceptual understanding of fractions and decimals; be able to solve real-world problems in all NAEP content areas; and use four-function calculators, rulers, and geometric shapes appropriately. Students performing at the Proficient level should employ problem-solving strategies such as identifying and using appropriate information. Their written solutions should be organized and presented both with supporting information and explanations of how they were achieved.
Mathematics Achievement Levels—Grade 8Basic Eighth-grade students performing at the Basic level should exhibit evidence of conceptual and procedural understanding in the five NAEP content strands. This level of performance signifies an understanding of arithmetic operations—including estimation—on whole numbers, decimals, fractions, and percents. Eighth-graders performing at the Basic level should complete problems correctly with the help of structural prompts such as dia-grams, charts, and graphs. They should be able to solve problems in all NAEP content strands through the appropriate selection and use of strategies and technological tools—including calculators, computers, and geometric shapes. Students at this level also should be able to use fundamental algebraic and informal geometric concepts in problem solving. As they ap-proach the Proficient level, students at the basic level should be able to determine which of the available data are necessary and sufficient for correct solutions and use them in problem solving. However, these eighth-graders show limited skill in communicating mathematically.
Proficient Eighth-grade students performing at the Proficient level should apply mathemati-cal concepts and procedures consistently to complex problems in the five NAEP content strands. Eighth-graders performing at the Proficient level should be able to conjecture, defend their ideas, and give supporting examples. They should understand the connections between fractions, percents, decimals, and other mathematical topics such as algebra and
functions. Students at this level are expected to have a thorough understanding of Basic level arithmetic operations—an understanding sufficient for problem solving in practi-cal situations. Quantity and spatial relations in problem solving and reasoning should be familiar to them, and they should be able to convey underlying reasoning skills beyond the level of arithmetic. They should be able to compare and contrast mathematical ideas and generate their own examples. These students should make inferences from data and graphs; apply properties of informal geometry; and accurately use the tools of technology. Students at this level should understand the process of gathering and organizing data and be able to calculate, evaluate, and communicate results within the domain of statistics and probability.
Reading Achievement Levels—Grade 4Basic Fourth-grade students performing at the Basic level should demonstrate an un-derstanding of the overall meaning of what they read. When reading text appropriate for fourth-graders, they should be able to make relatively obvious connections between the text and their own experiences, and extend the ideas in the text by making simple inferences.
Proficient Fourth-grade students performing at the Proficient level should be able to dem-onstrate an overall understanding of the text, providing inferential as well as literal informa-tion. When reading text appropriate to fourth grade, they should be able to extend the ideas in the text by making inferences, drawing conclusions, and making connections to their own experiences. The connection between the text and what the student infers should be clear.
Reading Achievement Levels—Grade 8Basic Eighth-grade students performing at the Basic level should demonstrate a literal un-derstanding of what they read and be able to make some interpretations. When reading text appropriate to eighth grade, they should be able to identify specific aspects of the text that reflect overall meaning, extend the ideas in the text by making simple inferences, recognize and relate interpretations and connections among ideas in the text to personal experience, and draw conclusions based on the text.
Proficient Eighth-grade students performing at the Proficient level should be able to show an overall understanding of the text, including inferential as well as literal information. When reading text appropriate to eighth grade, they should be able to extend the ideas in the text by making clear inferences from it, by drawing conclusions, and by making connec-tions to their own experiences—including other reading experiences. Proficient eighth-grad-ers should be able to identify some of the devices authors use in composing text.
*Additional information is available at the NAEP Web site, http://nces.ed.gov/nationsreportcard.
Appendix C

The Department of Education’s mission is to promote student achievement and preparation for global competitiveness by fostering educational excellence and ensuring equal access.
www.ed.gov


