700 Broadway, Suite 810 • Denver, CO 80203-3442 • 303.299.3600 • [email protected]State funding mechanisms for English language learners By Maria Millard January 2015 Research is clear that English language learners (ELLs) perform better academically and achieve greater language proficiency when they have high-quality English language instruction. 1 Like all supplemental services, these necessary supports require additional funding above the average per-student amount. The federal government provides grant funding to states through Part A of Title III to help ELLs with language acquisition and meeting content standards. While Title III dollars offer some support, a 2012 survey found that Title III officials and district administrators believe the funds are helpful but insufficient for ELL services. To address such shortages, 46 states allocate additional state funding dedicated to supporting ELLs. The mechanisms through which ELL funds are allocated can be confusing at best. Without a comprehensive understanding of school finance, it is difficult for policymakers to determine what changes are needed to better support their ELL students. Familiarity with ELL funding allows policymakers to evaluate their own funding models against those from other states, make adjustments and use their state funds to further drive innovation. This brief provides a clear and detailed description of the three ways in which states finance ELLs. Tables at the end of the document shows each state’s ELL funding mechanism. Trends in State Laws ELL Funding ELL funding mechanisms 46 states provide some additional funding for ELLs in three primary ways: Formula Funding: 34 states fund ELL programs through their state’s primary funding formula. Of the states that use student weights in their formula, weights range from 9.6 percent (Kentucky) to 99 percent (Maryland) per ELL student. Categorical Funding: Nine states fund ELL programs through a line in the budget that exists outside of the state’s primary funding formula. Reimbursements: Three states reimburse districts upon submission of the costs of educating ELL students.
Transcript
700 Broadway, Suite 810 • Denver, CO 80203-3442 • 303.299.3600 • [email protected]
State funding mechanisms for English language learners By Maria Millard
January 2015 Research is clear that English language learners (ELLs) perform better academically and achieve greater language proficiency when they have high-quality English language instruction.1 Like all supplemental services, these necessary supports require additional funding above the average per-student amount. The federal government provides grant funding to states through Part A of Title III to help ELLs with language acquisition and meeting content standards. While Title III dollars offer some support, a 2012 survey found that Title III officials and district administrators believe the funds are helpful but insufficient for ELL services. To address such shortages, 46 states allocate additional state funding dedicated to supporting ELLs. The mechanisms through which ELL funds are allocated can be confusing at best. Without a comprehensive understanding of school finance, it is difficult for policymakers to determine what changes are needed to better support their ELL students. Familiarity with ELL funding allows policymakers to evaluate their own funding models against those from other states, make adjustments and use their state funds to further drive innovation. This brief provides a clear and detailed description of the three ways in which states finance ELLs. Tables at the end of the document shows each state’s ELL funding mechanism.
Trends in State Laws
ELL Funding
ELL funding mechanisms
46 states provide some additional funding for ELLs in three primary ways: Formula Funding: 34 states fund ELL programs through their state’s primary funding
formula. Of the states that use student weights in their formula, weights range from 9.6 percent (Kentucky) to 99 percent (Maryland) per ELL student.
Categorical Funding: Nine states fund ELL programs through a line in the budget that exists outside of the state’s primary funding formula.
Reimbursements: Three states reimburse districts upon submission of the costs of educating ELL students.
Education Commission of the States • 700 Broadway, Suite 810 • Denver, CO 80203-3442 • 303.299.3600 • fax 303.296.8332 • www.ecs.org
Page 2
Formula Funding Thirty-four states allocate money for ELLs through their state’s primary funding formula. Accounting for ELL students through adjustments in their formula provides equity, transparency and predictability to school districts. ELLs are accounted for in funding formulas three primary ways: weights, dollar amounts and teacher allocations.
Weights are applied evenly across a state’s school districts and are designed to provide fair levels of funding for all students. This model accounts for ELLs by multiplying a base funding amount per student (an amount deemed sufficient to educate a general education student to meet state standards) by an additional weighting factor. Weight factors vary depending on the perceived level of the student’s educational needs.2 Some states adjust their ELL weights based on student language proficiency levels or on the density of ELL students within a district. Weights for ELL students range from 9.6 percent (Kentucky) to 99 percent (Maryland).
Dollar amounts are used to account for ELL students in the formula by setting a single amount per ELL. Although this strategy may appear to be a categorical expenditure (explained in the next section), these dollar amounts are part of the formula, not separate.
Teacher allocations account for ELLs in their state’s primary funding formula through staffing costs. For example, Tennessee’s formula provides districts with funding for an additional teaching position for every 30 ELLs and an additional interpreter position for every 300 ELL students.
Considerations Formula funding is a popular mechanism because funds tend to be more insulated from budgetary cuts. Formula funding is considered:
Predictable Reliable Transparent Equitable Simple
Formula funding does not, however, always guarantee that the additional funds will be spent on ELLs. Most formulas do not contain mandates on how funds are spent. State formulas simply allocate funds to districts, and districts decide how ELL funds are used.
State Example California’s Local Control Funding Formula is a new and simplified funding formula that weights ELLs rather than relying on categorical funding (explained in the next section). It is drawing national attention for being transparent and straightforward, and for empowering local districts to choose how to best spend their resources.3
Categorical Funding Nine states allocate funds for ELLs through categorical programs, which are provided outside of the state’s primary funding formula and allot money for specific programs through line items in the budget. State distribution of categorical funds is like the distribution of gift cards. For example, a district will get a designated allocation from the state that can only be spent on ELLs.
Considerations States have been moving away from categorical funding in recent years. A 2008 analysis found that ELL funding was one of the most common categorical programs. Since then, 29 states have decreased their
Education Commission of the States • 700 Broadway, Suite 810 • Denver, CO 80203-3442 • 303.299.3600 • fax 303.296.8332 • www.ecs.org
Page 3
use of categorical funding generally, and ELLs are no longer one of the most common targets for categorical funds.4 States still using categorical funding for ELLs tend to do so because it guarantees that state funds earmarked for ELLs are being used accordingly. While categorical funding for ELLs ensures that districts spend money to support student language acquisition, opponents argue the funding is too narrowly directed and thereby limits district and school flexibility. Critics argue that decisions on how to most appropriately use funds are more easily determined at the local level.5 A challenge faced by districts is that the amount of funding received depends on ever-changing state budgets, thereby creating uncertainty. Categorical funding is considered:
Less transparent More unstable and unpredictable More complicated Rule oriented More paperwork
State Example The Colorado Department of Education determines the amount of money for each district based on number of ELLs and the amount of state appropriations.6
Reimbursement Three states provide districts with ELL funding through reimbursements. Reimbursement funding is provided outside of the state’s primary funding formula. Reimbursements are made to districts upon actual costs accrued. Reimbursements are made only upon the approval of the state superintendent. Reimbursement also tend to gives states the opportunity to limit funding to specified expenses. For example:
Michigan requires that funds be used solely for instruction in speaking, reading, writing or comprehension of English.7
Wisconsin requires that funds only be used for personnel salaries and special books and resources used in the program, or other expenses as approved by the state superintendent.8
Considerations Through a reimbursement model, policymakers can account for how state money is being spent. Such a model also ensures:
Higher reporting standards Better tracking of state funds
While such accountability may be appealing, there are several challenges with reimbursement models:
Unstable: funding is subject to budgetary decisions Paperwork intensive There is no guarantee that all expenses with be reimbursed Restrictive
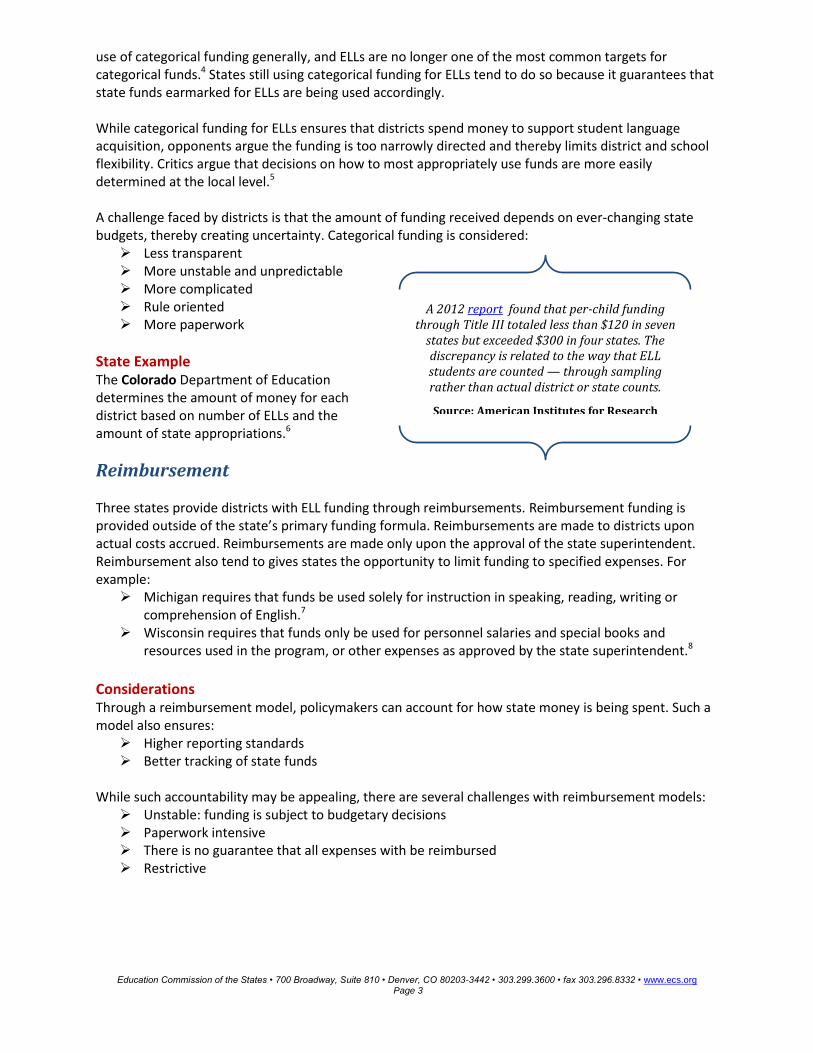
A 2012 report found that per-child funding through Title III totaled less than $120 in seven
states but exceeded $300 in four states. The discrepancy is related to the way that ELL students are counted — through sampling rather than actual district or state counts.
Education Commission of the States • 700 Broadway, Suite 810 • Denver, CO 80203-3442 • 303.299.3600 • fax 303.296.8332 • www.ecs.org
Page 4
State Example Illinois requires districts to keep an accurate, detailed and separate account of all monies paid out for ELL programs, including transportation costs, and must annually report the average per-pupil expenditure. School districts are reimbursed for the amount that exceeds the average per-pupil expenditure for children not in any special education program. At least 60 percent of transitional bilingual education funding received from the state must be used for the instructional costs of transitional bilingual education. Districts must submit applications to the state superintendent for preapproval.9
Discussion
As ELL populations continue to rise, states may need to make adjustments to their current funding strategies. Understanding how state dollars are allocated for ELLs is critical because it allows policymakers to make more informed school finance decisions. Whichever mechanism a state uses, the funding level must match the services students need to move them from ELL education to mainstream education. Equity and adequacy are critical for the successful implementation of ELL programs.
State ELL Funding Mechanisms
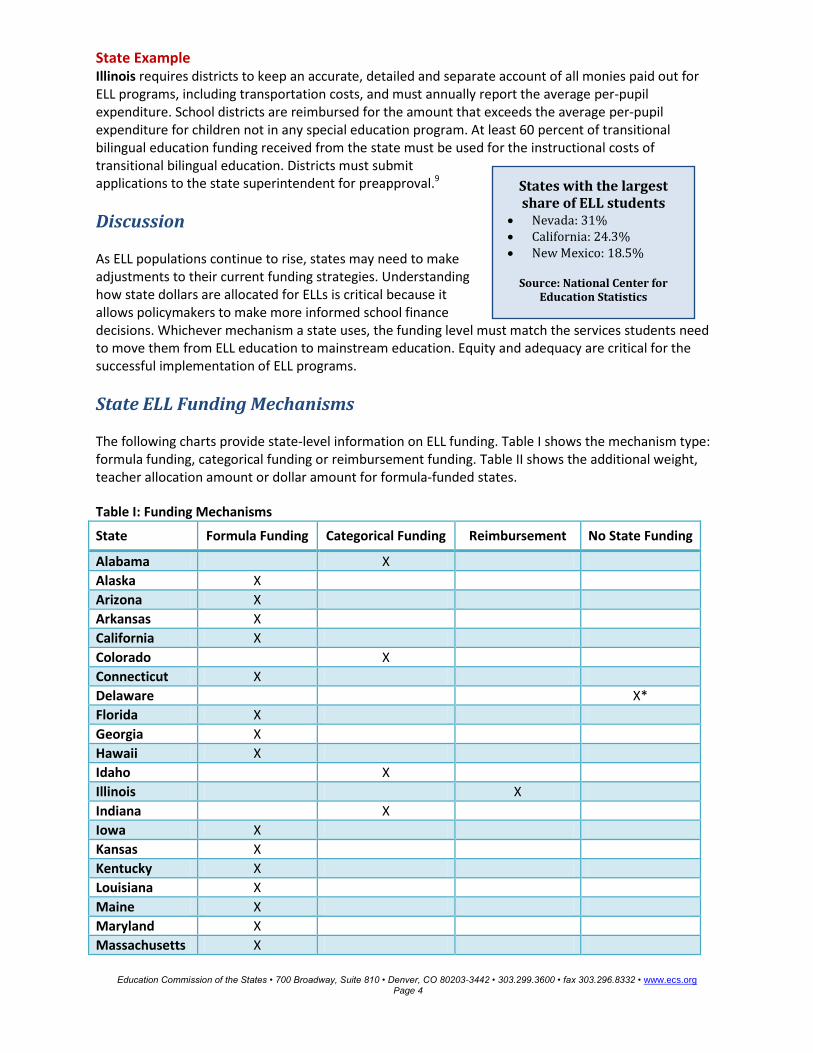
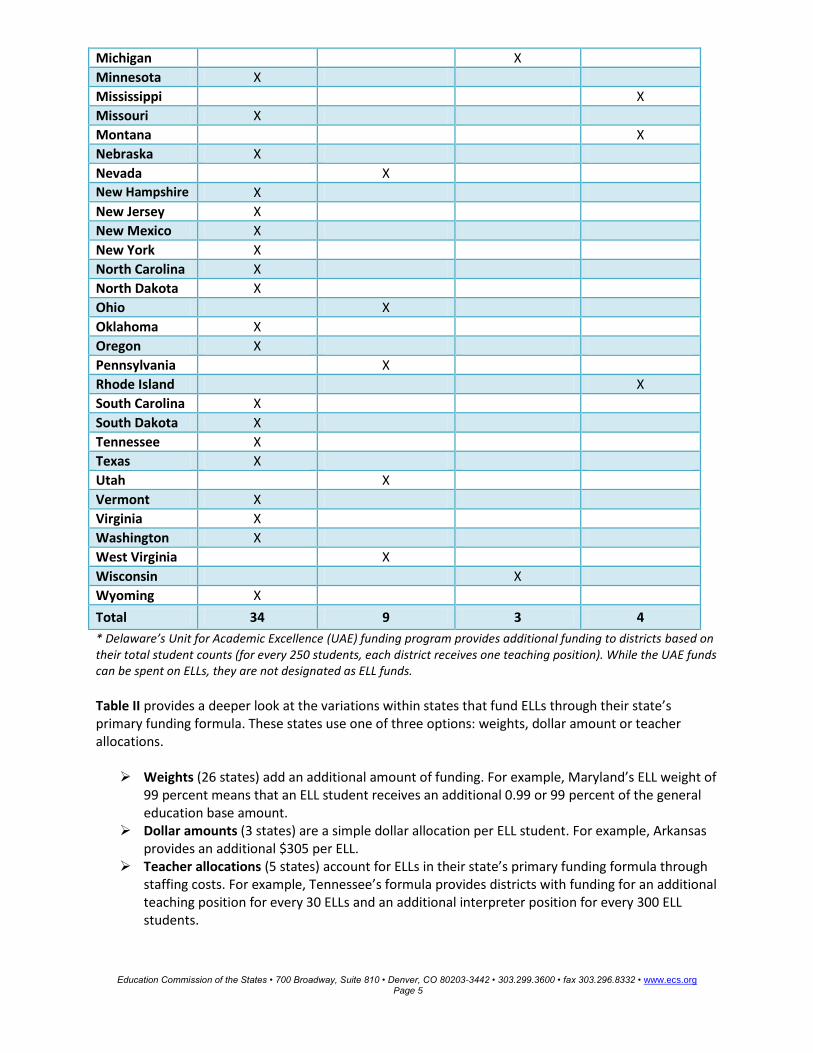
The following charts provide state-level information on ELL funding. Table I shows the mechanism type: formula funding, categorical funding or reimbursement funding. Table II shows the additional weight, teacher allocation amount or dollar amount for formula-funded states. Table I: Funding Mechanisms
State Formula Funding Categorical Funding Reimbursement No State Funding
Alabama X
Alaska X
Arizona X
Arkansas X
California X
Colorado X
Connecticut X
Delaware X*
Florida X
Georgia X
Hawaii X
Idaho X
Illinois X
Indiana X
Iowa X
Kansas X
Kentucky X
Louisiana X
Maine X
Maryland X
Massachusetts X
States with the largest share of ELL students
Nevada: 31% California: 24.3% New Mexico: 18.5%
Source: National Center for Education Statistics
Education Commission of the States • 700 Broadway, Suite 810 • Denver, CO 80203-3442 • 303.299.3600 • fax 303.296.8332 • www.ecs.org
Page 5
Michigan X
Minnesota X
Mississippi X
Missouri X
Montana X
Nebraska X
Nevada X
New Hampshire X
New Jersey X
New Mexico X
New York X
North Carolina X
North Dakota X
Ohio X
Oklahoma X
Oregon X
Pennsylvania X
Rhode Island X
South Carolina X
South Dakota X
Tennessee X
Texas X
Utah X
Vermont X
Virginia X
Washington X
West Virginia X
Wisconsin X
Wyoming X
Total 34 9 3 4
* Delaware’s Unit for Academic Excellence (UAE) funding program provides additional funding to districts based on their total student counts (for every 250 students, each district receives one teaching position). While the UAE funds can be spent on ELLs, they are not designated as ELL funds.
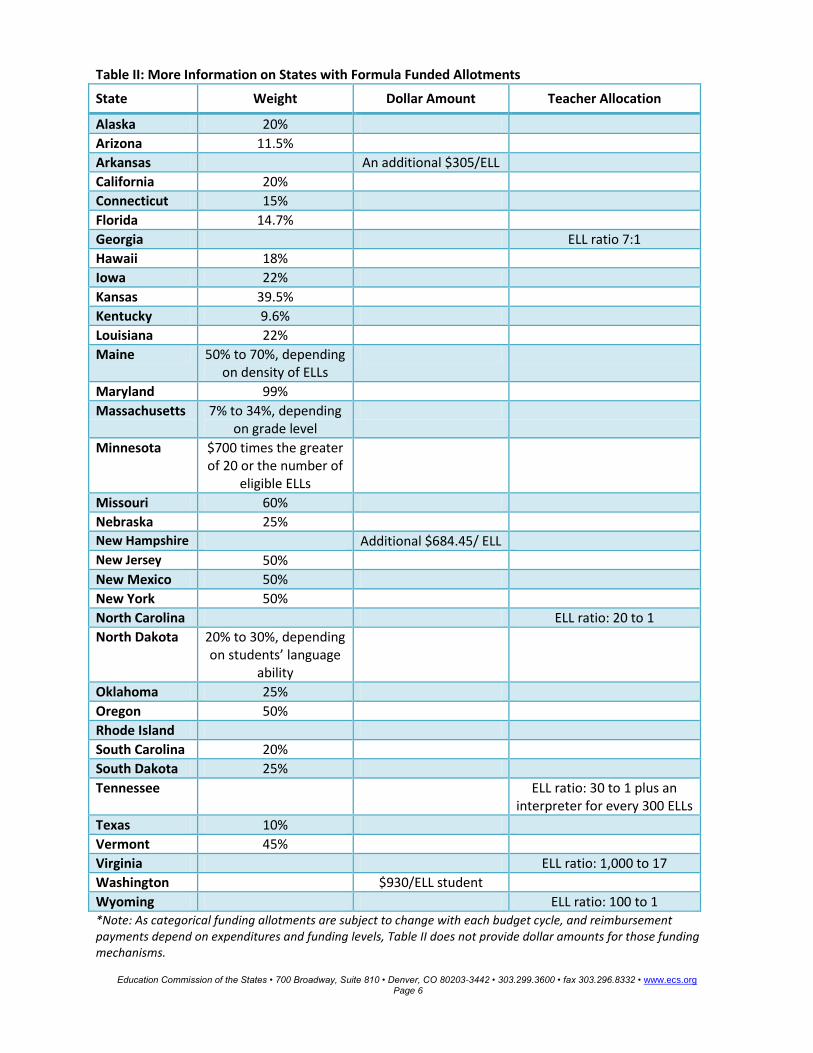
Table II provides a deeper look at the variations within states that fund ELLs through their state’s primary funding formula. These states use one of three options: weights, dollar amount or teacher allocations.
Weights (26 states) add an additional amount of funding. For example, Maryland’s ELL weight of 99 percent means that an ELL student receives an additional 0.99 or 99 percent of the general education base amount.
Dollar amounts (3 states) are a simple dollar allocation per ELL student. For example, Arkansas provides an additional $305 per ELL.
Teacher allocations (5 states) account for ELLs in their state’s primary funding formula through staffing costs. For example, Tennessee’s formula provides districts with funding for an additional teaching position for every 30 ELLs and an additional interpreter position for every 300 ELL students.
Education Commission of the States • 700 Broadway, Suite 810 • Denver, CO 80203-3442 • 303.299.3600 • fax 303.296.8332 • www.ecs.org
Page 6
Table II: More Information on States with Formula Funded Allotments
State Weight Dollar Amount Teacher Allocation
Alaska 20%
Arizona 11.5%
Arkansas An additional $305/ELL
California 20%
Connecticut 15%
Florida 14.7%
Georgia ELL ratio 7:1
Hawaii 18%
Iowa 22%
Kansas 39.5%
Kentucky 9.6%
Louisiana 22%
Maine 50% to 70%, depending on density of ELLs
Maryland 99%
Massachusetts 7% to 34%, depending on grade level
Minnesota $700 times the greater of 20 or the number of
eligible ELLs
Missouri 60%
Nebraska 25%
New Hampshire Additional $684.45/ ELL
New Jersey 50%
New Mexico 50%
New York 50%
North Carolina ELL ratio: 20 to 1
North Dakota 20% to 30%, depending on students’ language
ability
Oklahoma 25%
Oregon 50%
Rhode Island
South Carolina 20%
South Dakota 25%
Tennessee ELL ratio: 30 to 1 plus an interpreter for every 300 ELLs
Texas 10%
Vermont 45%
Virginia ELL ratio: 1,000 to 17
Washington $930/ELL student
Wyoming ELL ratio: 100 to 1 *Note: As categorical funding allotments are subject to change with each budget cycle, and reimbursement payments depend on expenditures and funding levels, Table II does not provide dollar amounts for those funding mechanisms.
Education Commission of the States • 700 Broadway, Suite 810 • Denver, CO 80203-3442 • 303.299.3600 • fax 303.296.8332 • www.ecs.org
Page 7
Other ECS Resources
Jennifer Dounay Zinth, “English Language Learners: A Growing — Yet Underserved — Student Population,” Progress of Education Reform, Vol. 14, No.6, Education Commission of the States, December 2013.
Mike Griffith & John Hancock, “A Survey of State ELL/ESL Funding Systems,” State Notes, Education Commission of the States, March 2006.
ECS Funding Formula Issue Site ECS ELL/State Bilingual Policy Database ECS ELL/Bilingual Issue Site
Maria Millard is a policy analyst for the Education Commission of the States. Contact her at [email protected] or (303) 299.3620. Michael Griffith of ECS contributed his expertise to this paper.
Endnotes 1 Rachel Slama, “Investigating Whether and When English Learners are Reclassified Into Mainstream Classrooms in
the United States: A Discrete-Time Survival Analysis,” American Educational Research Journal (April 2014): 220, http://aer.sagepub.com/content/51/2/220.short 2 Michael Griffith, “State Education Funding Formulas and Grade Weighting,” Education Commission of the States
(May 2005): 1, http://www.lwvri.org/edstudy/2011-EdStudy-IVa-FundingFormulas.pdf 3 “Local Control Funding Formula Overview,” California Department of Education,
http://www.cde.ca.gov/fg/aa/lc/lcffoverview.asp 4 Joanna Smith et al, “Categorical Funds: The Intersection of School Finance and Governance,” Center for American