268


2011 - 2016
TEXAS STATE
HEALTH PLAN
A Roadmap to a Healthy Texas
Statewide Health Coordinating Council


TEXAS STATEWIDE HEALTH COORDINATING COUNCIL P.O. Box 149347
Austin, Texas 78714-9347 OFFICERS MEMBERS Ben G. Raimer, M.D. Troy Alexander Chair Richard Beard James A. Endicott, Jr., J.D. Davidica Blum 1st Vice Chair Lourdes M. Cuellar, R.Ph. Stacey Silverman, Ph.D. Karl Floyd, M.Ed. Secretary Janie Gonzalez, B.A. Ayeez Lalji, D.D.S. Elva LeBlanc, Ph.D. Teresa Richard Richard Smith, D.D.S. Tom Valentine, M.A. The Honorable Rick Perry Governor of Texas State Capital Austin, Texas 78711 Dear Governor Perry: On behalf of the members of the Statewide Health Coordinating Council, I am pleased to forward the 2011 – 2016 Texas State Health Plan to you. The Council has chosen to study and evaluate several topics that have a direct affect on health care and workforce issues. As legislators and other health policy makers are faced with rapid changes in the health care delivery system, this state health plan attempts to identify some of the opportunities and challenges related to access to care, technology and prevention and education. Collaboration of council members, health care partners and staff has resulted in a plan that also examines the demographics of the general population and the healthcare workforce status and makes recommendations that we hope are useful to you in the upcoming legislative session. Sincerely, Ben G. Raimer, M.D., Chair Statewide Health Coordinating Council Enclosure


Texas State Health Plan 2011-2016 i
TABLE OF CONTENTS
Statement of the Chairman ......................................................................................................... iii Vision............................................................................................................................................ vii Acknowledgements
Council Members ............................................................................................................. ix Section Contributors........................................................................................................ xi
DSHS Staff Support ...................................................................................................... xvii EXECUTIVE SUMMARY ....................................................................................................... xix Section I DEMOGRAPHIC REVIEW OF THE GENERAL POPULATION ........................................1 Section II DEMOGRAPHIC REVIEW OF THE TEXAS HEALTH PROFESSIONS WORKFORCE ...............................................15 Section III ACCESS TO CARE...................................................................................................................113 Section IV TECHNOLOGY ........................................................................................................................165 Section V PREVENTION AND EDUCATION........................................................................................175 Appendix I RECOMMENDATIONS...........................................................................................................199 Appendix II PAPERS ON NURSING WORKFORCE ...............................................................................215


Texas State Health Plan 2011-2016 iii
STATEMENT OF THE CHAIRMAN
For more than a decade, The State Health Plan and its biennial updates have focused on the need to improve access and quality of health care for all Texans. Another recurrent theme has been the need to address the continuing health professions workforce shortage. The SHCC launched initiatives more than 10 years ago designed to improve the method for collecting and tracking the number and demographics of health practitioners. It is impossible to predict and address future needs without that information. Although the Legislature made the Minimum Data Set a requirement for licensure of health professionals several sessions ago, the use of that system still falls far short of its intent and critically impairs the state’s ability to predict availability (or lack thereof) of key health professionals. Advances in the data collection practices at the Board of Medical Examiners and Board of Nurse Examiners have greatly added to those organizations’ data capabilities, enabling the DSHS Health Professions Resource Center in turn to more accurately assess and predict the available numbers of practitioners to serve the needs of Texans. Working closely with the state demographer, population growth, geographic distribution, diversity trends and changes in age distribution patterns statewide can also be used to predict health workforce demands when matched against the number of practitioners by location. Data have shown year after year that Texas is faced with two clear trends: (1) the population is growing faster than almost any other state in the U.S., and (2) the number of health care providers is NOT keeping pace with that rate of growth. In addition there continues to be major geographic maldistributions of health care practitioners across Texas. Border and rural areas face the greatest shortages in numbers of health professionals per 100,000 population. And, in spite of significant advances in technology, regulatory barriers have prevented the deployment of telemedicine and other technologies in medically underserved areas, whether urban or rural. The facts are simple and sobering:
1. Texas has a shortage of physicians in primary care and specialty care! Although the state has increased both the number of medical schools and the size of medical school classes over the past decade, there have not been significant increases in Graduate Medical Education positions for the training of these graduates in Texas. The lack of funded GME slots results in Texas graduates going out-of-state to do their residencies. Only half of those who leave Texas to train ever return; in contrast, more than 80 percent of those who graduate from a Texas medical school and complete a Texas-based GME program will stay and practice in the Texas. Until Texas makes graduate medical education its priority in health education funding, the state will continue to invest in medical students who ultimately will go elsewhere for residency and long-term practice. It simply doesn’t make good economic sense for Texas to educate physicians who will serve other states when the need here is so great.
2. There is also a shortage of registered nurses in Texas, but there is an abundance of
licensed vocational nurses. The scope of practice of LVNs has been severely restricted exacerbating the nursing shortage. Moreover, the shortages of nurse educators and graduates persist despite innovative programs funded in recent sessions by the Texas

Texas State Health Plan 2011-2016 iv
Higher Education Coordinating Board and the Legislature to support faculty salaries, fast-track programs and student scholarships. Attrition rates from nurse education programs are alarming; even more so are the attrition rates from the profession itself, in spite of significant salary increases over the past 10 years.
3. Unfortunately, shortages aren’t limited to physicians and nurses. The workforce in all the
other health professions is woefully insufficient to meet current or future demand in Texas. The well-documented shortages are most apparent in border and rural areas and include pharmacists, physical therapists, occupational therapists, physician assistants, behavioral health professionals, clinical laboratory scientists, radiology technicians, and others. The rapid development and application of medical technology, electronic medical record systems, and information management systems will also make additional demands on the health professions workforce training programs of the future.
The Texas population is growing faster than any other state, with more than 400,000 people becoming new Texans every year (half by birth and half by legal immigration). The growth in the number of undocumented immigrants is unknown but thought to be quite significant. The high birth rate in Texas demands increased numbers of obstetricians, midwives, nurses, and pediatricians. The number of pediatric sub-specialists (neonatology, hematology, neurology, psychiatry, gastroenterology, cardiology, development, orthopedics, etc.) is dramatically below that of the U.S. as a whole. At the other end of the age spectrum, there is an ever-increasing number of Texans 65 and older with remarkable longevity in spite of poor overall health status. These individuals require primary and specialty care services as well. In addition, aging Texans, like their pediatric counterparts, need a vast array of support services, as well as assistance from therapists (physical, occupational, speech, hearing, etc.), pharmacists, nursing care, and chronic disease management experts. These demographic pressures are compounded by the anticipated impact of national health care reform. Millions of Texans will be added to the current Medicaid eligibility lists by 2014 and others will enter through discounted purchasing organizations. The demand for health care services could increase by as much as 25 to 30 percent in some areas of our state. This will likely overwhelm an already fragile health system. We caught a small glimpse of what may come when Hurricane Ike temporarily shut down the UTMB hospitals and trauma center in Galveston. The impact on Houston and surrounding health systems was significant, with long waits in emergency rooms and area hospital beds at capacity because one institution recording several hundred thousand visits annually was offline. Imagine the impact when several million new patients are introduced to existing health systems. Where will the workforce to take care of those patients come from? Where are the resources? As the demand for health care services in Texas grows daily, the question is: How can we meet that demand now and in the future? We must entertain new models of care that improve access. We must also employ more effective health and wellness programs, prevention programs and educational programs to improve health status. The use of technology will also demand new workforce initiatives. If we keep doing what we have always done, we will likely get the same unacceptable results. Existing health professions schools simply cannot educate and train enough providers to meet future demands using antiquated education and training models. The lack of funded GME

Texas State Health Plan 2011-2016 v
programs makes ours a failed process. Boldness and innovation in our thinking and practice may be uncomfortable for some, but they are a necessary step toward a healthier Texas. Without the willingness to change, we will find ourselves with a health system incapable of meeting the needs of any of our citizens—young or old, wealthy or impoverished, urban or rural. In turn, the productivity of our state will be significantly and adversely affected as more and more Texans find themselves unable to work due to chronic and debilitating health conditions. Maintaining current regulatory and scope-of-practice restrictions will not serve us well either. Major reforms in education, regulation, scope-of-practice determination and the use of resources MUST be priorities for our state. Simply put, the status quo is not sustainable. Choosing to do things differently requires revolutionary thinking and bold action. Texas must embrace a serious re-prioritization of resources in health education, and that education must be inter-professional and interdisciplinary. Graduate Medical Education programs must be placed at the top of the financial priority list. We must determine scope-of-practice boundaries using evidence-based criteria and core educational competencies, with standards for quality and public welfare of paramount importance. Licensure for the practice of medicine must NOT be compromised. Health care education must become less fragmented and include a career matrix so that professionals share broader bases of knowledge that enable them to migrate among different career paths as their interests and the needs of those they serve evolve. We must educate health professionals collaboratively so that they can practice in team-based models in the future. Texas must align desired health outcomes with financial incentives and rewards for those practitioners demonstrating evidence-based practice and desired outcomes. Priority must be given to maintaining wellness, for prevention and education programs, and for the management of chronic disease in a manner that reduces unnecessary emergency room and hospital admissions. The leading causes of death (and health care costs) must be addressed through state funding priorities that focus on reducing these costs, even if outside of the health arena. Health disparities must be eliminated to ensure that all Texans have health equity and opportunity to enjoy productive, meaningful lives. Every year that our state puts off reforming the health professional education and training process is another year that quality of and access to health services deteriorate. Inaction almost guarantees that future assessments will report increasing shortages in the health care workforce, decreased access to services and erosion in quality of life. Improving the health of all Texans is about much more than adding a new medical or nursing school. It is about a vision for a future in which health care delivery is a shared community responsibility. It requires us to stretch our imaginations and our comfort zones to embrace new technologies and new models of medical practice. Dr. Ben Raimer has been a member of the Statewide Health Coordinating Council since his appointment by Governor George W. Bush in 1997. He has served as chair for the past 14 years and presided over production of the State Health Plan and the SHCC’s health professions workforce assessments.


Texas State Health Plan 2011-2016 vii
Texas Statewide Health Coordinating Council
Vision Statement
We envision a Texas in which all are able to achieve their maximum
health potential – A Texas in which:
• Prevention and education are the primary approaches for achieving optimal health.
• All have equal access to quality health care.
• Local communities are empowered to plan and direct interventions
that have the greatest impact on the health of all. • We, and future generations, are healthy, productive and able to
make informed decisions.
A Healthy Texas is a Productive Texas

Texas State Health Plan 2011-2016 ix
2011-2016
TEXAS STATE HEALTH PLAN TEXAS STATEWIDE HEALTH COORDINATING COUNCIL
Name/City Representing Officers: Ben G. Raimer, M.D. University Representative Chair, Galveston James A. Endicott, Jr., J.D. Public Member 1st Vice Chair, Harker Heights Stacey Silverman, Ph.D. Texas Higher Education Coordinating Board Secretary, Austin Members: Troy Alexander Texas Department of State Health Services Austin Richard Beard, R.N. Nursing Representative Mesquite Davidica Blum HMO Representative Georgetown Lourdes M. Cuellar, R.Ph. Hospital Representative Houston Karl Alonzo Floyd, M.Ed. Health Care Professional Stafford Janie Martinez Gonzalez, B.A. Public Member San Antonio Don Henderson, B.A. Texas Department of Aging & Disability Services Austin Ayeez A. Lalji, D.D.S. Public Member Sugar Land Elva Concha LeBlanc, Ph.D. Community College Representative Fort Worth

Texas State Health Plan 2011-2016 x
Richard Madsen Smith, D.D.S. Health Care Professional Houston Tom Valentine, M.S. Texas Health and Human Services Commission Austin Vacant Health Care Professional Vacant Public Member Vacant University Representative

Texas State Health Plan 2011-2016 xi
2011 – 2016 Texas State Health Plan
Section Contributors
Demographic Review of Population Trends in Texas Karl Eschbach, Ph.D. – CHAIR State Demographer Jacqhes Baillargeon, Ph.D. – CO-CHAIR Assistant Professor Preventive Medicine and Community Health University of Texas Medical Branch – Galveston Richard Smith, D.D.S Statewide Health Coordinating Council - Member Demographic Review of the Texas Health Professions Workforce Physicians, Dentists, etc. Brian King – CHAIR Director, Health Professions Resource Center Department of State Health Services Marcia Collins Director, Medical Education Texas Medical Association Bruce Gunn, Ph.D. Manager, Health Resources and Data Management DSHS Nursing Workforce Aileen Kishi, Ph.D., R.N. Director, Texas Center for Nursing Workforce Studies Department of State health Services Richard Beard, R.N. Statewide Health Coordinating Council - Member Heather Morris, M.S.N., R.N. Allergy Asthma Clinic of West Texas Adjunct Faculty – Texas Tech University HSC School of Nursing

Texas State Health Plan 2011-2016 xii
Diane Moy, M.S.N, R.N. Director, Public Health Nursing Department of State Health Services Elizabeth Poster, Ph.D., R.N. Dean, School of Nursing University of Texas-Arlington Susan Sportsman, Ph.D., R.N. Dean, College of Health Sciences and Human Services Midwestern State University Behavioral Health Workforce Vicki Hansen, LMSW-AP, ACSW, Executive Director National Association of Social Workers – Texas Chapter The Staff at the Hogg Foundation for Mental Health Allied Health Workforce Elizabeth Protas, P.T., Ph.D. – CO-CHAIR Vice President and Dean School of Health Professions University of Texas Medical Branch-Galveston Donna Carlin Senior Program Director Academic Research and Grant Programs Texas Higher Education Coordinating Board Vicki Freeman, Ph.D., MT (ASCP)SC Chair and Professor, Department of Clinical Laboratory Sciences University of Texas Medical Branch – Galveston Ronnie G. Lozano, MSRS, RT(T) Chair and Associate Professor Radiation Therapy Program Texas State University-San Marcos Jon Nilsestuen, Ph.D., RRT, FAARC Chair and Professor, Department of Respiratory Care University of Texas Medical Branch - Galveston . Richard Rahr, EdD, PA-C Chair and Professor, Department of Physician Assistant Studies University of Texas Medical Branch - Galveston

Texas State Health Plan 2011-2016 xiii
Gretchen Stone, Ph.D., OTR, FAOTA Chair and Associate Professor, Department of Occupational Therapy University of Texas Medical Branch - Galveston Carolyn Utsey, P.T., Ph.D. Chair and Associate Professor, Department of Physical Therapy University of Texas Medical Branch - Galveston Stanley Y. Woo, O.D., M.S., F.A.A.O. Director of Low Vision Service University Eye Institute University of Houston President-Elect Texas Optometric Association Access to Health Care Troy Alexander – CHAIR Statewide Health Coordinating Council - Member Director, Center for Program Coordination, Policy and Innovation Department of State Health Services Wendy Andreades Center for Program Coordination, Policy and Innovation Department of state health Services Davidica Blum Statewide Health Coordinating Council - Member Scott and White Hospital System Lourdes Cuellar, R.Ph. – CO-CHAIR Statewide Health Coordinating Council - Member Memorial Hermann Hospital System Nicki Cuellar, M.S.W. Pediatric Social Worker Texas Children’s Hospital Mirsa Douglas Center for Program Coordination, Policy and Innovation Department of State Health Services Patrick Gillies Community Health Services Department of State Health Services

Texas State Health Plan 2011-2016 xiv
Alexia Green, Ph.D., R.N. Dean, School of Nursing Texas Tech University Health Science Center Ayeez Lalji, D.D.S. Statewide Health Coordinating Council - Member M’Lissa Quintanilla, L.V.N. Cuidado Casero Home Health Central, Inc. Robert Warren, M.D. Chief of Rheumatology Services Chief Medical Information Officer Texas Children's Hospital Technology Janie Gonzalez, B.A. – CHAIR Statewide Health Coordinating Council - Member Stephen Palmer – CO-CHAIR Director, Office of E-Health Coordination Health and Human Services Commission Alex Vo, Ph.D. – CO-CHAIR Executive Director, Center for Telehealth Research and Policy University of Texas Medical Branch - Galveston Chris Guerro Information Resources Department of State Health Services Don Henderson Statewide Health Coordinating Council - Member Director, Center for Policy and Innovation Department of Aging and Disability Services Elizabeth Sjoberg, J.D., R.N. Associate General Counsel Texas Hospital Association Tom Valentine, M.S. Statewide Health Coordinating Council - Member Senior Policy Advisor Office of Health Services Health and Human Services Commission

Texas State Health Plan 2011-2016 xv
Prevention and Education Elva LeBlanc, Ph.D. – CHAIR Statewide Health coordinating Council - Member President, Tarrant County College – Northwest Campus Cassie DeLeon Health Promotion and Chronic Disease Prevention Department of State Health Services Karl Floyd, M.Ed. CO-CHAIR Statewide Health Coordinating Council - Member John Gowan, M.S.W. Statewide Health Coordinating Council - Member Clair Jordan, M.S.N., R.N. Executive Director Texas Nursing Association & Texas Nursing Foundation Stacey Silverman, Ph.D. Statewide Health Coordinating Council - Member Director, Academic Research and Grants Program Texas Higher Education Coordinating Board


Texas State Health Plan 2011-2016 xvii
STAFF SUPPORTING THE STATEWIDE HEALTH COORDINATING COUNCIL
Center for Health Statistics Texas Department of State Health Services
Yvonne Howze, Ed.D., Section Director
Ramdas Menon, Ph.D., Center Director
Rosemary Ang, M.S., Research Specialist
Bruce Gunn, Ph.D., Manager, Health Provider Resource Branch
Brian King, B.A., Health Professions Resource Center
Aileen K. Kishi, Ph.D., R.N., Texas Center for Nursing Workforce Studies
Carolyn Medina, M.S., MLIS, Medical Research Library
Bobby D. Schmidt, M.Ed., Statewide Health Coordinating Council


Texas State Health Plan 2011-2016 xix
Executive Summary
Background Information
The Texas State Health Plan is prepared every six years and updated biennially. The plan serves
as a guide to help Texas decision makers formulate appropriate health policies and programs.
The Statewide Health Coordinating Council (SHCC), a 17-member council with 13 members
appointed by the governor and four members representing specified state agencies, develops the
plan. Chapter 104 of the Health and Safety Code is the enabling legislation for the Statewide
Health Coordinating Council. Under the authority of Chapter 104, the governor, with the consent
of the senate, appoints the 13 council members to staggered six-year terms. The heads of the
four state agencies serve on the council or designate an individual to serve on their behalf.
The broad purpose of the Statewide Health Coordinating Council is to ensure that health care
services and facilities are available to all Texans through health planning activities. Based on
these planning activities, the council makes recommendations to the governor and the legislature
through the Texas State Health Plan. The council provides overall guidance in the development
of the Texas State Health Plan, submission of the plan to the governor, and promoting the
implementation of the plan. The plan is due to the governor for adoption by November 1 of each
even-numbered year. Staff in the Center for Health Statistics, with assistance from other program
areas at the Texas Department of State Health Services, supports the council’s activities.
The 75th Legislature amended Chapter 104 of the Health and Safety Code and focused the
council’s planning activities on the health professions workforce. The council produced the
1999–2004 Texas State Health Plan: Ensuring a Quality Health Care Workforce for Texas,
which was the fundamental plan for the initial six-year planning cycle. The 2005–2010 Texas
State Health Plan: Innovative Approaches to Health Workforce Planning in Texas also focused
health workforce planning and the status of the Texas health workforce.

Texas State Health Plan 2011-2016 xx
During the last two years, the SHCC began to deliberate the approach it would take during the
six-year planning cycle and the production of the 2011 - 2016 Texas State Health Plan: A
Roadmap to a Healthy Texas. Due to critical health workforce shortages and the challenges of
changing demographics, the members felt that it was necessary to consider a slightly different
approach. Rather than continue to look only at the health workforce that would be required to
fulfill the current traditional medical model, the SHCC decided to research five characteristics
that affect the health care system in Texas. These five aspects include: a demographic review of
the general population in Texas, a demographic review of the Texas health professions
workforce, access to health care that includes innovative delivery models based on evidence-
based practices, technology enhancements that produce a more efficient delivery of healthcare
and medical treatment, and a prevention and education model that speaks to a new science-based
approach to promoting health and preventing disease.
Methodology
The 2011 -2016 Texas State Health Plan was developed over a one-year period. The plan was
divided into five sections: Demographic Review of Population Trends in Texas, Demographic
Review of the Texas Health Professions Workforce, Access to Care, Technology and Prevention
and Education. A workgroup was assigned to each section with SHCC members having
leadership involvement.
Section workgroups had representation from the Statewide Health Coordinating Council, Health
and Human Service Commission, Texas Higher Education Coordinating Board, Department of
Aging Disabilities Services, Department of State Health Services, State Demographer, Texas
Medical Association, Texas Hospital Association, Texas Nursing Association, Memorial
Hermann Hospital System, Scott and White Hospital System, St. David’s Hospital System,
University of Texas Medical Branch at Galveston, Texas Tech University, University of Texas at
Arlington and Tarrant County Junior College.
The section workgroups met at regular intervals during a six month process and produced a
preliminary findings document. The preliminary findings document was presented at a
Statewide Health Workforce Symposium – “Call to Collaboration” in February 2010. There

Texas State Health Plan 2011-2016 xxi
were approximately 150 attendees representing academia, state agencies, regulatory boards,
professional associations, public health, the legislature and private and non-profit organizations.
Time was allotted for input and feedback from symposium participants. A DRAFT State Health
Plan and DRAFT Recommendations was developed from this process.
The DRAFT State Health Plan and DRAFT Recommendations were posted on the SHCC
website for a 30-day comment period. The SHCC addressed and responded to all comments that
were received. The complete development work plan is described below.
Phase I (November 2009 – February 2010)
The Statewide Health Coordinating Council (SHCC) -housed in the DSHS Center for Health
Statistics - invited health care workforce experts and other stakeholders to participate in the
preliminary drafting of the state health plan. Workgroups by section met to brainstorm ideas and
then decide on content and format of each section. This product was presented at a symposium
of a larger group of stakeholders on February 19, 2010. Stakeholders at this conference were
asked to give further input into the state health plan.
Phase II (February 2010 – April 2010)
The section workgroups incorporated the expert and stakeholder input into the state health plan
and presented a draft to the SHCC at the April 2010 meeting for approval as a proposed state
health plan.
Phase III (May 2010 – July 2010)
The SHCC Project Director published the proposed state health plan for a 30-day comment
period. The SHCC considered and responded to all submitted comments. A final 2011 – 2016
State Health Plan was presented to the SHCC at the July 2010 meeting for approval.
Phase IV (July 2010 – October 2010)
The SHCC Project Director and CHS staff prepared the 2011 – 2016 State Health Plan for
submittal to the Governor and the Legislature by October 31, 2010.

Texas State Health Plan 2011-2016 xxii
Identification of Issues
Demographic Review of the General Population
Section I will take a demographic view of the general population. The section will analyze the
demographic changes relevant to the health workforce demand. Natural increases, migration,
projected population growth, changes in age structure, racial and ethnic populations, uninsured
populations and regional inequalities will be examined.
Demographic Review of the Texas Health Professions Workforce
Section II will review the demographics of the Texas health professions workforce. The section
will report on the demographic trends and the supply and distribution of health professionals by
geographic region in order that there may be a better understanding of access to health care
services by Texans. The data in the section will describe these trends in the supply and
distribution of various types of health care providers and compare these to the national averages.
The section will also look at Health Professional Shortage Areas, which indicates that a county
has an inadequate number of specific health professionals to serve the population of the county.
Access to Care
Section III will discuss access to health care. This discussion will include uninsured populations
and the extraordinary economic and service burdens that this population places upon health care
providers, hospitals, trauma centers, and the communities which provide funding for health
services. The section will explore health disparities that adversely affect groups of people who
have systematically experienced greater social and/or economic obstacles to the health care
system. Health providers and the health care system must adjust and develop relationships to
meet the needs of individuals and address cultural competencies, and health literacy. The needs
of special populations will also be discussed. This discussion will include persons with
disabilities, rural populations, child and adolescent populations and the geriatric population.
Technology
Section IV will consider the development of policies and tools for technology in the health care
system. The section will examine the ways that telemedicine, electronic health records and health
information technology will enhance the efficiency and quality of the delivery of health care in

Texas State Health Plan 2011-2016 xxiii
the state. Telemedicine will increase the availability of primary and specialty health care across
the state. Electronic Medical and Health Records will provide the health care provider with
immediate access to an individuals complete and current heath status. Health information
technology can link the health care industry for better patient outcomes in a much more cost
effective manner.
Prevention and Education
Section V will speak to the importance of prevention and education and the science-based
approach to promoting health and preventing disease. The adult and adolescent obesity crisis will
be examined and individual responsibility will be discussed. Additionally, chronic diseases
associated with an aging population will be considered. The section will also discuss early
intervention and evidence based programs and how they can interject a cost savings to the health
care system.
Appendix I – Recommendations
The SHCC Recommendations for 2011 – 2016 State Health Plan are found in Appendix I. These
extensive recommendations are made by section of plan. Therefore, specific recommendations
made regarding the general workforce, primary care, nursing workforce, allied health
professions, access to care, technology and prevention and education.
Appendix II – Papers on Nurse Workforce
Papers on the nursing workforce issues are discussed in Appendix I of the State Health Plan.
Various issues on discussed including: “Recruitment and Retention of a Diverse student
Population”, “Health Information Technology and Recommendations for Nursing Education in
Texas”, “Retention of Nurses in the Workforce”, “Comprehensive Strategic Plan for the
Retention of Nurses in the Workforce”, “Use of Nurse Practitioners/Physician Assistants to
address Primary Care Needs in Texas”, “Advanced Practice Registered Nurses in Texas”, and
“Certified Registered Nurse Anesthetists in Texas”.
Comments from 30-day Comment Period
The DRAFT 2011 – 2016 State Health Plan was placed on the SHCC website for 30 days in May
2010. Stakeholders and the general public were asked to give their comments and further input

Texas State Health Plan 2011-2016 xxiv
in to the process. Comments were received from: the Arthritis Association - Texas Chapter, the
Hays County Personal Health Department, the Hogg Foundation for Mental Health, the Houston
Department of Health and Human Services, Tarrant County Public Health Department, and the
Texas Medical Association.
Conclusion
The 2011 – 2016 Texas State Health Plan: A Roadmap to a Healthy Texas is designed to provide
information regarding issues that may have an affect on the Texas health care system, its
providers and its recipients. It is also intended to provide information for policy makers to assist
in making informed decisions that will affect all Texans.
Every Texan has a right to good health care that is effective, accessible and affordable.
However, health providers and the health care system must adjust and develop relationships to
meet the needs of individuals and address cultural competencies, and health literacy.
Telemedicine, electronic health records and health information technology will enhance the
efficiency and quality of the delivery of health care in the state. The importance of prevention
and education and the science-based approach to promoting health and preventing disease will
become more evident as individuals take more responsibility for their health and their health care
needs.


SECTION I
DEMOGRAPHIC REVIEW OF THE
GENERAL POPULATION


Demographic Review of the General Population
Texas State Health Plan 2011-2016 3
Demographic Changes Relevant to Health Workforce Demand
Texas population has grown rapidly. The July 1, 2009 population estimate for the state was 24.78
million, an increase of more than 3.93 million since 2000. This addition to the state's population
was the largest of any state. To put the growth in perspective, Texas added more population since
2000 than the total 2009 population of Oregon (3.83 million), the nation's 27th largest state.
Texas growth reflects an increase of 18.85 percent since the 2000 census. This percent increase
was more than double the national growth in this same period (9.09%) and was the 6th fastest of
all states. The fastest growing states in this decade have been the mountain states (Nevada
32.3%, Arizona 28.6%, Utah 24.7%, Idaho 19.5%) as well as the state of Georgia (20.1%).
Texas population has experienced rapid growth because of the diversity of its sources of growth.
Texas has the third highest rate of natural increase of any state in the nation. Natural increase is
the total of all births minus all deaths that occur in a period. Texas also has a high rate of both net
in-migration from other states, and immigration from other countries.
Natural Increase
The rate of natural increase in Texas has been consistently about 10 persons per thousand of the
state's population per year for each year for this decade, behind only the states of Utah and
Alaska. The rate of natural increase in Texas is high because the birth rate is high relative to
other states, while the death rate is low. The state's crude birth rate (total births/total population)
in 2008-9 was 16.68 per thousand, the 2nd highest of any state in the United States. The crude
death rate was 6.67 per thousand, the 5th lowest of any state.
One reason that the birth rate is high in Texas compared to other states and the death rate is low
in part because the state's population is relatively young. The median age in Texas was 33.2
years in 2008 compared to 36.8 years for the United States as a whole. Only Utah is younger,
with a median age of 28.7 years. The percentage of women in the state who are in the
childbearing ages of 15 to 39 years old is 35.3 relative to 33.2 percent for the United States, and
fourth highest among states and the District of Columbia. In 2008, just 10.2 percent of the state's

Demographic Review of the General Population
Texas State Health Plan 2011-2016 4
population was 65 years older or older compared to 12.8 percent for the United States as a
whole, and the fourth lowest of any state.
Texas also has a relatively high total fertility rate. The total fertility rate expresses the total
number of births that a women would have over the course of her childbearing years if she
experienced personally the current schedule of age-specific birth rates. The total fertility rate for
Texas in 2006 was 2.39 children per women, compared to 2.11 for the United States as a whole.
(This year is the most recent for which final data are available for calculation for all states.).
Texas ranks fifth in its total fertility among states. The range among rates is from 2.59 for Utah
to 1.71 for Vermont.
Migration
In the past decade, Texas has experienced a high rate of net in-migration from other states and
other countries. The Census Bureau estimates that between Census 2000 and July 1, 2009, a net
total of 933,000 persons relocated to Texas from other countries. (Net migration totals reflect the
balance of migration to Texas from other countries, minus out-migration from Texas to other
countries). Texas ranked second in the size of its net international immigration inflow in this
decade, behind only the state of California. The Census Bureau estimates that total net domestic
migration to Texas from other states since 2000 was 849,000. This total also ranks Texas second,
behind the state of Florida. In more recent years, since 2005, the Census Bureau estimates that
net migration to the state has averaged nearly 160,000 a year, a far higher total than other state.
Migration to Texas from other states was increased in recent years in comparison to the early
years in the decade in part by the relocation of persons to Texas from elsewhere on the Gulf
Coast after Hurricane Katrina struck in the fall of 2005. Texas also attracted relatively large
numbers of domestic migrants because of the relatively robust pace of job growth in the state
through much of this period, at a time when formerly faster growing states like Florida, Nevada,
and Arizona experienced radical reductions in in-migration because of economic dislocations
associated with particular severe difficulties in their housing markets.

Demographic Review of the General Population
Texas State Health Plan 2011-2016 5
Projected Population Growth
Population projections forecast future population in the state based on the continuation of trends
in birth rates, death rates, and migration rates. The most uncertainty arises because of uncertainty
about future migration to and from the state, which can be volatile given changes in economic
factors that influence migration both inside and outside of Texas. The Office of the State
Demographer has prepared projections of future population growth based on different
assumptions about migration patterns.
The recommended short term projection is based on estimates of net migration to and from the
state in the period from 2000 to 2007. This scenario projects growth in the period between 2009
and 2016 of 3.7 million persons, and a state population in 2016 of 28.6 million. The recommend
long term growth scenario projects growth in this period of 2.6 million, and a 2016 population of
26.5 million. However this scenario has under projected actual growth between 2000 and 2009
by 800,000. If we assume that state growth in the next period assumes the projected trajectory in
the long-term model, the state's population in 2016 would be 27.3 million persons. The window
between the 27.3 and 28.6 million projection provides a reasonable area of conjecture about the
state's expected population at the close of this period. The rapid observed population growth in
the state puts pressure to grow the state's healthcare workforce or use the current workforce more
efficiently.
Changes in Age Structure
From 2000 to 2008, the fastest growing age segment of the population was the population aged
45 to 64. These age groups, in 2008, represented the persons born between 1943 and 1963--that
is, the period of the so-called post-World War II baby boom cohort. The oldest members of the
baby boom cohorts will in the next decade begin to age into the age group that is 65 years old or
older. Figure 1.2 shows observed growth by age group in the period from 2000 to 2008
compared to expected growth by two scenarios. Both scenarios show the expected growth of the
state's population older (65+) population to be about 770,000 between 2008 and 2016, nearly

Demographic Review of the General Population
Texas State Health Plan 2011-2016 6
double the growth observed in the previous 8 years. Both projections agree on this prediction,
about which there is a high degree of certainty.
Figure 1.1 Texas population by age, 2000 and 2008, showing differential growth by age in
these years
Source: U.S. Bureau of the Census, 2008 Vintage estimates
In 2008 an estimated 10.2 percent of the state's population was 65 years or older. This number is
expected to increase to between 11 and 12 percent by 2016, and to between 17 and 18 percent by
2040. Thus, by 2040, persons 65 years old or older will be expected to make up more than 1/6th
of the state's population, in contrast to about 1/10th of the population today. The aging of the
population, along with its growth, impinges on the demands healthcare workforce as health care
use rates rise at older ages. We will begin to see the impact of population aging on health service
demand in the period of this plan.

Demographic Review of the General Population
Texas State Health Plan 2011-2016 7
Figure 1.2 Population growth by age, 2000 to 2008 and projected growth 2008 to 2016, 2
growth scenarios
Racial and Ethnic Populations
Racial and ethnic groups have experienced sharply different growth rates in the recent past, and
will be expected to continue to do so. The differences derive from three sources:
1) Age Structure
2) Fertility Rates
3) Migration Rates
The non-Hispanic White population has a median age of 40.1 (2008), and a total fertility rate
(children per women) in (2000) of 1.94. The median age of African Americans in 2008 was 31.1,

Demographic Review of the General Population
Texas State Health Plan 2011-2016 8
while the TFR for this group was 2.09 in 2000. The Latino/a population was far younger, with a
median age of 27.2. The total fertility rate in 2000 was 3.89 for Latina immigrants , and 2.36 for
U.S.-born Latinas. The much smaller Asian population of 34.5, and a 2000 total fertility rate of
1.87.
Table 1.1 Population by Race/Ethnicity, 2000 and 2008
Race/Ethnic Group 2000 2008 Growth Percent Increase
Percent of Growth
Black 2,349,641 2,748,323 398,682 17.0 11.5Anglo 10,927,538 11,525,623 598,085 5.5 17.2Latino 6,670,122 8,870,475 2,200,353 33.0 63.3Asian 549,054 810,967 261,913 47.7 7.5Other/Two or more 355,465 371,586 16,121 4.5 0.5Total 20,853,820 24,328,982 3,475,154 16.7 100.0 Source: U.S. Census 2000 and 2008 Vintage Population Estimates
The 2008 American Community Survey counted 1.25 million international immigrants who were
living in Texas and who had moved to state since 2000. Of these, 870,000 (70%) were Latino,
190,000 (15%) were Asian origin, and 110,000 (9%) were non-Latino White. Because of these
trends, the Texas State Data Center projects that between 2008 and 2016, non-Hispanic Whites
will account for between 3% and 9% of the state's population growth, while Latino/as will
account for over 70 percent of state growth. Even with zero no migration, the Anglo population
contributes just 9% of growth, while Latinos account for three quarters of the state's growth.
Over the longer term, the Anglo population should peak in the next decade, and then begin a
decline that is associated with natural decrease because of population aging. Latinos dominate
state growth under all scenarios, because they are the dominant group with respect to projected
births and migration.

Demographic Review of the General Population
Texas State Health Plan 2011-2016 9
Table 1.2 Projected Population of Texas in Millions by Race/Ethnic Group, 2000-2004, 2
scenarios
Source: Texas State Data Center Population Projections: Long-term assumes migration rates equal to half of 1990-2000 migration; Short-term assumes estimated migration 2000-2007
Race/Ethnicity and Health Care Access: Uninsurance
The race/ethnic changes in the state population are important for several reasons. Different racial
and ethnic groups have sharply different access to health care because of differences in health
care resources in the different regions of the State in which they live, and differences in rates at
which they lack health insurance coverage.
Demographic Review of the General Population
Texas State Health Plan 2011-2016 10
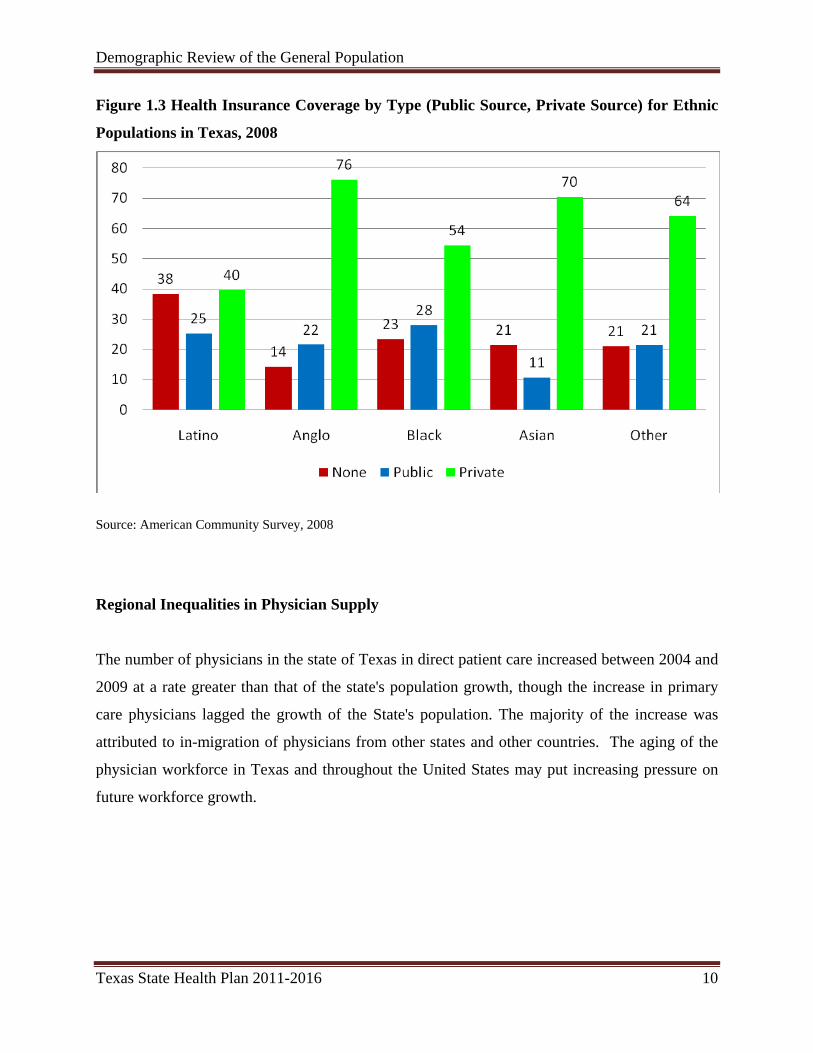
Figure 1.3 Health Insurance Coverage by Type (Public Source, Private Source) for Ethnic
Populations in Texas, 2008
Source: American Community Survey, 2008
Regional Inequalities in Physician Supply
The number of physicians in the state of Texas in direct patient care increased between 2004 and
2009 at a rate greater than that of the state's population growth, though the increase in primary
care physicians lagged the growth of the State's population. The majority of the increase was
attributed to in-migration of physicians from other states and other countries. The aging of the
physician workforce in Texas and throughout the United States may put increasing pressure on
future workforce growth.

Demographic Review of the General Population
Texas State Health Plan 2011-2016 11
Table 1.3 Physicians in direct patient care in the state of Texas, 2004 and 2009, compared
to State Population Growth
Physicians in Direct Patient Care 2004 2009 Increase PercentPrimary Care 15,374 16,830 1,456 9.6Specialist 19,558 22,544 2,986 15.3Total 34,932 39,374 4,442 12.7 Population (Millions) 22.4 24.8 2.4 10.5 Sources: Texas Medical Board Physician Licensure Database (Maintained and supplied by the Center for Health Statistics, Department of State Health Services, Health Professions Resource Center). Tabulated at Texas State Data Center.
Texas faces particular challenges with respect to physician and other healthcare workforces not
primarily because of an overall shortage, but because of sharp disparities in the allocation of
healthcare resources to different parts of the state. In the metropolitan areas outside the border,
there is one physician in direct patient care for each 573 county residents. In the 32 county
border region and in non-metropolitan Texas, the ratios are 2 to 3 times as high.

Demographic Review of the General Population
Texas State Health Plan 2011-2016 12
Figure 1.4 Population to physician ratios by metropolitan status and border status (32
county border definition)
Sources: Texas Medical Board Physician Licensure Database (Maintained and supplied by the Center for Health Statistics, Department of State Health Services, Health Professions Resource Center). Tabulated at Texas State Data Center.


SECTION II
DEMOGRAPHIC REVIEW OF THE
TEXAS HEALTH PROFESSIONS
WORKFORCE


Demographic Review of the Texas Health Professions Workforce
Texas State Health Plan 2011-2016 17
Introduction
The importance of access to health care services cannot be overstated. Every person at some
point in life will need access to one or more health providers. However, access to these providers
could be adversely affected by factors beyond the person’s control, such as provider acceptance
of health plans, distance to the provider, and adequacy of the supply of providers. By reporting
on demographic trends and the supply and distribution of health professionals by geographic
region, researchers, legislators and state planners may better understand and influence access to
health care services by Texans.
Statistics
The data in this chapter and the Appendix describe trends in the supply and distribution of
various types of health care providers and compare these trends to national averages. The
statistics are presented as narratives, tables, graphs, and maps. Most of the data are presented in
the form of ratios: the number of providers in a given health profession divided by the population
of the area being evaluated, multiplied by 100,000. These ratios were used to compare supply
and distribution trends among various populations and areas over time. High ratios indicate there
are more providers who are available to serve the population in an area; low ratios indicate there
are not enough providers to serve the population. Although ratios are simplistic measures of
provider supply adequacy, they are good indicators that, when observed over time, may be used
to signal the need for conducting more extensive and comprehensive workforce studies.
Data and sources
Supply data for Texas were collected from state licensing boards. All statistics for Texas in this
report were based on professionals who were actively practicing in Texas for a given year. Most
of the older U.S. supply data shown in the graphs were obtained from the U.S. Bureau of Health
Professions and some national professional organizations. U.S. data were not available for all
professions, and for many professions, the most current U.S. data available were not as recent as
the current Texas data. This is partially due to the fact that the U.S. Bureau of Health
Demographic Review of the Texas Health Professions Workforce
Texas State Health Plan 2011-2016 18
Professions no longer collects these data. Some recent U.S. data can be found at the Kaiser
Family Foundation (http://www.kff.org/), the Bureau of Labor Statistics, and various health
professions associations (such as the American Medical Association), but due to differences in
data collection methods, that information may not be directly comparable to the data from
HRSA; therefore, some trend lines for the U.S. may show sharp increases or decreases in the
supply ratios for recent years which might be attributed more to differences in the methods of
data collection rather than increases or decreases in the actual supply. For Texas, there were also
some years where supply data were not available. The years for which actual data were used in
this report are indicated on the graphs by data markers. The supply ratios for providers in each
county for all available years may be found online at: http://www.dshs.state.tx.us/CHS/hprc/.
All maps and graphs were prepared by the Health Professions Resource Center.
Texas population numbers used to calculate ratios were estimates and projections provided by
the Texas State Data Center at The University of Texas at San Antonio (TxSDC,
http://txsdc.utsa.edu/). The population numbers for a given year may not necessarily match the
numbers in other reports or Web sites because they are revised periodically by the TxSDC. The
population data used for national statistics were obtained from the U.S. Bureau of the Census.
The classification of counties as either metropolitan (77 counties) or non-metropolitan (177
counties) was based on reports from the U.S. Office of Management and Budget. The
identification of 32 Texas counties as border counties was based on Article 4 of the La Paz
Agreement between the United States and Mexico (1983) (see Figure 1). Previous State Health
Plans used the 43-county area for the border counties; therefore, the supply ratios for the border
counties cannot be directly compared to those of previous reports. For many of the analyses
presented in this chapter, the 254 counties were aggregated as border metropolitan, non-border
metropolitan, border non-metropolitan, and non-border non-metropolitan counties. In 2009, 87.4
percent of the Texas population lived in metropolitan counties and 12.6 percent in non-
metropolitan counties. Also, 78.6 percent of the state population lived in non-border
metropolitan counties, 8.8 percent in border metropolitan counties, 1.5 percent in border non-
metropolitan counties, and 11.0 percent in non-border non-metropolitan counties. Overall, 10.4
percent of the Texas population lived in the 32-county border area.

Demographic Review of the Texas Health Professions Workforce
Texas State Health Plan 2011-2016 19
Health Professional Shortage Areas (HPSAs)
The designation of a county as a Health Professional Shortage Area for primary medical care,
dental care, or mental health care indicates that the county has an inadequate number of specific
health providers to serve the population in the county. There are several categories of HPSA
designations: whole county, sub-county, facility, or special population. The Texas Primary Care
Office administers the federal HPSA program for Texas in collaboration with the Shortage
Designation Branch, Health Resources and Services Administration, Bureau of Health
Professions, U.S. Department of Health and Human Services. Lists of designated areas can be
found at http://www.dshs.state.tx.us/CHS/hprc/hpsa.shtm. Detailed information about HPSA
designations is presented for primary care physicians, dentists, and psychiatrists in this chapter.

Demographic Review of the Texas Health Professions Workforce
Texas State Health Plan 2011-2016 20
Figure 2.1 Border and Metropolitan Counties in Texas, 2009.
Hi ll
Harris
Bell
Polk
Kerr
Cl ay
Irion
Hall
Bee
Elli s
Leon
Bexar
Hale
King
Gaines
Dall am
Erath
Upton
Hart ley
KentJack
GrayOldham
Tyl er
Cass
Kimble
LynnHunt
Rusk
Wise
FloydLamb
Coke
LeeLi berty
Brazoria
Ll ano
Terry
Milam
Travis
Andrews
Mills
Knox
Ector
Smi th
Falls
Jones
Coll in
Bowie
Nolan
Potter
Burnet
Cottle
WardCoryell
Brown
Taylor
Houston
Young
Lamar
Reagan
Martin
Dall as
Moore
Fisher
Coleman
Jasper
Baylor
Castro
Parker
Cooke
Navarro
Goliad
Atascosa
Donley
Lavaca
Bosque
Hays
Deaf Smi th
Concho
Crosby
Fayette
Schleicher
Wharton
Gillespie
Newton
Foard
Haskell
Borden
De Witt
Shelby
Victoria
Li ve Oak
Briscoe
Panola
Trinity
Wood
Grayson
Roberts
San Saba
Hockley
Gonzales
Anderson
Grim
es
Winkler
Wheeler
Walker
Harrison
Nueces
Eastland
Matagorda
Kleberg
Austin
Jef ferson
Sherm an
Ochiltre e
Wilbarge r
Refugio
Bandera
Hopkins
Limes tone
Glass-cock
Sabine
Wa lle r
Hood
Chil d-ress
Marion
Orange
Franklin
Galveston
Aran
sas
Medina
Motl ey
Garza
Archer
Scurry
Tom Green
Hardin
Mason
Crane
Fannin
Bailey
Denton
Carson
Runnels
Tarrant
Sterling
Wilson
Randall
Parmer
Menard
MitchellHoward
Midland
Bastrop
Di ckens
Swisher
Dawson
Colorado
Cherokee
Lubbock
Karnes
Hemp-hi ll
Red Ri ver
Blanco
Willi amson
McCull och
Jackson
McLennan
Call ahan
Loving
Hansfor d
Angelina
Stephens
Montague
Lip scom b
Stone-wall
Yoakum
Palo Pinto
Hamilton
Cochr an
Fort Bend
Kaufman
Montgomery
Freestone
Jim W
ells
Comal
Arm-strong
Kendall
Comanche
Johnson
Brazos
Henderson
Titus
Van Zandt
Robert-son
Upshur
Wichita
Hutchi n-son
Burleson
Shackel-ford
Nacog-doches
Coll ings-worth
Lampasas
Harde-man
Throck-morton
Guad-al upe
CaldwellChambers
San Patricio
Madison
Delta
Wash-ington
San Jacinto
Calhoun
Rains
Gregg
Morris
San Augustine
Camp
Somer
vell
Rockwall
Pecos
Brewster
Webb
Hudspeth
Presi dio Terrell
Culberson
Reeves
Crockett
Val Verde
Duval
Frio
Starr
Edwards
Jeff Davis
Uvalde
Sutton
Hi dal go
Kinney
Zaval a
Di mmi t
Kenedy
La Sal le
Zapata
Real
Maverick
Brooks
El Paso
McMullen
Cameron
Willacy
Jim Hogg
Non-metropolitan (Rural)Metropolitan (Urban)
Border Counties (32)
2009 Population Statistics: 222 Non-Border Counties — 89.6 percent of total Texas Population
78.6 percent in metropolitan non-border counties 11.0 percent in non-metropolitan non-border counties
32 Border Counties — 10.4 percent of total Texas Population
8.8 percent in metropolitan border counties 1.5 percent in non-metropolitan border counties Prepared by: Health Professions Resource Center, Center for Health Statistics, Texas Department of State Health Services, October 20, 2009

Demographic Review of the Texas Health Professions Workforce
Texas State Health Plan 2011-2016 21
MEDICAL PROFESSIONS
• Physicians o Direct patient care (DPC) o Primary care (PC) o Internal medicine o Pediatrics o Family practice/medicine o Obstetrics and Gynecology (Ob/Gyn) o Psychiatry — included in the section on Mental Health Professions
• Physician Assistants • Chiropractors • Podiatrists
DPC Physicians
The term DPC physician includes both allopathic and osteopathic physicians who are licensed by
the Texas Medical Board (TMB), but excludes physicians with a practice type of medical
teaching, administration, research, or “not-in-practice.” Other physicians who are excluded from
the supply of DPC physicians in this report are those physicians who are affiliated with the
federal government — including the armed forces, the Department of Veterans Affairs, or the
U.S. Public Health Service — and fellows or residents in training.
The supply of DPC physicians increased between 2000 and 2009 by an average of 845 per year.
In August 2009, there were 39,374 DPC physicians actively practicing in Texas. However, over
the years, Texas has consistently lagged behind the U.S. average in the ratio of DPC physician
supply per 100,000 population, and the gap between the two appears to be increasing (Figure
2.2). The DPC physician supply ratios in Texas were fairly constant between 1981 and 1996. In
1997, the ratios for both metropolitan and non-metropolitan counties began to increase; however,
they began to stabilize and decrease slightly after 2003 (Figure 2.3). Non-metropolitan counties
in Texas have had much smaller supply ratios than metropolitan counties throughout these two
decades. Since 2006 the non-metropolitan ratios have been increasing, while the metropolitan
ratios have stayed relatively flat.

Demographic Review of the Texas Health Professions Workforce
Texas State Health Plan 2011-2016 22
In 2009, there were 25 counties with no DPC physicians; and, there were three counties that did
not have a DPC physician in 2000, but had at least one in 2009. DPC ratios decreased in 135
counties between 2000 and 2009. In general, the counties with the highest ratios were those in
Central or East Texas. The counties with lower ratios were generally located in West Texas,
South Texas, and the Panhandle. Almost all of the counties with no DPC physicians were in
these areas. The median age of DPC physicians was 49 years in 2009, compared with 48 years
in 2000.
Figure 2.2 DPC Physicians per 100,000 Population: U.S. and Texas, 1981 to 2009.
120
140
160
180
200
220
240
1981 1983 1985 1987 1989 1991 1993 1995 1997 1999 2001 2003 2005 2007 2009
DPC
Phy
sici
ans
per
100,
000
Popu
latio
n
Texas DPC PhysiciansUS DPC Physicians
Note: Texas Figures include all licensed, active, in-state, non-federal, non-resident in training DPC physicians. Older US data may include federal workers, or other workers that the Texas data do not include. The 2008 data for the US is based on the same parameters as the Texas data. Therefore, the decrease in the US supply ratio may be due to a difference in the method of data collection rather than an actual decrease, and the 2008 data is more directly comparable to the Texas data than are the older data. But this new data confirms that the Texas supply ratios are below the US average.

Demographic Review of the Texas Health Professions Workforce
Texas State Health Plan 2011-2016 23
Figure 2.3 DPC Physicians per 100,000 Population, Metropolitan and Non-Metropolitan Counties, Texas, 1981–2009
20
40
60
80
100
120
140
160
180
1981 1983 1985 1987 1989 1991 1993 1995 1997 1999 2001 2003 2005 2007 2009
DPC
Phy
sici
ans
per
100,
000
Popu
latio
n
Non-MetropolitanMetropolitan
Table 2.1: 2009 Texas Direct Patient Care Physician Facts: White 64.2% Male 73.7% Median Age Male 52 Black 4.6% Female 26.3% Median Age Female 44 Hispanic 11.6% Other 2.8% Unknown 16.8% Providers/100,000 Population Border Metropolitan 106.8 Non-Border Metropolitan 175.6 Border Non-Metropolitan 50.6 Non-Border Non-Metropolitan 90.8 Trends: Year Number Providers/100,000 Population 1990 22,711 133.7 1995 25,683 137.2 2000 31,769 156.2 2005 35,811 155.7 2009 39,374 158.3

Demographic Review of the Texas Health Professions Workforce
Texas State Health Plan 2011-2016 24
DPC Specialists
In the past, this report has included information for Direct Patient Care Physicians and a subset
of those, Primary Care Physicians. The remainder of the Direct Patient Care Physician
workforce – specialists – has not received the same attention in most analyses as Primary Care
Physicians, but they also play an important role in healthcare in Texas. Table 2.2 shows the
numbers and supply ratios for specialists in Texas in 2009. Until the last few years, the Texas
Medical Board (TMB) has used 79 specific categories for physician specialties; recently
however, it appears that TMB has been accepting any specialty that a physician enters when
renewing a license. Therefore, the number of distinct specialty categories has increased to 265 in
2009. This has complicated the data analyses performed by HPRC, as some of the entries are
combinations of different specialties (i.e. Sports Medicine – Family Practice), making it difficult
in some cases to determine if a physician should be considered to be a Primary Care physician.
To demonstrate the proliferation of specialty categories, there were nine different categories for
Sports Medicine, covering a total of 40 Sports Medicine specialists. For Table 2.2, HPRC
aggregated the professions into a smaller set.
Table 2.2: Direct Patient Care Specialists, Texas, 2009
Specialty Number Ratio per 100,000 Population
Other Internal Medicine Subspecialties 2,935 11.8 Anesthesiology 2,641 10.6 Radiology 2,082 8.4 Emergency Medicine 1,782 7.2 Psychiatry/Psychoanalysis 1,654 6.6 General Surgery 1,604 6.4 Orthopedic Surgery 1,399 5.6 Cardiovascular Diseases 1,214 4.9 Ophthalmology 977 3.9 Pathology 902 3.6 Neurology 651 2.6 Otolaryngology 561 2.3 Urology 542 2.2 Geriatric Medicine 10 0.0 Other Specialties 1,872 7.5 Other Surgical Specialties 1,723 6.9 TOTAL SPECIALISTS 22,549 90.7

Demographic Review of the Texas Health Professions Workforce
Texas State Health Plan 2011-2016 25
PC Physicians
The term PC physician includes physicians who are trained in one of six specialties of the more
than 70+ specialties included under the umbrella of DPC — family practice/family medicine,
general practice, internal medicine, obstetrics and/or gynecology, general pediatrics, and
geriatrics. Geriatrics was included as a primary care specialty starting in 2004, at the request of
the Bureau of Shortage Designation’s HPSA program. Of the 39,374 DPC physicians in Texas
in 2009, 16,830 were PC physicians, an increase of 18 percent over the number practicing in
Texas in 2000. In 2009, 12.6 percent of the almost 25 million Texans were located in the 177
non-metropolitan counties and 87.4 percent in the 77 metropolitan counties. By comparison, only
9.7 percent of the PC physicians were practicing in non-metropolitan counties and 90.3 percent
in metropolitan counties. Twenty-six of the state’s 254 counties had no PC physicians in 2009
and 21 counties had only one PC physician.
Sources of PC physicians
In 2009, less than one-half (46.8 percent) of the PC physicians practicing in Texas were trained
in Texas schools. Supplementing this pool of Texas medical graduates were PC physicians who
received their training in other states (25.7 percent) or other countries (27.5 percent). Due to the
size of this in-migrating PC physician supply, this external source of physicians is very important
to the health care delivery system in Texas.
Supply trends
The PC physician supply increased by an average of 285 physicians per year between 2000 and
2009. Although the state’s population also increased during this time, the PC physician ratios
remained in the range of 67 to 71. Compared to a national benchmark ratio of 60 to 80, Texas
remained in the lower range of the national benchmark; in 1996, Texas was even below the
federal benchmark with a ratio of 59. The supply of PC physicians could be even more marginal
since some of the physicians listed in the 2009 database practice only part-time. The total
number of PC physicians available to some population groups could also be lower than the
supply totals would suggest because some PC physicians limit their practices to paying or

Demographic Review of the Texas Health Professions Workforce
Texas State Health Plan 2011-2016 26
insured patients and others do not accept Medicaid patients. Thus, in some areas of the state, the
“effective” physician supply is probably less than simple supply ratios would seem to indicate.
The PC physician average supply ratios in the U.S. (79.0 in 2000) have consistently exceeded the
supply ratios in Texas (69.7 in 2000) for the past 20 years (Figure 2.4). Several years ago, the
gap between the U.S. and Texas ratios began to widen, apparently due to stabilization in the
Texas supply ratios.
The ratios in metropolitan and non-metropolitan counties were fairly constant between 1983 and
1996, with the non-metropolitan ratios being considerably smaller than the metropolitan ratios
(Figure 2.5). Beginning in 1997, the ratios in both areas began to increase; however, the ratios in
both the metropolitan counties and non-metropolitan counties appeared to stabilize about eight
years ago. In 2009, 27 counties had no PC physicians. Eight counties that did not have a PC
physician in 2000 had at least one in 2009. In general, the lowest supply ratios were associated
with the 32 border counties, West Texas, and the Panhandle. Almost all of the counties with no
PC physicians were in these areas, especially the Panhandle. The highest ratios were in Central
or East Texas.
Figure 2.4 PC Physicians per 100,000 Population: U.S. and Texas, 1981–2009
40
45
50
55
60
65
70
75
80
85
1981 1983 1985 1987 1989 1991 1993 1995 1997 1999 2001 2003 2005 2007 2009
PC P
hysi
cian
s pe
r 10
0,00
0 Po
pula
tion
Texas PC PhysiciansU.S. PC Physicians

Demographic Review of the Texas Health Professions Workforce
Texas State Health Plan 2011-2016 27
Figure 2.5 PC Physicians per 100,000 Population, Metropolitan and Non-Metropolitan
Counties, Texas, 1981–2009
able 2.3: 2009 Texas Primary Care Physician Facts:
30
35
40
45
50
55
60
65
70
75
80
1981 1983 1985 1987 1989 1991 1993 1995 1997 1999 2001 2003 2005 2007 2009
PC P
hysi
cian
s pe
r 100
,000
Pop
ulat
ion
Non-Metropolitan
Metropolitan
T
Providers/100,000 Population order Metropolitan
itan
itan
B 51.4 Non-Border Metropol 71.9 Border Non-Metropolitan 35.5 Non-Border Non-Metropol 54.7
rends:T
ear Number Providers/100,000 PopulationY
ocation
re were fewer PC physicians per 100,000 people in non-metropolitan counties than in
1990 10,308 60.7 1995 10,763 57.5 2000 14,268 70.1 2005 15,718 68.3 2009 16,830 67.7 L
In 2009, the
metropolitan counties. The ratio of 52.4 PC physicians per 100,000 population in non-
metropolitan locations was well below the national benchmark of 60 to 80; however, the ratio in
metropolitan areas (69.9) was in the mid-range of the national benchmark. This difference
between metropolitan and non-metropolitan locations has been observed for years in Texas. The

Demographic Review of the Texas Health Professions Workforce
Texas State Health Plan 2011-2016 28
supply ratio also varied between border (49.0) and non-border areas (69.8), and very low PC
physician supply ratios were observed in non-metropolitan non-border (54.7) and non-
metropolitan border (35.5) locations (See Table 2.3).
Practice settings
nt of the PC physicians were employed in solo practices, 32.8 percent in
rimary care specialties
irect Care Physicians were primary care physicians, and 55 percent
In 2009, 25.5 perce
partnership or group practices, 9.8 percent in hospitals, and 0.5 percent in Health Maintenance
Organizations (HMOs). A small number of PC physicians (4.6 percent) did not report their
practice settings. Additional categories were added to the Practice Setting and Practice Type
fields by the Texas Medical Board in 2007. A physician can now choose a Practice Type of
Direct Patient Care and a Practice Setting of Direct Medical Care. Almost 25% of the physicians
chose those categories, which may be why the percentages for solo practices, partnership/group
practices, hospitals and HMOs decreased from two years ago. In addition, a physician can now
choose a combination of Direct Patient/Medical Care and research or faculty; in the past, if a
physician chose research or faculty they were not considered Direct Patient Care and not
included in HPRC’s data. Less than 2% of physicians fell into this category. Almost 1%
selected “Other” for Practice Setting.
P
In 1991, 45 percent of the D
were non-primary care specialists. In 2009, the ratio was 42.7 percent primary care to 57.3
percent specialists. Three-fourths of the PC physicians in non-metropolitan counties were either
family practice/medicine physicians (53.2 percent) or internal medicine physicians (21.5
percent). However, in metropolitan counties, two-thirds of the PC physicians were trained in
family practice/medicine (33.0 percent) or internal medicine (29.7 percent). See Table 2.4 for
more information.

Demographic Review of the Texas Health Professions Workforce
Texas State Health Plan 2011-2016 29
Table 2.4 PC Physicians by Primary Specialty and Practice Location, Texas, 2009
PC Physicians by Specialty
2009 PC Physicians Total
% % Non-Metropolitan Metropolitan
Family Practice/Medicine 5,880 85.2 14.8 General Practice 703 82.1 17.9 Internal Medicine 4,866 92.8 7.2 General Pediatrics 3,028 95.1 4.9 Obstetrics and Gynecology 2,314 94.2 5.8 Geriatrics 39 92.3 7.7 Total Primary Care 16,830 90.3 9.7
ge edian age of PC physicians in 2009 was 49 years; in 2000 it was 46. Female physicians
e
ender
77.7 percent of the PC physicians were male; however, that percentage has steadily
ale and female PC physicians also vary in their choice of a medical specialty. For example, a
), are
AThe m
tend to be younger, with a median age of 43, than male physicians, with a median age of 52. Th
ages of PC physicians also differed based on whether the physicians were practicing in non-
metropolitan or metropolitan counties. The median age for PC physicians in metropolitan
counties was 48 years, and in non-metropolitan counties, 52 years. The median age for PC
physicians in the border counties was 49 years, and non-border counties, 48 years.
G
In 1997,
decreased to 66.1 percent in 2007. In 2009, 37.7 percent of the PC physicians in metropolitan
counties and 36.9 percent in the non-border counties were female. However, only 20.2 percent of
the PC physicians in non-metropolitan counties and 25.8 percent in border counties were female.
M
greater percentage of female PC physicians report pediatrics as their primary specialty (27.6
percent) than do male PC physicians (12.5 percent) (Table 2.5). The two most prevalent
specialties in non-metropolitan counties, family practice and internal medicine (Table 2.4
not as well represented among female PC physicians (64.7 percent of females are practicing in
these two specialties) as among male PC physicians (77.3 percent).

Demographic Review of the Texas Health Professions Workforce
Texas State Health Plan 2011-2016 30
Table 2.5 PC Physicians by Primary Specialty and Gender, Texas, 2009
Physicians by Specialty 2009 PC Physician Total % Male % Female Family Practice/Medicine 5,879 38.0 29.5 General Practice 703 5.4 1.9 Internal Medicine 4,862 31.4 24.5 General Pediatrics 3,026 12.5 27.6 Obstetrics and Gynecology 2,313 12.4 16.1 Geriatrics 39 0.2 0.4 Total 16,822 100.0 100.0
udes those records that did not ds)
ace-Ethnicity
sing boards started collecting data in the new Minimum Data Set format. There
able 2.6 Race and Ethnicity Trends for PC Physicians, Texas, 1999 and 2009
N
ote: Excl report Gender (8 recor
R
In 2009, the licen
was a change in the racial/ethnic categories. During this first year of implementation, complete
data have not yet been collected for all licensees under the Minimum Data Set; therefore, the
number of “Unknowns” was significantly higher than in previous years, which may slightly skew
the racial and ethnic data for 2009. It is likely that most of the Unknown values are for Asian
and Pacific Islanders and should fall in the Other category. In 2009, the majority (58.2 percent)
of the state’s PC physicians were white, down from 65.2 percent in 2000 (Table 2.6). Although
over a decade ago Hispanics made up the largest minority population of PC physicians, Asian–
Pacific Islanders were the largest by 1997, and the gap between the two has continued to grow.
Blacks and Hispanics have historically been under-represented in the PC physician workforce,
compared to the general population.
T
2000 2009
Race/Ethnicity
PC Physicians (%)
Population (%) PC Population Physicians (%) (%)
White 65.2 53.1 58.2 45.9 Black 4.5 11.6 6.1 11.6 Hispanic 12.6 32.0 14.4 38.1 Other 15.9 3.3 3.0 4.4 Unknown 1.8 - 18.4 -

Demographic Review of the Texas Health Professions Workforce
Texas State Health Plan 2011-2016 31
Internal Medicine (IM)
Figure 2.6, the supply of IM physicians in Texas is separated into Doctor of Osteopathy (DO)
igure 2.6 Internal Medicine Physicians per 100,000 Population, U.S. and Texas, 1985–
amily Practice/Medicine (FP)
he Texas Medical Association reports that in Texas, physicians are beginning to use the term
In
and Medical Doctor (MD) trend lines because national data were not available for DOs. As
shown in the graph, the IM supply ratios for MDs in Texas have been lower than the U.S.
average ratios for the past two decades. The ratios for Dos have remained stationary. The
median age for IM physicians was 47 years in 2009, compared with 45 in 2000.
F
2009
0
5
10
15
20
25
30
35
40
1985 1987 1989 1991 1993 1995 1997 1999 2001 2003 2005 2007 2009
IM P
hysi
cian
s pe
r 100
,000
Pop
ulat
ion
Texas IM Physicians (MD)
Texas IM Physicians (DO)
U.S. IM Physicians (MD)
F
T
“family medicine” rather than “family practice.” As both terms are currently in use, these data
reflect those physicians who indicated either as their primary specialty. In Figure 2.7, the supply
of FP physicians in Texas is separated into DO and MD trend lines because national data were
not available for DOs. Prior to 1992, the FP ratios in the United States and Texas were about the
same; however, after 1992, the gap between the U.S. average ratios and the Texas ratios for FP
physicians widened, with the Texas ratios consistently falling behind the U.S. ratios in

Demographic Review of the Texas Health Professions Workforce
Texas State Health Plan 2011-2016 32
magnitude. The FP ratios for MDs have increased about the same as the ratios for DOs. The
median age for FP physicians was 49 years in 2009, compared with 46 years in 2000.
Figure 2.7 Family Practice Physicians per 100,000 Population, U.S. and Texas, 1985–2009
ediatrics (PD)
Figure 2.8, the supply of PD physicians in Texas is separated into DO and MD trend lines
0
5
10
15
20
1985 1987 1989 1991 1993 1995 1997 1999 2001 2003 2005 2007 2009
FP P
hysi
cian
s pe
r 100
,000
Pop
ulat
ion
25
Texas FP Physicians (MD)Texas FP Physicians (DO)U.S. FP Physicians (MD)
P
In
because national data were not available for DOs. The PD supply ratios for MDs in Texas per
100,000 children have been lower than the U.S. average ratios for the past two decades, but have
been increasing since the mid-’90s. The PD supply ratios for DOs have remained fairly constant.
The median age for PD physicians was 47 in 2009, compared with 45 in 2000.

Demographic Review of the Texas Health Professions Workforce
Texas State Health Plan 2011-2016 33
Figure 2.8 PD Physicians per 100,000 Children (0–18 years), U.S. and Texas, 1985–2009
bstetrics and Gynecology (Ob/Gyn)
hysicians may have a specialty of Gynecology only, Obstetrics only, or Obstetrics and
70
0
10
20
30
40
50
60
1985 1987 1989 1991 1993 1995 1997 1999 2001 2003 2005 2007 2009
PD P
hysi
cian
s pe
r 10
0,00
0 C
hild
ren*
Texas Pediatricians (MD)Texas Pediatricians (DO)U.S. Pediatricians (MD)
O
P
Gynecology. The data in this report reflect the total of those three specialties. In Figure 2.9, the
supply of Ob/Gyns in Texas is separated into DO and MD trend lines to be consistent with
previous graphs for FP, IM, and PD physicians. However, national Ob/Gyn supply ratio trends
were not available for this graph, although the national ratio in 2004 was 62.5. Ob/Gyn supply
ratios for MDs have decreased slightly recently after increasing for the past two decades, but the
ratios for DOs have remained fairly constant. The median age for Ob/Gyns was 50 years in
2009, compared with 48 in 2000.

Demographic Review of the Texas Health Professions Workforce
Texas State Health Plan 2011-2016 34
Figure 2.9 Ob/Gyn Physicians per 100,000 Females Ages 15–44, Texas, 1985–2009
HYSICIANS FOR TEXAS
e Health Plans have consistently called attention to a shortfall in
hysician supply and a geographic mal-distribution in the state. While statistical indicators
is that for the past five years, Texas has been adding the largest number of
ew physicians to its workforce than any time in recent history. Almost 18,000 new physicians,
gains in physician supply, however, did not change the status of Texas as a
ate with a relatively low ratio of physicians to population in comparison to other states, ranking
70
s
0
10
20
30
40
50
60
1985 1987 1989 1991 1993 1995 1997 1999 2001 2003 2005 2007 2009
ObG
yns
per
100,
000
Fem
ale U.S. ObGyn (MD)
Texas ObGyn (MD)Texas ObGyn (DO)
Age
s 15
-44
P
With few exceptions, prior Stat
p
doggedly point to a continuation of these trends, there are several areas of improvement that are
equally noteworthy.
Part of the good news
n
an average of 3,000 a year, were added over the past six years. This six-year average is 25
percent higher than the 2,300 new physicians added each year, on average, during the previous
six years. The other good news is that the robust gains in new physicians allowed the state’s
ratio of physicians to population to remain stable despite the fact that Texas led the country in
population growth.
The historically high
st
Texas 42nd in the country. Had the state not seen such large population increases, the recent
physician gains would have lifted Texas to a higher state ranking. Texas ranks below U.S.

Demographic Review of the Texas Health Professions Workforce
Texas State Health Plan 2011-2016 35
averages for physician to population ratios for 38 out of 40 specialty groups. The only
specialties above the national averages are aerospace medicine (due to the strong presence of
NASA and airline hubs in the state), and colon/rectal surgery (for reasons that are not obvious).
Texas legislators and medical schools have responded to the growing physician demand by
rapidly expanding enrollments at levels projected to reach the nationally-recommended 30
xpanded their rural physician training tracks and rural
receptor programs to prepare more physicians for rural practice. Medical schools are also
ealth Plan continues to sound a cautionary tone on the
dequacy of the state’s physician workforce, positive overtones are also evident and bear further
cian ratios are the primary indicators used by the U.S. Department of Health and
uman Services to determine if geographic areas or population groups are experiencing
percent growth by 2015. The expansion of residency training positions, however, has lagged
behind and there are growing concerns whether graduate medical education (GME) can be
expanded quickly enough to accommodate the extra graduates now in the pipeline. Without
parallel increases in GME, these graduates will likely be lost to other states, given the well –
established pattern of physicians typically entering practice within 100 miles of where they train.
The challenge of meeting the physician supply needs of Texans living in the vast rural and
border regions of the state was a priority for Texas legislators in 2009. Bold steps were taken to
broadly expand the state’s Physician Education Repayment Program by nearly quadrupling the
maximum repayment amount to $160,000, and increasing potential program participants by more
than 200 percent. Texas legislators also provided funds for loan repayment to physicians with
defined numbers of Medicaid patients.
Several Texas medical schools have e
p
evaluating the potential for shortening the training period for family physicians in order to better
meet the state’s primary care needs.
While this iteration of the State H
a
monitoring in the educating, training, recruitment, and retention of physicians for Texas.
HPSAs
PC physi
H

Demographic Review of the Texas Health Professions Workforce
Texas State Health Plan 2011-2016 36
shortages of PC physicians and if they qualify as federal shortage areas. In October 2009, 74.4
percent of the counties in Texas had either whole (118) or partial-county/special population (71)
HPSA designations (Figure 2.10). Fifty-one percent of the non-metropolitan counties had
“whole county” HPSA designations, and 65.6 percent of the border counties had whole county
designations. Seventy-six percent of the 118 “whole county” HPSAs were non-metropolitan
counties, and 17.8 percent were border counties. Most of the partial-county HPSA designations
were located in metropolitan counties. In addition to these designations, the HPSA designation
program also provides for the designation of facilities under certain circumstances. It should be
noted that many of these federally designated PC physician shortage areas are also experiencing
shortages of other health professionals, such as nurses, allied health professionals, and mental
health providers.

Demographic Review of the Texas Health Professions Workforce
Texas State Health Plan 2011-2016 37
Figure 2.10 Federally Designated Primary Care Health Professional Shortage Areas in
Texas, October 2009
Designation StatusNot DesignatedSpecial Population DesignationPartial County DesignationWhole County Designation
Prepared by: Health Professions Resource Center, Center for Health Statistics, Texas Department of State Health Services Data Source: Shortage Designation Branch, United States Department of Health and Human Services, October 2009
Physician Assistants (PAs)
According to the 2009 TMB licensure data, there were 4,563 Pas licensed to practice in Texas;
90.6 percent of them practiced in metropolitan counties; 8.7 percent practiced in border counties.
The supply ratios of Pas per 100,000 population for the United States have been consistently
higher than the ratios for Texas (for example, 14.1 vs. 10.4 respectively, in 2000). Both the U.S.
and Texas ratios have been rising at a comparable rate (Figure 2.11). The ratios for the non-
metropolitan areas were higher than those for the metropolitan areas from 1994 to 2002 (Figure
2.12); however, the metropolitan areas have sustained a steady increase since that time while the

Demographic Review of the Texas Health Professions Workforce
Texas State Health Plan 2011-2016 38
ratios for the non-metropolitan areas have fluctuated. In 2003, the ratios for the metropolitan
areas surpassed those of the non-metropolitan areas.
Twenty-five counties that did not have a PA in 2000 had one or more in 2009. In 2009, there
were 63 counties with no PAs. The counties with the highest supply ratios were in West Texas
and the Panhandle, as were most of the counties that had no PAs. Over the past decade, most of
the counties with the greatest percent of increase in supply ratios have been in West Texas,
Central Texas, and the Panhandle. Eighty-seven counties experienced a decrease in their supply
ratios during that time, and 21 counties that had at least one PA in 2000 did not have any in
2009. In contrast with physicians, the average ratios in the border and non-border counties were
similar to each other (Table 6).
Figure 2.11 Physician Assistants per 100,000 Population, U.S. and Texas, 1989–2009
0
5
10
15
20
25
30
1989 1991 1993 1995 1997 1999 2001 2003 2005 2007 2009
Phys
icia
n A
ssis
tant
s pe
r 10
0,00
0Po
pula
tion
Texas PAsU.S. PAs

Demographic Review of the Texas Health Professions Workforce
Texas State Health Plan 2011-2016 39
Figure 2.12 Physician Assistants per 100,000 Population, Metropolitan and Non-Metropolitan Counties, Texas, 1989–2009
02468
101214161820
1989 1991 1993 1995 1997 1999 2001 2003 2005 2007 2009
Phys
icia
n A
ssis
tant
s pe
r 100
,000
Pop
ulat
ion Non-Metropolitan
Metropolitan
Age, gender, and race-ethnicity
In 2009, 70.5 percent of the PAs were white, followed by Hispanic PAs at 14.9 percent of the
total (Table 2.7). There were substantially more female PAs than male PAs in 2009, a reversal
from 2000, when males slightly outnumbered females, 50.4 percent to 49.6 percent, respectively.
The median age of Pas in the state in 2009 was 39 years, down from 41 years in 2000. The
median age of Pas in non-metropolitan counties was several years greater than the median age of
Pas in metropolitan counties (47 years versus 39 years, respectively). The median age of PAs in
border counties was 38 years, 2 years less than that of PAs in non-border counties. A disparity in
age and gender exists among PAs based on their practice location: 61.1 percent of the Pas in
metropolitan counties were female, but only 45.9 percent in non-metropolitan counties were
female. In the border counties, 50.3 percent of the PAs were female, compared to 60.6 percent in
the non-border counties.
Educational Preparation
The number one professional issue that was discussed and voted upon at the Physician Assistant
national meeting in Portland, Oregon (November 4-8, 2009) is the clinical degree to offer. The
Physician Assistant Educational Association (PAEA) voted in Portland to designate the master
degree as the entry-level and terminal degree for the PA profession. The PAEA are opposed to

Demographic Review of the Texas Health Professions Workforce
Texas State Health Plan 2011-2016 40
the PA Clinical Doctorate for physician assistants. The current national stance by the PA
educators is total opposition to any clinical doctorate degree with PA in the name.
Faculty Shortages
The second national and local Texas issue is the difficulty in finding and recruiting the needed
PA faculty to run the PA Programs effectively. Because of the competition of the higher clinical
PA graduate salaries it is very difficult to recruit the needed PA faculty. Almost every PA
Program in the State of Texas is in the need of one or more faculty. There is difficulty in finding
and hiring faculty candidates who hold the Master’s and Doctoral degrees needed to teach as
well as those who have had previous teaching experience.
State Funding
The third issue facing the national and Texas PA Programs is the needed formula funding to
support graduate education. The Nurse Practitioner profession gets one and a half times more
support for formula funding in Texas without any clear rationale for the difference. It is a
difficult issue, but it appears that because of the nursing shortage there are increased grants and
state funding to support Nurse Practitioner graduate education endeavors. The PA programs are
located in the Schools of Health Professions that receive the floor of the formula funding for the
health professions.

Demographic Review of the Texas Health Professions Workforce
Texas State Health Plan 2011-2016 41
Table 2.7: 2009 Texas Physician Assistant Facts: White 70.5% Male 40.3% Median Age Male 46 Black 6.1% Female 59.7% Median Age Female 36 Hispanic 14.9% Other 3.8% Unknown 4.8% Providers/100,000 Population Border Metropolitan 15.4 Non-Border Metropolitan 19.4 Border Non-Metropolitan 15.9 Non-Border Non-Metropolitan 13.4 Trends: Year Number Providers/100,000 Population 1991 622 3.6 1995 1,052 5.6 2000 2,106 10.4 2005 3,375 14.7 2009 4,563 18.3
Chiropractors
There were 4,592 chiropractors in Texas in 2009. The supply ratio of chiropractors per 100,000
population in the US has consistently exceeded the supply ratios in Texas (Figure 2.13). And,
prior to the late 1980s, the ratio was higher in non-metropolitan counties than in metropolitan
counties (Figure 2.14). Since that time, the ratios for chiropractors in metropolitan counties have
greatly increased and have exceeded the rates for non-metropolitan counties. In 2009, there were
70 counties in the state that did not have a chiropractor. Fifteen counties that did not have a
chiropractor in 2000 had at least one in 2009. However, ten counties that had chiropractors in
2000 had no chiropractors in 2009. The highest supply ratios were concentrated in the central
part of the state, and also around Dallas and Houston, although a few counties in West Texas
also had high ratios. The ratios in the non-metropolitan areas have held fairly steady for more
than the last two decades, while the ratios in the metropolitan areas rose steadily until about
2003; they have remained relatively flat since then. Data on race/ethnicity were not available.

Demographic Review of the Texas Health Professions Workforce
Texas State Health Plan 2011-2016 42
Figure 2.13 Chiropractors per 100,000 Population, U.S. and Texas, 1980–2009
0
5
10
15
20
25
30
35
1980 1982 1984 1986 1988 1990 1992 1994 1996 1998 2000 2002 2004 2006 2008
Chi
ropr
acto
rs p
er
100,
000
Pop
ulat
ion
Texas Chiropractors
U.S. Chiropractors
Figure 2.14 Chiropractors per 100,000 Population, Metropolitan and Non-Metropolitan Counties, Texas, 1980–2009
0
5
10
15
20
25
1980 1982 1984 1986 1988 1990 1992 1994 1996 1998 2000 2002 2004 2006 2008
Chi
ropr
ator
s p
er 1
00,0
00 P
opul
atio
n
Non-Metropolitan
Metropolitan

Demographic Review of the Texas Health Professions Workforce
Texas State Health Plan 2011-2016 43
Table 2.8: 2009 Texas Chiropractor Facts: Male 76.1% Median Age Male 43 Female 23.9% Median Age Female 40 Providers/100,000 Population Border Metropolitan 8.1 Non-Border Metropolitan 20.8 Border Non-Metropolitan 4.4 Non-Border Non-Metropolitan 12.0 Trends: Year Number Providers/100,000 Population 1990 1,972 11.6 1994 2,325 12.7 2000 3,426 16.8 2005 4,091 17.8 2009 4,592 18.5
Podiatrists
There were 897 podiatrists in Texas in 2009. There are no schools of podiatry in Texas and only
eight accredited schools nationally. That may partially explain why Texas supply ratios are
slightly less than those of the United States. The Texas ratios have held fairly steady over the
last decade (Figure 2.15). The ratios are greater in metropolitan areas than in non-metropolitan
areas (Figure 2.16). The highest concentration of podiatrists is in the Central Texas area, with
smaller ones in the North Texas and Harris County areas. These areas also experienced the most
growth from 2000 to 2009. There are very few podiatrists in West Texas, South Texas, and the
Panhandle, and, from 2000 to 2009, the few counties in these areas that had podiatrists
experienced a decline in ratios, or lost all of their podiatrists. The non-metropolitan border
counties have higher average ratios than the non-metropolitan non-border counties. Twenty
counties that did not have a podiatrist in 2000 had one in 2009, while nine counties lost all of
their podiatrists over that time. In 2009, Texas had 167 counties without a podiatrist. The
median age for podiatrists was 45 years in 2009, compared to 44 years in 2000. Limited race
information is available but isn’t reported here because race was Unknown for 42% of the

Demographic Review of the Texas Health Professions Workforce
Texas State Health Plan 2011-2016 44
Podiatrists, and the board collected race only and not ethnicity so no information is available for
Hispanics.
Figure 2.15 Podiatrists per 100,000 Population, U.S. and Texas, 1981–2009
0
2
4
6
8
10
1981 1983 1985 1987 1989 1991 1993 1995 1997 1999 2001 2003 2005 2007 2009
Podi
atris
ts p
er 1
00,0
00 P
opul
atio
n Texas Podiatrists
U.S. Podiatrists
Figure 2.16 Podiatrists per 100,000 Population, Metropolitan and Non-Metropolitan Counties, Texas, 1981–2009
0
1
2
3
4
5
1981 1984 1987 1990 1993 1996 1999 2002 2005 2008
Podi
atris
ts p
er 1
00,0
00 P
opul
atio
n
Non-Metropolitan
Metropolitan

Demographic Review of the Texas Health Professions Workforce
Texas State Health Plan 2011-2016 45
Table 2.9: 2009 Texas Podiatrists Facts: Male 78.7% Median Age Male 47
Providers/100,000 Population order Metropolitan
itan
itan
rends:
Female 21.3% Median Age Female 39 B 2.6 Non-Border Metropol 4.0 Border Non-Metropolitan 1.6 Non-Border Non-Metropol 1.8 T
ation
• Registered Nurses Nurses
ives anesthetists
• Lic
the RNs included in the statistics for this chapter and the Appendix held active licenses
Year Number Providers/100,000 Popul1991 496 2.9 1994 567 3.1 2000 682 3.4 2004 807 3.6 2009 897 3.6 NURSING PROFESSIONS
• Advanced Practice o Nurse practitioners oo Certified Registered nurse
Certified nurse midw
o Clinical nurse specialists ensed Vocational Nurses
Registered Nurses (RNs)
All of
and were employed either part-time or full-time in nursing. Although some RNs were employed
as teachers or administrators and may not provide direct patient care, they were included in the
overall supply totals for Texas RNs.

Demographic Review of the Texas Health Professions Workforce
Texas State Health Plan 2011-2016 46
Supply
According to the Board of Nursing (BON) licensure file for 2009, there were 169,446 active RNs
practicing in Texas — 86.8 percent were employed full-time and 13.2 percent were employed
part-time in nursing. The 169,446 RNs give Texas a supply ratio of 681.2 RNs per 100,000
population. The Texas supply ratios have been below the U.S. supply ratios for years. The
National Sample Survey of Nurses reported a ratio of 824.6 for the U.S. in 2004, compared to a
ratio of 624.5 for Texas that year. The gap between U.S. and Texas ratios has been slightly
increasing in recent years (Figure 2.17).
Metropolitan counties have consistently had a much higher ratio of nurses than the non-
metropolitan counties (Figure 2.18). There were only four counties that did not have an RN in
2009, but those four counties had a combined population of only 2,007 people. Two of those
counties were the only two counties to not have an RN in 2000. Since 2000, 150 of Texas’ 254
counties have seen an increase in the supply ratio of RNs. Although the border counties continue
to have much lower supply ratios than the rest of Texas, the ratios in those counties are
increasing at a rate comparable to the rest of the state.
Figure 2.17 Registered Nurses per 100,000 Population, U.S. and Texas, 1986–2009
350
450
550
650
750
850
950
1986 1988 1990 1992 1994 1996 1998 2000 2002 2004 2006 2008
Reg
iste
red
Nur
ses
per 1
00,0
00
Pop
ula
tion
Texas RNsU.S. RNs
Demographic Review of the Texas Health Professions Workforce
Texas State Health Plan 2011-2016 47
Gender
In 2009, the RN workforce in Texas was predominantly female; only 10.7 percent of the nurses
were male. This represents only a slight increase in the male representation in the RN workforce
from 2000, when 8.4 percent of the RNs were male.
Figure 2.18 Registered Nurses per 100,000 Population, Metropolitan and Non-Metropolitan Counties, Texas, 1986–2009
100
200
300
400
500
600
700
800
1986 1988 1990 1992 1994 1996 1998 2000 2002 2004 2006 2008
Reg
iste
red
Nur
ses
per
100,
000
Pop
ulat
ion
Non-MetropolitanMetropolitan
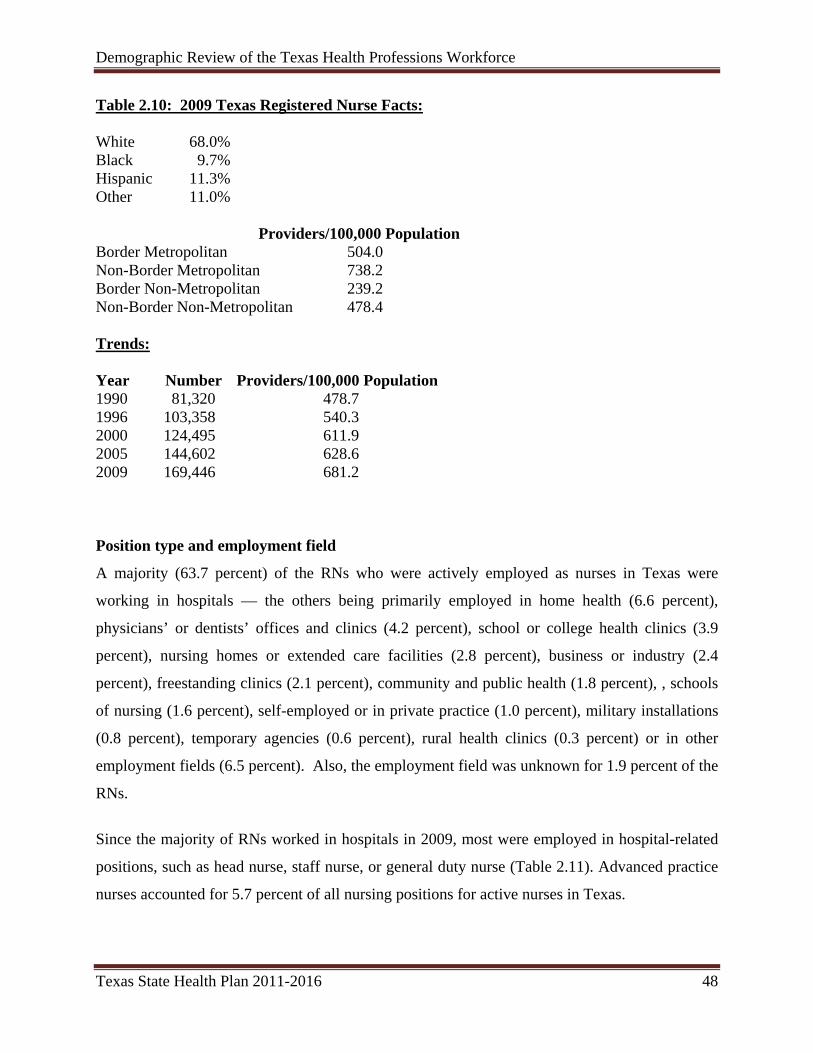
Demographic Review of the Texas Health Professions Workforce
Texas State Health Plan 2011-2016 48
Table 2.10: 2009 Texas Registered Nurse Facts: White 68.0% Black 9.7% Hispanic 11.3% Other 11.0% Providers/100,000 Population Border Metropolitan 504.0 Non-Border Metropolitan 738.2 Border Non-Metropolitan 239.2 Non-Border Non-Metropolitan 478.4 Trends: Year Number Providers/100,000 Population 1990 81,320 478.7 1996 103,358 540.3 2000 124,495 611.9 2005 144,602 628.6 2009 169,446 681.2
Position type and employment field
A majority (63.7 percent) of the RNs who were actively employed as nurses in Texas were
working in hospitals — the others being primarily employed in home health (6.6 percent),
physicians’ or dentists’ offices and clinics (4.2 percent), school or college health clinics (3.9
percent), nursing homes or extended care facilities (2.8 percent), business or industry (2.4
percent), freestanding clinics (2.1 percent), community and public health (1.8 percent), , schools
of nursing (1.6 percent), self-employed or in private practice (1.0 percent), military installations
(0.8 percent), temporary agencies (0.6 percent), rural health clinics (0.3 percent) or in other
employment fields (6.5 percent). Also, the employment field was unknown for 1.9 percent of the
RNs.
Since the majority of RNs worked in hospitals in 2009, most were employed in hospital-related
positions, such as head nurse, staff nurse, or general duty nurse (Table 2.11). Advanced practice
nurses accounted for 5.7 percent of all nursing positions for active nurses in Texas.

Demographic Review of the Texas Health Professions Workforce
Texas State Health Plan 2011-2016 49
Table 2.11 Distribution of actively employed RNs in Texas by position type, 2009
Position Type Number %
Head Nurse, Staff Nurse, General Duty Nurse, or Assistant 108,389 64.0 Administrator/ Supervisory/ Assistant 16,905 10.0 School / Office Nurse 9,651 5.7 Nurse Practitioner 5,745 3.4 Faculty/Educator 3,956 2.3 Consultant 2,416 1.4 Nurse Anesthetist 2,183 1.3 Clinical Nurse Specialist 1,409 0.8 Researcher 1,194 0.7 In-service / Staff Development 982 0.6 Certified Nurse Midwife 276 0.2 Other 12,968 7.7 Unknown 3,372 2.0
Education — basic and highest degrees
In 2009, more than one-third (37.3 percent) of the active RNs listed as their basic degree the
baccalaureate degree in nursing (BSN), 46.9 percent listed associate degree in nursing (I), and
14.8 percent listed diploma in nursing. Other RN degree types (masters in nursing, enroute to
masters, RN undergraduate, and VN/PN program) accounted for 1.0 percent of the RNs, and a
small number of nurses did not give their basic degree. More than one-third listed I as their
highest degree (41.4 percent) followed by the BSN degree (38.9 percent), and the diploma in
nursing (9.4 percent). Only 7.9 percent had a master of science in nursing (MSN) and 0.4
percent had a doctorate in nursing. Some RNs had their highest degree in a field other than
nursing (2.1 percent). However, beginning in March 2008, the data collection for “highest
degree earned” was changed to highest nursing degree earned for online renewal applications;
therefore, 2009 data may not be comparable to data from previous years.
Of those nurses with a basic diploma degree, 17.4 percent had progressed to a BSN, 6.1 percent
to an MSN, and 0.5 percent to a doctorate in nursing. Of those nurses with I as their basic
degree, 9.6 percent progressed to a BSN, 3.5 percent to a MSN, and 0.12 percent to a doctorate
in nursing. By comparison, of those nurses with a BSN as their basic degree, 12.5 percent
advanced to MSN and 0.6 percent advanced to a doctorate in nursing.

Demographic Review of the Texas Health Professions Workforce
Texas State Health Plan 2011-2016 50
Work area
The most common work areas for active RNs in Texas were medical/surgical (14.3 percent),
intensive care/critical care (11.2 percent), operating/recovery care (7.5 percent), and obstetrics
and gynecology (7.3 percent) (Table 2.12).
Table 2.12 Distribution of active RNs in Texas by their work area, 2009.
Work Area Number %
Medical / Surgical 24,298 14.3 Intensive Care / Critical Care 19,029 11.2 Operating / Recovery Care 12,772 7.5 Obstetrics and Gynecology 12,326 7.3 Emergency Care 10,246 6.1 Pediatrics 10,194 6.0 Home Health 9,538 5.6 General Practice 7,341 4.3 Neonatology 6,914 4.1 Geriatrics 5,635 3.3 Oncology 5,096 3.0 Psychiatric / Mental Health / Substance Abuse 4,860 2.9 Community / Public Health 4,694 2.8 Rehabilitation 2,675 1.6 Anesthesia 2,264 1.3 Occupational/Environmental 1,120 0.7 Other 26,327 15.5 Unknown 4,117 2.4
Job satisfaction, retention, and re-entry into nursing
The Regional Center for Health Workforce Studies at the Center for Health Economics and
Policy (CHEP) conducted a research study in 2006 on Registered Nurses (RNs) in Texas. The
following reflects the results of the 2006 CHEP study of 454 RNs on factors that affect retention
and re-entry of nurses in the nursing workforce:
� While 84 percent of the RNs reported general satisfaction with their work, 65.3 percent
reported serious exhaustion and 45 percent reported frustration.
� Almost 36 percent of the RNs reported that, on most days, they often have more work
than they can safely handle.

Demographic Review of the Texas Health Professions Workforce
Texas State Health Plan 2011-2016 51
� A major issue affecting retention and re-entry of nurses in the workforce has to do with
the nursing workload involved in caring for an increasingly aged, severely ill, and obese
patient population along with increasing paperwork and physical and interpersonal
stressors.
� The most frequently reported work environment problems in Texas include:
> The burden of paperwork is increasing (reported by 79 percent of the
responding RNs).
> Increase in the number of patients assigned (72 percent of the responding
RNs). Since 2004, patient workload increased 22 percent.
> Severity of patient illness (63 percents of responding RNs).
> Increase in RN turnover (58 percent of responding RNs).
� Ergonomics, lifting and availability of equipment within the work place continue to be
key issues as it affects comfort, safety, efficiency and productivity. Only 33 percent of
the RNs perceived that they have adequate help with physical demands in the
workplace.
• Respondents in this study indicated that they needed more help from administrators in
managing workload effectively, minimizing perceived harassment (RNs reported more
harassment from patients than from physicians), improving support for patient care, and
providing training for new technologies.1
Aging of the Registered Nurse Workforce
The aging of the RN workforce will have an impact on future nursing workforce trends. RNs
from the “baby boomer” generation entered nursing in large numbers in the 1960s and 1970s and
currently represent the largest cohort of RNs today.
The overall RN workforce in Texas continues to age. In 2009 the median age of RNs was 47
years, compared to 44 years in 2000. The median age of non-metropolitan RNs was older on
average (49 years) than metropolitan RNs (46 years). The median age of RNs in non-border
counties were older (47 years) than nurses in border counties (43 years). In addition, the RN
population age 55 and older jumped from 15.1% in 2000 to 26.4% in 2009.

Demographic Review of the Texas Health Professions Workforce
Texas State Health Plan 2011-2016 52
Of the 169,446 RNs actively working in nursing in 2009, 12.8 percent of these nurses can start
retiring now and an additional 29.4 percent will be retiring in the next three to twelve years.
There will be a loss of at least 42.2 percent of the current RN workforce by 2020 due to a large
cohort of nurses retiring. According to the Bureau of Health Professions (2005), “three factors
contribute to this aging of the RN workforce: (1) the decline in the number of nursing school
graduates, (2) the higher average age of recently graduating students, and (3) the aging of the
existing pool of licensed nurses.”3
In the 2006 CHEP study, the RNs who were surveyed indicated the following work plans:
• The percent of RNs working at more than one job increased from 9 percent in 2004 to
13 percent in 2006.
• Fifty-five (55) percent of all RNs are primary wage earners; on the Border, 50 percent
of the RNs are primary wage earners.
• RNs age 56 and above intend to retire at age 66.
• The percentage of border RNs intending to decrease work hours for the next year
increased from 16 percent in 2004 to 17 percent in 2006.4
In the 2009 BON master file, there were 3,956 RNs who held active licenses, were employed
full- or part-time in nursing, and indicated “faculty or educator” as the position they held at the
time of license renewal. Out of the 3,956 RN faculty or educators, there were 2,174 who worked
in schools of nursing. The median age of faculty or educators who worked in schools of nursing
was 55 years of age.
In a study done in 2008 on schools of nursing in Texas for the 2008 academic year, the following
age-related trends among faculty have an impact on the capacity of schools of nursing to produce
more graduates over the next 20 years (Texas Center for Nursing Workforce Studies, 2008):5
� Trends show an additional increase in the median age of nurse faculty, from 51 in
1999 to 54 in 2008.
� The nurse faculty workforce in Texas continues to have a higher median age than the
RN workforce as a whole.

Demographic Review of the Texas Health Professions Workforce
Texas State Health Plan 2011-2016 53
� The median age of 54 for Texas nurse faculty in 2008 was higher than the national
median age of 51.5 for RN faculty as reported in 2007 by the American Association
of Colleges of Nursing.6
� In 2008, only 22 percent of 2,257 faculty members in Texas were under the age of 45.
The trends over a ten-year period show that there has been no significant increase in
recruitment of younger faculty members.
� Sixty-four (64) percent of faculty members were 50 and older in age and eligible to
retire within the next 12 years.
According to an article published in the March/April 2002 issue of Nursing Outlook, the average
age of nurse faculty at retirement was 62.5 years.6 The National League for Nursing reports that
almost two-thirds of all full-time nurse faculty members are likely to retire in the next five to 15
years.7 The loss of these experienced faculty members would cripple the educational system if
there are not enough nurse educators to replace faculty as they retire. This is consistent with the
study done by Rains and Tshirch in 2000 and the Texas Center for Nursing Workforce Studies in
2004 and 2006 where the cohort of nursing faculty continues to get older without a large increase
in recruiting younger nurses into nursing education.
Advanced Practice Nurses (APNs)
The term APN includes all nurses recognized by the BON as nurse practitioners, nurse
midwives, nurse anesthetists, and clinical nurse specialists. The APN specialties are based on the
types of practice or target populations of the practice, such as pediatrics, family, school health,
women’s health, oncology, and psychiatry–mental health.
Nurse Practitioners (NPs)
NPs have been granted authorization by the Board of Nursing to practice based on their
advanced education and experience. NPs practice both under the authority of their nursing
license and in collaboration with physicians. Some functions, such as prescribing medication,
can be performed only in collaboration with a physician under written protocols.

Demographic Review of the Texas Health Professions Workforce
Texas State Health Plan 2011-2016 54
The data for NPs were obtained from the 2009 RN master licensing file. The “position type” on
the file has variables for administrator, school nurse, researcher, nurse practitioner, clinical nurse
specialist, nurse anesthetist, and nurse midwife, among others. For this report, an RN record was
selected as an NP record based on the position type of “nurse practitioner.” An Advanced
Practice Nurse (APN) may be certified in multiple position types, but can only choose one
position type when completing renewal forms. In 2009, there were 5,745 active NPs practicing in
Texas. The importance of NPs in the delivery of health care is indicated by their increasing
supply; the ratios increased by 86.3 percent between 2000 and 2009.
The supply ratios of NPs per 100,000 population in Texas have lagged behind the U.S. average
supply ratios for decades (Figure 2.19). The National Sample Survey reported a ratio of 27.7 in
2004, compared with a Texas ratio of 17.1 that year. In contrast with the trends for many health
professions in Texas, the highest NP supply ratios were in certain counties in the Panhandle and
in areas west of Central Texas. However, most of the 59 counties that did not have an NP in
2009 were also in these areas, along with South Texas. Overall, the average ratios of NPs in
metropolitan counties were higher than in non-metropolitan counties, and the gap has been
increasing (Figure 2.20). Thirty-seven counties that did not have an NP in 2000 had at least one
in 2009. In 2009, the median age for NPs was 48 years, compared with 46 in 2000.
Figure 2.19 Nurse Practitioners per 100,000 Population, U.S. and Texas, 1990–2009
0
10
20
30
40
50
1990 1992 1994 1996 1998 2000 2002 2004 2006 2008
NPs
per
100
,000
Pop
ulat
ion
Texas NPs
U.S. NPs

Demographic Review of the Texas Health Professions Workforce
Texas State Health Plan 2011-2016 55
Figure 2.20 Nurse Practitioners per 100,000 Population, Metropolitan and Non-Metropolitan Counties, Texas, 1990–2009
0
5
10
15
20
25
30
1990 1992 1994 1996 1998 2000 2002 2004 2006 2008
Nur
se P
ract
ition
ers
per 1
00,0
00 P
opu
latio
n Non-Metropolitan
Metropolitan
Table 2.13: 2009 Texas Nurse Practitioner Facts: White 77.5% Male 9.8% Median Age Male 45 Black 7.0% Female 90.2% Median Age Female 49 Hispanic 9.8% Other 5.8% Providers/100,000 Population Border Metropolitan 17.0 Non-Border Metropolitan 25.1 Border Non-Metropolitan 8.3 Non-Border Non-Metropolitan 15.5 Trends: Year Number Providers/100,000 Population 1991 964 5.6 1996 1,633 8.6 2000 2,517 12.4 2005 4,066 17.7 2009 5,745 23.1

Demographic Review of the Texas Health Professions Workforce
Texas State Health Plan 2011-2016 56
Certified Nurse-Midwives (CNMs)
CNMs have been granted authorization by the Board of Nursing to practice based on advanced
education and experience. CNMs provide obstetrical and gynecological care for women during
pregnancy, childbirth, and the postpartum period. In Texas, there are two types of midwives:
Direct-entry Midwives and CNMs. Direct-entry Midwives are non-RNs who successfully
complete a course on midwifery and successfully pass the state-approved comprehensive written
exam as required by the Texas Midwifery Board. Certified Nurse Midwives’ educational
preparation requires an RN background. They are regulated by the Texas Board of Nursing.
In Texas, in 2009, there were 276 CNMs. The data for CNMs were obtained from the 2009 RN
master licensing file (for position types, see “Nurse Practitioners,” page 21). An RN record was
selected as a CNM record based on the position type of “nurse midwife.” An APN may be
certified in multiple position types, but can only choose one position type when completing
renewal forms. The Texas supply ratio of CNMs per 100,000 female population of childbearing
age (ages 15 through 44) has lagged behind the U.S. supply ratio since 1992 when national
statistics first became available (Figure 2.21). CNMs were primarily located in the metropolitan
areas of Texas (see Figure 21a). In 2009, the median age of CNMs was 51 years, compared with
46 in 2000.
Figure 2.21 Certified Nurse Midwives per 100,000 Females Ages 15–44, U.S. and Texas, 1990-2009
1
2
3
4
5
6
7
8
9
10
1990 1992 1994 1996 1998 2000 2002 2004 2006 2008
CN
Ms
per
100,
000
Fem
ales
, 15-
44 y
rs
Texas CNMs
US CNMs

Demographic Review of the Texas Health Professions Workforce
Texas State Health Plan 2011-2016 57
Figure 2.21a Certified Nurse Midwives per 100,000 Females ages 15–44, Metropolitan and Non-Metropolitan Counties, Texas, 1990–2009
0
1
2
3
4
5
6
1990 1992 1994 1996 1998 2000 2002 2004 2006 2008
Cer
tifie
d N
urse
Mid
wiv
es
per 1
00,0
00 F
emal
es a
ges
15-4
4
Non-MetropolitanMetropolitan
Table 2.14: 2009 Texas Certified Nurse Midwife Facts: White 83.2% Male 1.5% Median Age Male 37.0 Black 8.1% Female 98.6% Median Age Female 51.5 Hispanic 5.9% Other 2.9% Providers/100,000 Females Ages 15–44 Border Metropolitan 7.0 Non-Border Metropolitan 4.8 Border Non-Metropolitan 3.9 Non-Border Non-Metropolitan 2.4 Trends: Year Number Providers/100,000 Females Ages 15–44 1990 135 3.3 1996 155 3.5 2000 231 4.9 2005 244 5.0 2009 276 5.1

Demographic Review of the Texas Health Professions Workforce
Texas State Health Plan 2011-2016 58
Certified Registered Nurse Anesthetists (CRNAs)
In 2009, there were 2,183 Certified Registered Nurse Anesthetists (CRNAs) practicing in Texas.
The data for CRNAs were obtained from the 2009 RN master licensing file. The “position type”
on the file has variables for administrator, school nurse, researcher, nurse practitioner, clinical
nurse specialist, nurse anesthetists, nurse midwife, and others. An RN record was identified as a
CRNA record based on the position type of “nurse anesthetist.” An APN may be certified in
multiple position types, but can only choose one position type when completing renewal forms.
CRNAs were primarily located in the metropolitan areas of Texas. Their ratios increased by
39.7 percent between 2000 and 2009 (see Figure 2.22). U.S. statistics for CRNAs were available
only for the year 2000. The Texas ratio in 2000, 6.3 per 100,000 population, was below the
national average of 8.1 per 100,000 population. In 2009, there were 123 counties that did not
have a CRNA. The median age of CRNAs was 49 years in 2009, compared with 48 in 2000.
Figure 2.22 Certified Registered Nurse Anesthetists per 100,000 Population, Texas, 1990–2009
3
4
5
6
7
8
9
10
1990 1992 1994 1996 1998 2000 2002 2004 2006 2009
CRNA
s pe
r 100
,000
Pop
ulat
ion
U.S. CRNAsTexas CRNAs
Note: National statistics not available, except for 2000

Demographic Review of the Texas Health Professions Workforce
Texas State Health Plan 2011-2016 59
Figure 2.23. Certified Registered Nurse Anesthetists per 100,000 Population, Metropolitan and Non-Metropolitan Counties, Texas, 1990–2009
3
4
5
6
7
8
9
10
1990 1992 1994 1996 1998 2000 2002 2004 2006 2008
Cert
ified
Reg
iste
red
Nur
se A
nest
hetis
ts
per 1
00,0
00 P
opul
atio
n
Non-MetropolitanMetropolitan
Table 2.15: 2009 Texas Certified Registered Nurse Anesthetist Facts: White 85.1% Male 49.0% Median Age Male 51 Black 4.8% Female 51.0% Median Age Female 49 Hispanic 5.0% Other 5.2% Providers/100,000 Population Border Metropolitan 7.4 Non-Border Metropolitan 9.1 Border Non-Metropolitan 4.4 Non-Border Non-Metropolitan 7.9 Trends: Year Number Providers/100,000 Population 1990 983 5.8 1996 1,108 5.8 2000 1,274 6.2 2005 1,701 7.4 2009 2,183 8.8

Demographic Review of the Texas Health Professions Workforce
Texas State Health Plan 2011-2016 60
Clinical Nurse Specialists (CNS)
There were 1,409 Clinical Nurse Specialists (CNSs) practicing in Texas in 2009. The data for
CNSs were obtained from the 2009 RN master licensing file. The “position type” on the file has
variables for administrator, school nurse, researcher, nurse practitioner, clinical nurse specialist,
nurse anesthetists, nurse midwife, and others. An RN record was identified as a CNS record
based on the position type of “clinical nurse specialist.” An APN may be certified in multiple
position types, but can only choose one position type when completing renewal forms.
The supply ratios of CNS per 100,000 population in Texas increased by 58.3 percent between
2000 and 2009 and has steadily increased since 2006 (Figure 2.24). CNSs were primarily
located in the metropolitan areas of Texas. U.S. statistics were not available except for the year
2000; however, the Texas and U.S. supply ratios for that year were similar in magnitude. In
2009, there were 166 counties in Texas that did not have a CNS, but 37 counties that did not
have a CNS in 2000 gained at least one in 2009. In 2009, the median age for CNSs was 51
years, compared with 49 in 2000.
Figure 2.24 Clinical Nurse Specialists per 100,000 Population, Texas, 1990 through 2009 (national statistics not available, except for 2000)
0
1
2
3
4
5
6
1990 1992 1994 1996 1998 2000 2002 2004 2006 2008
CNSs
per
100
,000
Pop
ulat
ion
U.S. CNSTexas CNS

Demographic Review of the Texas Health Professions Workforce
Texas State Health Plan 2011-2016 61
Figure 2.25 Clinical Nurse Specialists per 100,000 Population, Metropolitan and Non-Metropolitan Counties, Texas, 1990–2009
0
1
2
3
4
5
6
7
1990 1992 1994 1996 1998 2000 2002 2004 2006 2008
Clin
ical
Nur
se S
peci
alis
ts
per
100,
000
Pop
ulat
ion
Metropolitan
Non-Metropolitan
Table 2.16: 2009 Texas Clinical Nurse Specialist Facts: White 73.3% Male 11.6% Median Age Male 49 Black 9.8% Female 88.4% Median Age Female 51 Hispanic 10.2% Other 6.8% Providers/100,000 Population Border Metropolitan 2.0 Non-Border Metropolitan 6.6 Border Non-Metropolitan 0.8 Non-Border Non-Metropolitan 2.3 Trends: Year Number Providers/100,000 Population 1990 631 3.7 1996 1,055 5.5 2000 724 3.6 2005 864 3.8 2009 1,409 5.7

Demographic Review of the Texas Health Professions Workforce
Texas State Health Plan 2011-2016 62
Licensed Vocational Nurses (LVNs)
Licensed Vocational Nurses (LVNs) provide nursing care under the direction of a registered
nurse, a physician, or another authorized health care provider. According to the Texas Board of
Nursing (BON) licensure file, there were 69,152 active LVNs practicing in Texas in 2009, a
supply ratio of 278.0 LVNs per 100,000 population. The LVN profession is among the few
health professions in Texas where the supply ratios (277.9 in 2003) exceed the U.S. average
ratios (180.8 in 2003) (Figure 2.26). The ratios of LVNs in Texas have steadily increased since
2006 after declining between 1998 and 2005 while the US ratios increased in the early 2000s.
Current U.S. data were not available.
In contrast with most other professions, the ratios for LVNs are higher in non-metropolitan
counties than metropolitan counties (Figure 2.27). The trend has been toward the increased use
of LVNs in non-metropolitan counties relative to the use of RNs. The supply ratios for LVNs
are lower in both the metropolitan border and metropolitan non-border counties than in the rest
of the state. In 2009, there were four counties that did not have an LVN. One of the three
counties that did not have an LVN in 2000 had two in 2009, and in that time, 107 counties have
experienced growth in the supply of LVNs relative to the population; however, 145 counties
experienced a decrease in the supply ratios. In 2009, the median age of LVNs was 45 years,
compared with 44 in 2000.
Figure 2.26 Licensed Vocational Nurses per 100,000 Population, U.S. and Texas, 1981–2009
50
100
150
200
250
300
350
1981 1983 1985 1987 1989 1991 1993 1995 1997 1999 2001 2003 2005 2007 2009
Lice
nsed
Voc
atio
nal N
urse
s pe
r 100
,000
Pop
ulat
ion
Texas LVNs
U.S. LVNs

Demographic Review of the Texas Health Professions Workforce
Texas State Health Plan 2011-2016 63
Figure 2.27 Licensed Vocational Nurses per 100,000 Population, Metropolitan and Non-Metropolitan Counties, Texas, 1981–2009
200
250
300
350
400
450
500
1981 1983 1985 1987 1989 1991 1993 1995 1997 1999 2001 2003 2005 2007 2009
Lice
nsed
Voc
atio
nal
Nur
ses
per
100
,000
Pop
ulat
ion
Non-Metropolitan
Metropolitan
Table 2.17: 2009 Texas Licensed Vocational Nurse Facts: White 56.2% Male 10.0% Median Age Male 42 Black 20.2% Female 90.0% Median Age Female 45 Hispanic 20.9% Other 2.8% Providers/100,000 Population Border Metropolitan 211.7 Non-Border Metropolitan 256.9 Border Non-Metropolitan 312.9 Non-Border Non-Metropolitan 477.0 Trends: Year Number Providers/100,000 Population 1989 49,389 293.9 1998 58,795 299.2 2000 59,034 290.2 2005 61,886 269.0 2009 69,152 278.0

Demographic Review of the Texas Health Professions Workforce
Texas State Health Plan 2011-2016 64
DENTAL PROFESSIONS
• Dentists • Dental Hygienists
Dentists
Most dentists (9,401 out of 10,977) are general dentists, which would, using the physician
analogy, be the equivalent to PC physicians. For the purpose of this report, the term general
dentists will include dentists within the specialties of public health, pediatric, and general
dentistry. Also, in this chapter, statistics are reported only for active general dentists who are
non-federal, non-administrative, and who are not residents-in-training.
In 2009, there were 9,401 dentists in private practice in Texas. The supply ratios of dentists per
100,000 population have remained fairly constant over the last two decades and have lagged
behind the U.S. average ratios (Figure 2.28). In 2005, the American Dental Association
reported a ratio of 45.5 for the U.S., while Texas had a ratio of 35.7.
In 2009, the supply ratio for dentists in Texas was 37.8 per 100,000 population (Table 2.18).
There were more dentists employed in metropolitan counties (ratio of 39.8) than in non-
metropolitan counties (ratio of 23.9). The average supply ratio of dentists in border counties fell
far short of the ratio in non-border metropolitan counties, and the gap between metropolitan and
non-metropolitan counties has been widening over the last decade. In 2009, there were 44
counties with no dentists. Between 2000 and 2009, 129 counties experienced a decline in their
ratios, while only 14 counties experienced an increase in ratios of 50 percent or greater. Only
five counties that did not have a dentist in 2000 had gained one in 2009, while seven counties
lost all of their dentists.
Age and Gender
In 2009, three-quarters (72.1 percent) of the dentists were males and 52.5 percent of the dentists
statewide were below the age of 50 years. In 2009, the median age was 48 years, compared with
46 years in 2000. In 2009, the median age of male dentists in Texas was 52 years, and of female

Demographic Review of the Texas Health Professions Workforce
Texas State Health Plan 2011-2016 65
dentists, 38 years. In non-metropolitan counties, 13.3 percent of the dentists were females,
compared to 29.2 percent in metropolitan counties. In the border counties, 23.5 percent of the
dentists were female, while 28.1 percent in the non-border counties were female.
Figure 2.28 Dentists per 100,000 Population: U.S. and Texas, 1981–2009
25
30
35
40
45
50
55
60
1981 1983 1985 1987 1989 1991 1993 1995 1997 1999 2001 2003 2005 2007 2009
Den
tists
per
100
,000
Pop
ulat
ion
Texas Dentists
U.S. Dentists
Figure 2.29 Dentists per 100,000 Population, Metropolitan and Non-Metropolitan Counties, Texas, 1981–2009
20
25
30
35
40
45
1981 1983 1985 1987 1989 1991 1993 1995 1997 1999 2001 2003 2005 2007 2009
Den
tist
s pe
r 10
0,00
0 P
opu
latio
n
Non-MetropolitanMetropolitan
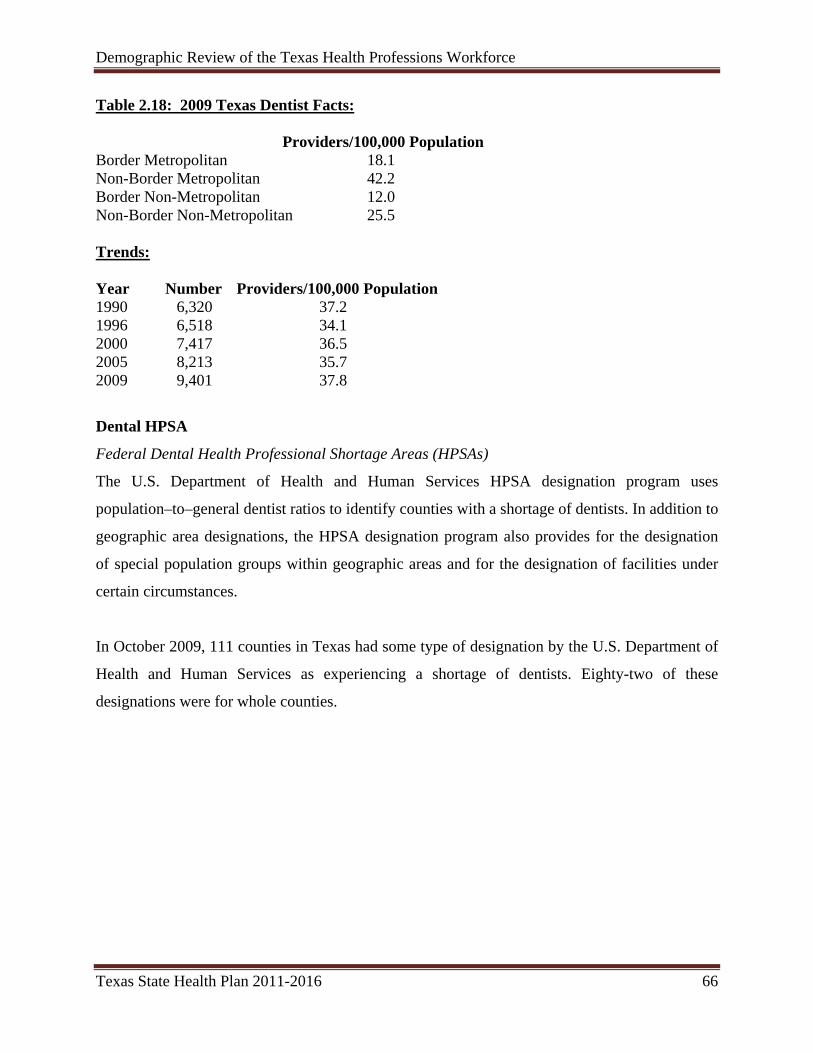
Demographic Review of the Texas Health Professions Workforce
Texas State Health Plan 2011-2016 66
Table 2.18: 2009 Texas Dentist Facts: Providers/100,000 Population Border Metropolitan 18.1 Non-Border Metropolitan 42.2 Border Non-Metropolitan 12.0 Non-Border Non-Metropolitan 25.5 Trends: Year Number Providers/100,000 Population 1990 6,320 37.2 1996 6,518 34.1 2000 7,417 36.5 2005 8,213 35.7 2009 9,401 37.8
Dental HPSA
Federal Dental Health Professional Shortage Areas (HPSAs)
The U.S. Department of Health and Human Services HPSA designation program uses
population–to–general dentist ratios to identify counties with a shortage of dentists. In addition to
geographic area designations, the HPSA designation program also provides for the designation
of special population groups within geographic areas and for the designation of facilities under
certain circumstances.
In October 2009, 111 counties in Texas had some type of designation by the U.S. Department of
Health and Human Services as experiencing a shortage of dentists. Eighty-two of these
designations were for whole counties.

Demographic Review of the Texas Health Professions Workforce
Texas State Health Plan 2011-2016 67
Figure 2.30 Federally Designated Dental Health Professional Shortage Areas in Texas, October 2009
Designation StatusNot DesignatedSpecial Population DesignationPartial County DesignationWhole County Designation
Prepared by: Health Professions Resource Center, Center for Health Statistics, Texas Department of State Health Services Data Source: Shortage Designation Branch, United States Department of Health and Human Services, October 2009
Dental Hygienists
“These health professionals perform services and procedures in the dental office of his/her
supervising dentist or dentists who are legally engaged in the practice of dentistry in this state or
under the supervision of a supervising dentist in an alternate setting” (Texas Occupations Code,
Chapter 262). They are eligible for licensure after graduating from a community college (two-
year program) or from a three or four-year university program. The supply ratios of dental
hygienists per 100,000 population have steadily increased in Texas since 1981 (Figure 2.31). The

Demographic Review of the Texas Health Professions Workforce
Texas State Health Plan 2011-2016 68
supply ratios for Texas have lagged behind the U.S. average ratios for most of the past two
decades.
There were 9,820 dental hygienists practicing in Texas in 2009. Because dental hygienists often
practice in combination with dentists in Texas, their geographic distribution is often linked to
that of dentists. Thus, the ratios for dental hygienists were much higher in metropolitan than in
non-metropolitan counties in 2009 (Table 2.18). Most of the counties in South Texas, West
Texas, and the Panhandle have very low supply ratios. In 2009, there were 53 counties with no
dental hygienists, and 44 counties with no dentists. Between 2000 and 2009, 70 counties
experienced a decline in their ratios, while the ratios for 30 counties more than doubled; this
includes fifteen counties that did not have a dental hygienist in 2000 but that had one in 2009.
Between 2000 and 2009, five counties lost all of their dental hygienists, and seven counties lost
all of their dentists. The median age of dental hygienists in 2009 was 42 years, compared to 40 in
2000. Race/ethnicity data were not available.
Figure 2.31 Dental Hygienists per 100,000 Population, U.S. and Texas, 1981–2009
15
20
25
30
35
40
45
50
1981 1983 1985 1987 1989 1991 1993 1995 1997 1999 2001 2003 2005 2007 2009Den
tal H
ygie
nist
s pe
r 10
0,00
0 P
opul
atio
n
Texas Dental Hygienists
U.S. Dental Hygienists

Demographic Review of the Texas Health Professions Workforce
Texas State Health Plan 2011-2016 69
Figure 2.32 Dental Hygienists per 100,000 Population, Metropolitan and Non-Metropolitan
10
15
20
25
30
35
40
45
1981 1983 1985 1987 1989 1991 1993 1995 1997 1999 2001 2003 2005 2007 2009
Den
tal H
ygie
nist
s pe
r 100
,000
Pop
ulat
ion
Non-MetropolitanMetropolitan
Table 2.18: 2009 Texas Dental Hygienist Facts: Male 1.8% Median Age Male 38 Female 98.2% Median Age Female 42 Providers/100,000 Population Border Metropolitan 19.3 Non-Border Metropolitan 43.5 Border Non-Metropolitan 10.4 Non-Border Non-Metropolitan 31.0 Trends: Year Number Providers/100,000 Population 1991 5,338 30.8 1994 5,987 32.6 2000 7,057 34.7 2005 8,548 37.2 2009 9,820 39.5

Demographic Review of the Texas Health Professions Workforce
Texas State Health Plan 2011-2016 70
HEALTH PROFESSIONS
• Medical Radiologic Technologists • Occupational Therapists • Optometrists • Pharmacists • Physical Therapists • Respiratory Care Practitioners • Speech Language Pathologists • Clinical Laboratory Specialists/Medical Technologists
Medical Radiologic Technologist (MRT)
MRTs are certified by the Professional Licensing and Certification Unit at the Texas Department
of State Health Services. They administer radiation to persons for medical purposes under the
direction of a practitioner. The definition includes diagnostic radiography, nuclear medicine, and
radiation therapy. There were 20,559 MRTs practicing in Texas in 2009. During the 1990s, the
supply ratios of MRTs per 100,000 population in Texas lagged behind the U.S. average supply
ratios; however, however, the Texas ratios have followed an unusual curve, increasing,
sometimes sharply, from 1994-2005, then dropping significantly in 2006, then rising slowly
again until the present. In 2002, the Texas ratios surpassed those of the United States (Figure
2.33). Non-metropolitan counties had lower supply ratios than did metropolitan counties and, in
general, the border counties had lower ratios (57.3 overall) than did the rest of the state (Table
2.19). In 2009, there were 31 counties with no MRTs; most of these were in West Texas, South
Texas, and the Panhandle. Since 2000, ratios have grown in counties distributed throughout the
state, including some the border counties, although several of the border counties had no MRTs
or a decrease in ratios. Sixty-one counties experienced a decline in ratios from 2000 to 2009.
Fifteen counties that did not have an MRT in 2000 had at least one in 2009. However, seven
counties that had MRTs in 2000 did not have any in 2009. As it was in 2000, the median age of
MRTs in 2009 was 41 years. Race-ethnicity and gender data not available.

Demographic Review of the Texas Health Professions Workforce
Texas State Health Plan 2011-2016 71
Figure 2.33 Medical Radiological Technologists per 100,000 Population: U.S. and Texas, 1994–2009
50556065707580859095
100
1994 1996 1998 2000 2002 2004 2006 2008
Med
ical
Rad
iolo
gic
Tech
nolo
gist
s pe
r 10
0,00
0 Po
pula
tion
Texas MRTs U.S. MRTs
Figure 2.34 Medical Radiologic Technologists per 100,000 Population, Metropolitan and Non-Metropolitan Counties, Texas, 1994–2009
0102030405060708090
100
1994 1996 1998 2000 2002 2004 2006 2008
Med
ical
Rad
iolo
gic
Tec
hno
logi
sts
per
100
,000
Pop
ulat
ion
Non-MetropolitanMetropolitan
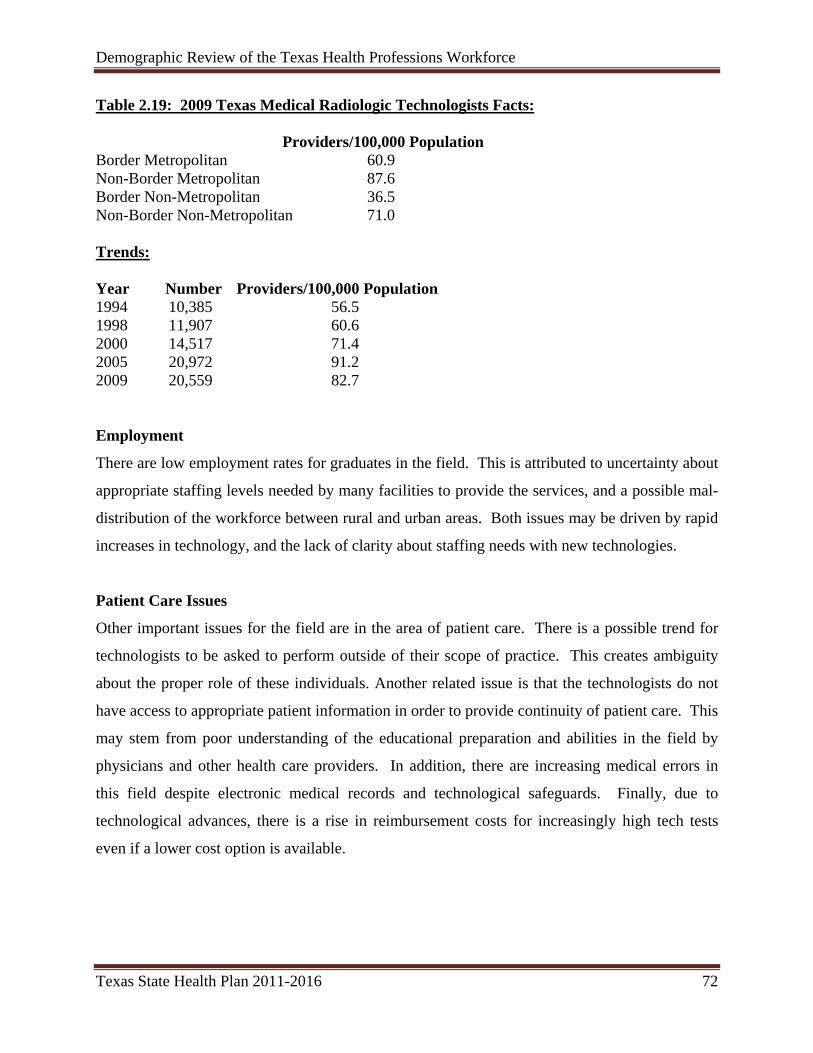
Demographic Review of the Texas Health Professions Workforce
Texas State Health Plan 2011-2016 72
Table 2.19: 2009 Texas Medical Radiologic Technologists Facts: Providers/100,000 Population Border Metropolitan 60.9 Non-Border Metropolitan 87.6 Border Non-Metropolitan 36.5 Non-Border Non-Metropolitan 71.0 Trends: Year Number Providers/100,000 Population 1994 10,385 56.5 1998 11,907 60.6 2000 14,517 71.4 2005 20,972 91.2 2009 20,559 82.7
Employment
There are low employment rates for graduates in the field. This is attributed to uncertainty about
appropriate staffing levels needed by many facilities to provide the services, and a possible mal-
distribution of the workforce between rural and urban areas. Both issues may be driven by rapid
increases in technology, and the lack of clarity about staffing needs with new technologies.
Patient Care Issues
Other important issues for the field are in the area of patient care. There is a possible trend for
technologists to be asked to perform outside of their scope of practice. This creates ambiguity
about the proper role of these individuals. Another related issue is that the technologists do not
have access to appropriate patient information in order to provide continuity of patient care. This
may stem from poor understanding of the educational preparation and abilities in the field by
physicians and other health care providers. In addition, there are increasing medical errors in
this field despite electronic medical records and technological safeguards. Finally, due to
technological advances, there is a rise in reimbursement costs for increasingly high tech tests
even if a lower cost option is available.

Demographic Review of the Texas Health Professions Workforce
Texas State Health Plan 2011-2016 73
Occupational Therapists (OTs)
The supply ratios of OTs per 100,000 population in Texas have risen steadily over the last
decade. And, in the late 1990s, the state ratios were higher than the U.S. average ratios, but US
data from HRSA wasn’t available after 2000 (Figure 2.35).
There were 6,136 OTs practicing in Texas in 2009. The ratios for Ots were higher in the
metropolitan areas than in the non-metropolitan areas, but the ratios were generally lower for the
border counties than in the rest of the state (Table 2.20). Since 2000, 91 counties have
experienced an increase in their OT ratios; however, in 2009, there were 91 counties that did not
have an OT, and 86 counties experienced a decline in ratios. Twenty-four counties that did not
have an OT in 2000 had at least one in 2009. The median age for OTs in 2009 was 40 years,
compared with 37 in 2002.
Figure 2.35 Occupational Therapists per 100,000 Population, U.S. and Texas, 1990–2009
5
10
15
20
25
30
1990 1992 1994 1996 1998 2000 2002 2004 2006 2008
Occ
upat
ion
al T
hera
pist
s pe
r 100
,000
Pop
ula
tion
Texas OTs
U.S. OTs

Demographic Review of the Texas Health Professions Workforce
Texas State Health Plan 2011-2016 74
Figure 2.36 Occupational Therapists per 100,000 Population, Metropolitan and Non-Metropolitan Counties, Texas, 1991–2009
0
5
10
15
20
25
30
1991 1993 1995 1997 1999 2001 2003 2005 2007 2009
Occ
upat
iona
l Th
erap
ists
p
er 1
00,0
00 P
opul
atio
n
Non-MetropolitanMetropolitan
Workforce Distribution, Shortages, and Diversity
According to 1991-2003 health workforce data published by the Statewide Health Coordinating
Council, 97 counties in Texas have no occupational therapists. These same data project an ever
widening discrepancy between OT staffing in metropolitan versus non-metropolitan counties.
Lack of services is especially great in border non-metropolitan areas. This problem may not
change without intervention as occupational therapists licensed in the state of Texas are not
drawn from all regions of the state and do not adequately represent the population of Texas
(77.7% white, 3.9% Black and 10.9% Hispanic, 7.5% Other). A steadily growing aging
population creates the demand for occupational therapists who enable people to remain in their
homes as they age and who provide rehabilitation services in hospitals as well as short and long
term care facilities.
Service Needs
The Health Resources and Services Administration (HRSA) has identified three health
professional shortage areas by discipline. One of these areas is mental health. Census data
specific to the state of Texas reveals that counties along the eastern border of Texas represent
areas in which shortage of health professionals is the greatest. This area includes both urban and
rural counties. Occupational therapists as an important provider of mental health services need
to be developed further in the area of mental health services.

Demographic Review of the Texas Health Professions Workforce
Texas State Health Plan 2011-2016 75
Table 2.20: 2009 Texas Occupational Therapist Facts: White 70.6% Male 12.0% Median Age Male 41 Black 4.9% Female 88.0% Median Age Female 40 Hispanic 12.9% Other 10.6% Providers/100,000 Population Border Metropolitan 20.5 Non-Border Metropolitan 27.1 Border Non-Metropolitan 6.5 Non-Border Non-Metropolitan 13.1 Trends: Year Number Providers/100,000 Population 1991 1,894 10.9 1994 2,756 15.0 2000 4,526 22.2 2005 5,354 23.3 2009 6,136 24.7
Optometrists
The University of Houston College of Optometry is the only accredited school of optometry in
Texas. The ratios of optometrists per 100,000 population in Texas have lagged behind the U.S.
supply ratios for over two decades, although the gap appears to be narrowing (Figure 2.37).
In 2009, there were 2,987 optometrists practicing in Texas. Optometrists are more likely to
practice in metropolitan counties than non-metropolitan counties, but this hasn’t always been the
case (Figure 2.38). Prior to 1984, the ratios for non-metropolitan counties were higher than those
for metropolitan counties. However, since that time, the metropolitan county ratios have
surpassed those of the non-metropolitan counties and the gap between the two has been steadily
widening. In 2009, there were 108 counties that did not have an optometrist. Eight counties that
did not have an optometrist in 2000 had a least one in 2009; however, eight other counties that
had optometrists in 2000 did not have any in 2009; the ratios decreased in 71 counties. In

Demographic Review of the Texas Health Professions Workforce
Texas State Health Plan 2011-2016 76
several areas of Texas, notably the lower Panhandle area and portions of West Texas, a patient
would have to travel through several counties to reach an optometrist. The border counties have
very low supply ratios and several counties have no optometrists. The median age in 2009 was
42 years, the same as in 2000. Figure 2.37 Optometrists per 100,000 Population, U.S. and Texas, 1977–2009
5
10
15
20
25
1977 1979 1981 1983 1985 1987 1989 1991 1993 1995 1997 1999 2001 2003 2005 2007 2009
Opt
omet
rists
per
100
,000
Pop
ulat
ion
Texas Optometrists
U.S. Optometrists
Figure 2.38 Optometrists per 100,000 Population, Metropolitan and Non-Metropolitan Counties, Texas, 1977–2009
0
2
4
6
8
10
12
14
1977 1979 1981 1983 1985 1987 1989 1991 1993 1995 1997 1999 2001 2003 2005 2007 2009
Opt
om
etri
sts
per
100,
000
Popu
latio
n
Non-Metropolitan
Metropolitan
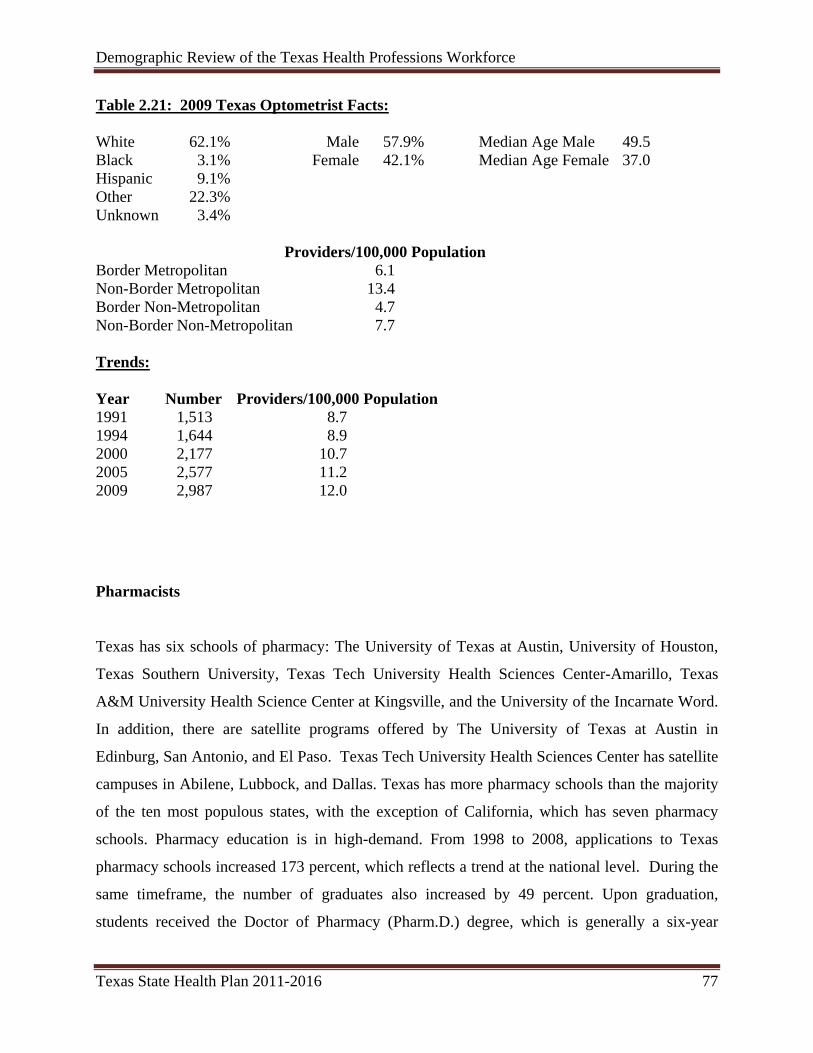
Demographic Review of the Texas Health Professions Workforce
Texas State Health Plan 2011-2016 77
Table 2.21: 2009 Texas Optometrist Facts: White 62.1% Male 57.9% Median Age Male 49.5 Black 3.1% Female 42.1% Median Age Female 37.0 Hispanic 9.1% Other 22.3% Unknown 3.4% Providers/100,000 Population Border Metropolitan 6.1 Non-Border Metropolitan 13.4 Border Non-Metropolitan 4.7 Non-Border Non-Metropolitan 7.7 Trends: Year Number Providers/100,000 Population 1991 1,513 8.7 1994 1,644 8.9 2000 2,177 10.7 2005 2,577 11.2 2009 2,987 12.0
Pharmacists
Texas has six schools of pharmacy: The University of Texas at Austin, University of Houston,
Texas Southern University, Texas Tech University Health Sciences Center-Amarillo, Texas
A&M University Health Science Center at Kingsville, and the University of the Incarnate Word.
In addition, there are satellite programs offered by The University of Texas at Austin in
Edinburg, San Antonio, and El Paso. Texas Tech University Health Sciences Center has satellite
campuses in Abilene, Lubbock, and Dallas. Texas has more pharmacy schools than the majority
of the ten most populous states, with the exception of California, which has seven pharmacy
schools. Pharmacy education is in high-demand. From 1998 to 2008, applications to Texas
pharmacy schools increased 173 percent, which reflects a trend at the national level. During the
same timeframe, the number of graduates also increased by 49 percent. Upon graduation,
students received the Doctor of Pharmacy (Pharm.D.) degree, which is generally a six-year

Demographic Review of the Texas Health Professions Workforce
Texas State Health Plan 2011-2016 78
degree program that requires at least two years of college study prior to admittance. This degree
replaced the five-year bachelor’s degree, which ceased to be awarded in 2005. After receiving
their degree, graduates must pass the national licensure examination and the Texas Pharmacy
Jurisprudence exam, and then apply for licensure with the Texas State Board of Pharmacy before
they can practice as a pharmacist.
The state ratio of pharmacists per 100,000 population exceeded the U.S. average supply ratio
from 1982-2002, the last year HRSA data was available. Since the mid-1990s, the supply ratios
for Texas have been fairly static (Figure 2.39). However, a 2009 report from the Texas Higher
Education Coordinating Board “Projecting the Need for Pharmacy Education in Texas” reveals
that Texas has fewer pharmacists per 100,000 population (78) than the average of the 10 most
populous states (84).
The ratios for pharmacists are higher in the metropolitan counties than in the non-metropolitan
counties (Figure 2.40). However, the ratios are the lowest for the border counties. In 2009, there
were 29 counties that did not have a pharmacist. Between 2000 and 2009, 137 counties in Texas
have experienced a decline in the ratios. However, two counties that did not have a pharmacist in
2000 had at least one in 2009, although seven counties lost all of their pharmacists during that
time. The median age in 2009 was 46 years, compared with 44 in 2000.
The pharmacist profession in Texas is also undergoing a phenomenon known as “feminization”
of the workforce; that is, a profession that has traditionally been comprised of mostly males is
seeing an increase in the number of female workers. In 2008 in Texas, more than 50% of the
pharmacists were female for the first time since HPRC began collecting pharmacist data. In
2000, 43.4% of the pharmacists were female.

Demographic Review of the Texas Health Professions Workforce
Texas State Health Plan 2011-2016 79
Figure 2.39 Pharmacists per 100,000 Population, U.S. and Texas, 1978–2009
50
55
60
65
70
75
80
85
90
1978 1980 1982 1984 1986 1988 1990 1992 1994 1996 1998 2000 2002 2004 2006 2008
Phar
mac
ists
per
100
,000
Pop
ulat
ion
Texas Pharmacists
U.S. Pharmacists
Figure 2.40 Pharmacists per 100,000 Population, Metropolitan and Non-Metropolitan Counties, Texas, 1978–2009
0
10
2030
40
50
60
7080
90
100
1978 1980 1982 1984 1986 1988 1990 1992 1994 1996 1998 2000 2002 2004 2006 2008
Phar
mac
ists
per
100
,000
Pop
ulat
ion
Non-Metropolitan
Metropolitan

Demographic Review of the Texas Health Professions Workforce
Texas State Health Plan 2011-2016 80
Table 2.22: 2009 Texas Pharmacist Facts: White 57.9% Male 48.5% Median Age Male 53 Black 13.8% Female 51.5% Median Age Female 40 Hispanic 8.9% Other 19.5% Providers/100,000 Population Border Metropolitan 44.8 Non-Border Metropolitan 86.9 Border Non-Metropolitan 33.9 Non-Border Non-Metropolitan 59.6 Trends: Year Number Providers/100,000 Population 1991 12,020 69.2 1999 14,931 74.7 2000 15,071 74.1 2005 16,944 73.7 2009 19,579 78.7
Physical Therapists (PTs)
Texas has eleven physical therapy programs; all but one lead to the Doctor of Physical Therapy
(DPT) degree. Programs are offered at the following institutions: Angelo State University,
Hardin-Simmons University, Texas State University-San Marcos, Texas Tech University Health
Sciences Center, Texas Woman’s University at Dallas Presbyterian Campus, Texas Woman’s
University at Houston Campus, The University of Texas at El Paso, The University of Texas
Health Science Center at San Antonio, The University of Texas Medical Branch at Galveston,
The University of Texas Southwestern Medical Center at Dallas, and the US Army-Baylor
University. In June 2000, the American Physical Therapy Association (APTA) House of
Delegates adopted the Vision Statement 2020, establishing that by 2020 physical therapy will be
provided by doctorally-prepared physical therapists. It is projected nationally that schools that
do not offer the DPT program will not be able to attract students. Students are currently choosing
DPT over Master of Science in Physical Therapy (MSPT) programs. Graduates of DPT programs

Demographic Review of the Texas Health Professions Workforce
Texas State Health Plan 2011-2016 81
must pass a national exam administered by the Executive Council of Physical Therapy and
Occupational Therapy Examiners.
There are no bachelor’s degree programs for PTs in the U.S.; the only entry level PT degree is a
master’s degree. The state requires that PTs hold a bachelor’s degree in any major, and at least a
master’s degree from an accredited PT program; they must also pass a national exam
administered by the Executive Council of Physical Therapy and Occupational Therapy
Examiners. The Texas Physical Therapy Association’s website lists eleven accredited PT
educational programs in the state.
The supply ratios for PTs per 100,000 population in Texas have increased over the past 30 years;
however, the Texas supply ratios have consistently lagged behind the U.S. average; and, the rate
of increase in Texas has decreased over the last few years, with the ratio showing only small
increases since 1999 (Figure 2.41). The American Physical Therapy Association (APTA)
reported that in 2008, Texas ranked the fifth lowest in supply ratios among the fifty states and
Washington, D.C.9
There were 10,016 physical therapists practicing in Texas in 2009. The supply ratios are
generally higher in metropolitan counties, with the exception of the border counties, which
generally have much lower ratios (Table 2.23). In 2009, 49 counties did not have a PT.
Between 2000 and 2009, the ratios increased in 124 counties, scattered across the state; 65
percent of these were non-metropolitan. The ratios declined in 87 counties; 66 percent of these
were non-metropolitan. Seventeen counties that did not have a PT in 2000 had at least one in
2009. The median age in 2009 was 41 years, compared with 37 in 2001.

Demographic Review of the Texas Health Professions Workforce
Texas State Health Plan 2011-2016 82
Figure 2.41 Physical Therapists per 100,000 Population, U.S. and Texas, 1977–2009
0
10
20
30
40
50
60
70
1977 1979 1981 1983 1985 1987 1989 1991 1993 1995 1997 1999 2001 2003 2005 2007 2009
Phy
sica
l Th
erap
ists
per
100
,000
Pop
ula
tion
Texas PTs
U.S. PTs
Figure 2.42 Physical Therapists per 100,000 Population, Metropolitan and Non-Metropolitan Counties, Texas, 1977–2009
05
1015
2025
30
3540
45
1977 1980 1983 1986 1989 1992 1995 1998 2001 2004 2007
Phys
ical
The
rapi
sts
per 1
00,0
00 P
opul
atio
n Non-MetropolitanMetropolitan
Access to Care
According to the Texas Health Work Force Data Appendix C, 131 whole counties and 46 partial
counties are designated as Health Professional Shortage Areas (HPSA). This designation is
determined based on population-to-PC physician ratios indicating shortages in primary care
Demographic Review of the Texas Health Professions Workforce
Texas State Health Plan 2011-2016 83
physicians. One possibility in assisting with improving this shortage is to consider alternative
means for an individual to access primary care. For example, the military model for patient
management allows for a physical therapist to assess individuals with injuries/disorders as an
entry point into the health care system for their troops. The military PT can evaluate, assess,
request special imaging tests and develop a plan a care without a direct referral from a physician.
If the management of the patient requires medical attention, the PT refers or consults with a
physician to provide the best care for the patient. The military PT is responsible for the care of
the individual unless medical intervention is deemed necessary.
In a similar model, a physical therapist with direct access could be that point of entry for
individuals seeking health care especially in areas where primary care physicians are in shortage.
Currently, the majority of PT programs in Texas offer only Doctor of Physical Therapy (DPT)
degrees with the remaining programs transitioning to the DPT. The new curricula provide
advanced skills and knowledge in imaging, pharmacology, differential diagnosis, and evidence
based practice. This added content provides PTs with the tools to address the health care needs as
an entry-point to health care, as consultants and as a referral source to MDs when the
intervention is beyond the scope of practice for the PT. With a change in the PT Practice Act and
this advanced education, PTs have the potential of addressing the shortages of Health Care
Professionals in these counties designated as HPSA.
Faculty Shortages
Faculty shortages limit the ability of the profession to expand educational programs to meet
workforce shortages. These shortages have been made more acute because most programs offer
a professional doctorate. The appropriate credential for a faculty appointment would be a
doctoral degree and licensure as a physical therapist. A very small number of physical therapists
possess a terminal doctoral degree.

Demographic Review of the Texas Health Professions Workforce
Texas State Health Plan 2011-2016 84
Table 2.23: 2009 Texas Physical Therapist Facts: White 75.9% Male 28.8% Median Age Male 41 Black 3.2% Female 71.2% Median Age Female 41 Hispanic 7.2% Other 13.6% Providers/100,000 Population Border Metropolitan 24.7 Non-Border Metropolitan 44.5 Border Non-Metropolitan 13.3 Non-Border Non-Metropolitan 26.3 Trends: Year Number Providers/100,000 Population 1991 3,373 19.4 1993 4,681 26.0 2000 7,358 36.2 2005 8,511 37.0 2009 10,016 40.3
Respiratory Care Practitioners
The Professional Licensing and Certification Unit at the Texas Department of State Health
Services issues licenses to respiratory care practitioners in Texas. The ratios of respiratory care
practitioners per 100,000 population have risen overall since 1991, but the trend line has
fluctuated in recent years (Figure 2.43). The non-metropolitan counties had much lower ratios
than the metropolitan counties, and the gap is increasing (Figure 44). Data on gender and race-
ethnicity were not available.
In 2009, there were 11,872 respiratory care practitioners in Texas. While some areas of Texas
have an adequate number of respiratory care practitioners, there were 57 counties with no
respiratory care practitioners (compared to 67 in 2001); most of these were in West Texas, South
Texas, and the Panhandle. However, thirteen counties that had respiratory care practitioners in

Demographic Review of the Texas Health Professions Workforce
Texas State Health Plan 2011-2016 85
2001 did not have any in 2009, while 23 counties that did not have a respiratory care practitioner
in 2001 had at least one in 2009. In 2009, the median age was 43 years, compared with 40 years
in 2001. National supply ratios for respiratory care practitioners were not available.
Figure 2.43 Respiratory Care Practitioners per 100,000 Population, U.S. and Texas, 1991–2009
0
10
20
30
40
50
60
1991 1993 1995 1997 1999 2001 2003 2005 2007 2009
RCO
s pe
r 10
0,00
0 Po
pula
tion
Texas RCPsU.S. RCPs
Figure 2.44 Respiratory Care Practitioners per 100,000 Population, Metropolitan and Non-Metropolitan Counties, Texas, 1981–2009
0
10
20
30
40
50
60
1991 1993 1995 1997 1999 2001 2003 2005 2007 2009
Res
pira
tory
Car
e P
ract
ition
ers
per
100,
000
Pop
ulat
ion
Non-MetropolitanMetropolitan
Demographic Review of the Texas Health Professions Workforce
Texas State Health Plan 2011-2016 86
Educational Preparation
Advances in technology, respiratory therapeutics and drug delivery methods have resulted in an
expansion in the scope of practice and the training requirements for respiratory therapists. The
profession is planning for an increase in the educational requirements for entry into the
profession. Currently the minimum is the associate’s degree, but the profession and the
sponsoring organizations have been developing the list or professional competencies needed for
future practice and anticipate a change to the bachelors or masters degree by 2015.
Scope of Practice
As a result of the demographic changes associated with the aging population, and the constant
threat of respiratory transmitted disease such as the avian and swine flu, the demand for
respiratory services is increasing. In order to meet this growing need, therapists of the future will
need to expand their role from treatment delivery to disease management.
In order to provide better patient care congress is now considering payment for respiratory care
services under Medicare Part-B. Reimbursement for therapists working as physician extenders
and seeing patients on their own would be forthcoming. The federal government, has stipulated,
however, that Part-B reimbursement would only include therapists with a minimum of a
bachelors degree.10

Demographic Review of the Texas Health Professions Workforce
Texas State Health Plan 2011-2016 87
Table 2.24: 2009 Texas Respiratory Care Practitioner Facts: Providers/100,000 Population Border Metropolitan 39.9 Non-Border Metropolitan 50.9 Border Non-Metropolitan 12.3 Non-Border Non-Metropolitan 36.6 Trends: Year Number Providers/100,000 Population 1991 5,446 31.4 1994 6,854 37.3 2001 8,941 43.2 2005 11,768 51.2 2009 11,872 47.7
Speech Language Pathologists (SLPs)
The Professional Licensing and Certification Unit at the Texas Department of State Health
Services issues licenses to speech language pathologists in Texas. The ratios of speech language
pathologists per 100,000 population have risen overall since 1991, but the trend line has
fluctuated in recent years, partially due to changes in data collection methods (Fig. 2.45). Interns
were included in the data for most years and they account for about five percent of the totals.
The non-metropolitan counties had much lower ratios than the metropolitan counties, and the gap
is increasing (Figure 2.46). Data on gender and race-ethnicity were not available.
There were 9,216 speech language pathologists practicing in Texas in 2009. The supply ratios
are generally higher in metropolitan counties, with the exception of the border counties, which
generally have much lower ratios (Table 2.25). In 2009, 52 counties did not have an SLP.
Between 2001 and 2009, the ratios increased in 119 counties. Eleven counties that did not have
an SLP in 2001 had at least one in 2009. The median age in 2009 was 38 years, however, almost
6% of the records had an invalid age, and that percentage was even higher in previous years, in
some cases approaching almost 50%.

Demographic Review of the Texas Health Professions Workforce
Texas State Health Plan 2011-2016 88
Figure 2.45 Speech Language Pathologists per 100,000 Population, U.S. and Texas, 2001–2009
0
10
20
30
40
50
60
2001 2003 2005 2007 2009
Spee
ch L
angu
age
Pat
holo
gist
s pe
r 10
0,00
0 Po
pula
tion
Texas SLPsU.S. SLPs
Figure 2.46 Speech Language Pathologists per 100,000 Population, Metropolitan and Non-Metropolitan Counties, Texas, 2001–2009
0
5
10
15
20
25
30
35
40
45
2001 2003 2005 2007 2009
So
cial
Wor
kers
per
100
,000
Pop
ulat
ion
Non-Metropolitan
Metropolitan

Demographic Review of the Texas Health Professions Workforce
Texas State Health Plan 2011-2016 89
Table 2.25: 2009 Texas Speech Language Pathologist Facts: Providers/100,000 Population Border Metropolitan 36.3 Non-Border Metropolitan 39.6 Border Non-Metropolitan 15.7 Non-Border Non-Metropolitan 22.4 Trends: Year Number Providers/100,000 Population 1998 4,059 20.7 2001 6,675 32.2 2004 7,554 33.5 2009 9,216 37.1 Clinical Laboratory Sciences
Workforce Shortages
Nationally, there are approximately 2600 CLS and 2300 CLT students graduate, creating a total
of 4900 new personnel to fill over 9,100 job openings, creating a 46% vacancy rate. In Texas,
there are approximately 225 CLS graduates and 200 CLT graduates to fill 985 jobs, leaving 57%
of the jobs unfilled.
Licensure
Clinical Laboratory Sciences is one of the few health professions that is not licensed in Texas.
Although national certification is available, in nonlicensure states, there is no requirement for
employers to hire certified personnel. As if noted in the numbers above, a personnel shortage is
evident in Texas, as in the rest of the nation. In states such as Texas, federal regulation by the
Clinical Laboratory Improvement Amendment of 1988 permit laboratories to hire high school
graduates to perform moderate complexity tests. A very lax standard indeed, considering the
critical role of laboratory testing in diagnosis and treatment of patients. When there is a shortage
of personnel, it is more likely that lower level, uneducated individuals will be hired if there is no
provision for requiring a specific level/standard to be met through licensure. Many states are
now licensing laboratorians (or considering it) to ensure quality laboratory work. The American

Demographic Review of the Texas Health Professions Workforce
Texas State Health Plan 2011-2016 90
Society of Clinical Pathology and the College of American Pathologists have both come forward
in the support of licensure.
In recent years, state legislation and appropriations to improve recruitment and retention of
health professions students has targeted nursing and licensed health professions. Students of
clinical laboratory science cannot benefit from these programs, as they prepare for an unlicensed
profession.
An additional benefit of licensure is that it would increase recognition of the CLS profession,
both for existing professionals and prospective students. Finally, because of the absence of
licensure, the state has never been able to accurately determine the numbers of laboratory
personnel, therefore is unable to even plan on addressing any personnel shortages.
MENTAL HEALTH PROFESSIONS • Psychiatrists • Psychologists • Social Workers • Licensed Professional Counselors • Advanced Practice Nurses
Mental health professionals provide services that cover a broad range of needs, including mental,
behavioral, emotional, and psychosocial needs. The mental health workforce is comprised of
professional and paraprofessional service providers whose educational and training backgrounds
vary and whose skill sets span both overlapping and specialized domains.
Mental Health Workforce Shortage
A cardinal issue affecting mental health professions is the ever-increasing need and demand for
mental health services. Overall healthcare needs are growing, the demographics of the state are
changing, and funding is perpetually scarce for mental health services. The demand is rising at a
much faster rate than the supply of an adequately trained mental health workforce.

Demographic Review of the Texas Health Professions Workforce
Texas State Health Plan 2011-2016 91
Historical approaches to the education, regulation, and management of mental health care
workers should be re-examined to move away from supply models to a demand model that
identifies a person’s needs and uses rational planning to determine the number and qualifications
of professionals to meet those needs.
Also, while the demand for services continues to grow, the need for culturally competent
services will become more apparent. Policies and rules are needed to require continuing
education across all types of providers to ensure that this training does not continue to be
optional. Mental health professions have not adequately recruited individuals from diverse ethnic
and cultural backgrounds.
Mental Health Care Costs
Another important issue affecting mental health professions is the rising costs of mental health
care. Costs are already unsustainable, as are overall health care costs, and as the demand for
services increases, costs can be expected to grow as well.
Research indicates that the integration of mental health and health systems of care would benefit
service recipients, families, employers, insurers, and care providers. A growing body of research
has shown that behavioral or mental health symptoms are often related to physical conditions and
vice versa. Care management and interdisciplinary team approaches would likely improve
quality of care and decrease costs.
Inadequate Mental Health Infrastructure
Another issue affecting all mental health providers is the inadequate mental health infrastructure
and lack of interface with the rest of the medical infrastructure. An integrated healthcare
workforce with sufficient levels would help address this issue, but considerable gaps would still
remain. For example:
1. A comprehensive Health Information Technology system that can be accessed by
outpatient and inpatient clinical and non-clinical resource providers is needed. This is an

Demographic Review of the Texas Health Professions Workforce
Texas State Health Plan 2011-2016 92
integral component to achieving truly integrated health care that addresses the physical
and the mental health aspects of humanity; as well as a cost saving measure if properly
implemented. Imagine if each current system could use the same data base with
appropriate access levels in place. The need for multiple forms and interactions that ask
the same data over and over could be eliminated.
2. The inadequate number of outpatient resources located in our rural and urban
communities that are able to address the social determinants of health: housing,
employment, transportation, addiction, social support, etc.
Another separate, but related issue that affects the entire health care model is the lack of attention
given to preventative medicine and its related corollaries. A paradigm shift is needed to the
public health approach model. We need to become more proactive and less reactive.
The establishment of peer support certification in Texas will have a significant impact on the
state of the mental health profession. The Hogg Foundation for Mental Health is working
collaboratively with the Department of State Health Services to fund the creation of a process
through which to certify peer specialists to serve as billable mental health professionals. The
entrance of these professionals into the mental health arena will drastically change the face of
mental health in the shifted focus toward recovery, wellness, and personal responsibility as
opposed to the current medical model of disease management. The project is being directed by
Mental Health America of Texas and the National Alliance on Mental Illness.
Additionally, Graduate students training to become mental health providers may encounter
problems in completing the final stages of their training. Among psychologists-in-training, there
is a shortage of internship sites. In 2009, almost one in four psychology graduate students
seeking an internship failed to match to an available position during the initial matching phase.11
For licensed professional counselor interns, who must complete 3000 hours of postdoctoral
training, many struggle to find paid internships. Therefore, they juggle other employment while
piecing together a series of internship experiences to fulfill their hours, which lengthens the
process considerably. LPC supervisors are sometimes difficult to find and students often must
pay for their supervision.

Demographic Review of the Texas Health Professions Workforce
Texas State Health Plan 2011-2016 93
Funding for graduate students across all mental health professions, including social work,
psychology, and counseling, continues to be scarce and as institutions of higher education face
financial challenges, this is unlikely to improve utilizing just the departments’ and institutions’
resources alone.
Based on the predictions of the state demographer, graduate training across all the mental health
professions in Texas should likely begin to include some level of language proficiency in
Spanish over the next decade. There is a shortage of fully bilingual (Spanish/English) therapists
and individuals who can conduct bilingual assessments in Texas. It is not sufficient to try to
recruit native speakers into the profession; we must also begin to build these language skills in
non-native speakers.
The Substance Abuse and Mental Health Services Administration recently released a Request
For Proposals (RFP) for five 5-year subcontracts to be awarded to national mental health
professional organizations to develop and implement training curricula that promote greater
awareness, acceptance, and adoption of mental health recovery principles and practices among
mental health providers. The RFP was designed for national membership organizations that
consist of, serve, educate, and represent one of the five categories of mental health professionals:
1. Psychiatrists
2. Psychologists
3. Social Workers
4. Psychiatric Nurses
5. Other Mental Health Providers, for example:
a. Marriage and Family Therapists
b. Licensed Professional Counselors
c. Peer Support Specialists
d. Psychiatric Rehabilitation Providers
e. Pastoral Counselors
f. Occupational Therapists

Demographic Review of the Texas Health Professions Workforce
Texas State Health Plan 2011-2016 94
If professional boards could be encouraged to expand the amount of data they track for their
professionals, it may be beneficial to track the following data (aside from race/ethnicity, gender,
age, rural vs. urban):
1. Languages spoken by the provider
2. Geographic location of current practice
3. Years of practice
4. Specialties/type of practice
5. Types of insurance accepted
6. Providers who serve LGBT (lesbian, gay, bisexual, and transgendered clients)
Psychiatrists
There were 1,634 psychiatrists practicing in Texas in 2009. In addition to physicians practicing
in the specialty of psychiatry, physicians with a specialty of child or pediatric psychiatry (182 of
the 1,634) were included in this report on “psychiatrists” to comply with the HPSA definition of
“general” psychiatry. The ratio of psychiatrists per 100,000 population began to increase around
1986, stabilized for several years, then, in about 1992, began to decline. From 1996 to 2003, the
ratios stabilized again, but in 2004 the ratios again began to decline; there has been a net decline
since 1991 (Figure 2.47). National supply ratios for psychiatrists were not available.
Two-thirds (63.9 percent) of Texas’ psychiatrists were male in 2009; and, 62 percent of the
psychiatrists were over 50 years of age; the median age was 54 years, compared with 52 in 2000.
The supply ratios for psychiatrists per 100,000 population were the largest in metropolitan
counties. Metropolitan border counties had lower supply ratios than did metropolitan non-border
counties, but the non-metropolitan border counties had higher ratios than did the
non-metropolitan non-border counties (Table 2.26).
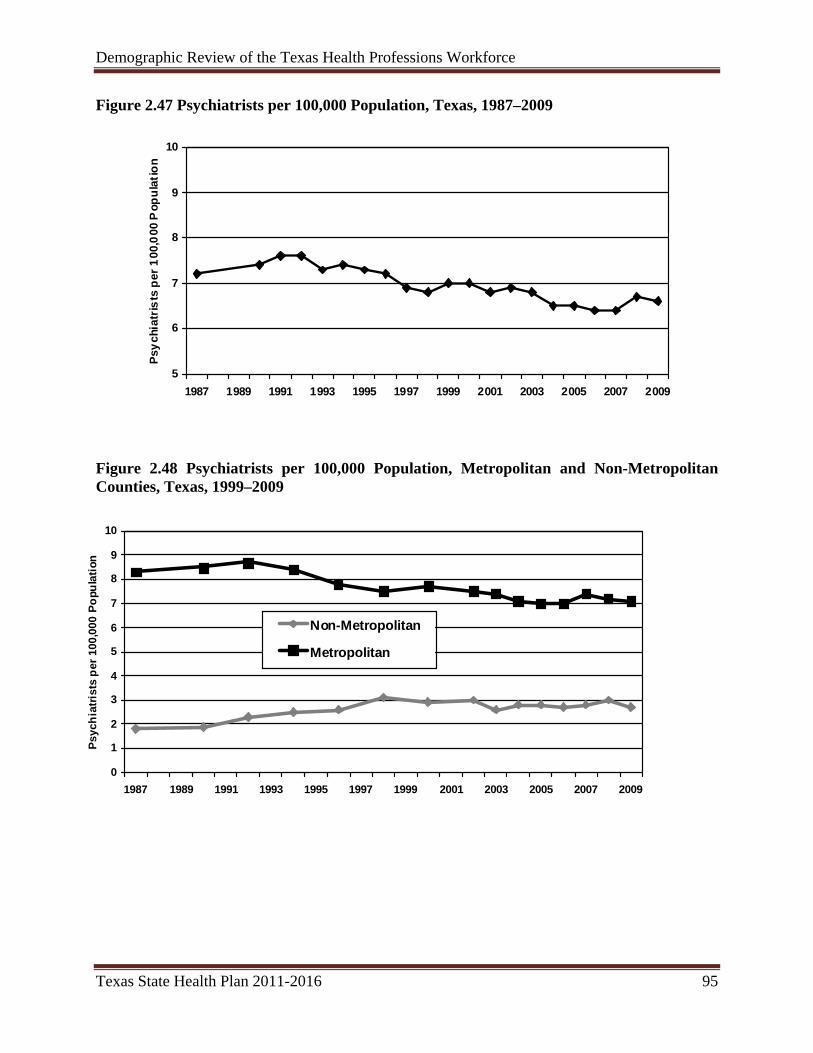
Demographic Review of the Texas Health Professions Workforce
Texas State Health Plan 2011-2016 95
Figure 2.47 Psychiatrists per 100,000 Population, Texas, 1987–2009
5
6
7
8
9
10
1987 1989 1991 1993 1995 1997 1999 2001 2003 2005 2007 2009
Psyc
hiat
rists
per
100
,000
Pop
ulat
ion
Figure 2.48 Psychiatrists per 100,000 Population, Metropolitan and Non-Metropolitan Counties, Texas, 1999–2009
0
1
2
3
4
5
6
7
8
9
10
1987 1989 1991 1993 1995 1997 1999 2001 2003 2005 2007 2009
Psyc
hiat
rists
per
100
,000
Pop
ulat
ion
Non-Metropolitan
Metropolitan

Demographic Review of the Texas Health Professions Workforce
Texas State Health Plan 2011-2016 96
Table 2.26: 2009 Texas Psychiatrists Facts: White 64.0% Male 63.9% Median Age Male 57 Black 3.5% Female 36.1% Median Age Female 50 Hispanic 12.4% Other 3.7% Unknown 16.3% Number of counties with no psychiatrists – 176 Providers/100,000 Population Border Metropolitan 2.8 Non-Border Metropolitan 7.6 Border Non-Metropolitan 0.8 Non-Border Non-Metropolitan 3.0 Trends: Year Number Providers/100,000 Population 1990 1,264 7.4 1996 1,336 7.0 2000 1,422 7.0 2005 1,488 6.5 2009 1,634 6.6
Mental Health Professional Shortage Areas (HPSAs)
The U.S. Department of Health and Human Services Health Professional Shortage Area
designation program uses population-to-psychiatrist ratios to identify counties with a shortage of
psychiatrists. In addition to geographic area designations, the HPSA designation program also
provides for the designation of special population groups within geographic areas and for the
designation of facilities under certain circumstances. In October 2009, there were 173 counties
designated by the U.S. Department of Health and Human Services as whole-county mental-
health HPSAs in Texas, two counties designated as partial-county mental-health HPSAs, and two
counties designated in whole or part as HPSAs for the low-income population.

Demographic Review of the Texas Health Professions Workforce
Texas State Health Plan 2011-2016 97
Figure 2.49 Federally Designated Mental Health Professional Shortage Areas in Texas, October 2009
Designation StatusNot DesignatedSpecial Population DesignationPartial County DesignationWhole County Designation
Prepared by: Health Professions Resource Center, Center for Health Statistics, Texas Department of State Health Services Data Source: Shortage Designation Branch, United States Department of Health and Human Services, October 2009
Psychologists
In Texas, there are four categories of licensees recognized by the Texas State Board of
Examiners of Psychologists (TSBEP): Licensed Psychologist (LP), Provisionally Licensed
Psychologist (PLP), Licensed Specialist in School Psychology (LSSP), and Licensed
Psychological Associate (LPA). A psychologist may hold more than one of these license types.
The statistics in this report represent an unduplicated count of these four license types; therefore,
there were 6,316 psychologists practicing in Texas in 2009. Of the four categories, licensed
psychologists were in greatest supply in 2009. In 1999, the available data indicates that the

Demographic Review of the Texas Health Professions Workforce
Texas State Health Plan 2011-2016 98
psychologist supply ratios were higher for the United States than for Texas, and it is expected
that trend will continue (Figure 2.50).
The psychologist supply ratios have been holding fairly steady since 1999, running between 24.2
and 25.9. The supply ratios have been greater in Texas metropolitan counties than in non-
metropolitan counties over the past seven years (Figure 2.51). In 2009, the largest concentration
of counties with high ratios was in Central Texas. The border counties, Panhandle counties, and
West Texas counties had very low ratios; most of these counties did not even have a
psychologist. Also, very few of the counties in those areas had an increase in supply ratios
between 2000 and 2009, and several had a decline. The largest cluster of growth was in North
Texas, in the area south of Dallas County; and in Central Texas, south of Travis County. Since
2000, 77 counties had a decrease in the supply ratios, while 88 counties had an increase. In
2009, 102 counties did not have a psychologist. Twenty-eight counties that had no psychologists
in 2000 had at least one in 2009, but fourteen counties that had a psychologist in 2000 had none
in 2009. Data on race-ethnicity, gender, and age were not available.
Figure 2.50 Psychologists per 100,000 Population, U.S. and Texas, 1999–2009
20
25
30
35
40
45
50
55
60
1999 2001 2003 2005 2007 2009
Psy
chol
ogis
ts p
er 1
00,0
00 P
opul
atio
n
Texas PsychologistsU.S. Psychologists

Demographic Review of the Texas Health Professions Workforce
Texas State Health Plan 2011-2016 99
Figure 2.51 Psychologists per 100,000 Population, Metropolitan and Non-Metropolitan Counties, Texas, 1999–2009
5
10
15
20
25
30
1999 2000 2001 2002 2003 2004 2005 2006 2007 2008 2009Psyc
hol
ogis
ts* p
er 1
00,0
00 P
opul
atio
n
Non-Metropolitan
Metropolitan
Table 2.27: 2009 Texas Licensed Psychologist Facts: Providers/100,000 Population Border Metropolitan 8.7 Non-Border Metropolitan 29.6 Border Non-Metropolitan 5.0 Non-Border Non-Metropolitan 11.6 Trends: Year Number Providers/100,000 Population 1999 4,955 24.8 2001 5,229 25.2 2003 5,432 24.9 2005 5,567 24.2 2009 6,316 25.4
Social Workers
Social workers are often the unseen force that makes a difference in people’s lives and helps
them to become productive citizens. They help people find work, ease the transition from
hospital to home, keep a delinquent child in school, help a family stay together, find stability for
a homeless person, protect children from abuse and neglect, and advocate for community

Demographic Review of the Texas Health Professions Workforce
Texas State Health Plan 2011-2016 100
resources. Social workers are a key component of a health delivery team and as such, supply
about 60% of all mental health services. With changes resulting from the mental health parity
legislature, there will likely be a greater demand for their services in the next 5 years and
beyond.
The Professional Licensing and Certification Unit at the Texas Department of State Health
2009, there were 16,574 social workers in Texas. While some areas of Texas have an
Services issues licenses to social workers in Texas. The ratios of social workers per 100,000
population over the last nine years have been fairly constant; however, the overall trend appears
to be favoring a slight decline in the magnitude of the ratio (Figure 2.52). The non-metropolitan
counties had much lower ratios than the metropolitan counties (Figure 2.53). Most of the social
workers, 69.5%, were female, while 13.5% indicated they were male and 17% didn’t answer the
question. Data on race-ethnicity were not available.
In
adequate number of social workers, areas such as West Texas, South Texas, and the Panhandle
had lower supply ratios. Most of the counties with no social workers were in these areas; only
four counties with no social workers were located east of I-35. In 2009, there were 40 counties
with no social workers, compared to 36 in 2000. However, sixteen counties that had social
workers in 2000 did not have any in 2009, while twelve counties that did not have social workers
in 2000 had at least one in 2009. In 2009, the median age was 48 years, compared with 45 years
in 2001. National supply ratios for social workers were not available.

Demographic Review of the Texas Health Professions Workforce
Texas State Health Plan 2011-2016 101
Figure 2.52 Social Workers per 100,000 Population, Texas, 1993–2009
20
30
40
50
60
70
80
1993 1995 1997 1999 2001 2003 2005 2007 2009Soc
ial W
ork
ers
per
100
,000
Pop
ulat
ion
Figure 2.53 Social Workers per 100,000 Population, Metropolitan and Non-Metropolitan Counties, Texas, 1993–2009
0
10
20
30
40
50
60
70
80
90
1993 1995 1997 1999 2001 2003 2005 2007 2009
So
cial
Wor
kers
per
100
,000
Pop
ulat
ion
Non-Metropolitan
Metropolitan

Demographic Review of the Texas Health Professions Workforce
Texas State Health Plan 2011-2016 102
The gradual decline in the supply ratio of Texas social workers is a symptom of some of the
current challenges facing the profession nationally. The National Association of Social Workers
(NASW) conducted extensive research in 2006 and found that the profession is experiencing the
following conditions:
• De-professionalization, or the practice of allowing people without social work licenses or
degrees to function in social work positions;
• encroachment on positions from other disciplines in certain areas that traditionally had
been held by social workers (examples: case management and child welfare);
• an unclear image by the public on what social workers really do and the significance of
their contributions;
• flat salaries over the last decade;
• issues around supervision, such as being supervised by non-social work managers;
• cutbacks in social and health services funding;
• difficulties filling social work faculty positions;
• new social workers leaving the field; and
• retirement of older workers who are not being fully replenished by new workers.
In 2009, in conjunction with a nationwide effort by the NASW, the Texas Chapter created a 5-
year strategic plan to reverse these trends in this state by reinvesting in the profession. Goals of
this plan are to recruit highly qualified applicants to Texas Schools of Social Work, increase
entry-level salaries for new social workers, create a loan forgiveness program for social workers,
stress the importance of licensure for employers, and generate more funding for social work
research. Social workers have the proper training to address many of the state’s problems, so it
is essential to recruit and retain them in the profession.

Demographic Review of the Texas Health Professions Workforce
Texas State Health Plan 2011-2016 103
Table 2.28: 2009 Texas Social Worker Facts: Male 13.5% Median Age Male 54 Female 69.5% Median Age Female 47 Unknown 17.0% Providers/100,000 Population Border Metropolitan 45.5 Non-Border Metropolitan 72.6 Border Non-Metropolitan 20.4 Non-Border Non-Metropolitan 47.1 Trends: Year Number Providers/100,000 Population 1993 6,783 37.6 2000 14,549 71.5 2003 15,003 68.7 2005 15,687 68.2 2009 16,574 66.6
Licensed Professional Counselors
The Professional Licensing and Certification Unit at the Texas Department of State Health
Services issues licenses to professional counselors in Texas. The ratios appeared to increase
significantly in 2006, but this was due to a new methodology in which interns are now included
in the numbers (Figure 2.54). The non-metropolitan counties had much lower ratios than the
metropolitan counties (Figure 2.55).
In 2009, there were 14,876 Licensed Professional Counselors practicing in Texas. In 2009, there
were 48 counties with no Licensed Professional Counselors, compared to 78 in 2000. Between
2000 and 2009, the supply ratios for 25 counties declined and nine of them lost all of their
licensed professional counselors. Thirty-eight counties that did not have a counselor in 2000 had
at least one in 2009. The median age in 2009 was 50 years, compared to 54 in 2000. However, a
significant factor in the decrease is the addition of the interns to the database; the median age for
the non-intern Licensed Professional Counselors was 53 in 2009. Data on race-ethnicity and
gender were not available.

Demographic Review of the Texas Health Professions Workforce
Texas State Health Plan 2011-2016 104
Figure 2.54 Licensed Professional Counselors per 100,000 Population, Texas, 2001–2009
20
25
30
35
40
45
50
55
60
65
1994 1996 1998 2000 2002 2004 2006 2008
Lice
nsed
Pro
fess
ion
al C
ouns
elor
s pe
r 10
0,00
0 Po
pul
atio
n
Figure 2.55 Licensed Professional Counselors per 100,000 Population, Metropolitan and Non-Metropolitan Counties, Texas, 2001–2009
0
10
20
30
40
50
60
70
1994 1996 1998 2000 2002 2004 2006 2008
Lice
nsed
Pro
fess
iona
l Cou
nsel
ors
per 1
00,0
00 P
opul
atio
n
Non-Metropolitan
Metropolitan

Demographic Review of the Texas Health Professions Workforce
Texas State Health Plan 2011-2016 105
Table 2.29: 2009 Texas Licensed Professional Counselor Facts: Providers/100,000 Population Border Metropolitan 30.2 Non-Border Metropolitan 66.5 Border Non-Metropolitan 23.5 Non-Border Non-Metropolitan 41.1 Trends: Year Number Providers/100,000 Population 2001 10,036 48.5 2003 10,596 48.5 2005 10,896 47.4 2009 14,876 59.8
Advanced Practice Nurses (APNs)
The Texas Board of Nursing recognizes APNs in various clinical practice areas. Nurse
Practitioners (NPs) may be recognized in one of 12 clinical areas. In 2009, there were 181 NPs
with Psychiatric / Mental Health / Substance Abuse recognitions, an increase from 2000, when
there were 49 NPs with P/MH/SA recognitions. The median age of these nurses in 2009 was 52
years, compared with 48 years in 2000. Clinical Nurse Specialists may be recognized in one of
14 clinical areas. In 2009, there were 143 CNSs with P/MH/SA recognitions, a decrease from
2000, when there were 186 CNSs with P/MH recognitions. In 2009, the median age of these
nurses was 59 years, compared with 52 years in 2000.
THE PUBLIC HEALTH WORKFORCE IN TEXAS
In 2007, the Health Professions Resource Center (HPRC), at the Texas Department of State
Health Services (DSHS), began a project to study the public health workforce in Texas. HPRC
often receives inquiries about the public health workforce, but this information isn’t available
from the databases HPRC receives from the licensing boards. Furthermore, few studies of these
workers have been recently published by any organization, leaving a void of knowledge about

Demographic Review of the Texas Health Professions Workforce
Texas State Health Plan 2011-2016 106
this important area of the healthcare workforce. To fill this void, HPRC conducted surveys of
various agencies and facilities that provide public health services, to determine how many
workers they employed and how many additional workers were needed, in terms of vacant
positions that needed to be filled, and the number of additional workers that need to be hired but
cannot because of budget or other constraints.
HPRC reviewed numerous public health reports and studies from other institutions. The
definition of public health is not clear in the literature, and there are more professions considered
to be public health professions than could be researched by this project. This required HPRC to
limit the project to those professions for which HPRC routinely collects demographic data. The
types of organizations and facilities that can be considered as providers of public health services
are also not clear in the literature, which led HPRC to choose only certain types of organizations
and facilities, and to report on each as a separate entity so that the reader may choose only those
that the reader considers as having public health functions. The reports and results of the surveys
of these organizations are located on the HPRC website at
http://www.dshs.state.tx.us/chs/hprc/pubhealth/phealth.shtm.
To learn more about the public health workforce, HPRC surveyed the 63 Local Health
Departments (LHDs) that contract with DSHS to provide public health services, the 79 LHDs
that do not contract with DSHS, and the five Texas Health and Human Services agencies. In
2009, HPRC continued this project with a survey of the 60 Federally Qualified Health
Centers/Community Health Centers that oversee a total of 319 health care delivery sites. The
resulting information still does not paint a complete picture of the public health workforce in
Texas because there are so many workers and organizations that contribute to public health but
are either ill-defined as having a public health role, or are not easily counted or surveyed. The
results of this study provide useful information on major aspects of this portion of the public
health workforce.
The following summary table shows the total numbers of health professionals currently
employed by these organizations, the number of vacant positions for each type of professional,
and other important workforce information.

Demographic Review of the Texas Health Professions Workforce
Texas State Health Plan 2011-2016 107
STAFFING TYPES
Currently Staffed Full‐Time Positions
Currently Staffed Part‐Time Positions
Total Currently Staffed FTEs
Current Vacant Positions
Vacancies In FTEs
Vacancy Rate (FTE, %)
Additional FTEs Desired*
HEADQUARTERS
Local Health Authorities 37 24 48.5 5 3.0 5.8 5 Public Health Planners/Policy Analysts
31 0 31.0 1 1.0 3.1 8
Health Educators 86 1 86.5 9 9.0 9.4 24 Information Officers 24 2 25.0 0 0.0 0.0 5 MEDICAL Physicians 139 58 170.5 35 32.0 15.8 30 Physician Assistants 6 4 8.0 4 4.0 33.3 8 NURSING Registered Nurses, APN & Non‐APN 2,040 109 2,096.0 674 660.5 24.0 52 Licensed Vocational Nurses 1,385 29 1,399.5 166 157.5 10.1 31 AIDES/ASSISTANTS Home Health Aides 76 1 76.5 0 0.0 0.0 0 Certified Nurse Aides 30 3 31.5 0 0.0 0.0 12 Medical Aides** 88 2 89.0 0 0.0 0.0 0 Patient Care Assistants 74 3 75.5 8 8.0 9.6 0 Promotora(as)/Community Health
Workers 68 0 68.0 4 4.0 5.6 28
NUTRITION Registered Dietitians and Nutritionists*
293 13 300.5 51 48.0 16.0 25
Dietetic Technicians** 18 0 18.0 1 1.0 5.3 0 DENTAL Dentists 35 14 42.0 5 5.0 10.6 9 Dental Hygienists 23 3 24.5 2 2.0 7.5 10 Dental Assistants** 20 1 20.5 1 0.5 2.4 0 MENTAL HEALTH Psychiatrists 108 24 120.0 34 30.0 20.0 3 Social Workers, Licensed/Unlicensed 253 3 254.5 20 19.0 7.5 14 Registered Therapists and Assistants**
207 14 214.0 63 60.5 22.0 0
Psychologists and Psychological Associates
244 3 245.5 44 44.0 15.2 6
Other Mental Health Workers 2,754 68 2,788.0 285 275.5 9.0 2 ENVIRONMENTAL/ VETERINARIAN Veterinarians 31 3 32.5 1 1.0 3.0 9 Environmental Health Workers/Engineers/Specialists
644 13 650.5 58 57.0 8.1 52
Animal Control Officers 340 12 346.0 14 9.0 2.5 55 LAB AND RESEARCH Medical Technicians/Technologists 134 3 135.0 14 14.0 10.4 8 Laboratory Technicians** 53 1 53.5 6 5.5 9.3 0 Microbiologists 181 1 181.5 22 22.0 10.8 4 Biochemists/Chemists 77 2 78.0 0 0.0 0.0 1 Toxicologists 1 0 1.0 1 0.0 0.0 1 Public Health Technicians 602 1 602.5 169 170.0 22.0 24 Epidemiologists 186 2 187.0 16 16.0 7.9 19 Medical Research Specialists** 2 0 2.0 1 1.0 33.3 0

Demographic Review of the Texas Health Professions Workforce
Texas State Health Plan 2011-2016 108
PHARMACY Pharmacists 80 16 88.0 15 15.0 14.6 4 Pharmacy Technicians** 77 0 77.0 0 0.0 0.0 0
OTHER Health Physicists** 58 0 58.0 4 4.0 6.5 0 Orthopedic Equipment Technicians**
42 0 42.0 1 1.0 2.3 0
Respiratory Care Practitioners** 10 0 10.0 3 3.0 23.1 0
TOTAL 10,557 433 10,777.5 1,737 1,683.0 13.5 449
*This question was not asked of the Health and Human Services Agencies **These professions were not counted at the Local Health Departments but only at the Health and Human Services Agencies Overview:
• In 2002, public health workers were estimated by one publication to be 5% of the Texas
health workforce.
• Non-Participating LHDs that were surveyed were focused more on code enforcement rather
than on direct patient care.
• The nursing profession was the public health profession with the largest number of workers,
but it also had the most vacancies of any profession and one of the highest vacancy rates.
• In the LHDs, animal control officers and sanitarians are the largest professions, along with
nurses.
• In the FQHCs, the largest professions were certified nurse aides / certified medical assistants
/ patient care assistants.
• The five HHS agencies employed the largest numbers of “other” mental health workers such
as psychiatric nursing aides, psychiatric nursing assistants, and psychological assistants.
(Psychiatrists, psychologists, and social workers counted separately)
• In the five HHS agencies, mental health workers comprised a larger percentage of the public
health workforce than was the case for the other organizations.
• The vacancy rate for public health workers at the State agencies (15.8%) was higher than that
for the FQHCs (12.3%), and more than double the rate of the LHDs.
• FQHCs had more dentists and dental hygienists then the LHDs and HHS agencies combined.
• At the LHDs, the combined nursing professions were the largest group represented, while
they were in second overall in the HHS agencies, after “other” mental health workers.

Demographic Review of the Texas Health Professions Workforce
Texas State Health Plan 2011-2016 109
• As with the LHDs, the profession with the most vacancies in the HHS agencies was
Registered Nurses.
Challenges and Issues:
• According to national publications, the U.S. lost 50,000 public health workers from 1980-
2000, and the U.S. Schools of Public Health need to triple the number of graduates by 2020
to replenish the workforce. The supply of public health workers is chronically short in some
settings and professions.
• Many professions had high turnover rates.
• There was a chronic mal-distribution of health workers in rural and border areas but it varies
among the different organizations – 78.6% of the public health workers were in the urban
counties and 87.4% were in the non-border counties.
• National publications also indicate the following about public health workers:
Minorities are disproportionately represented in the workforce.
Technological innovations are increasing the demand for more public health workers.
They are often underpaid and this creates problems with hiring new workers.
There are few career ladders for entry-level public health workers that would help retain
them as they become more experienced.
There is a lack of standardized public health training for some public health professions.
There is competition with non-public health facilities for workers highly trained in
analytical and epidemiological skills.
And, the largest single group of public health professionals – nurses – tends to be women
with families and this limits geographic mobility and this affects their recruitment into
the workforce.
Conclusion:
Although this study accomplished a lot toward documenting the shortage of certain types of
public health workers in Texas, more study is necessary to determine the full nature of the supply
of and demand for these workers in the state. What was learned from this project was that there
are a significant number of positions that are currently vacant, and insufficient budgets and other

Demographic Review of the Texas Health Professions Workforce
Texas State Health Plan 2011-2016 110
constraints are contributing to this shortage. The public health organizations and facilities
surveyed in this study would be better equipped to handle the needs of the public if more funding
were available for filling current vacancies; and, if public health worker salaries were more
competitive with the salaries of healthcare workers in other workplace setting in the state. The
study also illustrated the difference in the composition of the Health and Human Services public
health workforce from that of the public health workers in the LHDs and FQHCs. The Health
and Human Services public health workforce has more professions represented, more people
employed in those professions, and is more geographically diverse than are the public health
workforces of the other organizations.
Notes
1. Regional Center for Health Workforce Studies at the Center for Health Economics and
Policy, The University of Texas Health Science Center at San Antonio (2005). Health and
Nurses in Texas. In Their Own Words: 2004 Survey of Texas Registered Nurses.
2. Center for Health Workforce Studies, School of Public Health, University at Albany.
(December 2005). The Impact of the Aging Population on the Health Workforce in the
United States.
3. Bureau of Health Professions in Health Resources and Services Administration, U.S.
Department of Health and Human Services. (July 2002). Projected Supply, Demand, and
Shortages of Registered Nurses: 2000-2020.
4. Reineck, C. and Furino, A. Regional Center for Health Workforce Studies at the Center for
Health Economics and Policy. Health and Nurses in Texas – In Their Own Words: 2006
Survey of Texas Registered Nurses, (The University of Texas Health Science Center at San
Antonio, Texas: Spring 2007).

Demographic Review of the Texas Health Professions Workforce
Texas State Health Plan 2011-2016 111
5. Kishi, A., Ponder, A., Wiebusch, P., Pickens, S. and Gunn, B. Texas Center for Nursing
Workforce Studies. Professional Nursing Education in Texas – Demographics and Trends
2006, (Austin, Texas: October 2007), pp. 21-22. Available online at
http://www.dshs.state.tx.us/chs/cnws/Npublica.shtm
6. American Association of Colleges of Nursing. Nursing Faculty Shortage Fact Sheet,
(Washington DC: March 7, 2007), p. 1.
7. Ibid.
8. National League for Nursing. Nurse Faculty Support Continues to Fall Short, (New York
City: July 24, 2006), p. 1.
9. American Physical Therapy Association. PT to Population Ratios for 2008, Alexandria, VA.
http://www.apta.org. Accessed on June 24, 2009
10. Sept-Oct-2009 Issue of Focus S McCleaster; “The Bachelor’s degree for RT’S: has its time
finally arrived
11. American Psychological Association, June 2009, Statement of the APA Board of Directors
on the Internship Imbalance Problem


SECTION III
ACCESS TO CARE


Access to Care
Texas State Health Plan 2011-2016 115
INTRODUCTION
Access to healthcare is necessary for optimum health and wellness, improved quality of life,
productivity and social inclusion over the life span. Individuals unable to access healthcare
services experience poorer health outcomes, poorer quality of life, decreased productivity in the
workplace, and contribute to a greater burden of healthcare costs. The state of the healthcare
workforce plays an important role in delivering adequate and effective healthcare services.
In order to meet increasing healthcare demands and address changing demographics, the supply
and geographic distribution of healthcare workers must be significantly expanded and
diversified. In addition to increasing the overall supply of healthcare professionals, the
capability and effectiveness of the workforce is paramount. Disproportionate access to
healthcare can arise from insufficient and/or inadequate preparation of the workforce. The state
of the healthcare workforce and access to healthcare is inextricably connected. By increasing the
supply of culturally competent and well trained health professionals and paraprofessionals,
increased access to healthcare, improved health and wellness can be achieved.
The design of service delivery systems and structures can also play an important role in
improving access to quality healthcare. Interdisciplinary and coordinated care models that adopt
holistic approaches to wellness and illness maximize improved access to, and benefit from health
services provided.
WORKFORCE CAPACITY
A. WORKFORCE SHORTAGES
Though no consensus exists on the optimum number of healthcare workers per capita, there is a
significant disparity in the supply of most health professionals in Texas when compared to
national supply ratios with licensed vocational nurses (LVNs) and pharmacists as an exception.

Access to Care
Texas State Health Plan 2011-2016 116
Workforce shortages manifest in a multitude of ways that impact access to care including longer
wait times for appointments, increased travel distances to get care, shorter visit times with
physicians, physicians’ not accepting new patients, high emergency department use, higher
disease burden, and higher health care costs.
A key measure for understanding workforce shortages is the workforce supply ratio (the number
of health professionals per 100,000 residents). Supply ratios serve as the basis for workforce
studies concerning the supply, distribution, and trends associated with the health workforce. (See
Section 2 of the 2011 – 2016 Texas State Health Plan for 2009 supply ratios of licensed health
professionals in Texas).
Projections show that there will be a growing imbalance between the supply of healthcare
workers and the demand for health care services. The dynamic of supply and demand for health
professionals is expected to change with the implementation of health reform. The Health and
Human Services Commission (HHSC) estimates that approximately 1.8 to 2.3 million uninsured
Texans are expected to become eligible for Medicaid or CHIP by 2023.[1]. With an influx of a
large number of individuals who previously had no insurance, the gap between supply of health
professionals and demand for services is expected to widen. Existing workforce shortages will
be further challenged given that persons living in poverty, without insurance and/or with
Medicaid or CHIP tend to have poorer health, utilize more healthcare services, and tend to have a
greater number of health risks and health risk behaviors.
i. General Findings Related to Workforce Shortages
Workforce shortages exacerbate disparities. Workforce shortages exacerbate disparities in access
to care and health status and outcomes, especially for special populations such as people with
physical or cognitive disabilities, serious mental illnesses (SMIs), children and adolescents, the
elderly, and border populations, among others.
Primary care and primary care physicians. Primary care refers to health services that include
health promotion, disease prevention, health maintenance, counseling, patient education,
diagnosis, and treatment of acute and chronic illnesses in a variety of health care settings. The

Access to Care
Texas State Health Plan 2011-2016 117
PCP is a Medical Doctor (MD) who provides these services. Their fields of practice include
Family Medicine, General Internal Medicine, and Pediatrics. PCPs are often the first physicians
to make contact with the patient. One of their major roles is to prioritize which patients should be
referred to specialty or subspecialty medical care. In some cases, rather than a referral,
physicians may play a part in subspecialty medical care. For example, non-psychiatric PCPs play
a significant role in the provision of mental health care for those who prefer to be treated in a
medical setting or who otherwise lack access to mental health treatment.[2] In other cases, PCPs
living in rural areas may need to serve as an obstetrician or a gynecologist.
— Underuse of primary health care. Individuals who have a regular source of
primary healthcare have better health outcomes than those who don’t. Access to
primary care decreases hospital admission rates and decreases emergency room
utilization for children and adults.[3-6] States that have more primary care doctors
have lower death rates. [7-9] Researchers who have examined the potential
impact of primary care on healthcare spending in the U.S. estimate that the nation
would save $67 billion dollars per year if every American used PCPs as their
usual source of care.[10]
— Texas has one of the highest numbers of physician shortage areas in the country
according to the Census Bureau of Primary Health Care. The overall Texas
supply ratio for PCPs slightly increased from 60.7 in 1990 to 67.7 in 2009, and
has stabilized in recent years.
— Projected trends in supply and demand. Based on projected growth and aging
of the U.S. and Texas population, the demand for physician services is projected
to grow substantially faster than supply.[11]
— Fewer PCP graduates than subspecialty physicians. Institutions of higher
education are producing fewer PCPs than subspecialty physicians. This
imbalance of primary care to specialist physicians in the healthcare workforce
contributes to high healthcare costs [12-14] and leaves rural and impoverished
areas without needed PCPs.
— Recruitment of PCPs. There is a continuing reliance upon international medical
graduates to address the insufficient supply of PCPs in the U.S..

Access to Care
Texas State Health Plan 2011-2016 118
— Disparity between PCPs and subspecialist pay. Research has shown that pay is
an important factor in medical students’ choice of career path, especially for those
with higher levels of student loan debt. According to a Duke University study
published in Health Affairs in 2010, doctors going into primary care will earn
about $2.7 million less over their lifetime than those who choose specialty fields.
Pharmacists. Pharmacists are professionals who are licensed to dispense medication and provide
valuable information to the consumer regarding the proper usage of medication, side effects, and
interactions. In the hospital setting, the pharmacist works alongside physicians and nurses to
ensure that patients are receiving their medication correctly and safely. Pharmacists who work in
community pharmacies are highly assessable to consumers, and are available to answer questions
many times without appointment. They sometimes direct consumers to their PCPs.
— Supply trend. The supply ratio for pharmacists for Texas in 2009 is 78.7,
although ratios are significantly lower, ranging from 34 to 45, in border areas and
counties designated as Health Professional Shortage Areas (HPSAs). HSPAs
indicate areas in which there are acute health professional shortages. Texas
supply ratios have been higher than national supply ratios since the early 80’s and
the supply within Texas has steadily increased to 78.7 from 69.2 in 1991.
— Number of pharmacy schools. There are more pharmacy schools in Texas than
in the majority of the ten most populated states, except California.
— Demand for pharmacy education has grown as the number of applicants
increased by over 100% between 1998 and 2008.
Non-physician providers include physician assistants (PAs), nurse practitioners (NPs),
and other nursing professionals. Non-physician providers who work alongside
physicians increase the productivity of physicians by assisting with patient care (e.g.,
taking patient histories) and providing patient care (e.g., conducting comprehensive
assessment for a primary care visit) under the direction of a physician.
— Supply trends for PAs and NPs relative to PCPs. The Texas supply ratio for
PCPs has stabilized in recent years while the supply ratio for PAs and NPs has
significantly increased over the past 20 years; 2009 supply ratios for PAs
increased from 3.6 to 18.3 and 2009 supply ratios for NPs increased from 5.3 to

Access to Care
Texas State Health Plan 2011-2016 119
23.1. PAs and NPs have higher supply ratios in West Texas and the Panhandle
areas while PCPs have the lowest supply ratios in these same geographic areas.
— Roles of PAs and NPs. Projections indicate that future demand for PCPs would
be significantly moderated if PAs and NPs played a larger role in patient care.[11]
The majority of PAs (65%) are practicing within physician subspecialty
areas.[15]
— Supply trends for nurses. The Texas 2009 supply ratio for RNs is 681.2 up from
478.7 in 1990 and has been lower than national supply ratios since the mid 80’s.
On the other hand, the supply ratio for LVNs has been higher than the national
supply ratio, yet, over the past 20 years the Texas supply ratio has decreased to
278.0 in 2009 from 293.9 in 1989. In general, the highest concentrations of LVNs
in Texas are in areas where there are lower concentrations of RNs.
Dentists and dental hygienist. The overall Texas supply ratio for dentists has slightly
increased from 32.1 in 1981 to 37.8 in 2009. For dental hygienists, it slightly increased
from 30.5 in 1989 to 39.5 in 2009.
Significant increases in supply trends in Texas. As mentioned earlier, supply ratios for
PAs and RNs experienced a significant increase in the past 20 years. Other professions
that also experienced a considerable increase in ratios during this time period include
Physical Therapists from 19.4 to 40.3 (2009) and Occupational Therapists from 10.9 to
24.7 (2009). Radiologic Technicians also had a considerable increase from 56.5 in 1994
to 82.7 in 2009.
Behavioral health professionals (including mental health and substance abuse
treatment professionals). [16] Behavioral healthcare is provided by a wide range of
licensed and other key professionals and paraprofessionals that provide or extend health
care to persons with mental illness and/or substance use conditions. The behavioral health
workforce includes: PCPs, psychiatrists, psychologists, social workers, psychiatric
nurses, Licensed Professional Counselors (LPCs), Licensed Chemical Dependency

Access to Care
Texas State Health Plan 2011-2016 120
Counselors (LCDCs), Qualified Mental Health Professionals (QMHPs) and Peer Support
Specialists (PSSs).
— Supply and demand trends for behavioral health professions. There is a
critical shortage of behavioral health professionals and a growing demand for
services in Texas. Based on workforce supply trends, distribution problems, high
turnover rates, anticipated retirements, a projected state mental health job growth
of 20% or more, and extensive problems in recruiting and retaining mental health
workers, supply gaps are expected to deepen in the future.
— Supply for behavioral health professions.[16] In the past 20 years, the
workforce supply ratio for psychiatrists has declined, while the ratio for
psychologists (since 1999) and LCDCs (since 2002) showed only a slight increase
and the supply ratio for LPCs showed an increase (since 1994). Since 1993, the
supply ratio for social workers, representing the largest group of licensed mental
health professionals, nearly doubled.
Psychiatrists. The overall Texas supply ratio for psychiatrists declined
from 7.4 in 1990 to 6.6 in 2009. The scarcity of child psychiatrists in Texas
is even more acute than general psychiatrists.
Psychologists. The Texas supply ratio for psychologists has remained
relatively stable from 24.8 in 1999 to 25.4 in 2009.
Licensed professional counselors. The supply ratio for LPCs has increased
in recent years, from 40.9 in 1994 to 59.8 in 2009.
Licensed chemical dependency counselors. The supply ratio for LCDCs
slightly increased from 22.3 to 27.8 in 2009. National supply data are not
readily available.
Social workers. Nationally and in Texas, social workers is the largest
group of licensed mental health providers (18). The Texas supply ratio for
this profession has significantly increased from 37.6 in 1993 to 66.6 in 2009.
— High turnover rates and retirements are main contributors to workforce
shortages for mental health professionals:

Access to Care
Texas State Health Plan 2011-2016 121
Turnover rates for mental health treatment providers are high, ranging
from a low of 13.2% in a residential treatment facility to a high of 72.6% in
a community mental health organization.
A national study found that the average turnover rate among substance
use treatment professionals is 18.5%, far exceeding the average annual
turnover rates of teachers (13%) and nurses (12%).
Turnover rates for state psychiatric hospitals. In 2006, the DSHS’ state
psychiatric hospitals had a 17% turnover rate among social workers, a
20.3% turnover among psychiatric nurses, a 13.9% turnover among
psychiatrists, and a 13.5% turnover among psychologists. [2]
— Recruitment of psychiatrists. Texas alleviates its demand by importing
psychiatrists from out of state. In fact, Texas imports more psychiatrists from out
of state than it graduates from its medical schools.[16]
— Retention of mental health professions. Retirement rates for mental health
professions may exceed job growth rates in the near future. The supply gap in
mental health providers is likely to widen as the aging workforce retires and
fewer people enter the profession.
Paraprofessionals
— Qualified mental health professionals (including psychiatric technicians).
QMHPs make up the largest mental health workforce by far. These
paraprofessional staffs, the majority of which are employed by Local Mental
Health Authorities (LMHAs), provide direct care and rehabilitative services to
users of mental health treatment in community and inpatient settings, and are not
credentialed in Texas. Therefore, data on the number of people working in these
positions are not available.
— Peer support specialists. PSSs can play an important role in augmenting
behavioral health treatment for populations with SMI and/or co-occurring
substance use conditions. PSSs usually share ethnicity, language and life
experience with the individuals they serve. They also help facilitate better

Access to Care
Texas State Health Plan 2011-2016 122
outcomes and sustained recovery from mental health and substance use
conditions.
As a part of the national “Pillars of Peer Support Services Summit” in November
of 2009, a survey presentation showed a wide range and diversity in use of PSS in
state mental health systems across the country.
A majority of states (21 of 23) reported using paid peer specialists, ranging
from a high of 500 in Pennsylvania to a low of 9 in Wyoming; and Texas is
1 of only 10 states of 21 respondents that employ at least 50 paid PSSs.
Texas is one of 5 states (of 17 respondents) that indicated they have no
distinct PSS Medicaid billable service.
— In Texas, there are approximately 61 paid PSSs employed by 15 of 35 LMHA
respondents.
— Texas is in the process of developing its first certification program.
Consequently, there is no state or national data in which to quantify the overall
shortage and underuse of these paraprofessionals, and further examine the
composition of this growing class of paraprofessionals.
Community health workers (CHWs). CHWs or“promotores (as)” are lay members of
communities who work either for pay or as volunteers in association with the local
healthcare system in both urban and rural environments and usually share ethnicity,
language, socioeconomic status and life experiences with the community members they
serve. CHWs function as important extenders of health care services, and offer important
services such as interpretation, translation and informal counseling on health behaviors,
as well as direct medical services such as first aid and blood pressure screening. In
addition, they provide culturally appropriate health education and information. CHWs
also advocate for individual and community health needs.
The potential for using CHWs to provide and extend basic health care, including
behavioral and oral health services, has yet to be fully tapped. Certified CHWs or
promotores (as) build therapeutic alliances, foster appropriate healthcare utilization and
reduce health risks among the target population.

Access to Care
Texas State Health Plan 2011-2016 123
— In 2009, approximately 588 certified CHWs worked in 45 or 20% of Texas
counties. CHWs are in short supply overall, and are not available in sufficient
supply in many underserved areas of the state where they are most needed.
— Texas supply trend. The number of certified CHWs in Texas increased
significantly from 224 in 2003, to 588 in 2009. The supply ratio was 2.4 in 2009,
up from 1.0 in 2003.
— Certified training programs for CHWs are only in 13 counties in the state with
two training sites providing distance learning. As of July, 2009, Texas was the
first state to certify CHWs, joined only by Ohio and Alaska that now have CHW
or promotores certification programs.
ii. Needs Related to Workforce Shortage
Health professionals are entering the workforce at a slower rate than in previous years for a
variety of reasons including: prohibitive cost of educational and training programs; and
lack of access to training and education programs that offer licensure or certification.
Health professionals are leaving the workforce for a variety of reasons including, but not
limited to: retirements, flat salaries (especially true for behavioral health providers), high
workloads and/or unsafe conditions in the workplace.
Primary care physicians. There is a need for more residency training programs in the U.S.
that produce PCPs available to work in Texas. The insufficient supply of PCPs cannot
meet the demand for healthcare services nationally or in Texas, hence there is a need to
recruit international medical graduates to supplement the domestic workforce.
Pharmacists. Since Texas appears to have a solid supply of pharmacists, it is critical to
maintain this supply by expanding existing pharmacy curriculum to meet the increasing
demand for students entering pharmacy schools. Further, existing pharmacists need to be
fully integrated into the health delivery system.

Access to Care
Texas State Health Plan 2011-2016 124
Non-physician providers. The under-use of non-physician providers exacerbates the
existing shortage of PCPs, psychiatrists and other medical specialists. There is a need to
increase both the number and the utilization of these providers.
Behavioral health professionals. [16]
— Targeted recruitment and retention activities are necessary to narrow the
growing gap between supply and demand for mental health professionals.
— Too few new recruits are entering and staying in the behavioral health field.
Financial disincentives and the lingering stigma of mental illness influence the
desirability of new recruits to enter and stay in field. Formal efforts in Texas to
attract high school and college students into mental health-related professional
training programs do not appear to be widespread. There may be a lack of
domestic interest in pursuing a career in mental health among medical students in
the U.S..
— Insufficient capacity of the state’s higher education programs exists to
adequately prepare enough students to meet the growing demand for behavioral
health professionals. Despite the number of Texas universities offering
professional education in mental health fields, insufficient attempts are being
made to research and promote organized and widespread recruitment and
retention activities.
Paraprofessionals (CHWs and PSSs). The Texas workforce has insufficient numbers of
paraprofessionals. The under-use of paraprofessionals exacerbates the existing shortage
of PCPs, psychiatrists and other medical specialists. There is a need to utilize
paraprofessionals’ skills and expertise to supplement the responsibilities of the PCP.
— Increased access to training is needed to increase the number of certified
CHWs.
— Insufficient training and certification opportunities exist for PSSs to cultivate
enough well trained PSSs to meet the growing demand for behavioral health
services.
— PSS services are not currently Medicaid billable.

Access to Care
Texas State Health Plan 2011-2016 125
— PSS are not well integrated or used in the health workforce.
iii. Workforce Shortages - Recommendations to Consider
Recruitment strategies. Supply ratios can be increased through recruitment of new
providers entering health professions:
— Increase educational and training opportunities for new and existing health
professionals, paraprofessionals, and behavioral health professionals.
— Provide incentives to community colleges, non-profits, and healthcare facilities to
facilitate training opportunities.
— Increase opportunities for certification by developing, replicating and/or
expanding certification programs for CHWs and PSSs.
— Amend state Medicaid to facilitate Medicaid reimbursement for peer support
services.
— Preserve and increase loan repayment programs for healthcare professionals.
— Increase paid internship programs available to health professionals, especially
behavioral health professionals.
— Increase opportunities for scholarships and internship stipends.
— Develop strategies to reduce disparities between primary care and medical
subspecialist incomes.
— Provide and expand incentives to boost the number of international medical
graduates in Texas such as through the Conrad 30 J1 Visa Waiver Program,
waiving the physician’s two year return home in exchange for 3 years of service.
— Expand the development of Area Health Education Councils (AHECs) to help
underserved communities recruit and retain health and behavioral health
professionals and paraprofessionals.
Recruitment specific to behavioral health professions.
— Ensure that financial incentive programs or mandates to support healthcare
training include behavioral health professions (e.g. loan repayment programs).

Access to Care
Texas State Health Plan 2011-2016 126
— Increase academic training program capacity for mental health professions, as has
been done for nursing.
— Promote higher education-employer-community collaborations to recruit and
retain behavioral health professionals.
— Stimulate interest in mental health careers (especially among racial and ethnic
minorities). Incorporate mental health information into programs designed to
expose young students to health careers through health fairs, career mentoring,
job shadowing, special school clubs and high school health and human services
academies.
— Provide funding for public schools, AHECs, and mental health-related academic
departments of colleges and universities to partner to attract and support young
people who are interested in mental health careers.
Retention strategies. Supply ratios can be increased through improving retention rates of
health professionals/paraprofessionals already in the workforce:
— Make salaries more competitive for PCPs, behavioral health and other
professionals.
— Make reimbursement rates more equitable for physicians, especially primary care
and other healthcare providers who perform medical activities typically
performed by a physician including PAs, NPs, and pharmacists.
— Expand incentives for PAs to remain in general primary care practice versus
subspecialty practices.
Role expansion strategies for health professionals, non-physician providers and
paraprofessionals. Workforce shortages can be reduced by extending responsibilities
and/or roles of key health professionals and paraprofessionals in the workforce:
— Expand the duties of NPs and PAs; provide strong incentives designed to channel
a greater number of PA graduates into primary care practices that are located in
medically underserved communities.

Access to Care
Texas State Health Plan 2011-2016 127
— Expand the role and utilization of health professionals and paraprofessionals such
as CHWs and PSSs to promote increased access to healthcare, and to reach
underserved populations. Roles for these professions should also be clarified.
— Incorporate behavioral health screening in primary care practices to promote early
identification and interventions of adolescents in need of mental health services.
B. GEOGRAPHIC DISTRIBUTION OF HEALTH PROFESSIONALS
In the face of critical overall shortages of health care professionals, geographic maldistribution
exacerbates the supply deficiency, compounding access to care issues in underserved areas. An
inadequate supply of health workers is often a local or regional phenomenon, frequently
accompanied by surpluses elsewhere. For example, the supply of most professionals along the
border is far below the supply in many metropolitan areas. Geographic variation in population
growth rates is important in determining the adequate supply and future demand of health
workers. Health reform will have a significant impact on anticipated widening disparities as a
large influx of newly covered Medicaid and CHIP eligible individuals entering the health care
system. Most counties in Texas are under sourced and these shortages are most prevalent in
disadvantaged urban areas and rural and border regions.
Living in isolated areas distant from urban areas may result in inaccessibility to health care, lack
of educational opportunities, lack of transportation to medical appointments, and difficulties in
communication. The supply and distribution of numerous types of health professionals may
affect the timeliness of access and the therapeutic milieu available to treat certain types of
conditions. People in rural and underserved areas face some different health issues than people
who live in towns and cities. Living in isolated and remote areas makes it difficult to quickly get
to a hospital for emergency care. Travelling long distances deters individuals from getting basic
routine checkups and screenings.
Ideally, healthcare resources should be distributed geographically across Texas according to
population size and healthcare needs. However, geographical proximity to healthcare services

Access to Care
Texas State Health Plan 2011-2016 128
varies significantly across the state creating pronounced disparities in access for underserved
populations. Geographic variations in workforce shortages are expressed in this subsection in
two ways:
Supply ratios compared across counties or regions in the state; and/or
The number of counties designated as Health Professional Shortage Areas (HPSAs), which
indicate areas of acute health professional shortages in three categories: primary care,
dental and mental health. A designation permits provider reimbursement and student
scholarship and loan incentives in order to attract professionals to work in an underserved
county.
i. General Findings Related to the Geographic Distribution of Health Professionals
HPSA designations for primary care.
— Out of 254 Texas counties, 118 were designated as whole county primary care
HPSAs. Counties having this designation do not meet the national standard of
one physician for every 3,500 people.
— Fifty-one percent of the non-metropolitan counties and 65.6 % of border counties
had “whole county” HPSA designations. Seventy-six percent of the 118 “whole
county” HPSAs were non-metropolitan counties, and 17.8% were border
counties. As of June 2010, there were a total of 434 HPSA designations, 129 of
which were whole county designations for primary care.
Overall supply ratios for health professions.
— The Texas Panhandle and West Texas counties (which encompass most of the
area west of I35) have low supply ratios compared to the rest of the state. In fact,
most of these counties lack a single provider in numerous health professions.
— For most licensed and certified health professionals, supply ratios in non-border
areas are higher than ratios in border areas, and supply ratios in metropolitan
counties are higher than supply ratios in non-metropolitan counties.

Access to Care
Texas State Health Plan 2011-2016 129
Geographic disparities and rural areas.
— Residents of rural areas have higher rates of chronic disease than people in urban
areas nationally.
— Rural areas have fewer physicians and dentists, than metropolitan areas, and
various medical specialists might not be available at all. Due to limited access to
care, health issues may develop into more serious problems by the time a
diagnosis is made, thereby increasing the complexity and burden of the condition
or illness for which treatment is received.
— Ninety percent of the counties located west of Interstate 35 are considered rural.
[17] Although the majority of Texans live in urban areas, a large proportion of the
population will continue to live in rural areas which according to 2000 data
translate to more than 3.6 million residents. [18]
Primary care and subspecialties.
— Physician’s selection to work in rural areas.
Physicians tend to concentrate in geographical areas with high per capita
income and in areas with residency training positions; highly skilled health
professionals have a tendency to locate in more urban areas, thereby
affecting access to care for underserved populations.
A literature review suggests that several factors influence a physician’s
choice to practice rural primary care including financial incentives, a
physician’s race and gender, and a physician’s rural upbringing; the
strongest predictor being the physician’s rural upbringing and the desire
upon entering medical school to practice primary care and/or to practice
rurally.[19]
— Retention in rural areas. In a 1999 study by Rabinowitz, et al. two key
predictive factors for successful retention of PCPs practicing in rural areas of 10
years or more included participation in a physician shortage area program and
attendance at a rural college for undergraduate studies.[19]

Access to Care
Texas State Health Plan 2011-2016 130
— Primary care and the elderly who tend to live in non-metropolitan areas. The
proportional distribution of older adults tends to be highest in non-metropolitan
regions. As of May, 2009, Texas Medical Board listed 74 physicians who had a
specialty in geriatrics. According to another data source, the majority of the
practicing physicians with geriatric specialties were in metropolitan areas.
HPSA designations for dental care in Texas. As of June 6, 2010, there are 241 total HPSA
designations for dental care in Texas, eighty-six of which are whole county designations.
Behavioral health professions. There is a disproportionate shortage of behavioral health
professionals in most geographic areas, with 72% of Texas counties having an acute
shortage of licensed professionals. As of June 6, 2010, there were a total of 335 mental
health HPSAs, 193 of which were whole county designations. The mental health
workforce supply shortage is especially apparent in non-metropolitan and border areas.
The shortage of mental health professionals serving children and adolescents with serious
mental disorders is even more pronounced.
— Psychiatrists. Seventy one percent of counties in Texas (181 of 254 counties) do
not have a practicing psychiatrist and few practice in West Texas or along the
border. Most psychiatrists are located in the major urban areas of Houston,
Dallas, Austin, and San Antonio and in less populated counties containing state
psychiatric hospitals. The supply ratio is 6.1 in urban counties as compared to 2.6
in rural counties. The border rural area ratio is 1.1.
— Psychologists. In the major urban areas, the supply ratio was 26.3 while it was
10.3 in rural areas. In 2005, 112 counties (44%) had no psychologists.
— Social workers. The supply is most scarce in rural West and South Texas and in
the Panhandle. While urban counties had a 71.7 supply ratio, in rural counties the
ratio was 45.1 per 100,000, 61 in border counties and 34.8 in rural border
counties. Forty-six counties (18%) had no social workers.
— Licensed professional counselors. The supply ratio of LPCs varies from 49.9 in
urban counties to 24.2 in rural border counties.

Access to Care
Texas State Health Plan 2011-2016 131
— Licensed chemical dependency counselors. Seventy counties (27%) of all Texas
counties had no LCDCs.
Paraprofessionals.
— Peer support specialists.
PSSs act as a bridge to and extender of the formal healthcare system,
and as such, there is particularly high need for peer support services in rural
and other underserved areas of the state where persons with SMI or co-
occurring disorders already have constrained access by virtue of their
disability.
With only 61 paid peer specialists in Texas, there are no paid peer support
services in 132 (53%) of the 247 counties that serve populations with SMI
and persons with SMI and co-occurring substance abuse disorders in the
public mental health system (NorthStar counties excluded). According to a
December 2009 survey of LMHAs in Texas, only 15 LMHAs out of 35
LMHA survey participants employ paid peer specialists.
— Community health workers. CHWs have low supply numbers as already
mentioned in the previous workforce shortages section. Further, there is a
significant geographic maldistribution of this key resource.
Distribution of CHWs. In 2009, 588 certified CHWs were practicing in 45
(20%) of Texas counties, up from 13 counties in 2003; note however that
many non-certified CHWs who perform similar functions are not included
in this number; Harris County had the highest number with more than 190
CHWs and several counties had only 1 or 2.
In 2009, non-metropolitan counties had lower supply ratios than the
metropolitan counties, and border counties had significantly higher ratios
(7.6) than the non-border counties (1.8).[20]
Texas trend. Between 2003 and 2009, the supply ratios for seven counties
declined and one of them lost all CHWs. The ratios increased in 39
counties; and 33 counties that did not have a CHW in 2003 had at least one
in 2009.

Access to Care
Texas State Health Plan 2011-2016 132
Financial incentives.
— Recruitment. Scholarships, loans, tax incentives, loan repayment programs,
direct payments and disproportionate payments for services are effective tools to
attract and recruit health professionals to underserved areas (especially
physicians). Examples of some of these are programs are National Health Service
Corps, Physician Education Loan Repayment Program, Dental Education Loan
Repayment Program, and Children's Medicaid Loan Repayment Program.
— Retention. These financial incentives do not necessarily guarantee the long term
retention of those physicians to practice in rural or underserved areas.
ii. Needs Related to the Geographic Distribution of Health Professionals
Supply ratios are lowest in rural, border and other HPSAs for a number of health
professionals, including PCPs and mental health professionals.
A lack of subspecialists in rural areas is associated with a population size necessary to
support a subspecialist.
Ineffective or non-optimal use of non-physician providers and paraprofessionals in
HPSAs compound existing health professional shortages, particularly in underserved
areas.
Medical schools lack sufficient recruitment strategies to attract health professionals to
practice in rural and underserved settings.
Primary care and subspecialties.
— Lower earning potential is a disincentive for physicians to practice in rural
settings. Physicians exiting medical school with heavy debt tend to practice in
suburban areas rather than practicing in rural and underserved areas.

Access to Care
Texas State Health Plan 2011-2016 133
— There are economic disincentives for physicians to locate in rural areas where
they must provide a large amount of unreimbursed care. However, health
reform may help alleviate this phenomenon.
— An acute shortage of PCPs specializing in geriatrics exists in non-metropolitan
and border counties, where the aging population is concentrated and growing.
Behavioral health professions.
— Mental health professionals. Though most counties in Texas are under-
resourced, mental health professional shortages are most prevalent in
disadvantaged urban areas and rural and border regions.
— Qualified mental health professionals. When compared with populations
served, there is a shortage and disproportional cultural representation of QMHPs.
— Substance abuse treatment professionals. There is a maldistribution of these
professionals across the state, with particularly low supply in rural and
underserved areas. Low salaries are accompanied by turnover rates in both
managerial and clinical positions. The anticipated impact of the new Texas
Medicaid substance abuse treatment benefit for adults may drive demand for
substance abuse treatment professionals further challenging workforce capacity in
the substance abuse delivery system.
— Recruitment of mental health professionals. There may be a lack of domestic
interest in pursuing a career in mental health among medical students. Despite the
longstanding disproportionate shortages in underserved areas, little progress has
been made to motivate behavioral health professionals to work in underserved
areas.
— Retention of mental health professionals. There is a lack of coordinated
economic incentive programs designed to systematically attract physicians in
underserved areas. Though economic incentive programs such as loans,
scholarship programs tend to attract physicians they do not necessarily guarantee
the long term retention of those physicians in those areas.
— Peer support specialists. An increased number of training and certification
programs are needed not only to reach potential PSSs who reside in urban areas,

Access to Care
Texas State Health Plan 2011-2016 134
but also to reach potential PSSs who reside in the vast rural and frontier regions
of the state. There is only one PSS certification program in Texas, which is being
developed currently.
Community health workers. Due to the low supply of CHWs throughout the state, fewer
individuals residing in underserved and rural areas will gain access to care.
— Community factors that contribute to CHWs leaving the workforce include a lack
of: clear roles and recognized status within the community; peer support: and
acquisition of valued skills.
— An increased number of certification training programs located in rural and border
communities (where CHWs live and work) is needed.
iii. Geographic Distribution - Recommendations to Consider
Recruitment strategies.
— Provide strong incentives designed to channel a greater number of PCP and PA
graduates into medically underserved communities.
— Leverage and increase utilization of student loan programs to address the poor
distribution of physicians and other health professionals in underserved areas.
Expand existing programs and funds for student loans.
— Identify and target activities that encourage people from rural areas and
racial/ethnic minorities to take advantage of nursing and medical school loan
repayment programs.
— Leverage and increase funds for loan repayment and scholarship programs for
physicians who practice in designated workforce shortage areas and other
underserved areas.
— Establish goals and develop systemic strategies for medical schools to set and
achieve targets for recruitment and retention of students from underserved areas.
— Establish new public medical schools in underserved and rural areas.
— Provide tax breaks for health professionals practicing in underserved areas.

Access to Care
Texas State Health Plan 2011-2016 135
Redirection of resources/more effective use.
— Develop a process for redirecting resources to underserved areas by limiting the
number of practicing health professionals in saturated areas
— Develop mechanisms or policies for rural doctors to hire other doctors. (e.g.
enable doctors to work for a health system or hospital/provide exemptions to the
Corporate Practice of Medicine).
— Develop a pilot initiative (and legislative plans) to allow non-physician providers,
such as NAs and NPs, to practice independently in areas with a high
concentration of underserved and uninsured populations.
— Expand the use of telecommunication technologies such as telemedicine to extend
the reach and benefit of health services that are not available or accessible to
persons in both urban and rural areas, though especially in rural areas. Work
with regulatory agencies to avoid raising additional barriers to the expansion and
optimal use of these technologies. (See Section 4 of the 2011 – 2016 Texas State
Health Plan for additional information on technology.)
Access and special populations.
— Develop policies and strategies to increase the number of health professionals in
underserved areas with expertise in aging populations.
— Enhance medical practice coordination with other service organizations to assist
with transportation and other special needs for older adults and other vulnerable
populations living in rural areas.
Behavioral health professions.
— Recruitment. Develop and create incentives to increase the number of behavioral
mental health professionals practicing in rural and underserved areas.
— Increase residency opportunities for behavioral health professions.
Peer support specialists and community health workers.
— Provide incentives to community colleges, non profits, and healthcare facilities to
increase training opportunities for paraprofessionals such as CHWs and PSSs in

Access to Care
Texas State Health Plan 2011-2016 136
underserved areas. Relevant training to their communities should be provided
and certification programs should be available in underserved communities.
— Integrate use of CHWs and PSSs into formal healthcare system.
Strengthen management and logistical support for CHWs and PSSs working
for organizations that employ these paraprofessionals.
Develop standardized protocols and incorporate relevant principles to guide
optimal use of CHWs and PSSs.
WORKFORCE EFFECTIVENESS
A. WORKFORCE COMPOSITION
The diversity of physicians and health professionals plays a key role in addressing health
disparities that exist for racial and ethnic minorities and individuals of low socioeconomic status.
The health workforce should more closely match the diversity of the Texas population in order to
address cultural, linguistic, educational and communication barriers. Necessary access to
healthcare is contingent upon the ability of patients to locate providers who are able to provide
individualized services that address their unique needs and can develop a relationship based on
mutual communication and trust.
The disparities that racial and ethnic minorities face in accessing quality healthcare are well
documented, particularly with respect to PCPs, dentistry and behavioral health. Though many
factors contribute to this problem, the lack of minority representation in professional training
programs and in the workforce are important factors.
The diversification of the Texas population will continue to grow. As such, recruiting and
retaining a cultural and linguistic competence workforce is central to the provision of quality
health services, particularly behavioral health. Modalities such as PSSs and CHWs or

Access to Care
Texas State Health Plan 2011-2016 137
“promotores” can extend the current workforce and provide a cost-effective means to expand
available services.
i. Findings Related to Workforce Composition
The number of non-white students in health professions schools has increased for most
professions over the past decade. However, when compared to their proportionate
representation in the general population, these students are under-represented both in the
workforce and in schools of higher education. For example, about 35.4% of the general
population in Texas is Hispanic; however, only 14% of the first year medical and dental
school students and 13.7% of active PCPs are Hispanic.
Ethnic minorities are poorly represented among physicians and other health professionals. In
2009, 45.9% of the estimated Texas population was White, while 11.6% was Black,
38.1% was Hispanic, and 4.4% of the population was Asian, Native American, and other
race/ethnicities.[21] Compared to the general population, Blacks and Hispanics have
historically been under-represented in the PCP workforce. This is also statistically true
with other health professions in Texas including PAs, RNs, NPs, certified nurse
midwives, dentists, physical therapists, and psychologists.
Trends in access for ethnic minorities. Nationally, while some measures of healthcare
access are improving, 80% of disparities in access to care have stayed the same or
worsened for Hispanics; 60% for African Americans, Asians, and poor populations; and
40% for American Indians and Alaska Natives.[22]
Lack of diversity in the Texas behavioral health workforce. A 2001 U.S. Surgeon
General’s report on mental health states that “Racial and ethnic minorities continue to be
badly underrepresented, relative to their proportion of the U.S. population, within the
core mental health professions – psychiatry, psychology, and social work, counseling,
and psychiatric nursing.”[2] In 2004, African-Americans represented 11% of the
population nationally, but only 7% of psychology doctoral degree recipients. Hispanics

Access to Care
Texas State Health Plan 2011-2016 138
represented 13% of the population, but only 6% of the doctoral psychology degree
recipients. [16] However, between 1995 and 2005, the percentage of Hispanic
psychiatrists in Texas increased from 10.4% to 12.8% of the psychiatry workforce,
perhaps due to recruitment efforts.
Demographic data collection for mental health professionals. Professional licensing
boards for mental health workers in Texas are not required to collect data from licensees
on race, ethnicity, gender and language(s) spoken. However, demographic data available
for psychiatrists illustrates the under-representation of minority groups in the
profession.[2]
Community health workers. In most cases, CHWs come from the communities they serve
with an ability to respond to local societal and cultural norms and customs to ensure
community acceptance and ownership. As trusted members of the community, CHWs
may help to minimize barriers to care resulting from health beliefs and health values, as
part of community and individual cultures. In 2009, the majority of CHWs had the
following ethnic breakdown: 74.6% were Hispanic, while 7.2% were White, 15.8% were
Black, and 2.3% were classified as Other.
ii. Needs Related to Workforce Composition
Cultural diversity. The number of minorities represented in the health professions remains
low. Recruiting and sustaining a diverse workforce is crucial to addressing cultural and
linguistic barriers in health care.
Linguistic competency and diversity. Given the diversity of languages spoken in the state,
there is an increasing need for translators and interpreters trained to work in healthcare
settings.

Access to Care
Texas State Health Plan 2011-2016 139
Data collection for mental health professionals. The absence of demographic data
collection by professional licensing boards in Texas makes it difficult to assess and plan
for the state’s future mental health workforce needs.
iii. Workforce Composition - Recommendations to Consider
Conduct focused recruitment of racial and ethnic minorities into the workforce by
medical schools, health service centers, and /or high schools.
Develop focused incentives and/or policies to increase the number of minority persons
entering the workforce.
B. WORKFORCE PREPARATION AND EFFECTIVENESS
In addition to the need for a more diverse workforce, the existing workforce must be trained to
provide culturally competent and effective health services to the state’s growing racial/diverse
minority populations. Development of the healthcare workforce involves increasing the
competencies and preparedness of those who deliver healthcare. A key aspect of competency
includes effective communication, cultural competence, and awareness of health literacy issues.
Effective communication between the healthcare professional and patient promotes effective
health outcomes and patient safety. Part of effective communication involves cultural
competence which describes the ability of providers to offer care to patients with diverse values,
beliefs, behaviors. Cultural competencies also requires effective communication and an ability
to understand and develop trust across different cultures. Language differences, lack of patient
understanding, low English proficiency, health literacy, cultural barriers, and spiritual beliefs can
challenges to delivering effective healthcare.

Access to Care
Texas State Health Plan 2011-2016 140
i. Findings Related to Workforce Preparation and Effectiveness
Competencies for health practitioners using integrated and holistic approaches to health
include:
— Demonstrate a broader set of attitudes, such as awareness of how a practitioner’s
own personal, cultural, and spiritual believes affect his or her treatment
recommendations, and an appreciation of the importance of self-care.
— Have the ability to communicate effectively with patients about all aspects of their
health when taking a comprehensive history.
— Dedication of the practitioner’s own human experience to benefit patients.
— Adequacy of communication and teamwork among health professionals across
disciplines, as exhibited by their ability to communicate with each other.
— Knowledge of effectiveness of interventions used. Treatment interventions
should be safe, beneficial and cost-effective.
Health literacy.
— The Institute of Medicine (IOM) report on Health Literacy: A Prescription to End
Confusion (2004) states that low health literacy negatively impacts the
treatment outcome and safety of care delivery. Patients with low health literacy
are less likely to comply with treatment and more likely to make errors with
medication, and are more ill when they seek medical care.
— Patients with low health literacy are less likely to comply with treatment and more
likely to make errors with medication (24), and are more ill when they seek
medical care. (25)
Professional health care interpreters are high in demand. The National Council on
Interpreting in Health Care defines a professional health care interpreter as “an individual
with appropriate training and experience who is able to interpret with consistency and
accuracy and who adheres to a code of professional ethics.”[23] Interpreters can be
present on on-site or interpreting services can be provided by telephone or video.

Access to Care
Texas State Health Plan 2011-2016 141
Cultural and linguistic competency.
— There is insufficient cultural and linguistic expertise among the existing health
care workforce.
— There are no uniform standards and few, if any, outcome measures for cultural
competency training.[2]
Evidenced-based care. Workforce effectiveness depends in part on the degree to which
health professionals and practice organizations use evidence-based practices when
delivering care (evidence-based means a treatment practice or approach that is shown to
be effective by a strong body of research evidence).
Understanding of personal preferences. Understanding personal preferences of patients is
important. For example, numerous studies found a preference among the elderly to
receive mental health treatment in primary care settings, which offers the elderly the
potential advantages of proximity, affordability, convenience, and coordination of care
for mental and physical disorders.
Peer support specialists.
— PSSs are increasingly used in the public mental health system to offset the
average 25-year premature death of consumers with SMI.
— Training, continuing education, supervision, and care coordination requirements
for PSSs must be established to receive Medicaid reimbursement.
— Continuing education is generally required, with a few states recommending it
strongly.
Community health workers.
— A number of studies have found that if regular refresher training is not available
acquired skills and knowledge is lost.
— CHW interventions were found to have the greatest effectiveness for some disease
prevention, asthma management, cervical cancer screening and mammography
screening outcomes.

Access to Care
Texas State Health Plan 2011-2016 142
— CHWs, a key resource to address diversity needs in the health delivery system,
have limited access to certified training programs that are located in only ten
counties in Texas.
ii. Needs Related to Workforce Preparation and Effectiveness
Health literacy and bilingual education. (See Section VI for elements of health literacy.)
— Health care delivery systems do not generally monitor and track consumer
satisfaction with health provider communication skills (Healthy People 2020
objective).
— The use of a professional health care interpreter is critical for addressing the needs
of patients where language barriers exist.
— There is a shortage of Spanish/English bilingual therapists and individuals who
can conduct bilingual mental health assessments. There is also a lack of adequate
language skills in non-native speakers.
Cultural competency. (See Section VI for elements of cultural competence.)
— To integrate cultural competence into patient-centered care and to understand
patient needs, it is necessary for health care professionals to collect information
on patient preferences and special needs (e.g., primary language spoken, preferred
language for medical information, religious affiliation, disabilities, cultural needs,
and dietary needs).
— There are no uniform standards and little outcome measurement regarding cultural
competency training.
Education and training curricula.
— Workforce effectiveness depends in part on the degree to which health
professionals and practice organizations use evidence-based practices when
delivering care. There is an insufficient or inadequate use of clinical evidence-
based practices or effective interventions across many health professions. For
example, the IOM details ongoing deficiencies in graduate education, including

Access to Care
Texas State Health Plan 2011-2016 143
insufficient attention to scientific, evidence-based treatment or guidelines, lack of
inter-disciplinary training, and reluctance to embrace competency-based training,
even in light of a long history of initiatives designed to improve the mental health
workforce.
— The general absence of standards or guidelines regarding content of education
and training in behavioral health professions raises concerns that many
practitioners may not become educated about critical, emerging issues in the
behavioral health field. [16]
— Collaborative education can serve to increase health professionals’ knowledge
of core competencies, which could include disease prevention, lifestyle change,
diet, nutrition, exercise, stress reduction, environmental toxins, and other issues
not traditionally addressed well in education programs.
Peer support specialists.
— Insufficient number of training and certification programs exists to ensure
that certified PSSs meet core competencies.
— There is a lack of standardization of training and certification requirements,
as well as, a lack of requirements for continuing education and supervision
and other requirements that improve credibility of PSSs.
— Awareness among health professionals about the critical role of PSSs in the
behavioral health delivery system is needed.
Community health workers. There is widespread agreement that continuing or refresher
training is as important as initial training for CHWs.
iii. Workforce Preparation and Effectiveness - Recommendations to Consider
Identify and incorporate core competencies into the health workforce infrastructure
through enhanced education and training curriculums, teaching methods, and alignment
with licensing and accreditation standards (consider also incorporating such
competencies into job descriptions and performance appraisals).

Access to Care
Texas State Health Plan 2011-2016 144
Incorporate uniform standards for core competencies across all health professions groups
including, at a minimum: health literacy skills, cultural and linguistic competency,
knowledge of evidence-based clinical or preventive care practices, knowledge of and
adoption of recovery principles of behavioral health practices (when serving persons with
behavioral health conditions), and knowledge of medical home and integrated health
practice models.
Examine and enhance academic curricula to determine whether students are acquiring
core competencies identified as important across health profession disciplines.
Support and participate in more research in the area of cultural competence training
and corresponding standards and outcomes may need to be considered as a priority for
higher educational institutions.
Better prepare and train new graduates to enter the workforce with competencies in core
areas by practice organizations’ building in ongoing training and allocating time and
resources for competency-based continuing education. [24, 25]
Develop innovative strategies to increase bilingual therapists in behavioral health.
Encourage and support local business and other community organizations (such as local
government and chambers of commerce) to develop initiatives to “grow their own” by
providing scholarships and other tuition assistance to students and employees who wish
to advance their skills; and encourage communities to support student training and career
development for mental health professions in rural areas.
Expand application of distance learning and technologies such as web-based training,
telemedicine and teleconferencing and creative use of personal digital assistants or PDAs
to build professional capacity in health education and clinical care, and to expand
consumer/patient access to treatment, especially in underserved areas.

Access to Care
Texas State Health Plan 2011-2016 145
Enhance and provide training in primary care-based integrated care practice models to
medical and mental health students and professionals.
Utilize higher education-employer partnerships to create paid on-the-job training for
students and create a pathway into a job and career ladder.
Community health workers (CHWs). Training should be competence and practice-based
and located close to CHWs’ working context with built in continuing education and
refresher courses.
Peer support specialists.
— Replicate and expand the state level certification program, which is currently
being implemented for the first time in Texas.
— Require the use of PSSs in LMHAs, as part of the behavioral health workforce.
— Enhance education and awareness among health professionals about the important
role of PSSs in the behavioral health services delivery system.
Create innovative multidisciplinary educational experiences, training and guidelines for
all licensed health professionals.
SERVICE DELIVERY INFRASTRUCTURE The medical home and integrated health models provide frameworks for safe, effective, easy to
access high quality health services. Both models, by design, seek to deliver care that is personal,
comprehensive, and individualized to accommodate individual differences in patient/consumer
understanding of health and their desire for improved health and well-being.

Access to Care
Texas State Health Plan 2011-2016 146
The medical home model. The term medical home was first used in 1967 by the American
Academy of Pediatrics as an ideal for the care of children with special health care needs. The
medical home, where primary care doctors are held responsible for coordinating care for
individual patients, acknowledges the vital role of primary care at the core of quality health care
delivery. In 1992 the American Academy of Pediatrics established principles for the medical
home, including care that was accessible, continuous, comprehensive, family-centered,
coordinated, compassionate, and based on trusting relationships. In 2007 the American College
of Physicians, American Academy of Family Physicians, American Academy of Pediatrics, and
American Osteopathic Association adopted consensus principles of the "patient-centered medical
home. The National Committee for Quality Assurance released Physician Practice Connections-
Patient-Centered Medical Home (PPC-PCMH), a set of voluntary standards for the recognition
of physician practices as medical homes. [26] The patient-centered medical home’s success can
be attributed to its incorporation of a set of core principles including: comprehensive primary
care, relationship-centered care, reimbursement reform, and the practice redesign knowledge that
had been well established. [27]
Integrated health care model. Integrated health care is an emerging national movement to
improve people’s health by treating physical and behavioral illnesses together. Integrated health
care refers to the systematic coordination of physical and behavioral health care. Integrated
behavioral health and primary care occurs when behavioral health specialty and general medical
care providers work collaboratively to address both the physical and behavioral health needs of
patients. Integrated health care has emerged to address the fact that physical and behavioral
health problems often occur at the same time, and that integrating services to treat both will
result in improved access to care and better health outcomes for patients/consumers.
HEALTH SYSTEMS
i. Findings Related to Service Delivery Infrastructure

Access to Care
Texas State Health Plan 2011-2016 147
The medical home.
— The “medical home", now referred to as a "patient-centered medical home,"
represents a shift in focus from clinician-driven care to collaborative patient-
physician relationship–based care.
— Medical home models promote better access to healthcare, increases
satisfaction with care, improves health outcomes, and reduces cost.[9, 28]
— The medical home addresses aspects of inefficiencies in a currently fragmented
system. [29]
— Patients want access to comprehensive primary care through medical homes or
similar concepts. A 2008 review by Rosenthal determined that peer-reviewed
studies who “improved quality, reduced errors, and increased satisfaction when
patients identify with a primary care medical home.”[29]
— Team based care is at the core of the clinical approach used in the patient-
centered medical home, which provides care management and supports
individuals in their self- management goals.
— Care management is central to the shift in health delivery redesign of medical
homes, away from a focus on episodic acute care to a focus on care for longer-
term and recurrent (chronic) conditions.
— Patients’ role. It is well established that meaningful engagement of patients in
medical care is required for the attainment of the best outcomes, however, there is
still much to learn about truly meeting patients’ needs and engaging patients
meaningfully in their care. Improved patient engagement is bidirectional. These
practices seek to involve individuals more directly in managing their own health,
and individuals become more knowledgeable and interact with practices in new
ways.
Integrated health care.
— Holistic approach. Health is multi-dimensional and multi-factorial. Health and
wellbeing spans beyond the traditional boundaries of either the general health or
the behavioral health service system and includes the need for multiple services

Access to Care
Texas State Health Plan 2011-2016 148
and community supports to address all dimensions of health as part of overall
health.
— Most people seek help for behavioral health problems in primary care
settings. About half of the care for common psychiatric disorders like depression
is provided in primary care settings instead of specialty behavioral health settings,
regardless of the severity of a person’s psychiatric disorder. People generally
prefer to be treated in primary care due to:
Cultural beliefs and attitudes toward mental illness, especially people of
color;
Proximity to a specialty mental health clinic, as is especially true in rural
areas such as sparsely populated areas of South and West Texas;
Lack of insurance or insurance that doesn’t adequately cover behavioral
health services; and restrictive eligibility for specialty mental health care.
— Integrated health models have been shown to improve access to medical and
primary care, as well as behavioral health care (especially for people with
comorbid physical and behavioral problems); improve communication between
providers and patients; and reduce the use of emergency room and urgent care
services.
Other similar models incorporate the following elements into the service delivery
infrastructure.
— Interdisciplinary models of care delivery. IOM reports that interdisciplinary
care results in increased patient satisfaction and improved health outcomes.
Interdisciplinary care models are considered a best practice, and are designed to
manage and coordinate care across primary care and specialty care using
interdisciplinary teams.[30]
— Leverages collaboration and shared treatment across primary care and
behavioral health systems.
— Coordination of healthcare across health disciplines, systems, and medical and
non-medical services is necessary to meet the needs of patients with complex
and/or comorbid conditions.

Access to Care
Texas State Health Plan 2011-2016 149
— Comprehensive care. Patients with complex and/or comorbid conditions and/or
disabilities often need access to a range of coordinated medical care, primary
care, specialty care, and natural supports to ensure continuity across levels of care
(inpatient, outpatient, etc.)
— Person-centered approaches to care delivery. People want care that is personal;
and care that is geared to their own understanding of health and their expectations
for restored or maintained capacity. Person-centered care should provide
education, advice and support on lifestyle choices, such as smoking, nutrition,
exercise, and drugs and alcohol. It also should offer support and advocacy for
family problems, poverty, housing, and education.
— Empowering patients by providing information and education to better
manage and improve their health/educates patients on tools of self-management.
— Accountability for competencies in the public health workforce.
Competencies built into job descriptions and/or built into performance appraisal
systems. [24, 25]
Shifting the focus of the health care system from disease to health requires new models of
care.
The chronic disease epidemic calls for a new model of care that emphasizes education and
peer support that can be provided in a group visit with a team-based approach.
Education and training of mental health professionals.
— The IOM notes that recent graduates of mental health and substance professionals
are unprepared for the realities of practice in real-world settings, or worse, have to
unlearn an array of attitudes, assumptions and practices developed during
graduate training that hinder their ability to function. [16]
— The IOM indicates that “continuing education for all segments of the workforce
tends to rely on single-session, didactic approaches, which have proven
ineffective in changing work force practice patterns.”

Access to Care
Texas State Health Plan 2011-2016 150
— The content and teaching methods in professional continuing education programs
are outdated and few guidelines exist for the content of continuing education.
ii. Needs Related to Service Delivery Infrastructure
Medical homes and integrated health models: Elements of health leaders and health
systems.
— There is a need to conceptualize and more clearly articulate the health home
model to include the role of behavioral health, despite close alignment between
the features of the medical home and the core components of research-based
approaches to treating depression in primary care settings (e.g., Improving Mood
– Promoting Access to Collaborative Treatment for Late-Life Depression
(IMPACT) model).
— Training related to collaborative practice arrangements interagency systems
and interdisciplinary teams for primary care and behavioral health professionals
is needed.
— There is a need to develop policies and regulations that support the increased
use and development of full-scope medical or health homes/integrated health care
sites.
— Few health professional institutions have required courses on interdisciplinary
care or have integrated the concept of interdisciplinary care into the overall
curriculum. [31] For example, both primary care and behavioral health providers
often are not trained or educated about how to work in an integrated setting,
resulting in a disconnect between the two cultures of care. Education in medical
schools should include a common set of values, across professions, and
incorporate interprofessional educational experiences.
— There is a lack of training and education by clinical and public health
professionals to address preventable secondary conditions in people affected
with disabilities.

Access to Care
Texas State Health Plan 2011-2016 151
— Accountability for competencies in the public health workforce. There is a
lack of standardization and accountability to assure that public health workers and
other health professionals and paraprofessionals have core competencies.
iii. Service Delivery Infrastructure - Recommendations to Consider
Develop policies to enhance and expand health home and integrate healthcare models
(e.g. legislation and/or pilot initiatives) shifting the focus of health care system from an
illness to a wellness model.
Encourage physician practices to embrace the concept of health homes and integrated
health, utilizing care management, cross disciplinary team-based care, and patient-
centered practices to enhance preventative care and improve management of chronic
disease.
Outcome-focused care. Identify and convert payment and contracting mechanisms to focus
on health outcomes and quality of care versus volume of health services provided.
Adopt bi-directional approaches to integrated health care delivery; addressing the
integration of primary care services in behavioral health settings, as well as, the need for
behavior health services in primary care settings.
Work with the statewide integration workgroup led by HHSC to align educational
curricula, practice standards and assure best practices for effective healthcare delivery;
create policies and regulations that support the delivery of integrate health care
approaches.
Develop and advance a statewide effort to coordinate health services with faith-based
programs and other community organizations that offer transportation assistance (e.g.,
organization that transports people to medical appointments, Meals on Wheels, etc.).
Access to Care
Texas State Health Plan 2011-2016 152
Accountability for competencies in the public health workforce. Incorporate core
competencies into the public health workforce infrastructure such as through education
and training curriculums, job descriptions, and performance appraisals. Core
competencies should include, at a minimum: interdisciplinary care, health literacy skills,
cultural competency, knowledge of evidence-based treatment and clinical practices,
knowledge of and adoption of recovery principles of behavioral health practices, if
applicable, and bilingual in Spanish speaking skills, when relevant and necessary.
Develop policies and contractual agreements that prioritize integrated relationships among
PCPs, physician subspecialists, CHWs and PSSs in practice settings.
Training and education.
— Institutionalize interdisciplinary education and training in health professional
institutions. [31]
— Develop more effective educational models for interdisciplinary, integrated and
single point of entry care models (such as integrated health and medical homes).
— Develop inter professional education and competence-based certifications for
broadly defined practices, such as health-life coaching and CHW and PSS
certifications that could be undertaken by a variety of professions including health
educators, nurses, and nutritionists. People who train together often practice
together.

Access to Care
Texas State Health Plan 2011-2016 153
BUILDING A HEALTH CARE FRAMEWORK TO MEET THE NEEDS OF A
DIVERSE POPULATION
A. HEALTH DISPARITY
Health disparities refer to gaps in the quality of health and health care across racial, ethnic,
sexual orientation and socioeconomic groups.[32] In the United States health disparities have
been well documented. While the root cause cannot be traced to a single etiology, many of the
areas that have been addressed as reasons for disparities in access to health care may include the
following: lack of insurance coverage, lack of regular source of care, legal barriers such as public
insurance programs, structural barriers such as poor transportation or excessive time spent in
waiting room, scarcity of providers in inner cities, rural areas and communities with high
concentration of minority populations, linguistic barriers, health literacy, lack of diversity in the
health care workforce, cultural issues, and age.
Effective communication between the health care provider and patient is core to effective health
outcomes and patient safety. Communication is critical for the delivery of appropriate and
effective medical care. There are numerous barriers that exist that can lead to health disparities.
Barriers affecting the ability to communicate with patients, lack of understanding by the patient,
language differences, low English proficiency and cultural barriers are often cited as prominent
causes or challenges to effective health care.
B. HEALTH LITERACY
What is health literacy? Health literacy is the degree to which individuals have the capacity to
obtain, process, and understand basic health information and services needed to make
appropriate health decisions.[32] More plainly stated it is the ability to read, understand and act
on health information.

Access to Care
Texas State Health Plan 2011-2016 154
Health literacy also includes numeracy skills. These may include the ability to understand what a
normal blood glucose level is and what action to take if the glucose level is too high or too low.
Other areas include measuring medication doses, understanding and choosing between health
plans, comparing prescription drug coverage and understanding co-pays, co-insurance and
deductibles.
Health literacy also involves some basic knowledge of health topics including how the body
functions, and the nature and causes of disease. Persons with low health literacy may have
difficulty communicating information regarding their health history with their physician or
health care provider, and have problems completing often complex forms regarding medical
information.
Current health information can overwhelm even individuals with good literacy skills. For
persons with low health literacy the ability to follow self-care and disease management
instructions may truly be overwhelming. Populations most likely to experience low health
literacy are older adults, racial and ethnic minorities, individuals with less than a high school
degree or GED certificate, people with low income levels, non-native speakers of English, and
people with compromised health status.[33] The 2003 National Assessment of Adult Literacy
indicated that only 12 percent of adults have proficient health literacy. Fourteen percent of
adults have below basic health literacy. These adults were more likely to report poor health and
more likely to lack health insurance than adults with proficient health literacy.[34]
Research studies have shown that persons with limited health literacy skills are more likely to
skip or not understand the importance of preventive measures such as mammograms, Pap
smears, prostate exams and influenza vaccinations.[35] Studies have further demonstrated that
persons with limited health literacy skills have a higher rate of hospitalization and use of
emergency services.[36]
The mismatch between a medical clinician’s ability to communicate with the patient and the
patient’s ability to understand can lead to adverse medical outcomes and medication errors. The
Institute of Medicine’s Health Literacy: A Prescription to End Confusion (2004) reports low

Access to Care
Texas State Health Plan 2011-2016 155
health literacy negatively impacts the treatment outcome and safety of care delivery.[37]
Patients with low health literacy are less likely to comply with treatment and more likely to make
errors with medication,[38] and are more ill when they seek medical care.[39]
Health care practitioners and health care organizations must be able to meet the needs of the
patient populations they serve. It is recommended that health care providers in Texas follow the
principles of best practices in health communication to ensure improved health literacy for
Texans. Best practices [39] include:
1. Identifying the intended user of the health information or services, their demographics,
behavior, culture and attitude. Materials and information should reflect the age, social and
cultural diversity, language preference and literacy skills of the intended user.
2. Evaluate the individual’s understanding before, during and after the introduction of
information and services.
3. Acknowledge cultural differences and practice respect. Cultural factors may include race,
ethnicity, language, nationality, religion, age, gender, sexual orientation, income level, and
occupation. Some examples of attitudes and values interrelated with culture include:
a. Accepted roles of men and women
b. Traditional medicine (Eastern, Chinese, Ayurvedic, Southwest folk medicine) versus
Western medicine
c. Food and diet
d. Manner of dress and modesty issues
e. Body language, particularly whether touching or proximity is permitted in specific
situations.
4. Limit the amount of information or number of messages delivered. Use plain language and
focus on action.
5. Supplement instructions with pictures.
6. Make written communication easy to read (font, amount of characters, use headings and
bullets and leave plenty of white pace around the margins).
7. Ask open ended questions. Never ask “Do you understand?”
8. Use a medically trained interpreter.
9. Check (validate) understanding.

Access to Care
Texas State Health Plan 2011-2016 156
10. Health care providers should undertake plain language and cultural competency training.
C. CULTURAL COMPETENCY
Of the many root causes of health disparities that have been documented, variations in patients’
health beliefs, values, preferences and behaviors are often prominent.[40] Two landmark IOM
reports – Crossing the Quality Chasm and Unequal Treatment, highlight the importance of
patient-centered can cultural competence in improving quality of care and eliminating racial and
ethnic health care disparities. [41, 42]
A culturally competent health care system has been defined as one that acknowledges and
incorporates at all levels, the importance of culture, assessment of cross-cultural relations,
vigilance toward the dynamics that result from cultural differences, expansion of cultural
knowledge, and adaptation of services to meet culturally unique needs. A culturally competent
system is also built on an awareness of the integration and interaction of health beliefs and
behaviors, disease prevalence and incidence, and treatment outcomes for different patient
populations.[40]
Cultural and linguistic competence is a set of congruent behaviors, attitudes, and policies
together in a system, agency, or among professionals that enables effective work in cross-cultural
situations.[43] Health services should be patient-centered, that is, respectful and responsive to
the health beliefs, practices and cultural and linguistic needs of culturally diverse patients to
bring about positive health outcomes.[43] A commitment to culturally competent care by all
health care providers is essential to meeting the needs of the racially and ethnically diverse
populations in Texas.
Health care outcomes may be influenced by many cultural factors including an individuals health
belief system and health-seeking behavior, how they perceive illness, pain, disease and their
causes, the person’s attitude toward health care provider, modesty and same gender provider
needs, who is the primary decision maker on health care decisions, and the providers own set of

Access to Care
Texas State Health Plan 2011-2016 157
values and understanding of diverse cultures. Culture many also affect how a person expresses
their symptoms and health concerns. A health provider’s lack of cultural awareness of the
values, customs, and knowledge of genetic and biologic factors associated with certain racial and
ethnic groups may further exacerbate the effects of the health care encounter.
Many individuals living in Texas have limited English proficiency because they were not born in
the United States or come from environments where another language other than English is
dominant. The use of a professional health care interpreter is critical for addressing the needs of
patients where language barriers exist. The National Council on Interpreting in Health Care
defines a professional health care interpreter as “an individual with appropriate training and
experience who is able to interpret with consistency and accuracy and who adheres to a code of
professional ethics.”[23] Interpreters can be present on on-site, or interpreting services can also
be provided by telephone or video.
Crucial to addressing cultural and linguistic barriers in health care is recruiting and sustaining a
diverse workforce. Recruiting a diverse workforce is not without challenges; the number of
minorities represented in the health professions remains low.
In order to integrate cultural competence into patient-centered care it is important to collect
information on patient needs. This information could include the patient’s gender, race,
ethnicity, age, primary language spoken, preferred language for medical information, religion,
disabilities, cultural needs, dietary needs and health literacy level. This information can be
extremely valuable in providing services and communication between patient and care-giver. A
wide-range of tracking systems are available to flag cultural needs such as stickers, color-coded
armbands to identify language barriers or language spoken.
The health professions in Texas have to be able to meet the health care needs of the populations
of the State. It is essential that health care curriculum includes the implementation or expansion
on the resources and didactic training courses to include education and training of the delivery of
culturally competent care based on the reality of evidence-based health disparities. Training can
and should involve faculty development workshops, videos and patients representing the

Access to Care
Texas State Health Plan 2011-2016 158
diversity of the population served. Consideration should be given to recruiting additional faculty
members who are skilled or experts in cultural diversity training and assessment methods. Cross-
cultural training and the changing of behaviors, attitudes and policies within the health
professions to address cultural competence are important to the health care outcomes of Texans.
According to the Agency for Healthcare Research and Quality providing culturally competent
should include the following culturally competency techniques:
Interpreter services
Recruitment and retention of a diverse workforce
Training to be able to serve respective communities
Coordinating with traditional healers – ability to adjust health care plans according to the
patient’s cultural beliefs and traditional healing practices
Use of Community Health workers – for example Promotoras de Salud
Culturally competent health promotion
Including family and/or community members when appropriate – this competency may be
vital to obtaining consent and adherence to treatments
Immersion into another culture
Administrative and organizational accommodations – they may include the location of
healthcare offices, public transportation availability, clinic hours, the physical
environment of the clinic, and the rapport built with the patients.
In her book on medical multiculturalism, The Spirit Catches You and Your Fall Down: Among
Child, Her American Doctors, and the Collision of Two Cultures, Fadiman writes, “Western
medicine is one-sided. Doctors endure medical school and residency to acquire knowledge that
their patients do not have…. It would be asking a lot of them to consider, much less adopt, the
notion that their view of reality is only a view, not a reality itself. “14Advancing this perspective
within our current health systems will require that all health care providers are prepared to
explore their personal cultural perspectives and the impact of ethnocentrism on health and health
care. The focus should be on patient autonomy, learners should be taught how to educate their
patients regarding clinical issues, be willing to accept patient decision making, and partner fully
with them to achieve the best health care outcomes.[44]

Access to Care
Texas State Health Plan 2011-2016 159
REFERENCES
1. Texas Health and Human Services Commission.
2. Briefing paper submitted in May 2008 to a Senate interim committee studying health
workforce issues in Texas. May 2008, Hogg Foundation for Mental Health.
3. Bindman, A.B., et al., Preventable hospitalizations and access to health care. JAMA,
1995. 274(4): p. 305-11.
4. Hochheiser, L.I., K. Woodward, and E. Charney, Effect of the neighborhood health
center on the use of pediatric emergency departments in Rochester, New York. N Engl J
Med, 1971. 285(3): p. 148-52.
5. Hurley, R., Freund, DA, Taylor, DE, Emergency room use and primary care case
management: Evidence from four medicaid demonstration programs. Am J Public
Health, 1988. 79: p. 843-846.
6. Wasson, J.H., et al., Continuity of outpatient medical care in elderly men. A randomized
trial. JAMA, 1984. 252(17): p. 2413-7.
7. Baicker, K. and A. Chandra, Medicare spending, the physician workforce, and
beneficiaries' quality of care. Health Aff (Millwood), 2004. Suppl Web Exclusives: p.
W184-97.
8. Robst, J., Graham, G., The Relationship between the Supply of Primary Care Physicians
and Measures of Health. Eastern Economic Journal, 2004. 30.
9. Starfield, B., et al., The effects of specialist supply on populations' health: assessing the
evidence. Health Aff (Millwood), 2005. Suppl Web Exclusives: p. W5-97-W5-107.
10. Spann, S.J., Report on financing the new model of family medicine. Ann Fam Med, 2004.
2 Suppl 3: p. S1-21.
11. The Complexities of Physician Supply and Demand: Projections Through 2025. 2008,
Association of American Medical Colleges.
12. Primary care professionals - Recent supply trends, projections, and valuation of services,
in United States Government Accountability Office. Committee on Health, Education,
Labor and Pensions. 2008, US Senate: Washington, DC.

Access to Care
Texas State Health Plan 2011-2016 160
13. Grumbach, K., The ramifications of specialty-dominated medicine. Health Aff, 2002.
21(1): p. 155-157.
14. Schroeder, S.A., The making of a medical generalist. Health Aff (Millwood), 1985. 4(2):
p. 22-46.
15. Cawley, J.F., Physician assistants are an asset to health workforce policy reform.
JAAPA, 2009. 22(7): p. 10.
16. The Mental Health Workforce in Texas: A Snapshot of the Issues. 2007 [cited; Available
from: http://www.hogg.utexas.edu/PDF/TxMHworkforce.pdf.
17. Texas Comptroller of Public Accounts [cited; Available from:
http://www.window.state.tx.us/specialrpt/rural/summary.html.
18. U.S. Census Bureau, "2000 Census of Population and Housing, Population and Housing
Counts,"
19. Anthony, E. and A. Richard, Literature Review: Influencers on Physician Choice to
Practice in Rural Areas. 2004, Tulane University Health Sciences Center, School of
Public Health and Tropical Medicine.
20. Texas Department of State Health Services, Center for Health Statistics.
21. Supply Trends Among Licensed Health Professions, Texas, 1980 - 2009. 2009 [cited;
Forth:[Available from: http://www.dshs.state.tx.us/CHS/HPRC/09trends.pdf.
22. The National Plan for Action: Changing Outcomes Achieving Health Equity. 2009
[cited; Available from: http://minorityhealth.hhs.gov/npa/images/plan/nationalplan.pdf.
23. The Terminology of Health Care Interpreting: A Glossary of Terms. National Council on
Interpreting in Health Care 2001 [cited; Available from:
www.hablamosjuntos.org/pdf_files/TheTerminologyofHealthCareInterpreteing.pdf. .
24. Council on Linkages Between Academia and Public Health Practice. Core Competencies
for Public Health Professionals. More information available at
www.phf.org/competencies.htm; .
25. Public Health Functions Steering Committee. Essential Public Health Services. [Adopted
fall 1994.] More information available at www.health.gov/phfunctions/public.htm;.
26. National Committee for Quality Assurance. Physician Practice Connections–Patient-
Centered Medical Home (PPC-PCMH).

Access to Care
Texas State Health Plan 2011-2016 161
27. Kilo, C.M. and J.H. Wasson, Practice redesign and the patient-centered medical home:
history, promises, and challenges. Health Aff (Millwood). 29(5): p. 773-8.
28. Beal, A., et al., Results from the Commonwealth Fund 2006 Health Care Quality Survey.
June 2007, The Commonwealth Fund: New York.
29. Rosenthal, T.C., The medical home: growing evidence to support a new approach to
primary care. J Am Board Fam Med, 2008. 21(5): p. 427-40.
30. Hall, P. and L. Weaver, Interdisciplinary education and teamwork: a long and winding
road. Med Educ, 2001. 35(9): p. 867-75.
31. 2005 Fifth Annual Report to the Secretary of the U.S. Department of Health and Human
Services and to the Congress; Recommendations, Interdisciplinary, Community-Based
Linkages Title VII, Part D Public Health Service Act, in Advisory Committee on
Interdisciplinary, Community-Based Linkages.
32. Ask Me 3. Sponsored by the Partnership for Clear Health Communication at the National
Patient Safety Foundation. [cited; Available from: http://www.npsf.org/askme3/.
33. Office of Minority Health at http://www.omhrc.gov/ Phone: 434-982-2597.
34. Healthy People 2010. Objective 11-2. [cited; Available from:
http://www.healthypeople.gov/Document/pdf/uih/2010uih.pdf. .
35. The Newest Vital Sign: A Health Literacy Assessment Tool [cited; Available from:
http://www.annfammed.org/cgi/content/full/3/6/514.
36. Agency for Healthcare Research and Quality: Evidence Report/Technology Assessment:
Number 87 Literacy and Health Outcomes. [cited; Available from:
http://www.ahrq.gov/clinic/epccums/litsum.htm.
37. National Center for Education Statistics. NAAL fact sheets. Health literacy component.
http://nces.ed.gov/naal/fct_hlthliteracy.asp.
38. Sentell, T.L. and H.A. Halpin, Importance of adult literacy in understanding health
disparities. J Gen Intern Med, 2006. 21(8): p. 862-6.
39. Davis, T., et al., Rapid Estimate of Adult Literacy in medicine: a shortened screening
instrument. . Fam Med, 1993. 25: p. 391-5.
40. Betancourt, J.R., et al., Defining cultural competence: a practical framework for
addressing racial/ethnic disparities in health and health care. Public Health Rep, 2003.
118(4): p. 293-302.

Access to Care
Texas State Health Plan 2011-2016 162
41. Crossing the Quality Chasm: A New Health System for the Twenty-first Century. 2001,
Institute of Medicine: Washington, DC.
42. Smedley, B., A. Stith, and A. Nelson, Unequal Treatment: Confronting Racial and
Ethnic Disparities in Health Care. National Academies Press, 2002.
43. What is Cultural Competency? The Office of Minority Health. US Department of Health
and Human Services [cited 2010; Available from:
http://minorityhealth.hhs.gov/templates/browse.aspx?lvl=2&lvllD=11.
44. Hobgood, C., et al., Teaching culturally appropriate care: a review of educational
models and methods. Acad Emerg Med, 2006. 13(12): p. 1288-95.


SECTION IV
TECHNOLOGY


Technology
Texas State Health Plan 2011-2016 167
The Statewide Health Coordinating Council (SHCC) Technology Committee examines the ways
Tele/Health Information Technology (HIT), namely the Electronic Medical Records,
Telemedicine, and the Health IT Workforce Development enhances the efficiency and quality of
institutional healthcare thereby improving the delivery of medical treatment and collaborative
efforts among physicians, dentists, nurses, physician assistants, medical specialists and support
staff members. The Technology Committee Members included representatives from large and
small employers in Texas, hospitals, health policy experts and community/business leaders. The
Technology Committee reviewed data, identified and assessed use of policies, tool and
technologies in Texas, and made recommendations for consideration for policymakers.
Findings of the Technology Committee
• Telemedicine Services are underutilized by Texas healthcare professionals
• Investment in training for the use of Telemedicine is critical to its success of HIT
• HIT is essential for establishing the ability to track Telemedicine utilization
• Texas telemedicine legislation currently addresses the participation of various health
providers, including physicians, dentists, chiropractors, nurses, and other health
professionals.
• Telemedicine holds the potential for the greatest economical impact on the rising
health costs during century in the State of Texas.
Technology Committee Conclusion
• The need and interest to collaborate among telehealth stakeholders, including
patients, patient communities, research funders, researchers, healthcare services
providers, professional societies, industry, healthcare management/economists, and
healthcare policy makers
• The development, marketing, adoption, and implementation of these tools and
technologies, communication, training, cultural sensitivity, and end-user
customization are critical pieces to the process.
• Next generation tools and technologies are vehicles toward personalized medicine,
extending the telemedicine model to include cell phones and Internet-based

Technology
Texas State Health Plan 2011-2016 168
telecommunications tools for remote and home health management with video
assessment, remote bedside monitoring, and patient-specific care tools with event
logs, patient electronic profile, and physician note-writing capability. Telehealth is
ultimately a system of systems in scale and complexity.
• To cover the full spectrum of dynamic and evolving needs of end-users, we must
appreciate system complexity as telehealth moves toward increasing functionality,
integration, interoperability, outreach, and quality of service. (Ackerman MJ HIM J.
2009)
General Overview of the State of Texas Healthcare Costs
In fiscal year 1998, Texas spent 40% of the state’s budget on Health and Human Service (HHS)
accounted for greatest portion of the state’s budget. After factoring in health spending for state
employees, university employees and persons in the criminal justice system, HSS state spending
far exceeded Texas educational costs and represented the single largest burden of state spending,
a problem that continues to plaque the state’s budget. Current factors contributing to the rise in
the state’s healthcare spending include the steady rise in aging population, overwhelming
increases in obesity-related illnesses, and a growing prison population, emerging disease threats,
andmost importantly the limited access to healthcare spiking expensive emergency room visits
due to the shortage of healthcare professional available to meet the state’s healthcare needs.
Today, major government efforts are underway to widen the use of HIT and to converge the
rapid growth of the Internet to create unprecedented opportunities to use telehealth networks to
broaden access to high-quality healthcare networks to improve health outcomes (Doam, Portilla
and Sayre 2010). In February 2009, for example, United States President BarackObama signed
the Health Information Technology for Economic and Clinical Health (HITECH) Act as a part of
the US economic stimulus package. To qualify for funds under this Act, providers need to show
“meaningful use” of EHRs, which must include patient demographic and clinical health
information (such as medical history), provide clinical decision support, support physician order
entry and capture information about health care quality. The Act provides $17.2 billion in

Technology
Texas State Health Plan 2011-2016 169
incentives through Medicare and Medicaid to help providers adopt EHRs. Large hospitals can
receive payments for a 4-year period starting in 2011, and physicians can receive incentives up to
$44,000. More recently the National Institute of Health held a national conference bringing
together experts in government, academia and industry to discuss telehealth research and
development to use telehealth networks to broaden access to high-quality healthcare and to
expand the scope and reach of clinical and translational research (Doam, Portilla and Sayre
2010).
Telemedicine and Telehealth Programs
Telemedicine programs provide specialty health services to remote populations using
telecommunications technology. Two-thirds of healthcare organizations use telehealth for
clinical or non-clinical purposes, according to a 2009 Healthcare Intelligence Network survey
(Donovan 2010). This innovative approach to medical care delivery has been expanding for
several years and currently covers various specialty areas such as medical specialties including
cardiology, pathology, radiology, endoscopy, pediatric, orthopedics, dermatology, psychiatry,
pharmacy, surgery, obstetrics, diabetic patient management, ophthalmology, and otolaryngology
(Guler and Ubeyli 2002).
Wireless device for Mobile Patient Diabetes Monitor
GlucoMON is the first wireless device for automatically transmitting hypoglycemic test results
from a child's self-test glucose meter from anywhere to anywhere. The real benefit delivered in
their initial service is to provide a timely remote connection between parent and child and to
understand compliance to the expected glucose-testing regimen. The GlucoMON requires the
OneTouch Ultra from Lifescan, Inc. These customized glucose alerts may be delivered as either
text or digital voice messages to any phone, fax, pager or email. The bundled service plan may
be purchased as a 12-month subscription at $33/mo. at www.glucomon.com or call Diabetech
toll-free at 866.235.7268. This system allows for telemedicine without requiring any
understanding of technology, no computers required, no internet, etc... In addition, the IVR
components and outcall features allow individuals to add other diabetes relevant data to their
patient record via plain old telephone service. Proprietary and client defined risk-based

Technology
Texas State Health Plan 2011-2016 170
algorithms are used to trigger alerts to various members of the diabetes team whereby they then
take the appropriate action (ATSP 2008) . The GlucoMON program 100% privately funded and
currently not being evaluated.
UTMB Telehealth Center
The University of Texas Medical Branch (UTMB) has a long-standing history of advancing the
use of telecommunications technology to improve health care delivery to rural and underserved
populations of Texas. Founded in 1998, the UTMB Telehealth Center serves as the hub for the
university's broad array of telehealth activities, including clinical services, educational programs,
and research and development. The Telehealth Center at the University of Texas Medical
Branch in Galveston (UTMB), working in partnership with Stephen F. Austin State University in
Nacogdoches and Lamar University in Beaumont, proposes to develop a model for establishing a
network of telehealth technical assistance centers across the U.S. to serve as a focal point for
advancing the cost-effective application of telehealth services in multi-state regions. The
establishment of the SBC Telehealth Research Center to Identify medical specialties that best
lend themselves to telehealth technology, standardized protocols that can be recommended to
providers for optimum use of teletechnology, compare telehealth with more traditional
approaches, highlighting differences and similarities in cost and health outcomes, develop
standardized tools for measuring and reporting the outcomes and benefits of telehealth
technology and publish and present the results of telehealth research at conferences throughout
the world. The UTMB programs received public and private funded and self evaluated programs
(ATSP 2008).
Texas Medicaid Program
Only a small number of Texas physicians use telemedicine services, according to the Texas
Health and Human Services Commission's end-of-year report to the state Legislature on the
effects of telemedicine on the Texas Medicaid program. According to the report, the finding
could be attributed in part to the way health care providers report the use of telemedicine

Technology
Texas State Health Plan 2011-2016 171
services. In the report, the commission said it planned to make changes designed to boost the use
of telemedicine services, including:
• Reimbursing for more types of medical services provided through telemedicine;
• Expanding the number of approved patient-site health care providers;
• Removing limitations on telemedicine providers;
• Adding reimbursement of a facility fee payable to the patient site; and
• Allowing patients to receive telemedicine services at local health departments.
The report further added, "HHSC is also increasing its ability to track telemedicine utilization
and distinguish between patient and distant sites, thereby increasing the ability to further analyze
the use of telemedicine in Texas Medicaid" (Hanson, Government Technology, 1/5).
Telemedicine Services Underutilized by Texas Physicians, (HHSC, Telemedicine Services
Underutilized by Texas Physicians January 06, 2009)
Economic Evaluation of Telemedicine
Although telemedicine programs were initiated several decades ago and have experienced rapid
growth ever since, the rigorous economic evaluation of such programs remains rare. Economic
Evaluation of Telemedicine remains rare, and few of those conducted have accounted for the
wide range of economic costs and benefits. Rigorous benefit–cost analyses of telemedicine
programs could provide credible and comparative evidence of their economic viability and thus
lead to the adoption and=or expansion of the most successful programs. (Marı´a E. Da´valos
2009).
Research Gaps, Limitations, and Challenges with the Economic Evaluation of Telemedicine
• Given the heterogeneity of telemedicine programs, most of the results cannot be
generalized.
• There is no uniform methodology or guidelines to conduct standardized economic
evaluation in telemedicine.

Technology
Texas State Health Plan 2011-2016 172
• Most economic evaluations focus on program costs, and have not deeply researched a
broad range of economic benefits from a variety of perspectives.
• Long-term studies in telemedicine are rare so that sustainability of these initiatives
cannot be studied.
• Shortage of appropriate data undermines the quality and reliability of economic
evaluation.
• Telemedicine programs usually involve small samples, thus posing important
statistical limitations.
(Marı´a E. Da´valos 2009)
It is important to fully realize the range of telemedicine programs both from an economical and
societal benefit through the adoption and/or expansion benefit-cost analyses for decision makers
to compare different programs and to make an informed decision to rising health costs during in
century in the State of Texas.
The Need for Aggressive Governance and Fresh Solution to Healthcare Issues
Faced with an aging population, rising healthcare cost and new disease threats, many healthcare
organizations are seeking new techniques to deliver quality healthcare timely, cost effective and
efficient manner. In response to today’s challenges the State of Texas, hospitals, health plans,
health care institutes, health carepayers and service organizations are increasingly rethinking
their traditional models for providing healthcare and so the focus needs to be on the development
of next-generation telemedicine tools and technologies, patients, systems, and data perspectives’.
Key drivers for these tools and technologies are
• The need and interest to collaborate among telehealth stakeholders, including
patients, patient communities, research funders, researchers, healthcare services

Technology
Texas State Health Plan 2011-2016 173
providers, professional societies, industry, healthcare management/economists, and
healthcare policy makers
• The development, marketing, adoption, and implementation of these tools and
technologies, communication, training, cultural sensitivity, and end-user
customization are critical pieces to the process.
• Next generation tools and technologies are vehicles toward personalized medicine,
extending the telemedicine model to include cell phones and Internet-based
telecommunications tools for remote and home health management with video
assessment, remote bedside monitoring, and patient-specific care tools with event
logs, patient electronic profile, and physician note-writing capability. Telehealth is
ultimately a system of systems in scale and complexity.
• To cover the full spectrum of dynamic and evolving needs of end-users, we must
appreciate system complexity as telehealth moves toward increasing functionality,
integration, interoperability, outreach, and quality of service. (Ackerman MJ HIM J.
2009)


SECTION V
PREVENTION AND
EDUCATION


Prevention and Education
Texas State Health Plan 2011-2016 177
The focus of the Statewide Health Coordinating Council’s vision statement is that “prevention
and education are the primary approaches for achieving optimal health.” The 21st century has
many opportunities for new solutions. The state continues to have a shortage of health
professionals, rapid changes in the health care delivery system, and changing demographics. This
section of the Texas State Health Plan is divided into three sections. First, a new science-based
approach to promoting health and preventing disease by pursuing a more comprehensive and
“root cause” approach in early childhood. Second, approaches to change adult behavior and
promote lifelong health and prevention of adult disease. Third, discussion of the role of
educational institutions in ensuring that current and future generations are healthy. The
bibliography includes a list of the resources used for this report. Much of the information,
however, comes from the following:
• The National Scientific Council on the Developing Child. Harvard University.
Established in 2003. The National Scientific Council is a multi-disciplinary collaboration
of scientists and scholars from universities across the United States and Canada designed
to bring the science of early childhood and early brain development to bear on public
policy decision-making. The mission of The Council is to synthesize and communicate
science to help inform policies that promote successful learning, adaptive behavior, and
sound physical and mental health for all young children. Central to this concept is the
ongoing generation, analysis, and integration of knowledge and the critical task of
educating policymakers, civic leaders, and the general public about the rapidly growing
science of early childhood development and its underlying neurobiology.
• The National Center for Chronic Disease Prevention and Health Promotion (USPSTF)
comprises primary care clinicians (e.g. internists, pediatricians, family physicians,
gynecologists/obstetricians, and nurses). Individual members’ interests include: decision-
modeling and evaluation; effectiveness in clinical preventive medicine, clinical
epidemiology, prevention of high-risk behaviors in adolescents; geriatrics; and the
prevention of disability in the elderly.
• U. S. Department of Health and Human Services Office of the Surgeon General.
• Department of Health and Human Services Centers for Disease Control and Prevention.

Prevention and Education
Texas State Health Plan 2011-2016 178
A rich body of scientific knowledge is available about the developing brain, the human genome,
molecular biology, and the interdependence of cognitive, social, and emotional development
(Center on the Developing Child, 2007). The healthy development of young children provides a
strong foundation for a lifetime of physical and mental health (Shonkoff, Boyce, McEwen,
2009). The basic principles of neuroscience indicate that early preventive intervention will be
more efficient and produce more favorable outcomes than remediation later in life (Center on the
Developing Child, 2007).
A cross-disciplinary examination of research in economics, developmental psychology, and
neurobiology reveals a striking convergence on a set of common principles that account for the
potent effects of early environment on the capacity for human development (Knudsen, Heckman,
Cameron, Shonkoff, 2006). Central to these principles are the findings that early experiences
have a uniquely powerful influence on the development of cognitive and social skills and on
brain architecture and neurochemistry, that both skill development and brain maturation are
hierarchical processes in which higher level functions depend on, and build on, lower level
functions, and that the capacity for change in the foundations of human skill development and
neural circuitry is highest earlier in life and decreases over time (Knudsen, Heckman, Cameron,
Shonkoff, 2006).
Early experiences exert particularly powerful influences at a time when foundational skills and
behavioral patterns are being established and when underlying neural circuits are most plastic
and optimally receptive to alteration at fundamental levels of architecture, chemistry, and gene
expression. As the brain matures, experience continues to shape the neurobiology and behavioral
manifestations of cognitive, emotional, and social capacities that in turn facilitate the subsequent
development of a wide range of adult capabilities (Knudsen, Heckman, Cameron, Shonkoff,
2006). Although adaptation generally remains possible well into adult life, the decreasing
plasticity of the maturing brain indicates that early intervention to mitigate the effects of
disadvantaged environments is more efficient (in both energy costs to the nervous system and
program costs to society) than later remediation for individuals with limited skills and
problematic behavior (Knudsen, Heckman, Cameron, and Shonkoff, 2006).

Prevention and Education
Texas State Health Plan 2011-2016 179
Quality early care and education play an important role in prevention by accomplishing the
following:
1. Facilitating friendships and mutual support,
2. Strengthening parenting,
3. Responding to family crisis,
4. Linking families to services and opportunities,
5. Supporting parents,
6. Facilitating children’s social and emotional development, and
7. Observing and responding to early warning signs of child abuse and neglect.
These efforts lead to parental resilience; social connections; knowledge of parenting and child
development; concrete supports in times of need; and social and emotional competence of
children (Center for Study of Social Policy, 2009).
Results of research indicate that significant adversity impairs development in the first three years
of life (Shonkoff, Boyce, McEwen, 2009). These findings support a promising causal model of
how poverty, maltreatment, and discrimination in childhood can have adverse impacts on later
health, learning and behavior (Center for Developing Child, Harvard University, 2007).
Examples follow:
• Risk Factors for Adult Depression are embedded in adverse childhood experiences
(Chapman et al, 2004).
• Risk factors for adult heart disease are embedded in adverse childhood experiences
(Dong et al, 2004). Persistent stress produces excessive elevations in heart rate, blood
pressure, and stress hormones, which can impair brain architecture, immune status,
metabolic systems and cardiovascular function (Center for Developing Child, Harvard
University).
A healthier population begins with reducing toxic stress in childhood, not just trying to change
adult behavior. Effective early childhood programs offer an opportunity to promote lifelong
health and prevent adult disease as well as student learning success (Center for Developing
Child, Harvard University, 2007).
Prevention and Education
Texas State Health Plan 2011-2016 180
Mental illness issues are a major public health challenge. In the spring of 2008, the Centers for
Disease Control and Prevention convened a panel of experts to address opportunities for the
mental health and public health communities to work together. The panel included
representatives from the Substance Abuse and Mental Health directors and Academia. Highlights
of the panel recommendations follow:
1. Expansion of the nation’s surveillance capacity to address physical and mental health and
their intersection (Giles and Collins, 2010).
2. Professional development of public health and mental health workforces must include the
links between physical and mental health conditions. Frequently people with mental
illness also have serious physical health problems (Giles and Collins, 2010).
3. The public and mental health communities must address disparities. Success in improving
population-based physical and mental health outcomes requires addressing the root
causes of disparities, including poverty, education, employment, health care, and housing
(Giles and Collins, 2010).
Another major public health challenge is obesity. Obesity rates in the United States have
increased dramatically over the last 30 years and obesity is now epidemic. Data for 2003-2004
and 2005-2006 indicated that approximately two-thirds of adults and one-fifth of children in the
United States are obese or overweight (Department of Health and Human Services, Centers for
Disease Control and Prevention, July, 2009). Obesity is generally defined as excess body fat.
Because excess body fat is difficult to measure directly, obesity is often defined as excess body
weight as measured by “body mass index” (BMI) which is calculated as weight in kilograms
divided by height in meters squared (U.S. Department of Health and Human Services, The
Surgeon General’s Vision for a Healthy and Fit Nation 2010, Centers for Disease Control and
Prevention, 2010). In addition to consuming too many calories and not getting enough physical
activity, genes, metabolism, behavior, environment, and culture can also play a role in causing
people to be overweight and obese (The Surgeon General, 2010).
Being either obese or overweight increases the risk for many chronic diseases (e.g., heart disease,
type 2 diabetes, certain cancers, and stroke). Reversing the obesity epidemic requires a

Prevention and Education
Texas State Health Plan 2011-2016 181
comprehensive and coordinated approach that uses policy and environmental change to
transform communities into places that support and promote healthy lifestyle choices (Centers
for Disease Control and Prevention, 2010). Environmental factors such as a lack of access to
safe places to play and exercise, contribute to the increase in obesity rates by inhibiting or
preventing healthy eating and active living behaviors. The burden of obesity is
disproportionately borne by some racial and ethnic groups. For example, among 40 to 59 year
old women, about 52% of non-Hispanic blacks and 47% of Hispanics are obese; for non-
Hispanic whites the prevalence is 36% (U.S. Department of Health and Human Services, The
Surgeon General’s Vision for a Healthy and Fit Nation 2010, Centers for Disease Control and
Prevention, 2010).
Overweight and obesity exacerbates the duress on an already taxed healthcare system in Texas.
According to the Texas Health Institute, it is projected that overweight and obesity-attributable
costs will reach $15.9 billion in 2010. By 2040, that number will have more than doubled to $39
billion.
There are many opportunities for prevention of obesity. Interventions to prevent obesity should
focus not only on personal behaviors and biological traits, but also on characteristics of the social
and physical environment that offer or limit opportunities for positive health outcomes. Critical
opportunities for interventions can occur in multiple settings: home, child care, school, work
place, health care, and community (U.S. Department of Health and Human Services, The
Surgeon General’s Vision for a Healthy and Fit Nation, 2010).
While the ideal is for society to pursue a more comprehensive and “root cause” approach to
preventing and minimizing the impact of mental illness, chronic disease, and healthcare concerns
such as HIV AIDS, respiratory disease, diabetes, obesity, heart disease and cancer, the reality is
that we often have to work toward changing adult behavior. The U.S. Preventive Services Task
Force (USPSTF) sponsored by the Agency for Healthcare Research and Quality (AHRQ), is the
leading independent panel of private-sector experts in prevention and primary care. USPSTF
made recommendations about which preventive services should be incorporated routinely into

Prevention and Education
Texas State Health Plan 2011-2016 182
primary medical care and identified a research agenda for clinical preventive care. This
information is available to the public (www.ahrq.gov/CLINIC).
Chronic disease is any condition that requires ongoing adjustments by the affected person and
interactions with the health care system. The most recent data indicated that almost half of all
Americans (133 million) live with a chronic condition (Improving Chronic Illness Care, 2010).
According to the Centers for Disease Control and Prevention, chronic diseases such as heart
disease, stroke, cancer, diabetes and arthritis are among the most common, costly and
preventable of all health problems in the United States.
Chronic diseases are the leading cause of death and disability in the United States.
• Seven out of 10 deaths among Americans each year are from chronic diseases. Heart
disease, cancer and stroke account for more than 50% of all deaths each year.
• In 2005, 133 million Americans – almost one out of every two adults – had at least
one chronic illness.
• Obesity has become a major health concern. One in every three adults is obese, and
almost one in five youth between the ages of 6 and 19 is obese.
• About one-fourth of people with chronic conditions have one or more daily activity
limitations.
• Arthritis is the most common cause of disability, with nearly 19 million Americans
reporting activity limitations.
• Diabetes continues to be the leading cause of kidney failure, non-traumatic lower-
extremity amputations and blindness among adults.
In Texas:
• Heart disease accounted for 26% of deaths in 2005. In 2007, 28% of adults reported
having high blood pressure (hypertension).
• 22% of all deaths in 2005 were due to cancer.
• 5,605 adults died from diabetes mellitus in 2005. In 2007, 10% of adults in Texas
reported being diagnosed with non-pregnancy-related diabetes.

Prevention and Education
Texas State Health Plan 2011-2016 183
• In 2007, 24% of adults reported being diagnosed with arthritis.
Although chronic diseases are among the most common and costly of all health problems, they
are also among the most preventable. Chronic disease prevention, to be effective, must occur in
multiple sectors and across individuals’ entire life spans. Prevention encompasses health
promotion activities that encourage healthy living and limit the initial onset of chronic diseases.
Prevention also embraces early detection efforts, such as screening at-risk populations, as well as
strategies for appropriate management of existing diseases and related complications.
Researchers and practitioners at national, state, and local levels have designed, tested, and
implemented effective programs and policies for chronic disease prevention and control, many at
very little cost.
It is essential to have a coordinated, strategic prevention approach that promotes healthy
behaviors, expands early detection and diagnosis of disease, supports people of every age, and
eliminates health disparities. With community-based public health efforts that embrace
prevention as a priority, we can become a healthier state.
The Chronic Care Model promotes effective change in provider groups to support evidence-
based clinical and quality improvement across a wide variety of health care settings. The intent
is to transform health care from a system that is essentially reactive – responding mainly when a
person is sick – to one that is proactive and focused on keeping a person as healthy as possible
(Improving Chronic Illness Care, 2010). The Chronic Care Model improves care in health
systems at the community, organization, practice and patient levels.
The Chronic Care Model (CCM) identifies the essential elements of a health care system that
encourage high-quality chronic disease care. These elements are the community, the health
system, self-management support, delivery system design, decision support and clinical
information systems. Evidence-based change concepts under each element foster productive
interactions between informed patients who take an active part in their care and providers with
resources and expertise (Improving Chronic Illness Care, 2010). The model can be applied to a
Prevention and Education
Texas State Health Plan 2011-2016 184
variety of chronic illnesses, health care settings, and target populations. The bottom line is
healthier patients, more satisfied providers, and cost savings (Improving Chronic Illness Care,
2010).
The challenges of the 21st century require new strategies in prevention and education. To
effectively address those challenges, we need a new kind of leadership at every level of the
health care system (Thomas Lee, 2010). The specific kinds of work and performance measures
may differ from one setting to another, but the key responsibilities of leadership are the same.
New leaders must focus on outcomes and use performance measurement as a motivating tool to
drive improvements (Lee, 2010). The Cleveland Clinic and Seattle’s Virginia Mason Medical
Center are examples of how physicians use the culture of process improvement and disciplined
use of its methods such as data collection and impact analysis (Lee, 2010).
Results of review data regarding the Texas health professions workforce indicate there is still a
shortage in all areas. More must be done in the educating, training, recruitment, and retention of
health professions. An interest in health professions can be created and nurtured in elementary
and secondary schools. Community colleges play an important role in educating vocational
nurses and technicians in health care. In many cases a career path begins at the community
college and continues at the university level.
At a more fundamental level, the state must expand efforts to address health literacy. Health
literacy is the degree to which individuals have the capacity to obtain, process, and understand
basic health information and services needed to make good decisions. The ability to read and do
mathematics is a key component of health literacy. Math skills are important to measure
medication doses and in addressing health issues such as blood glucose levels. Individuals with
health issues need to be able to read and understand health plans, prescriptions, drug coverage
and other material linked to patient safety. For adults who lack these skills, there are adult basic
educations programs in the public schools and community colleges. Community colleges
continue to provide developmental education where adults can acquire mathematical and
communication skills.

Prevention and Education
Texas State Health Plan 2011-2016 185
The state must also promote and encourage partnerships between public schools and post-
secondary institutions in educating both the consumer and the public health professionals.
Partnerships between community colleges, universities, and hospitals can also help address the
training of the health workforce in Texas.
Policy Recommendations:
• Priority should be given to policies and programs that intervene early in the life cycle.
The plasticity of the nervous system and the ability to change behavior patterns decrease
over time as brain circuits stabilize and the energy costs of altering circuits increase. For
example, the program costs of remedial education grow with increasing age (Mercy,
2009).
• Continue efforts to improve immunization rates in Texas such as encouraging schools to
collaborate with local physicians, nurses, and organizations to improve immunization
rates.
• Access to basic medical care for pregnant women and children can help prevent threats to
healthy development, as well as provide early detection and intervention for problems
that emerge (National Scientific Council on the Developing Child 2007). For example,
improving Health and Nutrition: Given the multitude of preventable threats to brain
architecture early in life, high-quality health care and adequate nutrition before birth (for
pregnant women) and after birth (for both the primary caregiver and baby) are
fundamental to the promotion of healthy child development. Providing access to
affordable health services (including mental health care, when needed) is, therefore, one
of the most effective policies available for reducing prenatal and early childhood health
impairments. For example mothers who participate in the Supplemental Food Program
for Women, Infants, and Children (WIC) are less likely to bear low birth-weight or pre-
term infants, both of which are associated with lower educational achievement, lower
probability of employment, and lower earnings as an adult (Carroll, et. al. 2001).
• Focus Supports on Sources of Toxic Stress: Families in greatest need of support (e.g.,
parents with mental health or substance abuse problems, parents experiencing high levels
of conflict or violence, or parents at risk for child maltreatment) benefit from focused

Prevention and Education
Texas State Health Plan 2011-2016 186
services targeted to the particular stress. For example, young children of mothers with
depression benefit from interventions that treat the mother (Chaudron, et. al. 2007).
• Intensive family support through home visiting by skilled personnel can produce benefits
for children and parents, especially when it is targeted to families at particular risk
(National Scientific Council on the Developing Child, 2007). For example, home visiting
programs provide first-time parents who may be socially isolated or experiencing severe
adversity with support to adapt to the challenges of preparing for a newborn’s birth and
caring for a young baby. The home visiting program with the strongest evidence of
success, which has been replicated in multiple settings across the country, is the model
introduced by the Nurse Family Partnership. (Olds, 2006 and Dumont, et. al. 2006).
• Parent training should be available at public schools, community colleges, community
centers, at programs such as Women, Infant, and Children (WIC), etc. Parents need to
understand developmental milestones and practices which are appropriate for their
children (Developmentally Appropriate Practice, National Association for the Education
of Young Children, 2009). In Texas, given the large number of Hispanics, the most
effective solution is to provide parent education in English and Spanish.
• The well-being of all young children requires greater public attention to early care and
education settings that fail to meet minimal standards for health and safety (National
Scientific Council on the Developing Child, 2007). The science of child development
tells us that significant variations in the quality of early care and education programs have
the potential to produce lasting repercussions for both children and society as a whole
(Shonkoff and Phillips (Eds.), 2000). Evidence points to the beneficial impacts at the
highest end of the quality spectrum and to detrimental impacts at the lowest end. The
participation of children from low-income families in very high-quality early education
centers can enhance their developmental outcomes. The principal elements that have
consistently produced positive impacts include: 1. Highly skilled teachers; 2. Small class
sizes and high adult-to-child ratios; 3. Age-appropriate curricula and stimulating
materials in a safe physical setting; 4. A language-rich environment; 5. Warm, responsive
interactions between staff and children; and 6. High and consistent levels of child
participation (High/Scope Educational Research Foundation, 2004; National Institute for
Early Education Research, 2005; NICHD Early Child Care Research Network, 1999;

Prevention and Education
Texas State Health Plan 2011-2016 187
Department of Defense Child Development Program Annual Report, 2006; National
Association for the Education of Young Children, 2007; U.S. Department of Health and
Human Services, Administration for Children and Families, 2005).
• Expanding public awareness with more extensive dissemination of accurate scientific
information through warning labels and proactive controls on toxic exposures could lead
to significant benefits (National Council on the Developing Child, 2007). For example,
exposure to certain chemical substances during the period from conception through the
early years of life can interfere with the normal function of genes, proteins, and other
small molecules that influence brain development (National Council on the Developing
Child, 2007).
• Follow-up on legislative measures which work toward making Texas smoke-free.
Support local initiatives to prevent tobacco use, ordinances to ban smoking in public
spaces, enforcement of tobacco laws to prevent access to minors and employers that
reward nonsmokers and/or provide incentives to participate in tobacco cessation
programs.
• Implement the strategies and associated measurements that communities and local
governments can use to plan and monitor environmental and policy-level changes for
obesity prevention (Department of Health and Human Services, Centers for Disease
Control and Prevention, 2010). The strategies recommended for communities to
implement fall into several categories as follows:
Continue efforts to improve healthy eating and reward the implementation of best
practices in nutrition education in schools and early childhood environments.
Increase and improve the availability of affordable healthy food and beverages in
public service venues and underserved areas. Additionally, communities should
provide incentives for the production, distribution, and procurement of foods from
local farms.
Support healthy food and beverage choices by restricting availability of less
healthy foods and beverages in public service venues.
Increase support for breastfeeding.
Encourage physical activity in schools, increase opportunities for extracurricular
physical activity, and support schools that promote physical education.

Prevention and Education
Texas State Health Plan 2011-2016 188
Support legislation and funding to require physical activity programming in early
childhood environments and all grade levels.
Create safe communities that support physical activity by improving access to
outdoor recreational facilities, enhancing traffic safety in areas where persons
could be physically active and improving access to public transportation
Encourage communities to create partnerships to address obesity (Department of
Health and Human Services, Centers for Disease Control and Prevention).
• Support the Chronic Care Model which promotes effective change in provider groups to
support evidence-based clinical and quality improvement across a wide variety of health
care settings (Chronic Care Model: Improving Chronic Illness Care, 2010).
• Implement initiatives that will support public health prevention and education programs
in an effort to decrease the incidence and severity of chronic disease in the population by
enabling individuals to take personal responsibility for their health.
• The curriculum for the healthcare professions should include a focus on outcomes and the
use of measurement in driving improvements in healthcare. (Lee, 2010).
• The Texas Higher Education Coordinating Board should develop and implement positive
financial incentives for schools that create innovative models in education for the health
professions that will move toward shared or combined curricula, interdisciplinary classes
across health programs, and the use of multidisciplinary faculty or interdisciplinary teams
among the health programs.
• Continue to support the College for Texans Campaign administered by the Texas Higher
Education Coordinating Board to ensure diversity and minority participation in higher
education.
• Encourage the development and implementation of the field of study curricula for
additional health profession programs to promote a seamless transition and career
mobility within the profession.
• Support initiatives that result in the creation of a representation and culturally competent
health workforce for Texas. Examples include the addition of multilingual and
technological competencies.
• Implement social marketing campaigns to change social norms (Mercy, 2009).

Prevention and Education
Texas State Health Plan 2011-2016 189
REFERENCES American Academy of Pediatrics, American Public Health Association and National Resources
Center for Health and Safety in Child Care and Early Education. (2002). Caring for our
children: National health and safety performance standards: Guidelines for out-of-home child
care programs (2nd ed.). Elk Grove Village, IL: American Academy of Pediatrics and
Washington, D.C.: American Public Health Association.
Aos, S., Lieb, R., Mayfield, J., Miller, M., & Pennucci, A. (2004). Benefits and costs of
prevention and early intervention programs for youth. Olympia, WA: Washington State Institute
for Public Policy.
Barnett, W.S. (1995). Long-term effects of early childhood programs on cognitive and school
outcomes. The Future of Children, 5(3), 25-50.
Barnett, S., Belfield, C.R., & Nores, M. (2005). Lifetime cost-benefit analysis. In L.J.
Schweinhart, J. Montie, Z. Xiang, W.S. Barnett, C.R. Belfield, & M. Nores (Eds.). Lifetime
effects: The High/Scope Perry Preschool study through age 40(Monographs of the High/Scope
Educational Research Foundation, 14). Ypsilanti, MI: High/Scope Educational Research
Foundation.
Barnett, W.S., Lamy, C., & Jung, K. (2005). The effects of state prekindergarten program on
young children’s school readiness in five states. Rutgers University: National Institute for Early
Education Research.
Bitler, M., & Currie, J. (2005). Does WIC work? The effects of WIC on pregnancy and birth
outcomes. Journal of Policy Analysis and Management, 24, 73-91.
Bugental, D.P., Ellerson, P.C., Lin, E.K., Rainey, B., Kokotovic, A., & O’Hara, N. (2002). A
cognitive approach to child abuse prevention. Journal of Family Psychology, 3, 243-258.

Prevention and Education
Texas State Health Plan 2011-2016 190
Carroli, G., Villar, J., Piaggio, G., Khan-Neelofur, D., Gulmezoglu, M., Mugford, M., et al.
(2001). WHO systematic review of randomized controlled trials of routine antenatal care. The
Lancet, 357 (9268), 1565-1570.
Center on The Developing Child. A Science-Based Framework for Early Childhood Policy.
www.developingchild.harvard.edu
Centers for Disease Control and Prevention. Psychological and emotional effects of the
September 11 attacks on the world trade center – Connecticut, New Jersey, and New York, 2001.
MMWR Morbidity and Mortality Weekly Report 2002, 51 (35), 784-786.
Chaudron, L.H., Szilagyi, P.G., Campbell, A.T., Mounts, K.O., & McInerny, T.K. (2007). Legal
and ethical considerations: Risks and benefits of postpartum depression screening at well-baby
visits. Pediatrics, 119, 123-128.
Cunha, F., Heckman, J., Lochner, L., & Masterov, D. (2005). Interpreting the evidence on life
skill formation. Cambridge, MA: National Bureau of Economic Research Working Paper #
10091.
Dawson, G., & Fischer, K. (Eds.). (1994). Human Behavior and the developing brain. New
York: Guilford.
Department of Defense Child Development Program Annual Report. (2006).
Dumont, K., Mitchell-Herzfeld, S., Greene, R., Lee, E., Lowenfels, A., & Rodriguez, M. (2006).
Healthy Families New York randomized trial: Impacts on parenting after the first two years.
Office of Children and Family Services, Working Paper 1.
http://www.ocfs.state.ny.us/main/prevention/assets/HFNYRandomizedTrialWorkingPaper.pdf
Giles, W.H., Collins, J.L. (2010). A shared worldview: Mental health and public health at the
crossroads. Preventing Chronic Disease, 7 (1) A02

Prevention and Education
Texas State Health Plan 2011-2016 191
Gomby, D.S., Culross, P.L., Behrman, R.E. (1999). Home visiting: Recent program evaluations:
Analysis and recommendations. The Future of Children, 9(1), 4-26.
Gunnar, M. (2003). Integrating neuroscience and psychosocial approaches in the study of early
experiences. In J. King, C. Ferris, & I. Lederhendler (Eds.), Roots of Mental Illness in Children,
1008, 238-247. New York: New York Academy of Sciences.
Heckman, J. (2006). Skill formation and the economics of investing in disadvantaged children.
Science 312 (5782): 1900-1902.
Hernandez, D.J., Denton, N.A., & Macartney, S.E. (2007). Demographic trends and the
transition years. In R.C. Pianta, M.J. Cox, & K.L. Snow (Eds.), School readiness and the
transition to kindergarten in the era of accountability (pp. 217-281). Baltimore: Brookes.
Hiroeh, U., Appleby, L., Mortensen, P.B., Dunn, G. (2001). Death by homicide, suicide and
other unnatural causes in people with mental illness: A population-based study. Lancet 358
(9299), 2110-2112.
Karoly, L.A., Kilburn, M.R., & Cannon, J.S. (2005). Early childhood interventions: Proven
results, future promise. Santa Monica, CA: RAND Corporation.
Knudsen, E. (2004), Sensitive periods in the development of the brain and behavior. Journal of
Cognitive Neuroscience, 16, 1412-1425.
Knudsen, E., Heckman, J., Cameron, J., & Shonkoff, J. (2006). Economic, neurobiological and
behavioral perspectives on building America’s future workforce. Proceedings of the National
Academy of Sciences, 103 (27), 10155-10162.
Lasser, K., Boyd, J.W., Wooljandler, S., Himmelstein, D.U., McCormick, D., Dor, D.H. (2000)
Smoking and mental illness: A population-based prevalence study. JAMA, 284 (20), 2606-10.

Prevention and Education
Texas State Health Plan 2011-2016 192
Lee, Thomas H., Morgan, James J., (2009). Chaos and organization in health care. MIT Press.
Lee, Thomas H., (2010, April). Turning doctors into Leaders. Harvard Business Review, 50-58.
Masse, D.N., & Barnett, W.S. (2002). A benefit cost analysis of the Abecedarian Project, New
Brunswick, NJ: NIEER.
McCartney, K., Dearing, E., Taylor, B., & Bub, K. (2007). Quality child care supports the
achievement of low-income children: direct and indirect pathways through caregiving and the
home environment. Applied Developmental Science.
Meaney, M. (2001). Maternal care, gene expression, and the transmission of individual
differences in stress reactivity across generations. Annual Review of Neuroscience, 24, 1161-
1192.
Mental health: Culture, race and ethnicity – a supplement to mental health: A report of the
Surgeon General. Rockville (MD), US Department of Health and Human Services, Substance
Abuse and Mental Health Services Administration (2001).
Mercy, J.A. (2009). Promoting safe, stable, and nurturing relationships. A public health strategy
for addressing child maltreatment, other early adversities, and health disparities.
National Association for the Education of Young Children. (2009). Developmentally Appropriate
Practice in Early Childhood Programs Serving Children from Birth through Age 8. Third
Edition.
National Association for the Education of Young Children. (2007). Summary of NAEYC-
accredited programs for young children. Retrieved June 26, 2007, from
http:/www.naeyc.org/academy/web_ready/summary/center_summary.asp

Prevention and Education
Texas State Health Plan 2011-2016 193
National Center for Chronic Disease Prevention and Health Promotion. (2009). Obesity Halting
the Epidemic by Making Health Easier.
National Scientific Council on the Developing Child (2007). The science of early childhood
development: Closing the gap between what we know and what we do.
http://www.developingchild.net/pubs/persp/pdf/Science_Early_Childhood_Development.pdf
National Scientific Council on the Developing Child, Working Paper No. 1. Young children
develop in an environment of relationships. (2004). http://developingchild.net/pubs/wp-
abstracts/wp1.html
National Scientific Council on the Developing Child, Working Paper No. 2. Children’s
emotional development is built into the architecture of their brain. (2004).
http://developingchild.net/pubs/wp-abstracts/wp2.html
National Scientific Council on the Developing Child, Working Paper No. 3. Excessive stress
disrupts the architecture of the developing brain. (2005). http://developingchild.net/pubs/wp-
abstracts/wp3.html
National Scientific Council on the Developing Child, Working Paper No. 4. Early exposure to
toxic substances damages brain architecture. (2006). http://developingchld.net/pubs/wp-
abstracts/wp4.html
National Scientific Council on the Developing Child, Working Paper No. 5. The timing and
quality of early experiences combine to shape brain architecture (2008).
http://developingchild.net/pubs/wp-abstracts/wp5.html
National Scientific Council on the Developing Child, Working Paper No. 6. Mental health
problems in early childhood can impair learning and behavior for life. (2008).
http://developingchild.net/pubs/wp-abstracts/wp6.html

Prevention and Education
Texas State Health Plan 2011-2016 194
National Scientific Council on the Developing Child, Working Paper No. 7. Workforce
development, welfare reform, and child well-being. (2008). http://developingchild.harvard.edu
National Scientific Council on the Developing Child, Working Paper No. 8. Maternal depression
can undermine the development of young children. http://developingchild.harvard.edu
Nelson, D. (2000). The neurobiological bases of early intervention. In J. Shonkoff & S. Meisels,
(Eds.), Handbook of early childhood intervention (2nd ed.). New York: Cambridge University
Press.
NICHD Early Child Care Research Network (1999). Child outcomes when child care center
classes meet recommended standards for quality. American Journal of Public Health, 89, 1072-
1077.
NICHD Early Child Care Research Network. (2003). Does amount of time spent in child care
predict socio-emotional adjustment during the transition to kindergarten? Child Development,
74(4), 976-1005.
Olds, D. (2006). The Nurse-Family Partnership. In N.F. Watt, C. Ayoub, R.H. Bradley, J.E.
Puma, & W.A. LeBoeuf (Eds.), The crisis in youth mental health: Early intervention programs
and policies (pp. 147-180). Westport, CT: Praeger.
Olds, D. (2007). Programs for parents of infants and toddlers: Recent evidence from randomized
trials. Journal of Child Psychology and Psychiatry, 48(3/4), 355-391.
Physical activity guidelines for Americans. Washington (DC): US Department of Health and
Human Services, 2008. http://health.gov/paguidelines.
Pianta, R., Mimentz, S., & Bennett, E. (1997). Mother-child relationships, and school outcomes
in preschool and kindergarten. Early Childhood Research Quarterly, 12, 263-280.
Prevention and Education
Texas State Health Plan 2011-2016 195
Sackett, K., Pope, R.K., & Erdley, W.S. (2004). Demonstrating a positive return on investment
for a prenatal program at a managed care organization: An economic analysis. Journal of
Perinatal and Neonatal Nursing, 18 (2), 117-127.
Schwartz, R. B. (2004). Multiple pathways – and how to get there. In R. Kazis, J. Vargas, and N.
Hoffman (Eds.). Double the Numbers: Increasing Postsecondary Credentials for
Underrepresented Youth. Harvard Education Press.
Schweinhart, L.J., Montie, J., Xiang, Z., Barnett, W.S., Belfield, C.R., & Nores, M. (2005).
Lifetime effects: The High/Scope Perry Preschool study through age 40. Ypsilanti, MI:
High/Scope Press.
Shonkoff, J., & Meisels, S. (Eds.). (2000). Handbook of early childhood intervention (2nd ed.).
New York: Cambridge University Press.
Shonkoff, J., & Phillips, D. (Eds.). (2000). From neurons to neighborhoods:The science of early
childhood development, Board on Children, Youth, and Families. Commission on Behavioral
and Social Sciences and Education, National Research Council and Institute of Medicine.
Washington, D.C.: National Academy Press.
Texas Higher Education Coordinating Board Division of Universities and Health-Related
Institutions and Division of Community and Technical Colleges. (2002, December). Developing
Field of Study Curricula.
U.S. Department of Health and Human Services, Administration for Children and Families.
(2005). Head Start impact study: First year findings. Washington, D.C.: U.S. Administration for
Children and Families.
U.S. Department of Health and Human Services. Adverse Childhood Experiences (ACE) Study.
www.cdc.gov/nccdphp/ACE/findings

Prevention and Education
Texas State Health Plan 2011-2016 196
U.S. Department of Health and Human Services. (2010, January). The Surgeon General’s Vision
for a Healthy and Fit Nation. Rockville, MD: U.S. Department of Health and Human Services,
Office of the Surgeon General.
http://www.surgeongeneral.gov/library/obesityvision/obesityvision2010.pdf
U.S. Department of Health and Human Services. U.S. Preventive Services Task Force.
www.ahrq.gov/CLINIC
Wagner, E.H., Austin, B.T., Van Korff, M. (1996). Organizing care for patients with chronic
illness. Milbank, Q., 74 (4), 511-544.
Wan, J.J., Morabito, D.J., Khaw, J., Knudson, M.M., Dicker, R.A. Mental illness as an
independent risk factor for unintentional injury and injury recidivism. (2006) J Trauma, 61 (6),
1299-1304.
Zill, N., Resnick, G., Sorongon, A., Kim, K., O’Donnell, K., McKey, R.H., et al. (2003). Heat
Start FACES 2000: A whole-child perspective on program performance. Fourth Progress Report.
Prepared for the Administration for Children and Families.
www.ahrq.gov/CLINIC/uspstfix.htm Retrieved February 1, 2010.
www.cdc.gov/nccdphp/ACE/findings.htm Retrieved February 1, 2010.
www.cdc.gov/print.do?url=http://www.cdc.gov/nccdphp/ACE/findings.htm Retrieved March 12,
2010.
www.improvingchroniccare.org Retrieved March 23, 2010.
www.nursefamilypartnership.org/ Retrieved February 1, 2010.
www.nursefamilypartnership.org/locations Retrieved February 1, 2010.

Prevention and Education
Texas State Health Plan 2011-2016 197
www.nursefamilypartnership.org/locations/Texas Retrieved February 1, 2010.
www.nursefamilypartnership.org/assets/PDF/NFP_Evidence-Based. Retrieved February 1,
2010.
www.ppv.org/ppv/pdf_uploads/462_publication.pdf. Retrieved March 12, 2010.
www.prevent.org. Retrieved February 1, 2010.
www.rwjf.org/files/publications/other/DavidOldsSpecialReport0606.pdf. Retrieved February 1,
2010.


APPENDIX I
RECOMMENDATIONS


Recommendations
Texas State Health Plan 2011-2016 201
2011-2016 Texas State Health Plan
Recommendations
Texas must take the necessary steps to achieve education and training in the health professions
that will ensure that an appropriately skilled, sufficient, and experienced workforce becomes a
reality for the state. This will be achieved through effective and innovative models of education
and practice that provide work-ready graduates, improve the participation of minorities in the
health professions, and retain trained health professionals in the workforce.
The Statewide Health Coordinating Council believes that the following recommendations are
essential to fulfill these workforce goals and thereby ensure a quality health workforce for Texas.
General Workforce Recommendations
1. Require all health professions licensing boards to standardize the collection of critical data by
implementing the Minimum Data Set developed by the Statewide Health Coordinating Council.
2. Regulatory boards should allocate funds to support the collection of health workforce supply
and demand data in the Health Professions Resource Center and to support needed research
based on these data.
3. Realign health workforce efforts in a structure that is better able to collaborate and coordinate
health workforce planning and data collection to enable Texas to be more responsive to potential
funding opportunities.
4. The Texas Higher Education Coordinating Board should study, develop and implement
positive financial incentives for schools that create innovative models in education for the health
professions that will move toward shared or combined curricula, interdisciplinary classes across
health programs, technology and simulation centers, and the use of multidisciplinary faculty or
interdisciplinary teams among the health education programs.

Recommendations
Texas State Health Plan 2011-2016 202
5. Continue to support the College for all Texans and GenTx Campaign administered by the
Texas Higher Education Coordinating Board to ensure diversity and minority participation in
higher education. (For information on the program, visit http://www.collegefortexans.com or
http://www.thecb.state.tx.us/SAM/overview/).
6. The Texas Higher Education Coordinating Board should develop and implement field of
study curricula for additional health profession programs and require adoption of these curricula
by public educational institutions to encourage and promote a seamless transition and career
mobility within the professions.
7. Support initiatives that result in the creation of a representative and culturally competent
health workforce for Texas. This could include items such as
• programs that interest minority students in health careers,
• curricula for preparing practitioners to recognize health disparities and to implement
appropriate interventions,
• new models for education in the health professions,
• strategies for reducing the loss of intellectual capital across countries and regions, and
• the addition of multilingual and technological competencies
8. Direct the regulatory boards for the health professions to permit exceptions to their regulations
to facilitate the increase in innovative, outcome-oriented demonstration projects.
9. Support initiatives that will promote the application of technology in all areas of health
education and all areas of clinical care throughout the health care continuum. This should
include applications for initial professional and continuing education, recruitment and retention
efforts, health care practice, and community health education.
10. Support the expansion and enhancement of funding of the Area Health Education Centers to
guarantee that vital health career development efforts and recruitment and retention strategies are
available in areas not provided through other means or agency efforts. Applications for initial

Recommendations
Texas State Health Plan 2011-2016 203
professional and continuing education, recruitment and retention efforts, health care practice, and
community health education.
11. Enhance and strengthen public and private partnerships to include regional strategic mapping
of staff and services between organizations to improve resource allocation, trim numerous costs,
and avoid service duplication.
Primary Care Recommendations
1. Support public health prevention and education programs designed to decrease the incidence
and severity of chronic disease and decrease health disparities in the population by enabling
individuals to take personal responsibility for their health.
2. Reinstate general revenue funds in support of the Medicaid draw-down of federal funds for
graduate medical education to 2002-03 biennial levels as a way of maintaining physician supply.
3. Work with others to actively and urgently seek relief from the Centers for Medicare and
Medicaid Services to eliminate the current outdated caps on funding graduate medical education
training slots and to increase and to distribute the funds according to geographically equitable
calculations.
4. Sustain and increase general revenue funding for graduate medical education and the Family
Practice Residency Program through the trustee funds to the Texas Higher Education
Coordinating Board to the 2002-03 biennial levels.
5. Sustain special item funding to support enrollment at the state’s pharmacy schools to help
relieve the current shortage of pharmacists in the state.
6. Support the growth in the numbers of Federally Qualified Health Centers and community
primary care clinics in Texas.

Recommendations
Texas State Health Plan 2011-2016 204
7. The Texas Higher Education Coordinating Board should provide funding for community
based residency programs.
8. Support methodologies for the development of innovative educational models for the delivery
of primary care that would include physical, mental, and oral health.
9. Support demonstration projects that use interdisciplinary teams of health professionals for
prevention and management of chronic disease and that utilize an appropriate mix of caregivers
and responsibilities.
10. The Health and Humans Services Commission should support changes in Medicaid,
Children’s Health Insurance Program, and Texas Vendor Drug Program rules and policies to
trace outcomes and increased accountability by
• Identifying the practitioner that prescribed the drug instead of the delegating physician,
• Requiring all providers to bill services under their own names
11. The Office of State and Federal Relations should encourage federal legislation that allows
Nurse Practitioners, Clinical Nurse Specialists, and Physician Assistants to order home health
care services, and then change state regulations accordingly.
12. Support legislation, regulation, and reimbursement methodologies that will support the
training and use of state certified Community Health Workforce providers to assist in the cost-
effective management of heath care.
13. Provide positive financial incentives for providers who implement the use of evidence-based
health care and the use of outcome-based practice guidelines that have been approved by an
agreed upon nationally recognized health association

Recommendations
Texas State Health Plan 2011-2016 205
Nursing Workforce Recommendations
1. Continue the Nursing Innovation Grant Program funded by tobacco earnings from the
Permanent Fund for Higher Education Nursing, Allied Health, and other Health-Related
Programs and administered by the Texas Higher Education Coordinating Board.
2. Support innovative programs to combat the state’s nursing shortage while increasing diversity,
particularly of Hispanic nurses, in the health care workforce. Project partners should work with
diverse middle and high school students in the state, in order to foster interest in nursing careers,
and provide students with a nurse mentor, intensive tutoring, experiential learning opportunities
and a structured curriculum to prepare them for a nursing program in a college or university.
3. Enhance resources for recruitment, hiring and retention of faculty for nursing programs.
4. Encourage and prioritize the expansion of Advanced Practice Nursing programs, including
nurse-midwifery, to meet the expectations of a reformed health care system and the demand for
more qualified and educated nurses.
5. Continue to sustain and continue to provide increased funding levels to nursing programs
throughout the state to support continued growth in the number of new graduates from Texas
schools of nursing.
6. Support implementation of the following strategies in the recruitment and retention of a
qualified and well prepared nursing workforce in public health, long-term care settings, and
public psychiatric/mental health settings:
• Funding of a career ladder for public health nurses in order to address recruitment and
retention concerns.
• Extension of student loan forgiveness programs for RNs entering public health nursing in
Texas, especially those willing to practice in medically underserved, rural and border
areas and those who would promote cultural diversity within the Texas public health
nursing workforce.

Recommendations
Texas State Health Plan 2011-2016 206
• Creation of training stipends for students in Texas professional nursing programs as well
as psychiatric/mental health and primary care advanced practice nursing programs to
encourage interest in public health nursing and promote public health nursing practice
competencies.
• Creation of partnerships with higher education institutions to develop innovative
approaches to recruit minority students to the field of public health nursing, including
targeting paraprofessional nursing staff members with a demonstrated interest in public
health nursing.
• Development of increased part-time and flexible schedules to retain experienced older
nurses in the public health workforce in order to meet ratios and to train and mentor
younger nurses.
• Creation of more opportunities for public health nurses to have meaningful roles in
statewide, agency, and municipal public health services operational management;
strategic planning; and health policy planning, deployment and evaluations.
7. Develop best practices and effective capabilities for nurses and nursing students using the
Nursing Informatics Competencies Model from the TIGER Informatics Competencies
Collaborative (TICC) initiatives which consist of three parts: Basic computer Competencies,
Information Literacy, Information Management (including use of an electronic health record)
and information minimum set of competencies.
Sources: http://tigersummit.com/Competencies_New_B949.html
8. Improve and expand existing Texas Nursing/Clinical/Health informatics education programs
by collaborating with industry, service, and academic partners to support and enhance the use of
technology and informatics in practices.
Allied Health Professions Recommendations
1. Enhance resources for health professions schools (formerly allied health professions) in order
to expand enrollments and provide for graduate programs for developing faculty in the health
professions.

Recommendations
Texas State Health Plan 2011-2016 207
2. Establish and support a mechanism and staff to create an office for allied health professions
workforce issues in the Health Professions Resource Center.
3. Explore means to expand access to health care through innovative programs and initiatives to
better utilize health professionals in medically underserved, rural, and border areas.
4. Increase faculty, expand student loan forgiveness, and provide tuition assistance to health
professions faculty to pursue an advanced degree.
5. Continue to extend student loan forgiveness programs for health professionals serving in
medically underserved, rural, and border areas.
6. Support the establishment of state licensure for key health clinical laboratory sciences.
7. Encourage partnerships among high schools, community colleges, universities, and academic
health centers to promote the allied health professions (e.g. dual credit courses, pre-professional
training.)
8. Promote the application of technology in the educational training of all allied health
professionals.
Access to Care Recommendations
1. Medical Homes and Integrated Health Models
• Develop, implement and incentivize medical home and integrated health care
models.
• Encourage practices to embrace the concept of medical homes utilizing care
managers, cross disciplinary team-based care, and patient-centered practices.
• Promote the concept of medical home for preventative and care of chronic
diseases and continuum of care.

Recommendations
Texas State Health Plan 2011-2016 208
• Adopt strategies that use a holistic approach to healthcare service delivery
including substance abuse and mental health services.
2. Retention strategies. Improve supply ratios through improving retention rates of healthcare
professionals and paraprofessionals. Examples include:
• Make reimbursement rates more equitable for physicians, especially primary care
and other health care providers who perform medical activities typically performed by a
physician such as physician assistants (PAs), nurse practitioners (NPs), pharmacists,
thereby increasing the capacity to serve the Medicaid and CHIP population.
• Expand and enhance incentives for PAs. Provide strong incentives designed to
channel a greater number of PA graduates into primary care and group practices that are
located in medically underserved communities.
• Increase incentives in payor programs (such as Medicaid), to encourage a greater
number of providers to serve this and other underserved populations, in light of lower
reimbursement rates associated with Medicaid and CHIP. This will also assist with
increasing capacity of health care services to low income, Medicaid and CHIP eligible
persons.
• Ensure retention of quality substance abuse service providers by increasing salary
ranges to make them more competitive with the salaries of other health care providers.
Support the DSHS substance abuse exceptional item in the FY 2010-2011 Legislative
Appropriations Request for a $33 million increase in prevention and treatment funding.
(LCDCs)
3. Addressing Maldistribution Through Incentives. Examples include:
• Develop, provide and expand incentives to boost the number of international
medical graduates in Texas, such as through the Conrad 30 J1 Visa Waiver Program
waiving the H-1 physicians two year return home in exchange for 3 years of service in a
designated workforce shortage area.
Recommendations
Texas State Health Plan 2011-2016 209
• Provide tax break incentives to providers who treat the uninsured thereby
increasing supply of providers who accept patients with no insurance or low
reimbursement rates through Medicaid or CHIP.
• Create incentives for relocating practices where care is inaccessible through
promotion and redesign of the Healthy Texas Reinsurance Program.
• Provide incentives to community colleges, non profits, and health care facilities to
facilitate training opportunities to increase the number of CHWs and paraprofessionals
Technology Recommendations
1. Establish a Telemedicine Advisory Committee to assist in evaluating policies for telemedicine.
2. Provide healthcare providers with reimbursements for a wider range of covered medical
services other than Medicaid Coverage and Reimbursements.
3. Establish uniform standards for physician credentials, professional conduct and discipline.
State requirement for licensure often differ between states.
4. Explore the possibility for regional agreements, especially among medical boards in areas in
which Telemedicine care frequently occurs across state lines.
5. Support a resolution to encourage insurers to expand the definition of telemedicine coverage
for medical services to include interactive audio, video and/or other media for diagnosis,
consultation and/or treatment for reimbursement.
6. Develop information and educational materials to educate the Texas Medical Board about the
telemedicine practice environment with the emphasis on benefits to patients as well as protecting
patient safety, to ensure regulatory policies which benefit all citizens of the state, especially those
in remote or underserved areas.

Recommendations
Texas State Health Plan 2011-2016 210
7. Develop of information and education materials to educate the citizens of Texas on health
insurance coverage, informed consent, and confidentiality for telemedicine medical services and
telehealth services.
8. Standardize HIT core competencies into training for all clinicians and model curriculum after
the American Health Information Management Association (AHIMA) and the American Medical
Informatics Association (AMIA).
9. Seek and secure federal funding for EMR/HIT workforce development and projects in Texas.
10. Assure HIT training for Texas health professionals’ workforce.
Prevention and Education Recommendations 1. Support and ensure priority is given to programs that intervene early in the life cycle.
2. Ensure funding of quality early care and education programs. (Quality as measured by
entities such as The National Association for the Education of Young Children.)
3. Ensure efficiency in matching federal dollars earmarked for early childhood programs and
the distribution of federal and state dollars to the grassroots communities.
4. Fund parenting education in English and Spanish. Parenting education should include child
development and nutrition. (Education programs for children and adults succeed only when
instructional time is substantial.)
5. Continue funding the Supplemental Food Program for “Women, Infants, and Children”
(WIC) and other prenatal programs that address perinatal health.
6. Support through legislation and funding availability and accessibility of quality services for
children and their families. Services should include:

Recommendations
Texas State Health Plan 2011-2016 211
• Home visiting programs
• Intervention programs which address mental health issues such as depression and
substance abuse problems
7. Continue efforts to improve immunization rates in Texas through legislation and funding
programs which require the collaboration of public schools and local health care providers to
improve immunization rates.
8. Support through legislation and funding access to basic medical care for pregnant women
and help prevent threats to healthy development, as well as provide early detection and
intervention for problems that may emerge.
9. Expand public awareness campaigns through legislation with more extensive dissemination
of accurate scientific information through warning labels and proactive controls on toxic
exposures. The public awareness campaign should include global health issues such as STDs,
safety, and wellness.
10. Support local initiatives to prevent tobacco use in public places through legislation.
11. Implement the strategies and associated measurements that communities and local
governments can use to plan and monitor environmental and policy-level changes for obesity
prevention through legislation. The strategies recommended for communities to implement
fall into categories as follows:
• Continue efforts to improve healthy eating and reward the implementation of best
practices in nutrition education in schools and early childhood environments.
• Increase and improve the availability of affordable healthy food and beverages in
public service venues and underserved areas. Additionally, communities should
provide incentives for the production, distribution, and procurement of foods from
local farms.
• Support healthy food and beverage choices by restricting availability of less healthy
foods and beverages in public service venues.
Recommendations
Texas State Health Plan 2011-2016 212
• Increase support for breastfeeding through public awareness campaigns.
• Fund physical activity programs in schools; increase opportunities for extracurricular
physical activity, and support schools that promote physical education.
• Support legislation and funding to require physical activity programming in early
childhood environments and all grade levels.
• Support legislation and funding which create safe communities that support physical
activity by improving access to outdoor recreational facilities, enhancing traffic safety
areas where persons could be physically active and improving access to public
transportation.
12. Support through funding and legislation partnerships with institutions of post-secondary
education, the health sector, and state government to address obesity.
13. Support legislation and funding of partnerships between the community, the health system,
self-management support, delivery system design and clinical information systems which
encourage high-quality chronic disease care.
14. Support legislation and funding of educational programs for health care professions which
focus on outcomes and the use of measurement in driving improvements in health care.
15. Support legislation and funding for post-secondary institutions to create innovative models in
education for the health professions that will move toward shared or combined curricula,
interdisciplinary classes across health programs, and the use of multidisciplinary faculty or
interdisciplinary teams among the health programs.
16. Continue to support the College for all Texans Campaign and GenTx Campaign administered
by the Texas Higher Education Coordinating Board to ensure diversity and minority
participation in post-secondary programs which prepare the health workforce.

Recommendations
Texas State Health Plan 2011-2016 213
17. Encourage the development and implementation of the field of study curricula for additional
health profession programs to promote a seamless transition from community colleges to
four-year institutions and career mobility within the health professions.
18. Support initiatives that result in the creation of a representation and culturally competent
health workforce for Texas. Examples include the addition of multilingual and technological
competencies.


APPENDIX II
PAPERS ON
NURSING WORKFORCE


Papers on Nursing Workforce
Texas State Health Plan 2011-2016 217
Recruitment and Retention of a Diverse Student Population in Nursing
Susan Sportsman, RN, Ph.D., Dean
College of Health Sciences and Human Services Minnie Rhea Wood Professor of Nursing
Midwestern State University
The recruitment and retention of a diverse student population in nursing programs is a critical issue for the citizens of Texas. A diverse student population should include not only students from different racial and ethnic backgrounds, but also those of different ages, gender, socio-economic class, sexual orientation and physical abilities (AACN, 2009). The acute shortage of nurses in Texas requires recruitment and retention strategies which encourage and support all interested and qualified candidates to become professional nurses, regardless of their race/ethnicity, gender, socio-economic status or other factors. Increasing the number of well prepared, competent nurses in Texas will improve access to health care for state citizens. In addition, there is evidence that outcomes of care are improved when the caregiver has characteristics similar to the client and their significant others (Beckham, et. al., 2009). The report from the Sullivan Commission (2004) notes that “diversity strengthens cultural competency; cultural competency of the provider profoundly influences the way in which health care is provided”. Therefore, increasing the diversity of students in nursing programs throughout the state has significant benefits for the outcomes of care in Texas, as well as the profession of nursing. In response to the nursing shortage over the last decade, multiple stakeholders in Texas have focused on the increase of students admitted to and graduating from nursing programs in the state. From 2001 to 2006, for example, total enrollment in entry level nursing programs increased by 36.9%. The graduation rate in 2005-06 was 47.3% greater than the rate in the 2000-2001(TCNWS, 2007). The state’s goal going forward is to increase the annual production rate of new RN graduates by AY 2012-2013 to 13,000 from 7,000 in AY 2007(Texas Nursing Workforce Shortage Coalition, 2008) The most obvious measure of diversity in professional nursing programs is a racial/ethnic distribution of the student body reflective of the broader population. In 2006, Caucasian nursing students made up 56.9% of the professional nursing students (55.6% BSN students and 57.4% ADN students) in Texas (TCNWS, 2007). In contrast, Texas has a minority population of 52.6% (US Census Bureau, 2008). Thus, minorities are underrepresented in the nursing student population compared to the total Texas population. The literature regarding recruitment and retention designed to improve diversity most often focuses on strategies to increase racial/ethnic diversity. However, state policies and school-based programs to improve racial and ethnic balance outlined in this briefing may also be adapted to increase the representation of other groups.

Papers on Nursing Workforce
Texas State Health Plan 2011-2016 218
The nursing literature is replete with case studies or research findings that document barriers preventing minorities or other underrepresented students from applying to nursing programs. The barriers influenced by colleges and universities include lack of diversity (both faculty and students) on college campuses, lack of financial or administrative support for recruitment programs, a rigid institutional environment regarding admission and progression, and overreliance on standardized exams in admission decisions. From the perspective of the potential student, a lack of family support to enter college or nursing, financial limitations or family/work responsibilities, and lack of preparation in secondary education may also be constraints (Barton & Swinder, 2009; Thacker, 2005; Escallier & Fullerton, 2009; Sullivan Report, 2004; Warda, 2008). Others barriers identified include a lack of understanding of higher education or nursing, as well as a poor image of the profession by students or their families. The lack of a mentor to explain these issues to prospective students and families confounds the problem(Beacham, Askew, & Williams, 2009). The literature suggests a number of evidence-based approaches to the recruitment of underrepresented students to professional nursing programs (Noone, 2008; AACN, 2009; Escallier & Fullerton, 2009; Thacker, 2005; Barton & Swinder, 2009, Bond, et.al, 2008). Public policy, including targeted funding, as well as specific recruitment by individual professional organizations, may emphasize the following strategies to enhance the recruitment of underrepresented students:
• Recruitment advertisements/ outreach materials and programs which feature minority or other underrepresented populations.
• Ongoing partnerships with community organizations (churches, business groups, minority-rich elementary, middle or secondary feeder schools) to provide support services that will introduce targeted potential students and their families to opportunities in nursing and assist them in managing college and nursing program applications.
• Outreach prior to college to provide remediation for general education skills that may be lacking.
• Hiring a representative from the targeted group to serve as advisor or outreach coordinator. If it is not possible to find a qualified person among the targeted population, a cultural competent staff member(s) is a necessity.
• Appointment of a program or college/university “Diversity Champion” to oversee overall recruitment efforts.
One of the barriers to admitting more students to professional nursing programs across the state is the lack of sufficient qualified faculty. This problem is accentuated for minority students, since representatives from the targeted groups are often underrepresented in faculties. For example, AACN reports that in 2008, only 24% of the students in MSN programs and 22.2% of students in doctoral programs nationally were minorities. State policies fostering funding for nurses in underrepresented groups to earn a masters or doctoral degree and become faculty members will be important to improve these statistics. State funded scholarships similar to the

Papers on Nursing Workforce
Texas State Health Plan 2011-2016 219
Minority Nurse Faculty Scholars Program offered by American Association of Colleges of Nursing (AACN) and the Johnson and Johnson Campaign for Nursing’s Future would be an ideal way to encourage minority nurses to become faculty members. This intervention, in turn, will support those students taught by the funded faculty. Once minority/ underrepresented students are admitted into professional nursing programs, there are a variety of barriers that may impede their progress toward graduation. These may include lack of financial support for tuition and living expenses, isolation and discrimination by faculty and peers, and a lack of fluency in English. Family responsibilities and work obligations may also reduce the likelihood that these students will be successful. For some groups, the emphasis on competition rather than collaboration in the nursing program may cause difficulties. (Barton & Swinder, 2009; Thacker, 2005; Escallier & Fullerton, 2009; Beckham, et. al, 2009’ Bond, et.al, 2008). State policies which provide scholarships and other funding for individual students are important. However, funding for nursing programs to develop support programs consistent with the needs of their students may be even more important. A model, SAFER, developed by Swinney & Dobal (2008) provides a framework through which such support services might be developed. The authors note that this model supports students so that they will be more inclined to remain in nursing school. Components of the model include:
o S (Social Support)
o A (Academic Support)
o F (Financial Support)
o E (Empowerment of students)
o R (Responsibility by Students)
Based on recent literature regarding the retention of minority nursing students, social support through some type of mentorship program is critical. This may take the form of peer support group, and/or mentorship with practicing nursing or a non-faculty advisor. Academic support may include assistance in test taking or study skills, or peer study groups. Support for students for whom English is not a first language or whose English is difficult to understand is critical. Financial support may include scholarships or loans. Often an individual staff or faculty may act as a “case manager “or “career coach” to help student find necessary resources. Being accountable for following through with these referrals can service to empower the student and provide them with an opportunity to assume responsibility for problem solving challenges throughout their course of study. Stakeholders across the state are working to increase the number of well-prepared graduate nurses to meet the projected needs. Currently, minority groups represent 43% of nurses in Texas. Emphasizing the recruitment and retention policies and strategies discussed here has the potential to increase the minority representation by 1% a year, to 49% at the end of the next six years.
Papers on Nursing Workforce
Texas State Health Plan 2011-2016 220
References AACN (2009) Enhanced diversity in the nursing workforce: AACB Fact Sheet. http://www. acn.nche.edu. February. Last Accessed- January, 2010. Barton, A. & Swinder, S. (2009) Creating diversity in a baccalaureate nursing program: A case study. International Journal of Nursing Education Scholarship. 6(1). 1-11.
Beachman, T., Askew, R., & Williams, P. (2009) Strategies to increase racial/ethnic student participation in the nursing profession. The ABNF Journal. Summer 2009. Bond, M., Gray, J., Baxley, S., Cason, C. Dinke, L, Moon, M. (2008) Voices of hispanic students in baccalaureate nursing programs: Are we listening? Nursing Education Perspective. May-June. 136-142.
Escallier, L. & Fullerton, J. (2009) Process and outcomes evaluation of retention strategies within a nursing workforce diversity project. Journal of Nursing Education. 48(9) September. 488-494. Evans, B. (2008) The importance of educational and social background of diverse students to nursing programs. Journal of Nursing Education. 47(7) 305-313. Noone, J. (2008) The diversity imperative: Strategies to address a diverse nursing workforce. Nursing Forum. 43(3) July-September. Sullivan, L. (2004) Missing Persons: Minorities in the Health Professions: A Report of the Sullivan Commission on Diversity of Health Professionals. http://www.aacn.nche.edu/Media/pdf/SullivanReport.pdf Last accessed-January, 2010.
Swinney, J. & Dobal, M. (2008) Embracing the challenge: Increasing workforce diversity in nursing. Hispanic Health Care International. 6(4). 200-204. TCNWS (2007) Professional nursing education in Texas demographics and trends: 2006. Texas Center for Nursing Workforce Studies, Center for Health Statistics, Texas Department of State Health Services, and the Statewide Health Coordinating Council, Center for Nursing Workforce Studies Advisory Committee. October 29, 2007.
Thacker, K. (2005) Academic-community partnerships: Opening the doors to a nursing career. Journal of Transcultural Nursing . 16(1) January. 57-63. Warda, M. (2008) Curriculum resolution: Implications for Hispanic nursing students. Hispanic Health Care International. 6(4) 192-199.

Papers on Nursing Workforce
Texas State Health Plan 2011-2016 221
Health Information Technology and Recommendations for Nursing Education in Texas
Susan McBride, PhD, RN
Professor Anita Thigpen Perry School of Nursing
Texas Tech University Health Sciences Center
Rodney Hicks, PhD, RN, FNP-BC, FAANP, FAAN UMC Health System Endowed Chair for Patient Safety
Anita Thigpen Perry School of Nursing Texas Tech University Health Sciences Center
Mari Tietze, PhD, RN-BC
Director of Nursing Research and Informatics Dallas-Fort Worth Hospital Council Education and Research Foundation
The Office of the National Coordinator (ONC) for Health Information Technology (HIT) is pushing an aggressive agenda as part of the economic stimulus package with $2 billion dollars being invested in HIT infrastructure to connect this nation with an electronic highway, the national health information network (NHIN).1 This wave of HIT development will likely hit the nation like a tsunami. Dr. David Blumenthal, the National Coordinator for Health Information Technology, stated in a message on December 24, 2009,
“As health care providers and hospitals across the nation incorporate electronic health records into routine patient care, the demand for highly skilled health IT professionals will rapidly grow” 2.
The Health Information Management Systems Society (HIMSS) in a recent survey of members (April 2, 2009) reports that a significant percent of health care organizations need nurses with HIT expertise. The HIMSS report states that providers believe “nursing informaticists have a positive impact on patient safety, workflow and clinician acceptance”.3 Additionally, nursing leaders in the Technology Informatics Guiding Educational Reform (TIGER) Initiative are taking a strong position on the importance of nursing to this national agenda by indicating:
“As federal initiatives push the adoption of Electronic Health Records (EHRs) throughout all healthcare institutions by 2015, it is imperative that nursing graduates are fluent in the use of these tools in order to practice safe and effective patient care.” 4
Texas is preparing to support the national agenda with plans for a Medicaid Health Information Exchange (HIE) and an emerging state infrastructure through the Texas Health Services Authority Coalition on HIT. This authority, established in 2007 as a public-private collaborative, promotes development of a seamless electronic health information infrastructure and was recently funded through a federal ONC HIE planning grant in February 2010.5 The stage is set for Texas to address lacking infrastructure in HIT and HIE. Texas lags behind the nation with its predominately rural and underserved areas of the state.

Papers on Nursing Workforce
Texas State Health Plan 2011-2016 222
Health information technology will transform the Texas healthcare delivery system in the next decade. Nurses must be prepared to support this transformation. Nurses understand the logistics of what medical information is needed and where it should be sent within and between institutions, nurse specialists can help orchestrate how health information is gathered, integrated and disseminated. Informatics nurse specialists have the unique combined skill set of clinical and informatics knowledge to support future advances in health information technology. Yet, the number of informatics nurse specialists pales in comparison to the current and future demands. The American Nurses Association defines nursing informatics as “a specialty that integrates nursing science, computer science, and information science to manage and communicate data, information, knowledge and wisdom in nursing practice” 6 Texas does not currently have any educational programs for informatics nurse specialists at the graduate level. The closest nursing informatics graduate programs are in Colorado, 550 miles to the northwest, Alabama, 1,000 miles east and no programs to the south. This deficit threatens the entire efficiency and effectiveness of health care in Texas.
One key issue Texas must address in supporting this agenda is to establish a state-wide approach to nursing education that incorporates the TIGER Initiative recommendations. Texas lacks a coordinated effort on statewide recommendations for nursing education on health information technology. Four states (Minnesota, Massachusetts, North Carolina, and California) have created initiatives at all levels of nursing and for faculty development to examine current and future work in the area of curriculum development for informatics.
The TIGER Initiative has three key areas that support the nursing education national agenda. These areas are:
1. Develop a nursing workforce capable of using electronic health records to improve the delivery of healthcare;
2. Engage more nurses in the development of the HIT infrastructure; and 3. Accelerate adoption of smart, standards-based, interoperable technology that makes
healthcare delivery safer, more efficient, timely, accessible, and patient-centered.7
The TIGER Initiative clearly sees that nurses are in the forefront of patient care and represent the largest group of healthcare professionals in the U.S. From these three areas, the TIGER Initiative then created recommendations for nursing programs. Implications for nursing education in Texas can follow these national guidelines.
Important TIGER Initiative educational recommendations include:
1. Create programs and resources to develop faculty with informatics knowledge, skill and ability and measure the baseline and changes in informatics knowledge among nurse educators and nursing students;
2. Develop a task force to examine the integration of informatics throughout the curriculum;
3. Develop strategies to recruit, retain, and educate current and future nurses in the areas of informatics education, practice, and research;
4. Improve and expand existing Nursing/Clinical/Health Informatics education programs;

Papers on Nursing Workforce
Texas State Health Plan 2011-2016 223
5. Encourage foundations to start programs that provide funding for curriculum development, research, and practice in nursing informatics and IT adoption; and
6. Collaborate with industry and service partners to support faculty creativity in the adoption of informatics technology and offer informatics tools within the curriculum.4
Nursing education must ensure that informatics is incorporated in all levels of nursing education. It is the nurses who will join other disciplines to play a pivotal role in supporting advances in the adoption and implementation of HIT and HIE infrastructure in Texas. References 1. Office of the National Coordinator. (2009) Nationwide Health Information Network (NHIN):
Health IT/Recovery. Retrieved http://healthit.hhs.gov/portal/server.pt?open=512&objID=1310&parentname=CommunityPage&parentid=4&mode=2&in_hi_userid=10741&cached=true. http://healthit.hhs.gov/portal/server.pt?open=512&objID=1191&parentname=CommunityPage&parentid=9&mode=2&in_hi_us
2. Office of the National Coordinator. (2009, December) Help Wanted: Skilled Health IT
Workforce to Modernize Health Care: A Message from Dr. David Blumenthal, National Coordinator for Health Information Technology. Retrieved http://healthit.hhs.gov/portal/server.pt?open=512&objID=1430&mode=2.
3. HIMSS (2009, April). HIMSS 2009 Informatics Nurse Impact Survey. Retrieved
http://himss.org/content/files/HIMSS2009NursingInformaticsImpactSurveyFullResults.pdf 4. TIGER Initiative Education and Faculty Development Collaborative (2007). Collaborating to
Integrate Evidence and Informatics into Nursing Practice and Education: An Executive Summary Retrieved from http://www.tigersummit.com/uploads/Educ.Tiger.Report_final4.pdf
5. Mertz, K. (2008, November). Health Information Technology 2007 and 2008 State
Legislation. Proceeding of the National Conference for State Legislators, Forum for State Ideas, Denver, Co. Retrieved from http://www.ncsl.org/print/health/forum/HIT_Enacted.pdf
6. American Nurses Association (2008). Nursing Informatics Scope and Standards of Practice.
Silver Springs, Maryland: American Nurses Association. 7. TIGER Initiative Education and Faculty Development Collaborative (2009). Transforming
Education for an Informatics Agenda: TIGER Education and Faculty Development
Papers on Nursing Workforce
Texas State Health Plan 2011-2016 224
Collaborative. Retrieved from http://www.tigersummit.com/uploads/Educ.Tiger.Report_final4.pdf

Papers on Nursing Workforce
Texas State Health Plan 2011-2016 225
Retention of Nurses in the Workforce
Cindy Zolnierek, Director of Practice Texas Nurses Association
Addressing the nursing shortage will require efforts at both ends of the pipeline: where nurses enter practice, and where they exit. The issue of recruitment into nursing has been largely resolved as most generic nursing programs in Texas and the country have waiting lists. Focused efforts on nursing program expansion, development of innovative educational approaches, and retention of nursing students have resulted in significant progress in these areas. Still, although the current recession somewhat masks the nursing shortage, projections continue to threaten our preparedness to meet future demand for nurses. In addition to increasing the number of nurses entering practice, retention of those already in practice, provides another avenue to address the shortage. Newly graduated nurses tend to be more successful in their practice, and therefore retained, when supported through special orientation programs, such as the Versant RN Residency. Programs that focus efforts on the quality of the nurse’s practice environment – such as the former Nurse Friendly™ hospital designation program of the Texas Nurses Association and the Magnet Recognition Program® of the American Nurses Credentialing Center – have demonstrated effectiveness in improving nurse satisfaction and increasing nurse retention. Similarly, previous legislative and regulatory efforts – addressing issues such as nurse staffing, mandatory overtime, safe patient handling, less punitive environments (nursing peer review), abuse and harassment protections, and whistleblower protections – support positive practice environments for nurses. Finally, strategies that accommodate the special needs of an aging workforce facilitate productivity and may extend a nurse’s active career. These approaches include the use of special technology and equipment, identification of new roles, and implementation of alternative work schedules. The answer to the nursing shortage will be long term and must include efforts to increase the number of new graduate as well as those to retain nurses in the workforce.

Papers on Nursing Workforce
Texas State Health Plan 2011-2016 226
Comprehensive Strategic Plan for Retention of Nurses in the Workforce
Aileen Kishi, PhD, RN
Program Director Texas Center for Nursing Workforce Studies (TCNWS)
In order to address the nursing shortage in Texas and to develop a nursing workforce that can meet the healthcare demand needs through 2020, complex strategies, in addition to increasing the number of new graduates, need to be developed and implemented. The solutions need to be long-term and directed at both recruitment and retention of nurses. The TCNWS and TCNWS Advisory Committee realize that, in order to increase the supply of nurses to meet demand by 2020, additional strategies such as retention of nurses need to be implemented. In order to effectively address the nursing shortage, a commitment and partnership should be established among healthcare consumers, the Legislature, state and regulatory agencies, educational institutions, healthcare industry, and healthcare and professional organizations. There are no simple solutions to the nursing shortage. This comprehensive strategic action plan reflects the scope and complexity of what actions need to be taken to insure that there are enough nurses to provide healthcare to all citizens of Texas. TO INCREASE RETENTION OF NURSES IN THE NURSING WORKFORCE: It is recommended that: 1. Healthcare organizations and employers of nurses increase the supply and retention of nurses
by regarding them as strategic assets and making positive changes in the work environment. Strategies include the following: 1, 2
A. Provide management training and resources B. Recognize and reward hospitals that attain national/state designation for excellence in
nursing retention by establishing an infrastructure and meeting stringent standards to enhance recruitment and retention of nurses to their facility.3
C. Set staffing levels based on competency and skill mix applicable to patient mix and acuity according to JCAHO standards and Texas Hospital Licensure rules and regulations
D. Measure, analyze and improve staffing effectiveness E. Offer flexible scheduling F. Mentor new graduates and nurses in new and expanding roles G. Establish and implement a comprehensive transition to practice program for new
nurse graduates that integrates clinical reasoning and decision making, setting priorities, use of technology, and reflection and feedback in areas such as the following:
i. Patient-centered care that includes consideration of multiple dimensions of patients and specialty care.

Papers on Nursing Workforce
Texas State Health Plan 2011-2016 227
ii. Communication and teamwork including socialization to the organization and role, working as part of an interprofessional team, and delegation and supervision.
iii. Evidence-based practice including accessing evidence databases, evaluating the evidence, and evaluating the practice changes that are needed.
iv. Quality improvement including use of data to identify quality improvement opportunities, understanding of quality improvement systems, and evidence-based implementation strategies.
v. Informatics including identifying electronic information available at the point of care, accessing the needed information, and understanding of confidentiality.4
H. Promote participation and professional autonomy in clinical decision-making I. Build needed competencies and expertise in specialty nursing care and leadership J. Create additional standards for professional practice environments K. Develop and test new care delivery models L. Create work options for older, mature nurses M. Make use of technology that saves time and money, speeds clinical decision-making,
and reduces risks of error and injury N. Implement ergonomic and safety improvements O. Minimize the paperwork and administrative burden that takes nursing time away from
patient care P. Adopt zero-tolerance for abusive behaviors by physicians and other healthcare
practitioners Q. Adopt fair and competitive compensation and benefit packages for nursing staff
2. To attract and retain a new generation of nurses and to ensure that the new nursing workforce
represents the ethnic and racial diversity of Texas, efforts focus on reinventing nursing education and work environments to address the needs and values of these new workers. Examples of strategies include the following:
A. Create new training/educational models and new community-based roles that utilize nurses’ unique skills
B. Develop replicable demonstration projects to attract and retain men, minorities and special populations such as single mothers, workers displaced from other professions and workers with other degrees who want to make a career change
3. Employers develop or enhance tuition reimbursement programs and flexible work schedules
that promote career pathways for LVNs-to-RNs, RNs-to-BSNs-to-MSNs, MSNs-to-Doctorates, and BSNs-to-Doctorates.

Papers on Nursing Workforce
Texas State Health Plan 2011-2016 228
TO DELAY RETIREMENT OF OLDER, EXPERIENCED NURSES FROM THE WORKFORCE: It is recommended that: 1. Employers of nurses develop a program and strategies to encourage pre-retirement nurses to
extend their work-life careers. Some of these strategies include the following:5 A. Identify technology to boost or maintain productivity. Adjustments, such as allowing
more time to learn how to use the technology and larger computer screens in order to read text more easily, should be made for older, experienced staff nurses
B. Identify equipment that allows nurses to perform responsibilities with decreased physical effort, such as overhead lifts and patient movers
C. Identify nursing positions that are less physically demanding, such as telehealth, telecare and quality management
D. Develop a plan to address the use of older nurses E. Employ older nurses as clinical leaders to educate the younger workforce F. Institute flexible work schedules and part-time or per diem work. Other creative
schedules could include seasonal employment (e.g., working winters with summers off), preferred or flexible work schedules, no weekend shifts
G. Provide financial incentives and optimize hourly salary rates to older, experienced staff nurses
H. Implement a Less-Work for Less-Pay program (e.g. work four hours per shift and get paid for four hours of work).
I. Develop and support health promotion and return-to-work programs (after an employee injury or illness) in order to prevent or treat injuries and medical problems
J. Implement strategies to reduce patient care workload that encourage older, experienced staff nurses to stay at the bedside and promote patient safety
K. Develop a program for retired nurses to recruit and mentor prospective and new nurses throughout the educational process and the first year of work
2. Schools of nursing design new phased retirement plans that support the inclusion of
productive retired faculty, including: A. Re-design current faculty workload to accommodate part-time retired faculty B. In addition to teaching, consider other ways that qualified retired faculty might save
current faculty time by counseling or tutoring students, supervising in skills labs, mentoring students and/or faculty, assisting with research projects and serving as ambassadors to the community
C. As a inducement to participation, create programs that formally include and recognize retired nursing faculty as a continuing productive part of the nursing academic unit
D. Cultivate a workplace that is perceived by faculty as positive, productive, enriching and satisfying so that they will be enticed to continue employment longer than originally planned
This comprehensive strategic action plan is available on the TCNWS website at:
http://www.dshs.state.tx.us/chs/cnws/Npublica.shtm

Papers on Nursing Workforce
Texas State Health Plan 2011-2016 229
Endnotes:
1 Kimball, B. and O’Neil, E. for The Robert Wood Johnson Foundation. Health Care’s Human Crisis: The American Nursing Shortage. Princeton New Jersey: April 2002.
2 Joint Commission on Accreditation of Healthcare Organizations. Health Care at the Crossroads: Strategies for Addressing the Evolving Nursing Crisis. Chicago Illinois: 2002.
3 Such recruitment and retention programs are the American Nurses Credentialing Center’s Magnet Recognition Program® at: http://www.nursingworld.org/ancc/ and the Texas Nurses Association’s Nurse-Friendly™ Designation Program at: http://www.texasnurses.org/index.htm
4 Spector, N. Transition to Practice: Promoting Quality and Safety. Presentation given at the Texas Board of Nursing’s Conference on Nursing Education and Transition Into Practice on February 10, 2010 in Austin, Texas.
5 Strategies listed are based upon what respondents from two studies identified as strategies to encourage older, experienced nurses to delay retirement. For more information, refer to: (1) Leftridge, D. and Jordan, D. Help ease the nursing shortage by retaining senior nurses. Nursing Management 2005, 36(7): 14 and (2) Cyr, J.P. Retaining the older hospital nurses and delaying their retirement. JONA 2005, 35(12): 563-567.

Papers on Nursing Workforce
Texas State Health Plan 2011-2016 230
Use of Nurse Practitioners/Physician Assistants to Address Primary Care Needs in Texas
Heather Morris, MSN, RN, FNP-C Allergy Asthma Clinic of West Texas
Adjunct Faculty Texas Tech University HSC School of Nursing Primary care and the patient-centered medical home or PCMH are vital to the nation’s current health care reform. Primary care is required to achieve superior patient quality, improved access and lower health care costs. However, there is a current state and nationwide shortage of primary care physicians. According to the Regional Center for Health Workforce Studies, in 2000 there were 58 primary care physicians per 100,000, a drop of greater than 9% from 1990. The growing and predicted shortage of primary care physicians has led health care experts to look to additional providers to fill the gap. Nurse practitioners and physician assistants were created years ago to address the need for primary care providers. Both US senate and house of representative health reform bills define primary care as health care that is provided by a physician, nurse practitioner or physician assistant. Primary care physicians, nurse practitioners and physician’s assistants function interdependently within the healthcare system, however, each provider is not used to their full advantage to help expand the primary care workforce in Texas. Nurse practitioners have been evaluated as providers for more than 30 years. The results of a study published in the Journal of the American Medical Association, found that patient outcomes for nurse practitioners and physicians do not differ. Both nurse practitioner and physician assistants deliver quality, cost effective patient care. However, current Texas policies do not support or facilitate the interdependent role of the providers. Current restrictions on nurse practitioner/physician assistants do not allow for ease in providing the much needed primary care to patients.

Papers on Nursing Workforce
Texas State Health Plan 2011-2016 231
Advanced Practice Registered Nurses in Texas
Lynda Woolbert, MSN, RN, PNP
Executive Director Coalition for Nurses in Advanced Practice (CNAP)
Advanced Practice Registered Nurses (APRNs) are educated to diagnose, prescribe drugs and therapeutic measures, and provide advanced nursing care for a specific population of patients. The Texas Board of Nursing (BON) licenses four categories of APRNs:
Clinical Nurse Specialists (CNS); Nurse Anesthetists (CRNAs); Nurse-Midwives (CNMs); and Nurse Practitioners (NPs).
The growing shortage of primary care physicians, emphasis on quality health care, increasing demand for health care services, and need to control costs will increase APRNs’ roles in health care delivery. The Institute of Medicine suggests nurses, APRNs and other personnel can manage about 80% of care and recommends that the most highly trained practitioners only handle more complicated work constituting about 20% of cases (Institute of Medicine, 2001). A 2009 policy monograph by the American College of Physicians acknowledged that “NPs are health care professionals with the capability to provide important and critical access to primary care” (American College of Physicians, 2009). Despite their potential to boost the primary care workforce and provide other essential health care services, two factors keep Texas from taking full advantage of the APRNs it educates.
1. Texas law requiring physician delegation of prescriptive authority to APRNs reduces the number of patients that APRNs and physicians can see because of physician supervisory requirements. The restrictive law also reduces the ability of APRNs to work in rural sites that are distant from a physician since physicians are required to be onsite once every 10 business days in medically underserved sites.
2. Closure of all the Texas nurse-midwifery educational programs by 2007 is keeping the number of CNMs in Texas per 100,000 population very low. In 2003, the last year comparable statistics are available, the ratio of CNMs per 100,000 in Texas was already well below states with a favorable practice environment such as New Mexico (1.1 in Texas, 2.8 in the U.S. and 6.9 in New Mexico), (HRSA, 2003); (HRSA, no date). Texas now has one nurse-midwifery program at Baylor University Louise Herrington School of Nursing in Dallas that opened in 2008. The program will produce three CNMs in 2010, and four to five in 2011 (Brucker, personal communication). Texas needs additional nurse-midwifery programs to educate the number of CNMs required to improve birth outcomes in Texas.
Certified nurse-midwives have the potential to save Texas the most health care dollars of any APRN provider group. Research consistently demonstrates that care by CNMs significantly lowers rates of Cesarean section (by a minimum of 4% and often much more), prematurity, and low-birthweight; thereby reducing admissions to neonatal intensive care units (American College

Papers on Nursing Workforce
Texas State Health Plan 2011-2016 232
of Nurse Midwives, 2008). The Texas Medicaid Program pays for over 50% of births in Texas and Cesarean section is the most common surgical procedure in the United States. (HHSC, 2009; Vanderbilt, 2009) In 2006, Texas birth outcomes included 54,612 preterm births (before 37 weeks gestation); 33,727 low-birthweight babies (under 5.5 pounds), and 5,923 very low-birthweight babies (under 3.4 pounds). (Kids Count, 2006) APRNs have the potential to make a significant impact on health care for medically underserved populations. In 2008 the University of Texas at Austin College of Communications conducted a survey of 1,839 APRNs living in Texas. Only those currently employed as an APRN completed the survey. While only 9% of respondents currently work in rural or frontier counties, 31% work in inner city locations. Of all respondents, 43% work primarily in sites serving medically underserved populations. Three-quarters of 961 respondents indicated they would be extremely (28%), very (22%), or somewhat (25%) willing to work in a rural or underserved location if having a delegating physician to diagnose and prescribe was no longer required. Since 1989, Texas APRNs have had prescriptive authority that is physician-delegated and site-based. This means that physicians are limited to delegating to APRNs that work in certain defined sites where the physician can provide specified types of supervision. Most states do not require physicians to delegate prescriptive authority, and research consistently demonstrates that APRNs diagnose as accurately and prescribe as safely as physicians. (American Academy of Nurse Practitioners, 2007; Colorado Scopes of Care Advisory Committee, 2008; Pearson, 2009) References American Academy of Nurse Practitioners. (2007). Quality of nurse practitioner practice. Retrieved on February 5, 2010 from http://www.aanp.org/NR/rdonlyres/34E7FF57-E071-4014-B554-FF02B82FF2F2/0/Quality_of_NP_Prac112907.pdf American College of Nurse-Midwives (ACNM). (2008). Nurse-midwifery in 2008: Evidence-based practice. Retrieved on February 5, 2010 from http://www.acnm.org/siteFiles/news/nurse_midwifery_in_2008.pdf ACNM (no date). American College of Nurse-Midwifery datasets. Retrieved on February 8, 2010 from http://www.acnm.org/publications.cfm American College of Physicians. (2009). Nurse practitioners in primary care. Retrieved on February 8, 2010 from http://www.acponline.org/advocacy/where_we_stand/policy/np_pc.pdf Brucker, M. (personal communication, February 4, 2010). [email protected]. Colorado Collaborative Scopes of Care Advisory Committee. (December 30,2008). Final report of findings, pp. 31-32. Retrieved on February 5, 2010 from http://www.coloradohealthinstitute.org/Publications/2009/01/Collaborative-Scopes-of-Care-Study.aspx

Papers on Nursing Workforce
Texas State Health Plan 2011-2016 233
Health Resources and Services Administration (HRSA). (2003). Border county health workforce profiles. Retrieved on February 8, 2010 from http://bhpr.hrsa.gov/healthworkforce/border/default.htm Health Resources and Services Administration (HRSA). (no date). A comparison of changes in the professional practice of nurse practitioners, physician assistants, and certified nurse midwives: 1992 and 2000. Retrieved on February 5, 2010 from http://bhpr.hrsa.gov/healthworkforce/reports/nursing/changeinpractice/chapter6.htm Committee on Quality Health Care in America at the Institute of Medicine. (2001). Crossing the quality chasm: a new health system for the 21st century, pp.120 - 122. Retrieved on February 8, 2010 from http://books.nap.edu/openbook.php?record_id=10027&page=120 Kids Count (2006). Kids count data center. Retrieved on February 8, 2010 from http://datacenter.kidscount.org/data/acrossstates/Default.aspx Pearson, L.J. (2009). The Pearson report. The American Journal for Nurse Practitioners, 13, 2. Retrieved on February 8, 2009 from http://www.webnp.net/downloads/pearson_report09/ajnp_pearson09.pdf Texas Health & Human Services Commission (January 2009). Texas Medicaid and CHIP in perspective,Seventh Ed. Chapter 4, 4-11. Retrieved on February 5, 2010 from http://www.hhsc.state.tx.us/medicaid/reports/PB7/PinkBookTOC.html Vanderbilt University. (November 23, 2009). Rebirth of the midwife. Vanderbilt Magazine. Retrieved on February 5, 2010 from http://www.vanderbilt.edu/magazines/vanderbilt-magazine/2009/11/rebirth-of-the-midwife/print/

Papers on Nursing Workforce
Texas State Health Plan 2011-2016 234
Certified Registered Nurse Anesthetists in Texas
Kent Cannaday, CRNA
Certified Registered Nurse Anesthetists (CRNAs) are one of the four recognized types of Advanced Practice Registered Nurses (APRNs). (Texas Administrative Code) All CRNAs are educated and certified to meet national standards and provide the full range of anesthesia and anesthesia related services, including obstetrical analgesia and trauma stabilization. (AANA, Qualifications) CRNAs have been providing anesthesia for over 125 years, and research demonstrates that anesthesia is equally safe when provided by CRNAs practicing independently compared with any other model of anesthesia care delivery. (AANA, History; AANA, Quality)
CRNAs may work in collaboration with other health care providers, but Texas law does not require CRNAs to be supervised by a physician. (Texas Occupations Code; Texas Attorney General, 1999) Since Texas law supports CRNA practicing where no anesthesiologists live, CRNAs are the sole anesthesia providers in 82 rural Texas counties, as well as providing services in urban and suburban counties. (Texas Association of Nurse Anesthetists Distribution of Anesthesia Providers in the State of Texas, 2008) If not for CRNAs in rural Texas, surgical anesthesia, obstetrical anesthesia and trauma stabilization services would not be available. (TANA, 2008).
References
American Association of Nurse Anesthetists (AANA). Qualifications and capabilities of the certified registered nurse anesthetist. Retrieved on February 10, 2010 from http://www.aana.com/qualifications.aspx
AANA (2010). Hisotry of nurse anesthesia practice. Retrieved on February 10, 2010 from http://www.aana.com/crnahistory.aspx
AANA (2010). Quality of Care in anesthesia. Retrieved on February 10, 2010 from http://www.aana.com/qualityofcare.aspx

Papers on Nursing Workforce
Texas State Health Plan 2011-2016 235
Issues in Public Health Nursing
Diane Faucher Moy, MSN, RN, PMHCNS-BC
State Director of Nursing Office of Academic Linkages
Texas Department of State Health Services
In Texas, the public health nursing workforce includes nurses working in both traditional public health nursing roles and nurses in psychiatric-mental health nursing roles. Major issues facing Texas with regard to its public health nursing workforce include:
o Inadequate funding invested in full-time public health nursing positions. This results in high use of much more expensive nursing services provided through proprietary temporary staff agencies. These agencies provide staff that may not be adequately trained and qualified for the unique aspects of public health nursing roles. Use of such services exacerbates the loss of a well-qualified, consistent workforce. There has to be a critical mass of nurses employed in public health in order to create a positive, nurse-friendly work culture. Fewer nursing employees results in greater reliance on temporary staffing. Greater temporary staffing use results in less funding for nursing positions, fewer nurse applicants for positions, and fewer nursing students receiving positive public health nursing clinical experiences. This is essentially a downward spiraling cycle that is destroying public health nursing in Texas.
o Non-competitive nursing salaries. Salaries lag behind salaries in all other traditional
nursing employment settings, e.g., acute care, extended care, etc. A lack of investment in competitive salaries leads to the use of temporary staff agencies that costs many times the salary of a nursing position.
o Exodus of older nurses in public health with no new generation of nurses entering
the profession of public health nursing. New graduates and nurses looking for a different career focus do not choose public health nursing due to inadequate pay, lack of career mobility, and the probability of having to work in an organizational culture chronically short of nurses and relying on temporary agency staffing.
o Failure to retain public health nurses. Some regions have an average two-year
turnover rate exceeding 100 percent. This is largely due to not having any career ladder or compensation program that recognizes advanced education and/or excellence in practice.
o Lack of a plan to promote public health nursing workforce diversity and cultural
competence. This is a major concern given the projection of the state demographer with regard to major shifts in characteristics of persons residing in Texas.

Papers on Nursing Workforce
Texas State Health Plan 2011-2016 236
o Lack of new graduate interest in public health nursing. In large, new graduates are not interested in public health nursing. This is an area worth studying but anecdotally appears to be due to lack of competitive salaries and a competing desire to work in an acute care, traditional setting. Baccalaureate nursing students often have an abbreviated public health clinical experience because of a lack of public health nursing workforce to serve as role models, preceptors, etc. and a lack of baccalaureate or graduate-level nurses in the public health nursing workforce.
o Lack of qualified nursing applicants. There are few applicants for public health
nursing positions, some positions remaining open for months without an applicant. A number of public health nursing positions have been re-classified as program specialists. Those hired are not nurses, adding to the downward spiral of a public health nursing workforce. Associate degree and vocational nursing programs do not have a public health nursing course or course content. Some states require that public health nurses have a baccalaureate degree. Texas does not have that requirement. Although baccalaureate level nurses are the most qualified for these public health nursing roles, these nurses do not apply for such positions due to salary concerns, lack of a positive nursing workforce culture, etc. This results in Texas having to hire less-qualified applicants who often leave employment due to not having the requisite knowledge and skills for the job.
Lack of loan forgiveness programs and lack of funding for sponsoring employees. Although
there are mechanisms in place for sponsoring employees for further education in nursing, there is
no dedicated fund for such programs. Any funding for such purposes must come from agency
operating budgets, which are already overburdened. There is no specific loan forgiveness
program for public health nursing in Texas. Such programs


