23
STATE HEALTH REFORM IMPACT MODELING PROJECT Texas Prepared by the Center for Health Law and Policy Innovation of Harvard Law School and the Treatment Access Expansion Project January 2013

STATE HEALTH REFORM IMPACT MODELING PROJECT
Texas
Prepared by the Center for Health Law and Policy Innovation of Harvard Law School and the Treatment Access Expansion Project
January 2013


State Health Reform Impact Modeling Project: Texas 1
The Patient Protection and Affordable Care Act (ACA) will dramatically change how
people living with HIV access healthcare.1 In states that fully implement the law
(including expanding Medicaid), thousands of uninsured people living with HIV—many
of whom currently receive care and treatment through Ryan White program—will have
access to healthcare through Medicaid or subsidized private health insurance.
The State Health Reform Impact Modeling Project (the Modeling Project) assesses the impact that healthcare reform will have on people living with HIV by compiling and analyzing Ryan White program and AIDS Drug Assistance Program (ADAP) data to predict the shift of uninsured people living with HIV from these discretionary programs to Medicaid or private insurance in all 50 states pursuant to the ACA. In addition, for 21 states and the District of Columbia (DC), the Modeling Project compiles and analyzes detailed budgets and benefit guidelines to assess the services provided by the Ryan White program, ADAP, Medicaid, and plans sold on an exchange, in order to estimate the impact that a transition into Medicaid or private subsidized insurance will have on low-income people living with HIV.2
Information on the methodology used to model numerical results for each state and DC are available in Appendix A. See Appendix B for additional
methodology, notes, and a summary of the limitations of the modeling process.
In Texas, the Modeling Project focuses on four state-specific inquiries:
1. What demographic information is available about Ryan White program and ADAP clients?
2. How many ADAP clients will be newly eligible for Medicaid or private insurance subsidies in 2014?
3. What services are currently available to people living with HIV under the Ryan White program versus Medicaid or plans to be sold on an exchange, and what gaps in services currently exist?
4. Given the current Ryan White, Medicaid, and benchmark plans, what are the likely outcomes of a transition from one program to another in 2014?
BACKGROUND
2 State Health Reform Impact Modeling Project: Texas
TEXANS LIVING WITH HIV OR AIDS
UNMET NEED
As of 2011, 27% of people diagnosed with HIV (18,784 individuals) were not receiving any HIV-related medical care.3 Need is met if a patient receives at least one of four services: a viral load test, a CD4 test, an HIV related prescription, or a medical visit.3,* In 2011, 17% of newly diagnosed individuals (553 individuals) were not linked to care.3 Over the past 5 years, 44% of individuals were retained in care, 38% were in and out of care, while 18% had no record of care at all.3 Because untreated patients are
not part of the Ryan White program or ADAP, they are not counted in the Modeling Project’s estimation of newly eligibles for Medicaid or private subsidized insurance in 2014. It is likely that most of these individuals will also be newly eligible for Medicaid in 2014 (ie, are living under 133% of the federal poverty level (FPL), as those least likely to be in care are low-income minorities and intravenous drug users).3
THE RYAN WHITE PROGRAM IN TEXAS
The Ryan White program is a discretionary, federally funded program providing HIV-related services across the United States to those who do not have other means of accessing treatment and care. In other words, it serves as a critical payer of last resort, filling gaps in healthcare and ancillary support services that are unmet by all other charitable or funded healthcare services. In 2010, Texas received
$153,515,213 of Ryan White funding,4 and served 58,092 duplicated clients.3,5 About 58.4% of the state’s Ryan White funds were Part B grants, assigned based on prevalence of HIV in the state.6 Of these, approximately 24.1% covered core medical services, 63.9% went toward the AIDS Drug Assistance Program (ADAP), and 9.7% provided ADAP supplemental funding.5
ADAP IN TEXAS
ADAP is a component of Ryan White (within Part B), which is also funded with matching state appropriations and covers the cost of antiretroviral treatment (ART) for enrollees. To be eligible for ADAP in Texas (also referred to as the Texas HIV Medication Program, or THMP), one must:
❯ Be a Texas resident diagnosed with HIV;
❯ Meet drug-specific eligibility criteria of one or more of the drugs listed on the THMP/ADAP formulary;
❯ Be under the care of a Texas-licensed physician who prescribes the medication(s); and
❯ Meet financial eligibility criteria.7
To be financially eligible, one must:
❯ Not be covered for the medication(s) under the Texas Medicaid Program, or, if covered, have met the Medicaid pharmacy benefit monthly maximum;
❯ Not be covered for the medication(s) by any other third-party payer; and
❯ Have an adjusted gross income that does not exceed 200% of the federal poverty level (FPL) (including spousal income).6
As of June 2011, 14,123 Texans were enrolled in ADAP.8 The state’s fiscal year 2011 ADAP budget was $96,383,814 ($64,245,687 in federal funds).9 Approximately 87.1% of these funds were used to cover the cost of prescription drugs, 5.4% was used to provide insurance assistance to cover copayments and deductibles, and the remaining 7.5% was used for program administration.10,‡
State contributions to ADAP have been growing as a result of the increasing number of people living with HIV, the rising cost of HIV medications, and the increasingly complex drug regimens that some patients require.11 As a way to contain costs, the Texas Department of State Health Services (TDSHS) has considered purchasing insurance for some
TEXAS
* This definition of met need is a technical definition used by the Texas Department of State Health Services to track HIV patients in care. Some patients may fall within this definition even if their medical needs are not met (eg, a patient who has been tested and diagnosed with HIV, but never receives ART when clinically appropriate).
‡ In fiscal year 2010, Texas spent $106,814,957 on ADAP, of which $93,009,334 was used to cover the cost of prescription drugs, $5,805,624 was used for insurance copayments and deductibles, and $8,000,000 was used for program administration.
State Health Reform Impact Modeling Project: Texas 3
ADAP clients, as well as limiting new enrollment into the program.10 Three eligibility changes are being considered:
❯ Requiring new applicants to present with a CD4 count of less than 500 cells/µL;
❯ Switching from using adjusted gross income to gross income when determining eligibility; or
❯ Requiring new applicants to present with a CD4 count of less than 350 cells/µL.10
Such policies are unlikely to save money and may adversely affect the health of individuals and the public. Early initiation of ART results in a 96% reduction in HIV transmission to sexual partners,12 meaning that requiring patients to present with lower CD4 counts before qualifying for ADAP-funded ART would result in avoidable transmission of HIV. Moreover, patients who do not receive treatment until their HIV has progressed to AIDS or their CD4 count has dropped below 200 cells/µL incur care costs that are 1.5 to 3.7 times higher than the costs incurred by patients who initiate treatment earlier.11
CURRENT RYAN WHITE AND ADAP SPENDING AND RECIPIENT POOL
In 2010, the Ryan White program served 58,092 duplicated clients in the state; 90% will be eligible for Medicaid or a Basic Health Plan (BHP) under the Patient Protection and Affordable Care Act (ACA) (excluding those otherwise eligible for insurance).4 Between 12,66213 and 16,50114 residents received assistance from the AIDS Drug Assistance Program (ADAP) in 2010.§ In June 2011, ADAP served 10,959 Texans.15 Of these individuals, 65% would be eligible for Medicaid under the expansion (see Appendix A) and 35% would be eligible for a BHP, if one is created.14
These numbers are significant; because the majority of individuals receiving support from these programs are African-American (42% of Ryan White recipients5 and 30-34% of ADAP beneficiaries in 2010),13,16 implementing Medicaid in a way that ensures continuity in access to services will be critical to reducing health disparities. Moreover, an increasing proportion of these individuals are uninsured, making them perfect candidates for Medicaid or subsidized private insurance (41% of Ryan White clients were uninsured in 20104 and 93% of ADAP beneficiaries were uninsured in 2011).16
THE ACA AND ITS IMPACT ON HIV+ TEXANS
THE MEDICAID EXPANSION
Beginning in January 2014, the Patient Protection and Affordable Care Act (ACA) will expand Medicaid eligibility to most individuals under 65 years of age living below 133% of the federal poverty level (FPL).17,** Although the Department of Health and Human Services (HHS) cannot force states to comply with the expansion (by withdrawing existing federal
medical funding), the federal government will cover 100% of the cost of newly eligible beneficiaries until 2016, and at least 90% thereafter. Newly eligible enrollees will receive a benchmark benefit package that must include at least ten categories of essential health benefits, described in the following section.19
SUBSIDIES FOR PRIVATE INSURANCE PREMIUMS, AND STATE-BASED INSURANCE EXCHANGES
The ACA extends insurance premium credits to individuals and families living below 400% FPL, to ensure that premiums do not exceed 2.0-9.8% of household income.20 Eligible individuals and families can employ these credits to purchase a private health insurance plan on a state or federally operated insurance exchange.
Exchanges will be operational January 1, 2014.21 States can elect to set up state-run exchanges, partner with the federal government to set up a hybrid state-federal exchange, or default into federally facilitated exchanges. Each exchange will provide individuals and families with a choice of plans, tiered by actuarial value of coverage (bronze, silver, gold, and platinum). Each plan available on an exchange
§ The data from the federal Health Resources and Services Administration (HRSA) and the National Alliance of State and Territorial AIDS Directors (NASTAD) are slightly inconsistent, because HRSA provided data for 2010, whereas NASTAD provided data for fiscal year 2010.
** Undocumented immigrants and lawfully residing immigrant adults who have been in the country 5 years or less will not be eligible for Medicaid coverage. Department of HealtH anD Human ServiceS office of tHe aSSiStant Secretary for planning anD evaluation, tHe afforDable care act: coverage implicationS anD iSSueS for immigrant familieS, 7, available at http://aspe.hhs.gov/hsp/11/ImmigrantAccess/Coverage/ib.pdf.

4 State Health Reform Impact Modeling Project: Texas
must, at a minimum, adhere to a state-defined and federally approved list of essential health benefits;
these benefits are discussed in the following section.
THE BASIC HEALTH PLAN
The ACA also provides additional federal medical funding to states that create a Basic Health Plan (BHP), covering most individuals under 65 years of age living between 133-200% FPL as well as legal residents who do not qualify for Medicaid because of the 5-year residency requirement.22 BHPs must cover at least the essential health benefits and have
the same actuarial value of coverage as a bronze plan the individual might otherwise purchase on an exchange.23 Cost sharing on BHPs can be subsidized, either for all beneficiaries or for those with specific chronic conditions (eg, HIV/AIDS).24 The federal government is expected to pay up to 95% of the premium credits for individuals enrolled in a BHP.25
ESSENTIAL HEALTH BENEFITS
The ACA requires both Medicaid plans and private health insurance plans sold on state-based insurance exchanges to provide a minimum of essential health benefits (EHB), to be defined by the Secretary of HHS.26 EHB must include items and services within the following ten benefit categories:27
1. Ambulatory patient services;
2. Emergency services;
3. Hospitalization;
4. Maternity and newborn care;
5. Mental health and substance use disorder services, including behavioral health treatment;
6. Prescription drugs;
7. Rehabilitative and habilitative services and devices;
8. Laboratory services;
9. Preventive and wellness services and chronic disease management; and
10. Pediatric services, including oral and vision care.
HHS released a proposed rule that will define the scope of EHB on the private market, and will accept public comments before drafting final guidance.20 The Centers for Medicare and Medicaid Services has indicated that the HHS rule on EHB will also apply to newly eligible Medicaid beneficiaries, in addition to the protections provided under the Social Security Act.21 This means that benefits provided by Medicaid will likely be more robust than on the private market. For example, the Social Security Act requires that a Medicaid benchmark plan cover any US Food and Drug Administration–approved drugs with significant clinically meaningful therapeutic advantage over another.22
AN ESTIMATE OF CURRENT RYAN WHITE AND ADAP CLIENTS WHO WILL BE ELIGIBLE FOR MEDICAID OR INSURANCE CREDITS IN 2014
Given the ACA-instituted reforms, a large number of HIV+ Texans are expected to become eligible for Medicaid or a BHP in 2014, provided that Texas expands Medicaid and institutes a BHP. An estimated 90% of the state’s Ryan White program clients in 2010 were at 200% FPL or lower, making them potentially eligible for either Medicaid or a BHP.4 More specifically, approximately 65% of Texas AIDS Drug Assistance Program (ADAP) clients will be eligible for Medicaid following its expansion (see Appendix A), and 35% will be eligible for a BHP.Finally, many of the estimated 24,006 Texans living with HIV/AIDS and who have not received HIV-related medical care are likely to become eligible for Medicaid in 2014, given the assumption that a significant number of these individuals are living near the FPL.
The percentage of Texas’ ADAP clients who will be newly eligible for Medicaid (53%) is higher than the
total proportion of Americans who will be newly eligible, which stands at approximately 29% (see Appendix A). This is primarily because Texas’ ADAP primarily serves individuals with incomes below 133% FPL (as many as 65% of the state’s ADAP clients were living below 133% FPL in 2011),14 but also because the state’s ADAP clients are almost entirely uninsured (approximately 85% of ADAP clients served in 2011).16
Similarly, the percentage of Texas’ ADAP clients who will be newly eligible for private insurance subsidies (26%) is higher than the total proportion of Americans who will be newly eligible for subsidies, which stands at approximately 15% (see Appendix A). This is due to the sizable group of ADAP clients served who are just above 133% FPL (approximately 35% of ADAP clients served in 2011 were living between 134-200% FPL, many of whom are also uninsured).16

State Health Reform Impact Modeling Project: Texas 5
A COMPARISON OF SERVICES PROVIDED BY RYAN WHITE, ADAP, MEDICAID, AND THE EXCHANGE TO HIV+ TEXANSSince a significant number of HIV+ individuals in Texas who are currently served by the Ryan White program or the AIDS Drug Assistance Program (ADAP) are likely to be eligible for Medicaid in 2014, it is important to assess the outcome of transitioning from the former programs to Medicaid. This assessment compares and contrasts the services
and treatments that the Ryan White program, ADAP, and Medicaid currently provide to HIV+ Texans. Forthcoming federal guidance on the essential health benefits that newly eligible Medicaid beneficiaries are guaranteed under the Patient Protection and Affordable Care Act (ACA) will affect the scope of coverage provided in 2014.
COMPARING RYAN WHITE, MEDICAID, AND THE BENCHMARK PLAN FOR THE EXCHANGE IN TEXAS
The Ryan White program funds both core medical services and support services for patients living with HIV (see Appendix C for a breakdown of core medical services versus support services). Both medical and ancillary services are critical to maintaining the health of low-income individuals who may not have access to many necessities that facilitate effective HIV treatment and care (eg, transportation, child care, nutrition). However, Medicaid and Texas’s benchmark plan, which will determine essential health benefits (EHB) for private insurance sold on the state’s exchange, do not cover ancillary services (although they cover a broader range of medical services). Accounting for the gaps between the Ryan White program and Medicaid or private insurance sold on the exchange will be critical in transitioning Ryan White beneficiaries onto Medicaid and private insurance while ensuring that health status does not deteriorate (eg, due to lack of proper nutrition, access to transportation to a health clinic, or stable housing). For example, oral health care, housing, and transportation are already a few of the most severe
gaps in care in most Health Service Delivery Areas (HSDAs) in Texas.32
Texas currently has three different types of managed care Medicaid programs: STAR, STAR+PLUS, and STAR Health. Most standard Medicaid managed care programs are STAR programs, whereas the STAR+PLUS plan combines acute care with long-term care services for people aged 65 years and older, and STAR Health covers children. Currently, there are 18 different STAR programs to choose from, which vary depending on geographic location.32 While the managed care programs cover many services, there are certain services that are considered carve-out services, which are still provided by Texas Medicaid and not the client’s managed care program.34
Table 1 provides a comparison of covered services between Texas’ Ryan White and Medicaid programs, as well as the largest small-group market plan in the state (the default benchmark plan used for purposes of defining EHB).
Table 1. Ryan White Versus Medicaid and the Benchmark Plan: Covered Services
Benefits applying only to beneficiaries under 21 years of age are not assessed in this report.
Covered Service Ryan White34 Medicaid‡‡,35
Blue Cross Blue Shield
of Texas –
BestChoice PPO36
Home Health Care X X X
Mental Health X X X
Substance Abuse (outpatient) X X38 X
Continued on next page
‡‡ Texas Medicaid managed care programs must at a minimum cover the same services that the Texas fee-for-service Medicaid program covers. texaS HealtH anD Human ServiceS commiSSion, Texas Medicaid Provider Procedures Manual, November 2012, Volume 2, 8 (Nov. 2012) available at http://www.tmhp.com/TMPPM/TMPPM_Living_Manual_Current/Vol2_Medicaid_Managed_Care_Handbook.pdf.
†† Some Medicaid patients on managed care may have additional healthcare benefits such as limited adult dental benefits, additional vision benefits, or additional transportation. TEXAS HEALTH AND HUMAN SERVICES COMMISSION (HHSC), CHAPTER 6: MEDICAID MANAGED CARE, http://www.hhsc.state.tx.us/medicaid/reports/PB8/PDF/Chp-5.pdf (last visited September 26, 2012).

6 State Health Reform Impact Modeling Project: Texas
Substance Abuse (inpatient) X X X
Medical Case Management X X
Community Based Care X X
Ambulatory/Outpatient Care X X X
Oral Health Care X X
Early Intervention Clinic X
Nonmedical Case Management Services X
Child Care X
Emergency Financial Assistance X
Food Bank/Home-Delivered Meals X
Housing Services X
Health Education/Risk Reduction X
Legal Services X
Linguistic Services X
Nonemergency Medical Transportation X
Outreach Services X
Psychosocial Support X
Referral Agencies X
Treatment Adherence Counseling X
Intermediate Care Facilities for the Mentally Retarded
X
Family Planning Services and Supplies X X
Hospital Services (outpatient) X X
Hospital Services (inpatient) X X
Rural Health Clinic Services X
Hospice Services X X
Lab and X-ray Services X§§ X
Prescription Drugs X X X
Vision Care (including contacts and eyeglasses)
X X (routine eye exam only)
Nursing Facility X X
Midwife/NP Services X
Private Duty Nursing
Physician Services X X
Licensed Marriage and Family Therapists X
Licensed Clinical Social Workers X
Chiropractor X X
Podiatry X
Mental Health Rehabilitation X X
PT, OT, and Speech Therapy X X
Renal Dialysis X
Hearing Instruments and Related Audiology X X
Table 1. (continued)
§§ HIV testing is covered by Medicaid if it is considered medically necessary; it is not part of routine treatment. KaiSer family founDation, 50 State Comparisons, Medicaid Coverage of HIV Testing, 2010, http://www.statehealthfacts.org/comparemaptable.jsp?ind=1013&cat=11 (last visited September 13, 2012).

State Health Reform Impact Modeling Project: Texas 7
As Table 1 indicates, the Ryan White program covers critical services for low-income people living with HIV/AIDS, many of whom are not available to Medicaid beneficiaries or people covered by Texas’ benchmark plan (eg, nonmedical case management, legal services, food bank and home delivered meals, linguistic services, housing services, and emergency financial assistance). Since these ancillary services
are important for the well-being of people living with HIV/AIDS, in fact there has been evidence to suggest that HIV patients using Ryan White program services have higher care-retention rates than HIV patients not in the program. The individuals who transition from the Ryan White program on to Medicaid or private insurance plans are likely to be at a disadvantage.
COMPARING ADAP, MEDICAID, AND THE BENCHMARK PLAN FOR THE EXCHANGE IN TEXAS
ADAP provides funding for a robust drug formulary that is necessary to afford low-income individuals access to a combination of drugs to treat HIV. All states participating in ADAP must cover at least one drug in every class of antiretroviral treatment (ART); most cover almost all drugs in each class. The Texas Medicaid Vendor Drug Program defines the drug formulary for the Medicaid STAR plans differently (and its formulary for newly eligible individuals has yet to be defined). Ensuring that Medicaid STAR plans
and plans sold on the exchange provide coverage for a sufficient number of antiretroviral medications will also be critical to maintaining the health of Texans living with HIV.
Table 2 provides a comparison of the antiretroviral drug formularies included in the state’s ADAP and Medicaid programs, as well as the largest small-group market plan in the state (the benchmark plan used for purposes of defining EHB for plans sold on an exchange).
Table 2: ADAP Versus Medicaid and the Benchmark Plan: Covered Drugs39
Benefits applying only to beneficiaries under 21 years of age are not assessed in this report.
Drugs
(ART class indicated in bold;
brand name in normal type; generic in italics) ADAP39 Medicaid40
Blue Cross Blue
Shield of Texas –
BestChoice PPO)41
Multiclass Combination Drugs 2 Drugs Covered 2 Drugs Covered 1 Drug Covered
Atripla; efavirenz + emtricitabine + tenofovir DF X (counted as 3 medications)
X X
Complera; emtricitabine + rilpivirine + tenofovir X (counted as 3 medications)
X
Stribild; elvitegravir + cobicistat + emtricitabine + tenofovir
Nucleoside Reverse Transcriptase Inhibitors 11 Drugs Covered 11 Drugs Covered 11 Drugs Covered
Combivir; lamivudine, zidovudine X (counted as 2 medications)
X X
Emtriva; emtricitabine X X X
Epivir; lamivudine X X X
Epzicom; abacavir, lamivudine X (counted as 2 medications)
X X
Retrovir; zidovudine X X X
Trizivir; abacavir + zidovudine + lamivudine X (counted as 3 medications)
X X
Truvada; tenofovir DF + emtricitabine X (counted as 2 medications)
X X
Videx EC; didanosine (delayed–release capsules) X X X
Viread; tenofovir disoproxil fumarate DF X X X
Zerit; stavudine X X X
Ziagen; abacavir X X X
Continued on next page

8 State Health Reform Impact Modeling Project: Texas
NNRTIs 5 Drugs Covered 5 Drugs Covered 4 Drugs Covered
Edurant; rilpivirine X X
Intelence; etravirine X X X
Rescriptor; delavirdine mesylate X X X
Sustiva; efavirenz X X X
Viramune; nevirapine X X X
Protease Inhibitors 9 Drugs Covered 9 Drugs Covered 9 Drugs Covered
Agenerase; amprenavir
Aptivus; tipranavir X X X
Crixivan; indinavir sulfate X X X
Invirase; saquinavir mesylate X X X
Kaletra; lopinavir + ritonavir X X X
Lexiva; fosamprenavir X X X
Norvir; ritonavir X X X
Prezista; darunavir X X X
Reyataz; atazanavir sulfate X X X
Viracept; nelfinavir sulfate X X X
Fusion Inhibitors 1 Drug Covered 1 Drug Covered 1 Drug Covered
Fuzeon; enfuvirtide X X X (PA)
Entry Inhibitors – CCR-5 Coreceptor Antagonist 1 Drug Covered 1 Drug Covered 1 Drug Covered
Selzentry; maraviroc X X X
HIV Integrase Strand Transfer Inhibitors 1 Drug Covered 1 Drug Covered 1 Drug Covered
Isentress; raltegravir X X X
“A1” Opportunistic Infection Medications 14 Drugs Covered 30 Drugs Covered 21 Drugs Covered
Ancobon; flucytosine X (Ancobon only)
X
Bactrim; sulfamethoxazole/trimethoprim DS X X X (generic only)
Biaxin; clarithromycin X (current or previous diagnosis
of mycobacterium avium complex required)
X X (generic only)
Cleocin; clindamycin X X (generic only)
Dapsone X (CD4 count of ≤200, or
symptoms such as thrush, unexplained fever >100 °F for over 2 weeks, or a child aged
under 13 years with ACTG clinical indicators required)
X X
Daraprim; pyrimethamine X (Daraprim only)
X
Deltasone; prednisone X (generic only)
Diflucan; fluconazole X (cryptococcal meningitis or
esophageal candidiasis)
X X
Famvir; famciclovir X X (generic only)
Foscavir; foscarnet X (generic only)
Table 2. (continued)
Continued on next page

State Health Reform Impact Modeling Project: Texas 9
Fungizone; amphotericin B X (generic only)
INH; isoniazid X (generic only)
X
Megace; megestrol X (AIDS diagnosis and achexia
or anorexia with acute or chronic weight loss)
X (Megace only)
X (generic only)
Mepron; atovaquone X (acute, mild-to-moderate
pneumocystis carinii pneumonia and intolerance
to sulfamethoxazole-trimethoprim)
X
Myambutol; ethambutol X (current or previous diagnosis
of mycobacterium avium complex required)
X (generic only)
X (generic only)
Mycobutin; rifabutin X (CD4 count ≤100 required)
X (Mycobutin only)
X
NebuPent; pentamidine X X (Nebupent only)
Nydrazid; isoniazid, INH
Probenecid X X
Procrit; erythropoietin X (Procrit only)
Pyrazinamide (PZA) X X
Rifadin, Rimactane; rifampin X X
Sporanox; itraconazole X (histoplasmosis,
blastomycosis, or esophageal candidiasis
diagnosis required)
X X
Sulfadiazine – Oral X
Valcyte; valganciclovir X (CMV disease that has resulted in retinitis or
infections of other major organs required)
X (Valcyte only)
X
Valtrex; valacyclovir X (acute or chronic herpetic
infections required)
X X (generic only)
VFEND; voriconazole X X (generic only)
Vistide; cidofovir X (Vistide only)
Wellcovorin; leucovorin X (generic only)
Zithromax; azithromycin X (current or previous diagnosis
of mycobacterium avium complex required; failed
therapy on clarithromycin)
X X
Zovirax; acyclovir X (acute or chronic herpetic
infections required)
X X (generic only)
Table 2. (continued)

10 State Health Reform Impact Modeling Project: Texas
Currently there are over 400 pharmacies participating in the Texas ADAP.42 Patients can only obtain their medication from the Texas ADAP pharmacy to which they are assigned, but they can ask to be reassigned to a different participating pharmacy at any time.7 Patients who wish to receive their medication from a nonparticipating pharmacy need to prove hardship exists with their current arrangement before they can switch pharmacies.7 ADAP beneficiaries not eligible for Medicaid are subject to $5 copays per month, unlike Medicaid beneficiaries also receiving ADAP assistance.7 Further, ADAP clients are limited to receiving a maximum of four antiretroviral drugs per month (as the table indicates, some drugs are counted as more than one).7 In order to receive certain drugs, ADAP clients need to meet further medical criteria as indicated in Table 2.7
Medicaid’s pharmacy services are better than ADAP’s for people living with HIV, as the drug coverage indicated in Table 2 is more generous and Medicaid recipients in STAR managed care plans may obtain an unlimited number of prescriptions.35 Texas has a preferred drug list (PDL) and a prescriber must receive prior authorization to prescribe a reimbursable nonpreferred drug.35 Medicaid
formularies available to newly eligibles will be just as, if not more, robust (newly eligible beneficiaries will be guaranteed access to any FDA-approved drugs with significant clinically meaningful therapeutic advantage over another).54
As Table 2 indicates, Texas’s benchmark plan—BlueCross BlueShield of Texas Best Choice PPO— has a slightly more limited formulary than the ADAP or Medicaid formulary for the core HIV treatment drugs, but has more “A1” opportunistic infection medications than ADAP but less than Medicaid. On this plan, people with HIV/AIDS do not face the same limits as they would under Medicaid’s formulary, but they do not have access to all the same drugs covered under ADAP. A proposed federal rule defining EHB provides that plans sold on exchanges must cover at least the same number of drugs in each category and class as the benchmark plan (or one drug per class if the benchmark plan does not cover any). Thus, assuming the proposed rule is adopted, plans in Texas must cover at least the number of drugs in each class listed above for the BlueCross BlueShield BestChoice PPO plan (although not necessarily the same drugs).55
COMMUNITY HEALTH CENTERS
The ACA has provided Texas with $162.3 million to fund new and existing community health centers.44
Additionally, six centers in five cities (Houston, Plano, Gatesville, Fort Worth, Tyler) have each been awarded $80,000 in health center planning grants.45 A seventh center in Houston was awarded $79,780.44 All community health centers in Texas (337 as of 2010) provide primary care services, and 83% provide HIV preventive care.45 There are also three designated AIDS education and training centers in Texas—all are National Centers for HIV
Care in Minority Communities (NCHCMC).46 Some Texas community health centers, such as Legacy, are leaders in providing comprehensive healthcare to people living HIV/AIDS. For example, Legacy provides primary care, assistance with social services, financial assistance, eye care, and counseling on medication adherence and prevention services.47 Community health centers can go beyond providing basic healthcare to people living with HIV/AIDS to help ensure successful case management and treatment.
CONCLUSIONS AND NEXT STEPSThis report provides analyses of the Ryan White program, the AIDS Drug Assistance Program (ADAP), Medicaid, and essential health benefits (EHB) under the Patient Protection and Affordable Care Act (ACA), enumerating the benefits covered under each, and the implications of transitioning individuals living with HIV onto Medicaid or private insurance. This report is intended to assist state legislators in implementing the ACA in a manner that serves the needs of Texans.
While much of the ACA has yet to be implemented, it is certain that large numbers of people living with HIV will be newly eligible for Medicaid. Given that a significant proportion of uninsured ADAP
clients would transition into Medicaid in Texas, implementing the ACA’s expansion provision is crucial to ensuring access to care and reducing transmission of HIV across the state. In other words, expanding Medicaid is the state’s only currently available option to provide access to treatment for the thousands of HIV+ individuals in the state who currently lack access to care. Without Medicaid expansion it will be the Texas counties that will assume a substantial cost for providing services to indigent HIV+ individuals who were previously covered by the Ryan White program.
In that vein, the Medicaid system must be ready and able to handle the needs of low-income people who

State Health Reform Impact Modeling Project: Texas 11
have HIV. Should Texas elect to expand its Medicaid program, this report provides an initial analysis of the capacity of the program to handle the needs of this influx of individuals living with HIV. An analysis of the barriers to care that this population is likely to face (based upon the existing Medicaid program) is timely as states prepare for the transition to Medicaid. Comparing current Ryan White and ADAP programs with existing Medicaid formularies allows for a baseline analysis of the needs of individuals living with HIV moving into the Medicaid system.
This report identified a number of services currently provided by the Ryan White program that are not available under the state’s current Medicaid program, and may reduce the ability of those living with HIV to access services. For instance, the Ryan White program, unlike Medicaid, covers nonmedical case management, food bank services, and nonemer gency medical transportation services. Initial federal guidance indicates that Medicaid benchmark plans (those for newly eligible beneficiaries) will not be required to cover these services.56 The Ryan White program will continue to be a critical payer of last resort to ensure that all individuals living with HIV have access to comprehensive antiretroviral therapy (ART).
While more Texas ADAP clients will transition to subsidized private insurance in 2014 (compared with national numbers), it remains essential that private insurance plans provide a level and scope of services sufficient to meet the needs of these individuals. In particular, there are a number of services that are currently provided by the Ryan White program which are not available under Texas’ default benchmark plan and will not be requisite EHB on the exchange.55 HIV+ individuals who shift from the Ryan White
program to private insurance plans on the exchange are therefore likely to have trouble accessing a number of services currently available to them.
There will remain an ongoing demand for Ryan White and ADAP services to fill the gaps left by Medicaid coverage for low-income people living with HIV. Identifying these gaps and structuring these programs to efficiently work together from the start is not only fiscally prudent but also necessary to secure the health of Texans and slow the spread of HIV.
In conclusion, this report makes clear three factors that will be essential to successfully implementing the ACA in a way that reduces the burden of HIV on the state:
1. Texas must adopt the Medicaid expansion, pursuant to the ACA, extending eligibility to most individuals living under 133% FPL in order to slow the transmission of HIV and make treatment accessible to thousands of individuals who currently lack care.
2. Effectively defining the EHB, patient navigation, and outreach systems, and opting into prevention and health home program resources will maximize the potential for the state to meet the care and service needs of individuals living with HIV.
3. Texas must ensure that Ryan White and ADAP services are available where Medicaid or private insurance coverage gaps exist (eg, nonemergency medical transportation, nonmedical case management, food and nutrition, childcare) or where cost sharing makes meaningful coverage prohibitive.

12 State Health Reform Impact Modeling Project: Texas
APPENDIX A
2014 STATE-SPECIFIC ESTIMATES
Medicaid Estimates
The Patient Protection and Affordable Care Act (ACA) directs states to extend Medicaid eligibility to all individuals living below 133% of the federal poverty level (FPL), and offers a 100% federal matching rate for these newly eligible individuals (those who would not otherwise be eligible for Medicaid but for the new law).
To estimate the number of individuals currently using the AIDS Drug Assistance Program (ADAP) who will be newly eligible for Medicaid in 2014, the following formula was used:
Total # ADAP clients served in 201013
− est. # ADAP clients with income above 133% FPL16,***
− est. # insured ADAP clients with income below 133% FPL48,49
− est. # ADAP clients who are uninsured undocumented immigrants with incomes below 133% FPL50,†††
= Total # ADAP clients served in fiscal year 2010 who will be newly eligible for Medicaid in 2014‡‡‡,§§§
In Texas, 16,501 individuals were served by ADAP in fiscal year 2010. Of those, it is estimated that 35% (5,775) of ADAP clients have incomes above 133% FPL. Additionally, an estimated 8% (1,325) of individuals living below 133% FPL are currently insured and approximately 5.6% of the state population was undocumented immigrants in 2008 (603 ADAP individuals). Thus, the calculation for Texas is:
16,501 ADAP clients in fiscal year 2010
− 5,775.35 ADAP clients living above 133% FPL
− 1,325.46 insured ADAP clients living below 133% FPL
− 603.34 uninsured undocumented Texas living below 133% FPL on ADAP
= 8,797 (53%) of ADAP clients served in fiscal year 2010 who will be newly eligible for Medicaid in 2014
The calculation above was done similarly for all 21 states and the District of Columbia (DC). The results of the calculations are below:
State
#ADAP Clients
Newly Eligible
for Medicaid
%ADAP Clients
Newly Eligible
for Medicaid
Alabama 1,345 76%
Arkansas 299 53%
California 12,274 31%
DC 1,124 41%
Florida 7,321 51%
Georgia 3,075 52%
Illinois 4,374 68%
Kentucky 619 42%
Louisiana No data available No data available
Maryland 1,394 22%
Massachusetts 1,400 21%
Mississippi 1,008 68%
New Jersey 2,101 29%
New York 4,233 20%
North Carolina 3,476 62%
Ohio 1,287 37%
Pennsylvania 1,334 22%
South Carolina 1,428 39%
Tennessee 2,505 60%
Texas 8,797 53%
Virginia 2,690 66%
Wisconsin 696 40%
United States 62,971 29%
Note: Data on the insurance status of ADAP clients in Maryland, North Carolina, Ohio, and Kentucky came from the 2011 NASTAD Report instead of the 2012 NASTAD Report.51 (The 2012 NASTAD Report is missing data for North Carolina and Kentucky, and the percentages of insured clients exceed 100% for Maryland and Ohio.)
*** In order to estimate the number of ADAP clients in any income group, we apply the percentage of clients served in each income group (acquired from Table 13 of the 2012 NASTAD Report) to the number of clients served in fiscal year 2010 (acquired from Table 8 of the same report).
††† See Appendix A for a description of the method used to estimate the distribution of insured ADAP clients in Texas by income group.‡‡‡ The final estimate provided is likely to be somewhat higher than the actual number of ADAP clients who will be newly eligible for Medicaid, since the formula does
not account for insured ADAP clients whose incomes fall below 133% FPL—these clients will not be newly eligible for Medicaid in 2014. The number of insured clients with incomes below 133% FPL is likely to vary by state.
§§§ The final number is an estimate based largely on figures taken from 2010-2011.
State Health Reform Impact Modeling Project: Texas 13
The percentages of ADAP clients who will be newly eligible for Medicaid in 2014 vary considerably from state to state. These differences can be explained by the different eligibility standards currently in place for ADAP eligibility within each state, as well as by the differences in estimated percentages of undocumented immigrants in each state. For instance, states with higher-than-average newly eligible Medicaid beneficiaries may currently require that ADAP recipients have no other sources of insurance (eg, Virginia). On the other hand, states with lower-than-average newly eligibles have higher insurance rates all around (eg, Massachusetts) or other public assistance programs that supplement ADAP. In sum, NASTAD’s data do not capture all groups of people living with HIV who may be eligible for Medicaid in 2014.
Private Insurance Subsidy Estimates
To estimate the number of people currently using ADAP who will be eligible for private insurance subsidies through health insurance exchanges, the following formula was used:
Total # ADAP clients served in fiscal year 201013
− est. # ADAP clients living below 133% FPL or above 400% FPL14
− est. # insured ADAP clients living between 133-400% FPL4
− est. # of insured ADAP clients living between 133-400% FPL34,****
− est. # uninsured undocumented ADAP clients living between 133-400% FPL50
= Total # ADAP clients served in fiscal year 2010 who will be newly eligible for subsidized private insurance in 2014
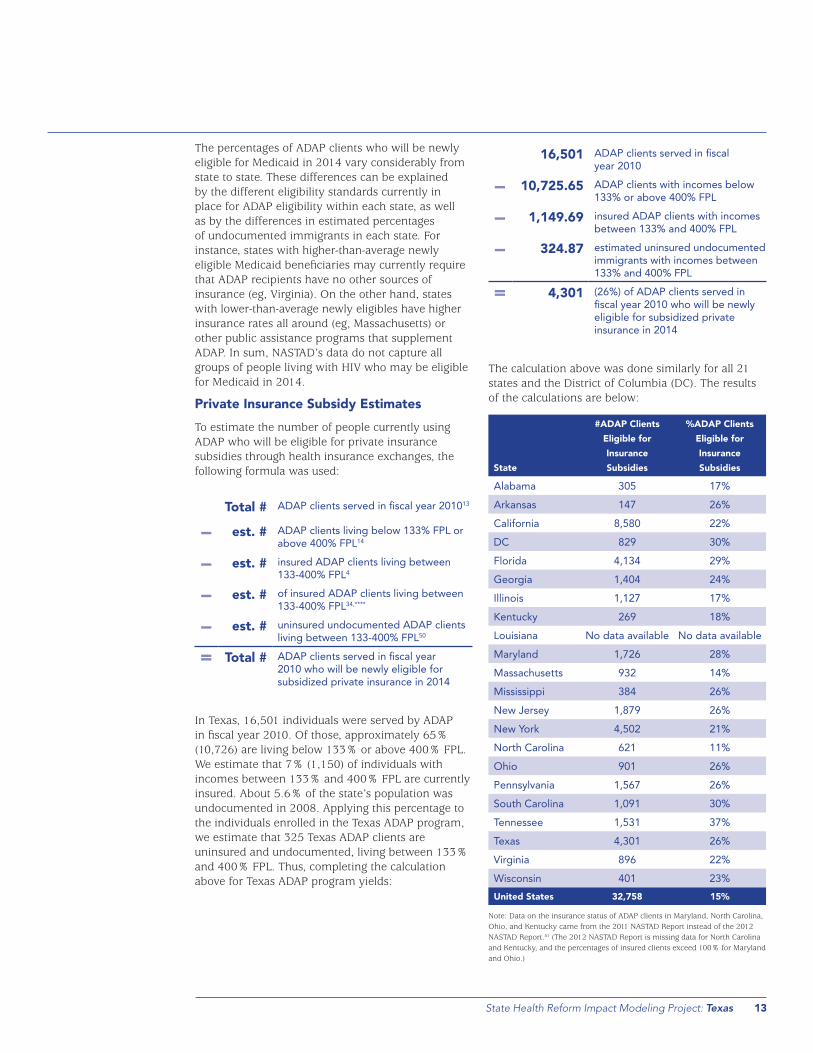
In Texas, 16,501 individuals were served by ADAP in fiscal year 2010. Of those, approximately 65% (10,726) are living below 133% or above 400% FPL. We estimate that 7% (1,150) of individuals with incomes between 133% and 400% FPL are currently insured. About 5.6% of the state’s population was undocumented in 2008. Applying this percentage to the individuals enrolled in the Texas ADAP program, we estimate that 325 Texas ADAP clients are uninsured and undocumented, living between 133% and 400% FPL. Thus, completing the calculation above for Texas ADAP program yields:
16,501 ADAP clients served in fiscal year 2010
− 10,725.65 ADAP clients with incomes below 133% or above 400% FPL
− 1,149.69 insured ADAP clients with incomes between 133% and 400% FPL
− 324.87 estimated uninsured undocumented immigrants with incomes between 133% and 400% FPL
= 4,301 (26%) of ADAP clients served in fiscal year 2010 who will be newly eligible for subsidized private insurance in 2014
The calculation above was done similarly for all 21 states and the District of Columbia (DC). The results of the calculations are below:
State
#ADAP Clients
Eligible for
Insurance
Subsidies
%ADAP Clients
Eligible for
Insurance
Subsidies
Alabama 305 17%
Arkansas 147 26%
California 8,580 22%
DC 829 30%
Florida 4,134 29%
Georgia 1,404 24%
Illinois 1,127 17%
Kentucky 269 18%
Louisiana No data available No data available
Maryland 1,726 28%
Massachusetts 932 14%
Mississippi 384 26%
New Jersey 1,879 26%
New York 4,502 21%
North Carolina 621 11%
Ohio 901 26%
Pennsylvania 1,567 26%
South Carolina 1,091 30%
Tennessee 1,531 37%
Texas 4,301 26%
Virginia 896 22%
Wisconsin 401 23%
United States 32,758 15%
Note: Data on the insurance status of ADAP clients in Maryland, North Carolina, Ohio, and Kentucky came from the 2011 NASTAD Report instead of the 2012 NASTAD Report.51 (The 2012 NASTAD Report is missing data for North Carolina and Kentucky, and the percentages of insured clients exceed 100% for Maryland and Ohio.)
14 State Health Reform Impact Modeling Project: Texas
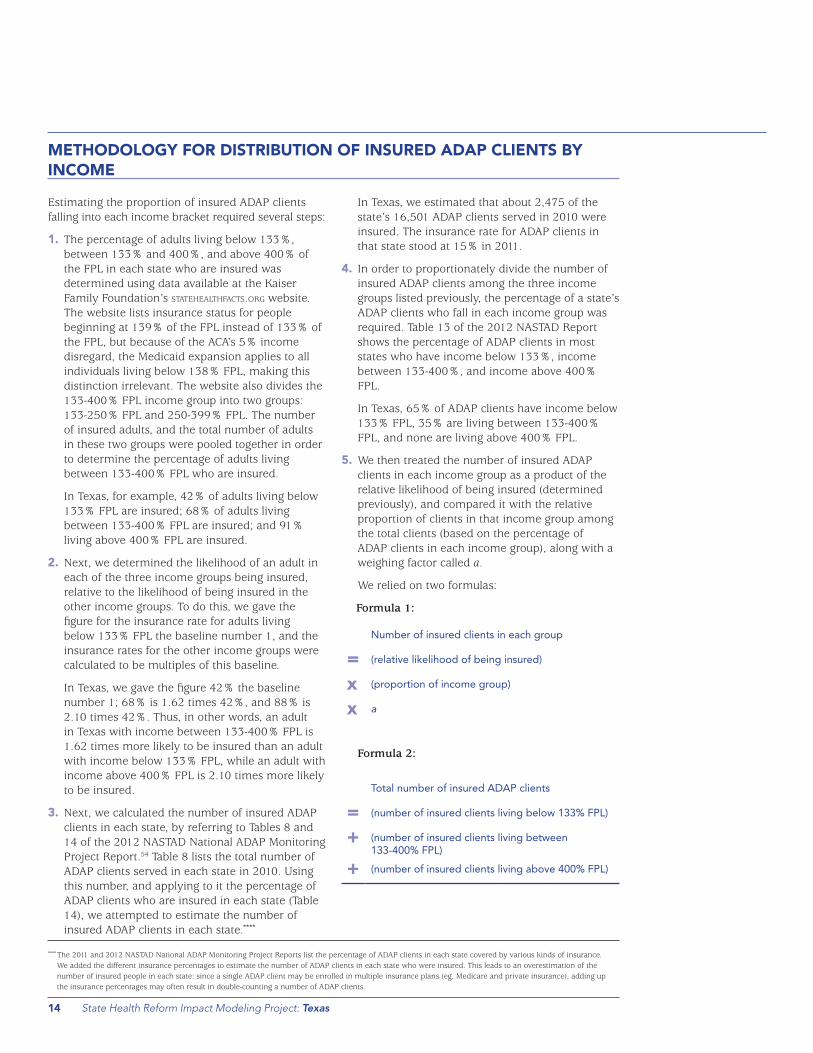
METHODOLOGY FOR DISTRIBUTION OF INSURED ADAP CLIENTS BY INCOME
Estimating the proportion of insured ADAP clients falling into each income bracket required several steps:
1. The percentage of adults living below 133%, between 133% and 400%, and above 400% of the FPL in each state who are insured was determined using data available at the Kaiser Family Foundation’s StateHealtHfactS.org website. The website lists insurance status for people beginning at 139% of the FPL instead of 133% of the FPL, but because of the ACA’s 5% income disregard, the Medicaid expansion applies to all individuals living below 138% FPL, making this distinction irrelevant. The website also divides the 133-400% FPL income group into two groups: 133-250% FPL and 250-399% FPL. The number of insured adults, and the total number of adults in these two groups were pooled together in order to determine the percentage of adults living between 133-400% FPL who are insured.
In Texas, for example, 42% of adults living below 133% FPL are insured; 68% of adults living between 133-400% FPL are insured; and 91% living above 400% FPL are insured.
2. Next, we determined the likelihood of an adult in each of the three income groups being insured, relative to the likelihood of being insured in the other income groups. To do this, we gave the figure for the insurance rate for adults living below 133% FPL the baseline number 1, and the insurance rates for the other income groups were calculated to be multiples of this baseline.
In Texas, we gave the figure 42% the baseline number 1; 68% is 1.62 times 42%, and 88% is 2.10 times 42%. Thus, in other words, an adult in Texas with income between 133-400% FPL is 1.62 times more likely to be insured than an adult with income below 133% FPL, while an adult with income above 400% FPL is 2.10 times more likely to be insured.
3. Next, we calculated the number of insured ADAP clients in each state, by referring to Tables 8 and 14 of the 2012 NASTAD National ADAP Monitoring Project Report.54 Table 8 lists the total number of ADAP clients served in each state in 2010. Using this number, and applying to it the percentage of ADAP clients who are insured in each state (Table 14), we attempted to estimate the number of insured ADAP clients in each state.****
In Texas, we estimated that about 2,475 of the state’s 16,501 ADAP clients served in 2010 were insured. The insurance rate for ADAP clients in that state stood at 15% in 2011.
4. In order to proportionately divide the number of insured ADAP clients among the three income groups listed previously, the percentage of a state’s ADAP clients who fall in each income group was required. Table 13 of the 2012 NASTAD Report shows the percentage of ADAP clients in most states who have income below 133%, income between 133-400%, and income above 400% FPL.
In Texas, 65% of ADAP clients have income below 133% FPL, 35% are living between 133-400% FPL, and none are living above 400% FPL.
5. We then treated the number of insured ADAP clients in each income group as a product of the relative likelihood of being insured (determined previously), and compared it with the relative proportion of clients in that income group among the total clients (based on the percentage of ADAP clients in each income group), along with a weighing factor called a.
We relied on two formulas:
Formula 1:
Number of insured clients in each group
= (relative likelihood of being insured)
x (proportion of income group)
x a
Formula 2:
Total number of insured ADAP clients
= (number of insured clients living below 133% FPL)
+ (number of insured clients living between 133-400% FPL)
+ (number of insured clients living above 400% FPL)
**** The 2011 and 2012 NASTAD National ADAP Monitoring Project Reports list the percentage of ADAP clients in each state covered by various kinds of insurance. We added the different insurance percentages to estimate the number of ADAP clients in each state who were insured. This leads to an overestimation of the number of insured people in each state: since a single ADAP client may be enrolled in multiple insurance plans (eg, Medicare and private insurance), adding up the insurance percentages may often result in double-counting a number of ADAP clients.
State Health Reform Impact Modeling Project: Texas 15
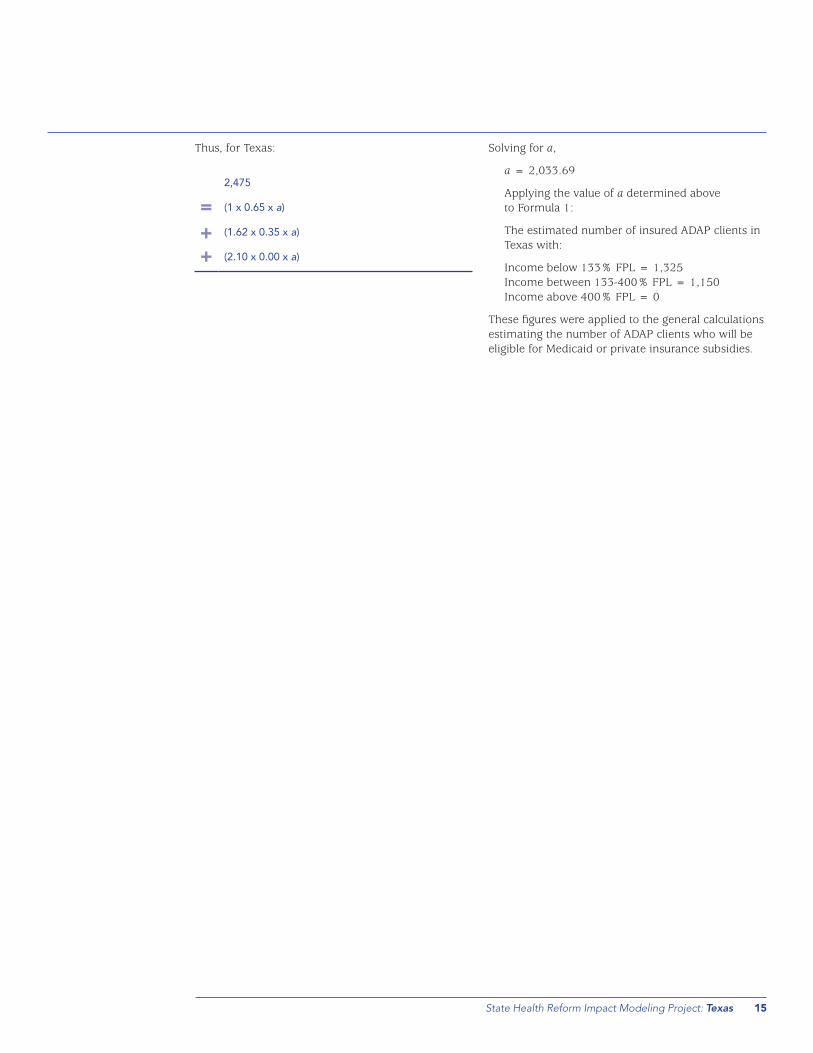
Thus, for Texas:
2,475
= (1 x 0.65 x a)
+ (1.62 x 0.35 x a)
+ (2.10 x 0.00 x a)
Solving for a,
a = 2,033.69
Applying the value of a determined above to Formula 1:
The estimated number of insured ADAP clients in Texas with:
Income below 133% FPL = 1,325 Income between 133-400% FPL = 1,150 Income above 400% FPL = 0
These figures were applied to the general calculations estimating the number of ADAP clients who will be eligible for Medicaid or private insurance subsidies.

16 State Health Reform Impact Modeling Project: Texas
APPENDIX B
DATA COLLECTION METHODOLOGY
In the interest of consistency between state profiles, and to ensure that data between states is comparable, data sources that provide information for all 21 states and the District of Columbia (DC) are prioritized. More recent or detailed data available for a particular state, have also been included.
Ryan White Program Data
Demographic information about Ryan White program clients was culled from a number of sources. For the sake of continuity, the federal Health Resources and Services Administration (HRSA) 2010 State Profiles were used for data about the Ryan White program. Income, race/ethnicity, gender, and insurance status for 2008 are available from HRSA and have been provided for each state. Where available, information from state departments of health has also been included. Demographic information for AIDS Drug Assistance Program (ADAP) clients is most thoroughly documented by the National Alliance of State and Territorial AIDS Directors (NASTAD), and information from that organization has been provided for income and insurance status of ADAP clients. NASTAD’s data for fiscal year 2010, fiscal year 2011, and June 2011 was used (fiscal year 2010 was necessary for states that did not report data in 2011). Because ADAP data compiled by NASTAD is unduplicated (ie, patients are not double-counted by multiple providers), it is one of the most reliable sources of demographic information for people living with HIV. Data from June 2011 provide information on how many people living with HIV currently enrolled in ADAP were living between 100-133% of the federal poverty level (FPL). Since the expansion of Medicaid eligibility to those living under 133% FPL is a new development, there is a relative dearth of data regarding the number of HIV+ individuals currently living between 100-133% FPL. NASTAD provides the only reliable source of this data to date. NASTAD’s ADAP information was used for estimates regarding people living with HIV who are newly eligible for Medicaid in 2014 at the end of this report. Where information is also available from state departments of health or HRSA, it has been provided.
Estimates of unmet need for people living with HIV are available in each state’s Statewide Coordinated Statement of Need (SCSN). SCSNs must be provided by all states receiving Ryan White program funding, but different states provide SCSNs in different years, so comparability among states is limited. Where information about unmet need is available from other sources, it has also been included.
Information on current services covered by the Ryan White program is available from HRSA and the SCSNs, and this data has been included in each state profile. Where more detailed information is available, it has been included in the profiles.
Income thresholds for ADAP eligibility, cost-containment measures in each state, and ADAP formularies are available from a variety of sources. The most common sources for this information are meDicare.gov, the Kaiser Family Foundation, and NASTAD’s ADAP Watch publication. This information has been included for every state and standardized to the extent possible among states.
Ryan White program budget allocations are also available from a number of sources, and information from the Kaiser Family Foundation has been included in every profile for the sake of consistency among states. ADAP budget information is available from NASTAD, including the fiscal year 2011 total budget, and a breakdown of expenditures. This information is provided in each state profile. Kaiser Family Foundation’s information on ADAP expenditures has also been included for information on the amount spent by ADAP programs on insurance assistance and full prescription coverage.
Medicaid Coverage Data
Services currently covered by Medicaid and their limitations are detailed by state departments of health and state Medicaid manuals. Amounts of information available and levels of detail differ among states, and detailed information is provided in the profiles where available. The focus in each profile is on services most relevant to people living with HIV as well as limitations that may impede access to needed services.

State Health Reform Impact Modeling Project: Texas 17
NOTES
Data for certain states were incomplete in the 2012 National ADAP Monitoring Project Annual Report; missing data were obtained from alternate sources:
❯ Data on the insurance status of ADAP clients in Maryland, North Carolina, Ohio, and Kentucky came from the 2011 NASTAD Report instead of the 2012 NASTAD Report.55 (The 2012 NASTAD Report is missing data for North Carolina and Kentucky, and the percentages of the insured exceed 100% for Maryland and Ohio.)
❯ Data on the number of clients served by Mississippi’s ADAP program appear to be incorrect in NASTAD’s Monitoring Report, as the number of clients served is listed as larger than the number of eligible ADAP clients in the state. The number listed was used in these calculations, and while the specific number of ADAP clients eligible for Medicaid and private insurance subsidies in Mississippi may not be reliable, the proportion of clients eligible for both programs was obtained in the same way as for other states, for interstate comparability reasons.
CAVEATS AND ASSUMPTIONS
The estimates provided require a number of caveats and assumptions:
1. ADAP data (as opposed to Ryan White data) were used both to account for insurance status and to avoid double-counting individuals who may be enrolled in multiple Ryan White programs (ie, seeing multiple providers). The estimates presented here, therefore, are only for the proportion of ADAP clients who will be eligible for Medicaid and private insurance subsidies;
2. Data for ADAP clients served were used rather than data for clients enrolled, because the number of individuals enrolled may exceed the actual number of clients actually accessing ADAP services. Potential clients who are currently on ADAP waiting lists in several states are also not included in these calculations. Thus, the numbers provide a conservative estimate of ADAP beneficiaries who will transition onto Medicaid or into subsidized private insurance;
3. National data (NASTAD and HRSA) were used in calculations instead of state-specific data to ensure that these estimates could be compared across the states surveyed; and
4. The number of undocumented immigrants on ADAP is a rough estimate extrapolated from estimates of the overall number of undocumented immigrants in the state as a whole as of 2008. It is possible that this estimate either overestimates or underestimates the actual number of undocumented immigrants currently served by ADAP.
With these caveats and assumptions in mind, the figures above are our best estimates of the number and percentage of ADAP clients who will be newly eligible for Medicaid in 2014 (assuming full implementation of the ACA), and the number and percentage of ADAP clients who will be eligible for private insurance subsidies.
These estimates are for ADAP recipients only, and are of limited analytical assistance in determining percentages of all people living with HIV who will be newly eligible for Medicaid and insurance subsidies in 2014. While the percentages provided could be extrapolated to apply to the broader HIV population in states, given the number of caveats and assumptions needed to arrive at this rough estimate, it would be better to obtain further information about the unmet need within states before attempting to make such calculations.

18 State Health Reform Impact Modeling Project: Texas
APPENDIX CPart A of the Ryan White program funds both medical and support services, allowing states to provide HIV+ individuals with a continuum of care. States are required to spend 75% of Part A awards on core medical services, which include:
❯ Outpatient and ambulatory care;
❯ AIDS Drug Assistance Program (ADAP) (full coverage of drugs or insurance assistance);
❯ Oral health;
❯ Early intervention services;
❯ Health insurance premiums and cost-sharing assistance;
❯ Medical nutrition therapy;
❯ Hospice services;
❯ Home- and community-based health services;
❯ Mental health services;
❯ Substance abuse outpatient care;
❯ Home healthcare; and
❯ Medical case management (including treatment adherence services).
States may spend up to 25% on support (ancillary) services that are linked to medical outcomes (eg, patient outreach, medical transportation, linguistic services, respite care for caregivers of people living with HIV/AIDS, healthcare or other support service referrals, case management, and substance abuse residential services).

State Health Reform Impact Modeling Project: Texas 19
REFERENCES1. Patient Protection and Affordable Care Act (ACA), Pub. L. No. 111-148, 124
Stat. 119 (2010) [hereinafter Affordable Care Act].
2. The states assessed include: Alabama, Arkansas, California, District of Columbia, Florida, Georgia, Illinois, Kentucky, Louisiana, Maryland, Massachusetts, Mississippi, New Jersey, New York, North Carolina, Ohio, Pennsylvania, South Carolina, Tennessee, Texas, Virginia, and Wisconsin.
3. texaS Department of State HealtH ServiceS, 2011 texaS integrateD epiDemiologic profile for Hiv/aiDS prevention anD ServiceS planning (forthcoming 2012), available at www.dshs.state.tx.us/hivstd/reports/HIVandAIDSinTexas.pdf.
4. tHe KaiSer family founDation State HealtH factS, Texas: Total Ryan White Program Funding, FY2010, http://www.statehealthfacts.org/profileind.jsp?cat=11&rgn=45&ind=534 (last visited October 12, 2012).
5. HealtH reSourceS & ServiceS aDminiStration (HrSa), u.S. Department of HealtH & Human ServiceS (DHHS), Texas: Client Characteristics, ryan WHite Hiv/aiDS program – 2010 State profileS, http://hab.hrsa.gov/stateprofiles (last visited October 13, 2012).
6. tHe KaiSer family founDation State HealtH factS, Texas: Distribution of Ryan White Program Funding By Part, FY2010, http://www.statehealthfacts.org/profileind.jsp?ind=535&cat=11&rgn=45 (last visited October 30, 2012).
7. texaS Department of State HealtH ServiceS, Guidelines for the Texas HIV Medication Program (THMP), https://www.dshs.state.tx.us/hivstd/meds/document.shtm (last visited October 21, 2012).
8. national alliance of State & territorial aiDS DirectorS (naStaD), national aDap monitoring project annual report, 54 tbl.9, auguSt 2012, available at http://www.nastad.org/Docs/021503_National%20ADAP%20Monitoring%20Project%20Annual%20Report%20-%20August%202012.pdf.
9. tHe KaiSer family founDation State HealtH factS, Distribution of AIDS Drug Assistance Program (ADAP) Budget by Source, FY2011, http://www.statehealthfacts.org/profileind.jsp?rgn=45&cat=11&ind=545 (last visited October 12, 2012).
10. tHe KaiSer family founDation State HealtH factS, AIDS Drug Assistance Program (ADAP) Expenditures, FY2010, http://www.statehealthfacts.org/profileind.jsp?ind=668&cat=11&rgn=45&cmprgn=1 (last visited October 12, 2012).
11. texaS Department of State HealtH ServiceS, DSHS Fact Sheet: Texas HIV Medication Program: The Growing Challenge, http://www.dshs.state.tx.us (last visited October 21, 2012).
12. u.S. Department of HealtH & Human ServiceS, Treating HIV-infected People with Antiretrovirals Protects Partners from Infection, National Institute of Health News, http://www.niaid.nih.gov/news/newsreleases/2011/Pages/HPTN052.aspx (last visited October 3, 2012).
13. national alliance of State & territorial aiDS DirectorS (NASTAD), national aDap monitoring project annual report, 53 tbl.8, August 2012, available at http://www.nastad.org/Docs/021503_National%20ADAP%20Monitoring%20Project%20Annual%20Report%20-%20August%202012.pdf.
14. national alliance of State & territorial aiDS DirectorS (naStaD), national aDap monitoring project annual report, 58 tbl.13, August 2012, available at http://www.nastad.org/Docs/021503_National%20ADAP%20Monitoring%20Project%20Annual%20Report%20-%20August%202012.pdf.
15. national alliance of State & territorial aiDS DirectorS (naStaD), national aDap monitoring project annual report, tbl.7, March 2011, available at http://www.nastad.org/Docs/highlight/2011429_Module%20One%20-%20National%20ADAP%20Monitoring%20Project%20Annual%20Report%20-%20March%202011.pdf.
16. national alliance of State & territorial aiDS DirectorS (naStaD), national aDap monitoring project annual report, tbl.11, March 2011, available at http://www.nastad.org/Docs/highlight/2011429_Module%20One%20-%20National%20ADAP%20Monitoring%20Project%20Annual%20Report%20-%20March%202011.pdf.
17. Affordable Care Act, tit. II, § 2001(a)(1), 42 U.S.C. § 1396a(a)(10)(A)(i)(VIII).
18. Benefits, meDicare.gov, http://www.medicaid.gov/AffordableCareAct/Provisions/Benefits.html (last visited September 24, 2012).
19. Affordable Care Act, tit. I, § 1401(a), 26 U.S.C. § 36(B) (2010).
20. Affordable Care Act, tit. I, § 1311(b)(1), 42 U.S.C. § 18031(b)(1) (2010).
21. Affordable Care Act, tit. I § 1331(e), 42 U.S.C. § 18051(e) (2010).
22. Affordable Care Act, tit. I, § 1331(a)(1-2), 42 U.S.C. § 18051(a)(1-2) (2010).
23. Affordable Care Act, tit. I, § 1331(a)(2)(A)(ii), 42 U.S.C. § 18051(a)(2)(A)(ii) (2010).
24. Affordable Care Act, tit. I, § 1331(d)(3), as amended, 42 U.S.C. § 18051(d)(3) (2010).
25. Affordable Care Act, tit. I, § 1302(a), 42 U.S.C. § 18022(a) (2010).
26. Affordable Care Act, tit. I, § 1302(b), 42 U.S.C. § 18022(b) (2010).
27. centerS for meDicare & meDicaiD ServiceS, center for conSumer information & inSurance overSigHt (cciio), eSSential HealtH benefitS bulletin, December 16, 2011, http://cciio.cms.gov/resources/files/Files2/12162011/essential_health_benefits_bulletin.pdf.
28. State reforum, State Progress on Essential Health Benefits, October 10, 2012, http://www.statereforum.org/state-progress-on-essential-health-benefits.
29. u.S. Department of HealtH & Human ServiceS, centerS for meDicare & meDicaiD ServiceS, Frequently Asked Questions on Essential Health Benefits Bulletin, http://cciio.cms.gov/resources/files/Files2/02172012/ehb-faq-508.pdf (last visited October 21, 2012).
30. tHe KaiSer family founDation State HealtH factS, Distribution of AIDS Drug Assistance Program (ADAP) Clients Served by Income, June 2011, http://www.statehealthfacts.org/profileind.jsp?rgn=45&cat=11&ind=541 (last visited October 12, 2012).
31. texaS Department of State HealtH ServiceS, 2008-2010 texaS StateWiDe coorDinateD Statement of neeD (2008) 10.
32. texaS HealtH & Human ServiceS commiSSion, Medicaid Plans, http://www.hhsc.state.tx.us/QuickAnswers/index.shtml#Medicaid_Plans (last visited November 14, 2012).
33. texaS HealtH & Human ServiceS commiSSion, Texas Medicaid Provider Procedures Manual, November 2012, Volume 2, 8 (Nov. 2012) available at http://www.tmhp.com/TMPPM/TMPPM_Living_Manual_Current/Vol2_Medicaid_Managed_Care_Handbook.pdf.
34. HealtH reSourceS & ServiceS aDminiStration (HRSA), u.S. Department of HealtH & Human ServiceS (DHHS), Texas: Services Utilization, ryan WHite Hiv/aiDS program – 2010 State profileS, http://hab.hrsa.gov/stateprofiles (last visited October 13, 2012).
35. texaS HealtH & Human ServiceS commiSSion (HHSC), Chapter 5: Medicaid Benefits, 5-2–5-3 http://www.hhsc.state.tx.us/medicaid/reports/PB8/PDF/Chp-5.pdf (last visited September 17, 2012).
36. texaS Department of inS., Essential Health Benefits – Analaysis of Benchmark Plan Options in Texas By Required PPACA Coverage Categories and State Mandated Benefits and Offers, http://www.tdi.texas.gov/health/documents/fhrebhanalysis.pdf (last visited October 22, 2012).
37. texaS Department of State HealtH ServiceS, Medicaid Substance Use Disorder (SUD) Benefit, http://www.dshs.state.tx.us/mhsa/sud/ (last visited September 17, 2012).
38. Chart adapted from NASTAD. national alliance of State & territorial aiDS DirectorS (naStaD), national aDap monitoring project annual report, 66, tbl. 28, August 2012, available at http://www.nastad.org/Docs/021503_National%20ADAP%20Monitoring%20Project%20Annual%20Report%20-%20August%202012.pdf.
39. texaS Department of State HealtH ServiceS, THMP Formulary, https://www.dshs.state.tx.us/hivstd/meds/document.shtm (last visited September 17, 2012).
40. texaS HealtH & Human ServiceS commiSSion, Texas Medicaid/CHIP Vendor Drug Program, http://www.txvendordrug.com/formulary/formulary-search.asp (last visited October 15, 2012).
41. Blue Cross and Blue Shield of Texas Preferred Drug List October 2012, Prime Therapeutics, http://www.bcbstx.com/pdf/drug_list.pdf (last visited October 22, 2012).
42. texaS Department of State HealtH ServiceS, Texas HIV Medication Program – Frequently Asked Questions (FAQ), https://www.dshs.state.tx.us/hivstd/meds/faq.shtm (last visited October 21, 2012).
43. How the Health Care Law is Making a Difference for the People of Texas, HealtHcare.gov, http://www.healthcare.gov/law/resources/tx.html (last visited September 17, 2012).
44. HealtH reSourceS & ServiceS aDminiStration, u.S. Department of HealtH & Human ServiceS, Health Center Planning Grant Awards, http://www.hrsa.gov/about/news/2011tables/1108healthcenterplanning.html (last visited September 17, 2012).

20 State Health Reform Impact Modeling Project: Texas
45. Texas Health Center Fact Sheet, national aSSociation of community HealtH centerS, http://www.nachc.com/client/documents/research/TX11.pdf (last visited September 17, 2012).
46. NCHCMC Sites, national center for Hiv care in minority communitieS, http://www.nchcmc.org/sites/ (last visited September 17, 2012).
47. Primary Care for HIV/AIDS, legacy community HealtH ServiceS, http://www.legacycommunityhealth.org/ServicesPrograms/HIVAIDS/HIVAIDSServices/PrimaryCareforHIVAIDS.aspx (last visited September 26, 2012).
48. tHe KaiSer family founDation State HealtH factS, Health Insurance Coverage of Adults (19-64) with Incomes under 139% of the Federal Poverty Level (FPL), states (2009-2010), U.S. (2010), http://www.statehealthfacts.org/profileind.jsp?cmprgn=1&cat=3&rgn=45&ind=779&sub=177 (last visited October 12, 2012).
49. national alliance of State & territorial aiDS DirectorS (naStaD), national aDap monitoring project annual report, auguSt 2012, 58-59, tbls.13-14, available at http://www.nastad.org/Docs/021503_National%20ADAP%20Monitoring%20Project%20Annual%20Report%20-%20August%202012.pdf.
50. The number of undocumented immigrants on ADAP in each state in FY2008 was extrapolated from Pew Research Center, “A Portrait of Unauthorized Immigrants in the United States,” available at http://pewhispanic.org/files/reports/107.pdf (last visited October 8, 2012). This number, divided by the overall population of the state in 2008 (estimated at http://www.census.gov/popest/intercensal/state/state2010.html), provides the percentage that undocumented immigrants make up of the total population in the state. This percentage is then applied to the number of individuals enrolled in ADAP, and adjusted by the appropriate Kaiser Family Foundation and NASTAD percentages, to estimate how many ADAP beneficiaries will not be newly eligible for private insurance subsidies as a result of their immigration status. national alliance of State & territorial aiDS DirectorS (naStaD), national aDap monitoring project annual report, 58, tbl.13, auguSt 2012, available at http://www.nastad.org/Docs/021503_National%20ADAP%20Monitoring%20Project%20Annual%20Report%20-%20August%202012.pdf.
51. national alliance of State & territorial aiDS DirectorS (naStaD), national aDap monitoring project annual report, 39, tbl.11, may 2011, available at http://www.nastad.org/Docs/highlight/2011429_Module%20One%20-%20National%20ADAP%20Monitoring%20Project%20Annual%20Report%20-%20March%202011.pdf.
52. national alliance of State & territorial aiDS DirectorS (naStaD), national aDap monitoring project annual report, 56, tbl.11, auguSt 2012, available at http://www.nastad.org/Docs/021503_National%20ADAP%20Monitoring%20Project%20Annual%20Report%20-%20August%202012.pdf.
53. national alliance of State & territorial aiDS DirectorS (naStaD), national aDap monitoring project annual report, auguSt 2012, available at http://www.nastad.org/Docs/021503_National%20ADAP%20Monitoring%20Project%20Annual%20Report%20-%20August%202012.pdf.
54. Letter from Cindy Mann, Director, Centers for Medicare & Medicaid Services, to State Medicaid Director (November 20, 2012).
55. 45 C.F.R. pts. 144, 147, 150, et al (proposed November 26, 2012).
56. Letter from Cindy Mann, Director, Centers for Medicare & Medicaid Services, to State Medicaid Director (November 20, 2012).

This report discusses research that is conducted by the Center for Health Law and Policy Innovation of Harvard Law School, which is funded by Bristol-Myers Squibb with no editorial review or discretion.
Prepared by the Center for Health Law and Policy Innovation of Harvard Law School and the Treatment Access Expansion Project


