Page 1
State level achievements of MDG - indicators in India during 1993-94 – 2013-14
Ranajit ChakrabartyFormer Professor of Management, Calcutta University, India
Mahuya Chakrabarti Assistant Professor of Economics, Bethune College, Kolkata, India
Ayan ChattopadhyaySenior Manager, Future Retail Ltd., India
Page 2
Contents
Background of MDG
MDG – The Indian Case
Motivation of Study
Objectives
Data
Methodology
MCDM Approach
Conclusion
Limitations of Study
Page 3
Background of MDG
Over the last two decades of the twentieth century,
world development was threatened by pronounced
inequality in the society.
The United Nations conferences and summits held
during that period reflect the same gradually leading
to the Millennium Summit in September 2000 to
adopt the United Nations Millennium Declaration.
The Declaration set out a series of eight goals known
as the Millennium Development Goals (MDGs).
Page 4
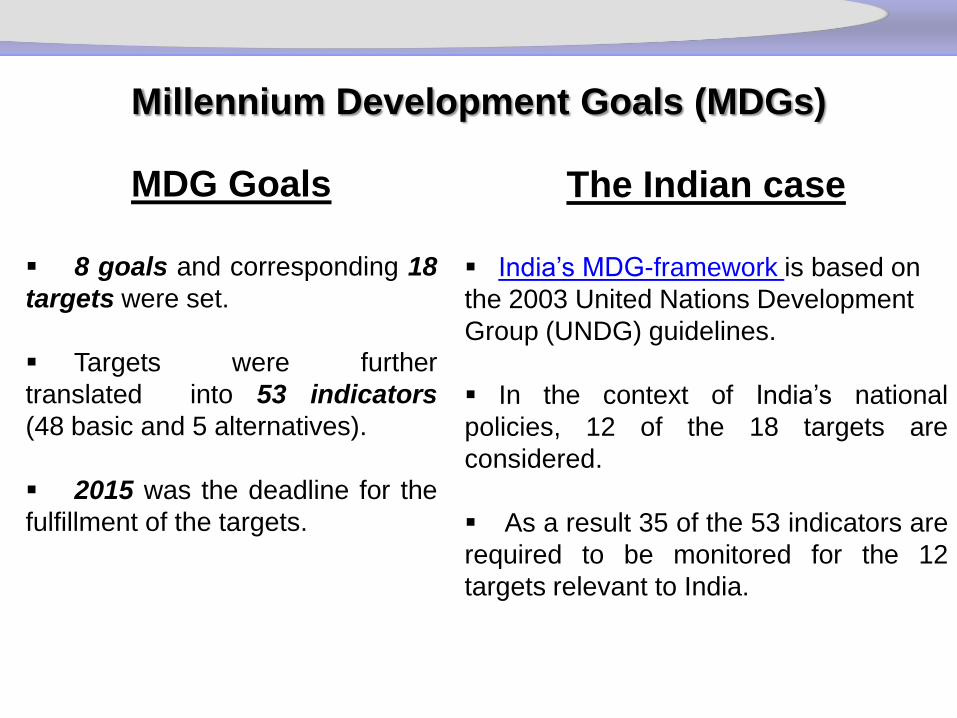
MDG Goals
8 goals and corresponding 18
targets were set.
Targets were further
translated into 53 indicators
(48 basic and 5 alternatives).
2015 was the deadline for the
fulfillment of the targets.
Millennium Development Goals (MDGs)
The Indian case
India’s MDG-framework is based on
the 2003 United Nations Development
Group (UNDG) guidelines.
In the context of India’s national
policies, 12 of the 18 targets are
considered.
As a result 35 of the 53 indicators are
required to be monitored for the 12
targets relevant to India.
Page 5
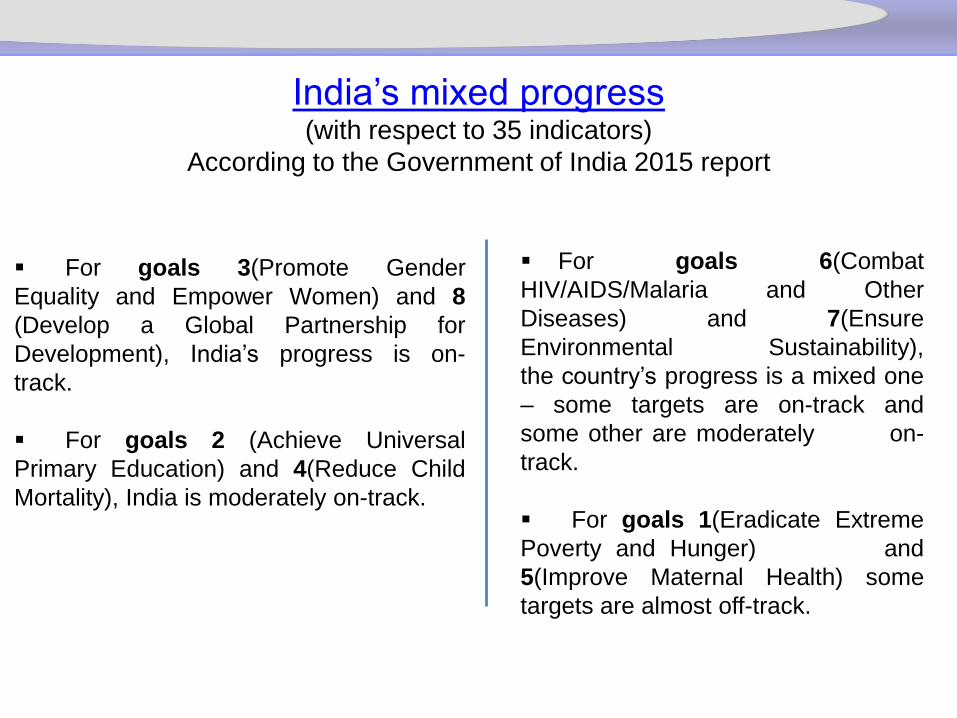
For goals 3(Promote Gender
Equality and Empower Women) and 8
(Develop a Global Partnership for
Development), India’s progress is on-
track.
For goals 2 (Achieve Universal
Primary Education) and 4(Reduce Child
Mortality), India is moderately on-track.
For goals 6(Combat
HIV/AIDS/Malaria and Other
Diseases) and 7(Ensure
Environmental Sustainability),
the country’s progress is a mixed one
– some targets are on-track and
some other are moderately on-
track.
For goals 1(Eradicate Extreme
Poverty and Hunger) and
5(Improve Maternal Health) some
targets are almost off-track.
India’s mixed progress (with respect to 35 indicators)
According to the Government of India 2015 report
Page 6
Motivation of Study
India being a diverse country with 36 States and
Union Territories, a very mixed progress of MDG
indicators in India does not give any effective idea
about the State level variations.
The present paper attempts to carry out a
comprehensive analysis taking all the
indicators of MDGS (relevant for India) and all
the States of India.
Page 7
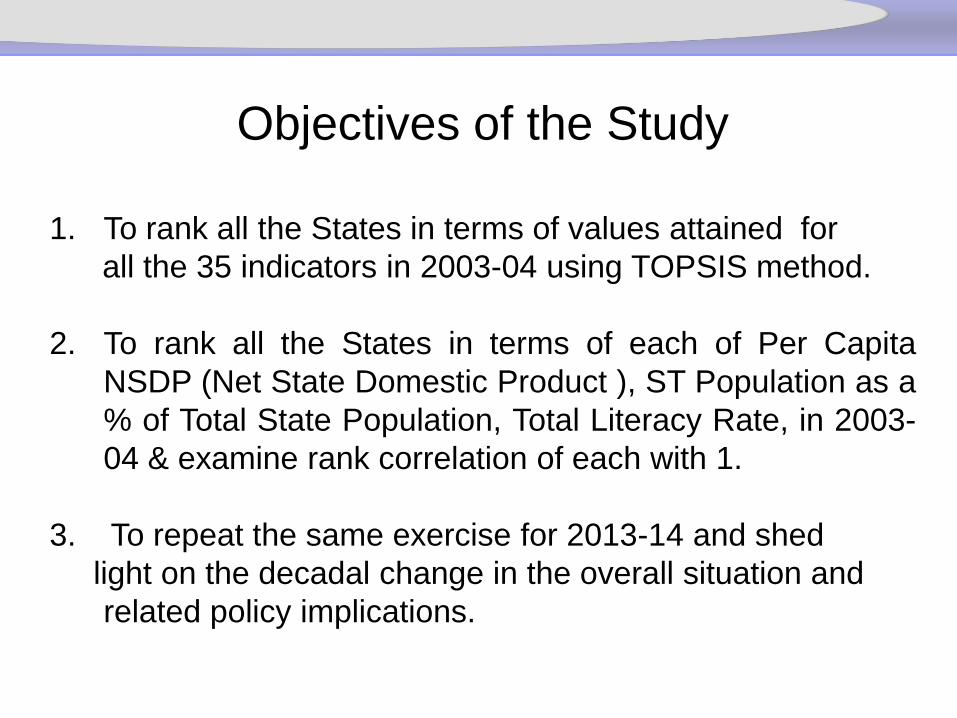
Objectives of the Study
1. To rank all the States in terms of values attained for
all the 35 indicators in 2003-04 using TOPSIS method.
2. To rank all the States in terms of each of Per Capita
NSDP (Net State Domestic Product ), ST Population as a
% of Total State Population, Total Literacy Rate, in 2003-
04 & examine rank correlation of each with 1.
3. To repeat the same exercise for 2013-14 and shed
light on the decadal change in the overall situation and
related policy implications.
Page 8
Data
Data on 35 indicators of MDGs for all the States of
India (barring Union Territories other than the
National Capital Delhi) have been collected from a
variety of sources including administrative data
compiled by Central Ministries and information
gathered from periodic national surveys and
censuses carried out by the Government of India.
Due to non-availability of State level data for some
indicators, a few proxies are taken.
Page 9
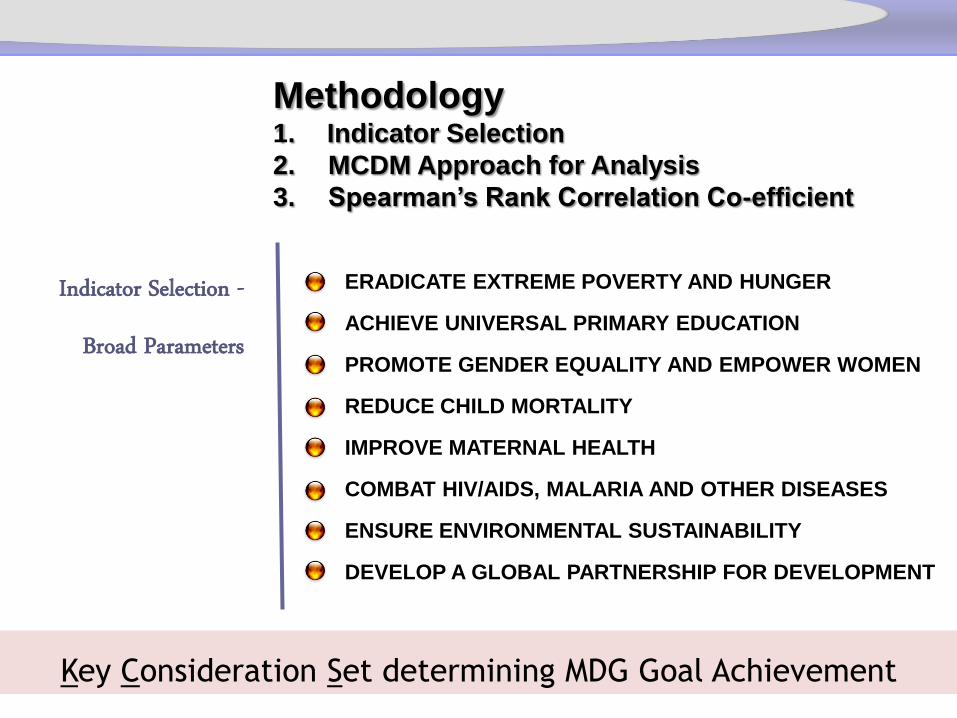
Indicator Selection -
Broad Parameters
Key Consideration Set determining MDG Goal Achievement
Methodology1. Indicator Selection
2. MCDM Approach for Analysis
3. Spearman’s Rank Correlation Co-efficient
ERADICATE EXTREME POVERTY AND HUNGER
ACHIEVE UNIVERSAL PRIMARY EDUCATION
PROMOTE GENDER EQUALITY AND EMPOWER WOMEN
REDUCE CHILD MORTALITY
IMPROVE MATERNAL HEALTH
COMBAT HIV/AIDS, MALARIA AND OTHER DISEASES
ENSURE ENVIRONMENTAL SUSTAINABILITY
DEVELOP A GLOBAL PARTNERSHIP FOR DEVELOPMENT
Page 10
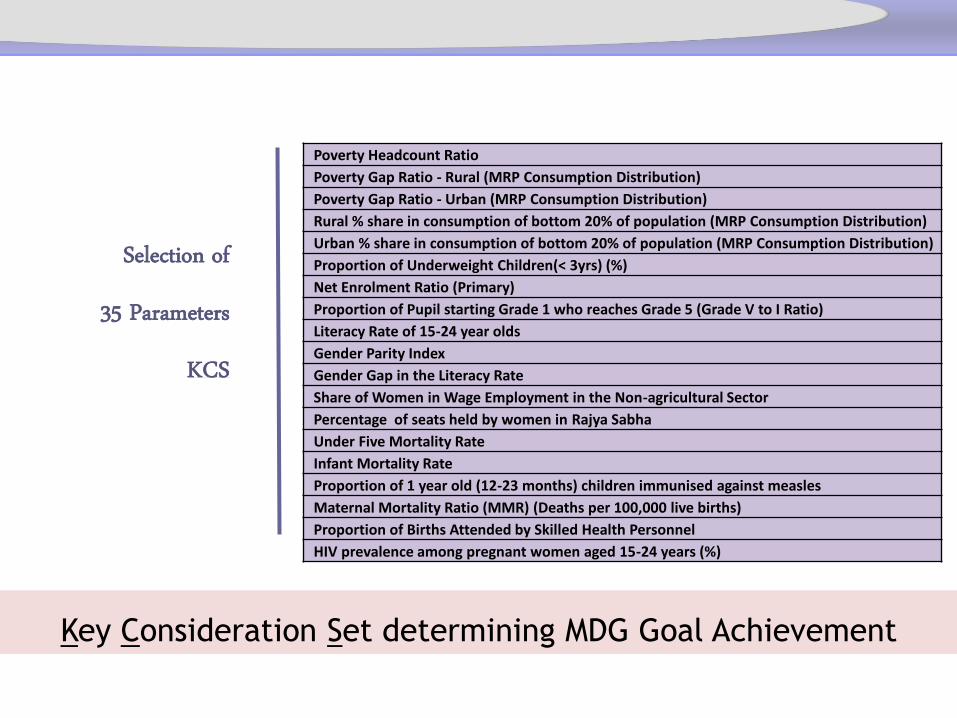
Selection of
35 Parameters
KCS
Key Consideration Set determining MDG Goal Achievement
Poverty Headcount Ratio
Poverty Gap Ratio - Rural (MRP Consumption Distribution)
Poverty Gap Ratio - Urban (MRP Consumption Distribution)
Rural % share in consumption of bottom 20% of population (MRP Consumption Distribution)
Urban % share in consumption of bottom 20% of population (MRP Consumption Distribution)
Proportion of Underweight Children(< 3yrs) (%)
Net Enrolment Ratio (Primary)
Proportion of Pupil starting Grade 1 who reaches Grade 5 (Grade V to I Ratio)
Literacy Rate of 15-24 year olds
Gender Parity Index
Gender Gap in the Literacy Rate
Share of Women in Wage Employment in the Non-agricultural Sector
Percentage of seats held by women in Rajya Sabha
Under Five Mortality Rate
Infant Mortality Rate
Proportion of 1 year old (12-23 months) children immunised against measles
Maternal Mortality Ratio (MMR) (Deaths per 100,000 live births)
Proportion of Births Attended by Skilled Health Personnel
HIV prevalence among pregnant women aged 15-24 years (%)
Page 11
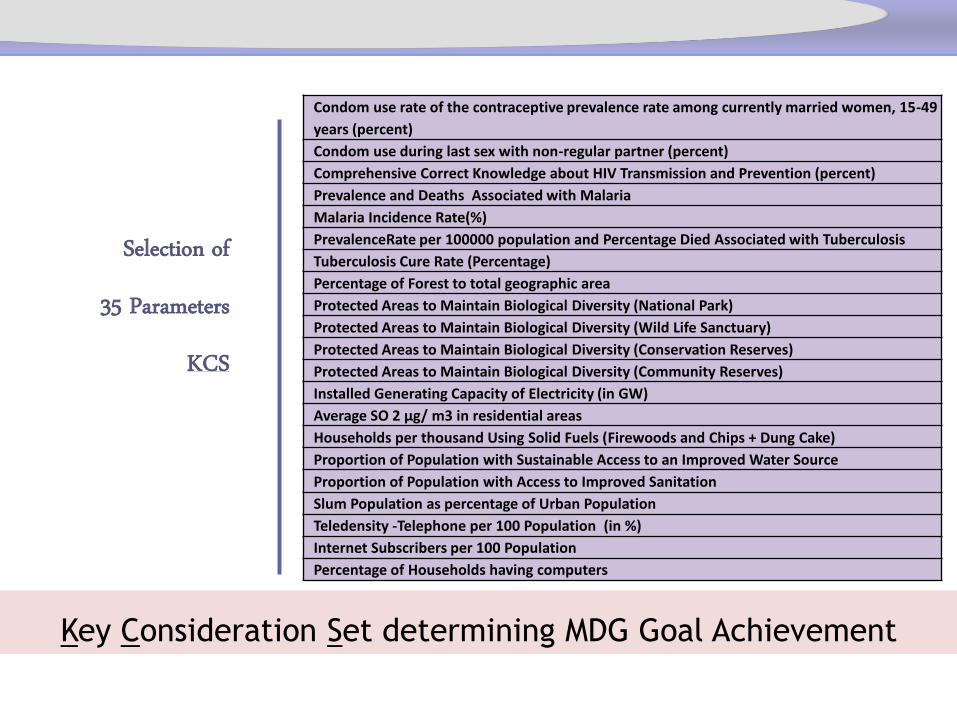
Selection of
35 Parameters
KCS
Key Consideration Set determining MDG Goal Achievement
Condom use rate of the contraceptive prevalence rate among currently married women, 15-49
years (percent)
Condom use during last sex with non-regular partner (percent)
Comprehensive Correct Knowledge about HIV Transmission and Prevention (percent)
Prevalence and Deaths Associated with Malaria
Malaria Incidence Rate(%)
PrevalenceRate per 100000 population and Percentage Died Associated with Tuberculosis
Tuberculosis Cure Rate (Percentage)
Percentage of Forest to total geographic area
Protected Areas to Maintain Biological Diversity (National Park)
Protected Areas to Maintain Biological Diversity (Wild Life Sanctuary)
Protected Areas to Maintain Biological Diversity (Conservation Reserves)
Protected Areas to Maintain Biological Diversity (Community Reserves)
Installed Generating Capacity of Electricity (in GW)
Average SO 2 μg/ m3 in residential areas
Households per thousand Using Solid Fuels (Firewoods and Chips + Dung Cake)
Proportion of Population with Sustainable Access to an Improved Water Source
Proportion of Population with Access to Improved Sanitation
Slum Population as percentage of Urban Population
Teledensity -Telephone per 100 Population (in %)
Internet Subscribers per 100 Population
Percentage of Households having computers
Page 12
MCDM Approach
(Multi Criteria Decision Making)
Classification of Parameters
Normalization
Weight Determination
TOPSIS
State Ranking
Page 13
MCDM
Classification of Parameters
Data of input parameters are first classified as
positive or negative
A parameter is considered as positive if increase
in its value increases the scope of retailing and
vice versa
Page 14
MCDM
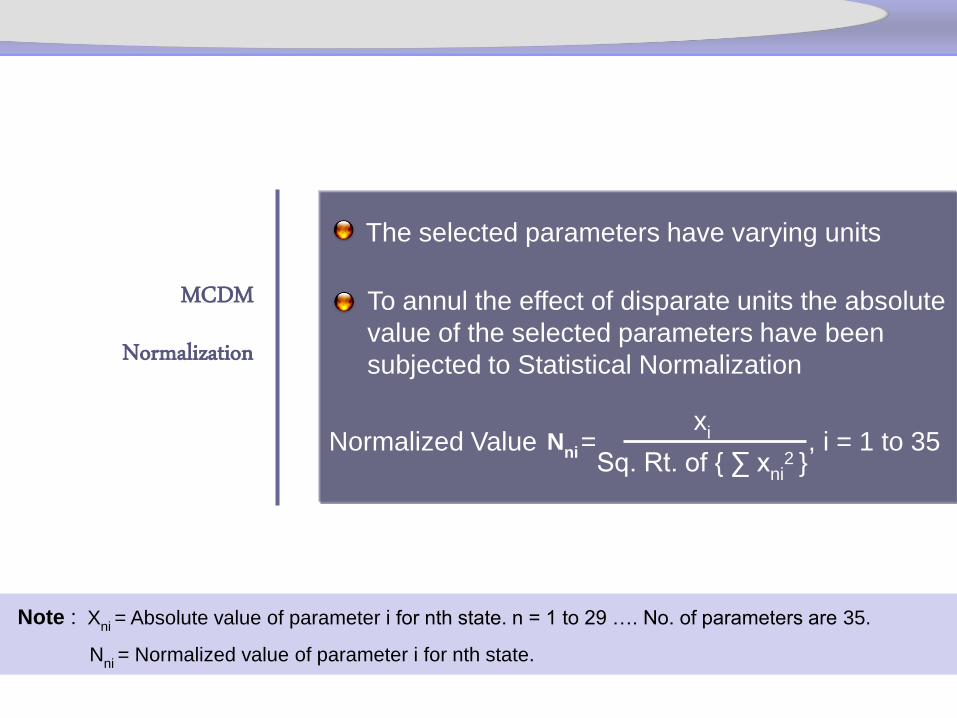
Normalization
The selected parameters have varying units
To annul the effect of disparate units the absolute
value of the selected parameters have been
subjected to Statistical Normalization
Normalized Value = , i = 1 to 35x
i
Sq. Rt. of { ∑ xni
2 }
Xni
= Absolute value of parameter i for nth state. n = 1 to 29 …. No. of parameters are 35.Note :
Nni
Nni
= Normalized value of parameter i for nth state.
Page 15
MCDM
Weight Determination
Contrary to Summation Method, parameters are
considered to have varying importance and
hence varying weight in MCDM Approach
Shannon’s Method have been used to determine
the relative weight of selected parameters
∑ [Ln{P(xni
)}*P(xni
)]
- Ln (No. of Parameters)E (C
ni) =
1 - E(Cn1
)
∑ {1 - E(Cn1
)}Weight W
i=
Note : Xni
= Absolute value of parameter i for nth state. n = 1 to 29 …. i = 1 to 35
P (xni), E (C
ni) & W
idenotes Probability, Entropy & Weight of parameter i for nth state respectively.
Page 16
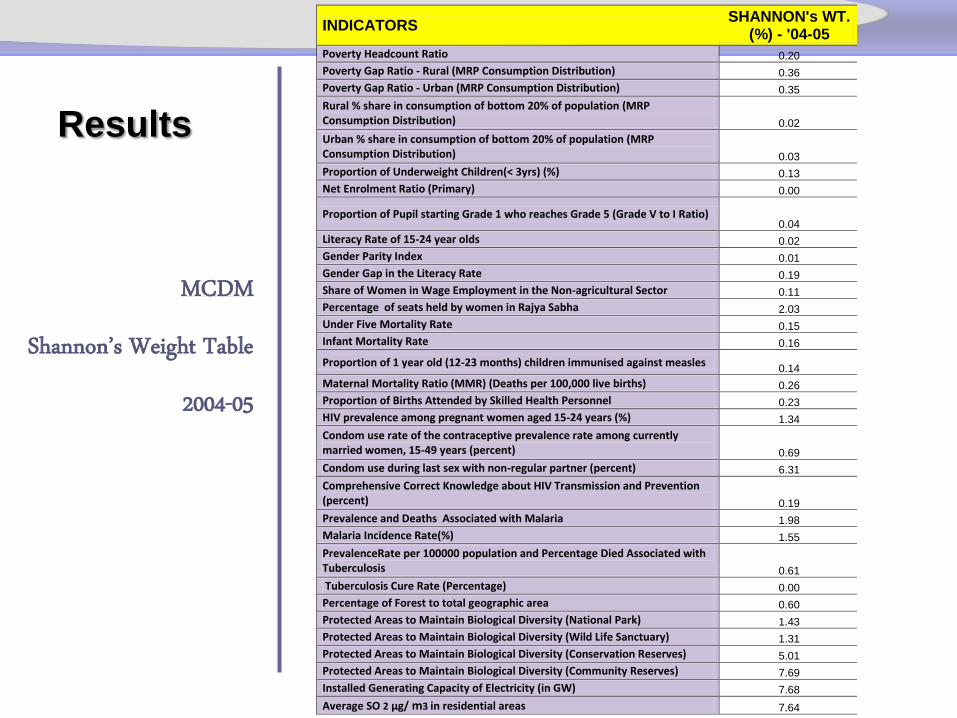
MCDM
Shannon’s Weight Table
2004-05
INDICATORS SHANNON's WT.
(%) - '04-05
Poverty Headcount Ratio 0.20
Poverty Gap Ratio - Rural (MRP Consumption Distribution) 0.36
Poverty Gap Ratio - Urban (MRP Consumption Distribution) 0.35
Rural % share in consumption of bottom 20% of population (MRP Consumption Distribution) 0.02
Urban % share in consumption of bottom 20% of population (MRP Consumption Distribution) 0.03
Proportion of Underweight Children(< 3yrs) (%) 0.13
Net Enrolment Ratio (Primary) 0.00
Proportion of Pupil starting Grade 1 who reaches Grade 5 (Grade V to I Ratio) 0.04
Literacy Rate of 15-24 year olds 0.02
Gender Parity Index 0.01
Gender Gap in the Literacy Rate 0.19
Share of Women in Wage Employment in the Non-agricultural Sector 0.11
Percentage of seats held by women in Rajya Sabha 2.03
Under Five Mortality Rate 0.15
Infant Mortality Rate 0.16
Proportion of 1 year old (12-23 months) children immunised against measles 0.14
Maternal Mortality Ratio (MMR) (Deaths per 100,000 live births) 0.26
Proportion of Births Attended by Skilled Health Personnel 0.23
HIV prevalence among pregnant women aged 15-24 years (%) 1.34
Condom use rate of the contraceptive prevalence rate among currently married women, 15-49 years (percent) 0.69
Condom use during last sex with non-regular partner (percent) 6.31
Comprehensive Correct Knowledge about HIV Transmission and Prevention (percent) 0.19
Prevalence and Deaths Associated with Malaria 1.98
Malaria Incidence Rate(%) 1.55
PrevalenceRate per 100000 population and Percentage Died Associated with Tuberculosis 0.61
Tuberculosis Cure Rate (Percentage) 0.00
Percentage of Forest to total geographic area 0.60
Protected Areas to Maintain Biological Diversity (National Park) 1.43
Protected Areas to Maintain Biological Diversity (Wild Life Sanctuary) 1.31
Protected Areas to Maintain Biological Diversity (Conservation Reserves) 5.01
Protected Areas to Maintain Biological Diversity (Community Reserves) 7.69
Installed Generating Capacity of Electricity (in GW) 7.68
Average SO 2 μg/ m3 in residential areas 7.64
Results
Page 17
MCDM
Shannon’s Weight Table
2013-14
INDICATORS SHANNON's WT.
(%) - '13-14
Poverty Headcount Ratio 0.35
Poverty Gap Ratio - Rural (MRP Consumption Distribution) 0.51
Poverty Gap Ratio - Urban (MRP Consumption Distribution) 0.56
Rural % share in consumption of bottom 20% of population (MRP Consumption Distribution)
0.01
Urban % share in consumption of bottom 20% of population (MRP Consumption Distribution)
0.92
Proportion of Underweight Children(< 3yrs) (%) 0.79
Net Enrolment Ratio (Primary) 0.01
Proportion of Pupil starting Grade 1 who reaches Grade 5 (Grade V to I Ratio) 0.22
Literacy Rate of 15-24 year olds 0.26
Gender Parity Index 0.00
Gender Gap in the Literacy Rate 0.21
Share of Women in Wage Employment in the Non-agricultural Sector 0.20
Percentage of seats held by women in Rajya Sabha 2.26
Under Five Mortality Rate 0.11
Infant Mortality Rate 0.51
Proportion of 1 year old (12-23 months) children immunised against measles 0.35
Maternal Mortality Ratio (MMR) (Deaths per 100,000 live births) 0.14
Proportion of Births Attended by Skilled Health Personnel 0.05
HIV prevalence among pregnant women aged 15-24 years (%) 0.50
Condom use rate of the contraceptive prevalence rate among currently married women, 15-49 years (percent)
0.68
Condom use during last sex with non-regular partner (percent) 6.30
Comprehensive Correct Knowledge about HIV Transmission and Prevention (percent)
0.15
Prevalence and Deaths Associated with Malaria 1.96
Malaria Incidence Rate(%) 1.60
PrevalenceRate per 100000 population and Percentage Died Associated with Tuberculosis
0.52
Tuberculosis Cure Rate (Percentage) 0.00
Percentage of Forest to total geographic area 0.69
Protected Areas to Maintain Biological Diversity (National Park) 1.25
Protected Areas to Maintain Biological Diversity (Wild Life Sanctuary) 1.21
Protected Areas to Maintain Biological Diversity (Conservation Reserves) 4.13
Protected Areas to Maintain Biological Diversity (Community Reserves) 7.67
Installed Generating Capacity of Electricity (in GW) 7.65
Average SO 2 μg/ m3 in residential areas 7.62
Page 18
MCDM
TOPSIS
TOPSIS considers the best and the worst solution. For
a particular parameter, the positive (best value) and
the negative (worst value) ideal is selected from the
normalized values of all states
Distance from PI, = Sq. Rt. Of [ ∑ {Wi(N
ni- PI)}^2 ]d(S
n,S
+)
The distance from the ideal values are calculated next
Distance from NI, = Sq. Rt. Of [ ∑ {Wi(N
ni- NI)}^2 ]d(S
n,S
-)
Technique for Order Preference by Similarity to Ideal Solution
PI & NI denotes positive and negative ideal
Nni
= Normalized value of parameter i for nth state.Note :
Page 19
MCDM
TOPSIS (Relative Closeness)
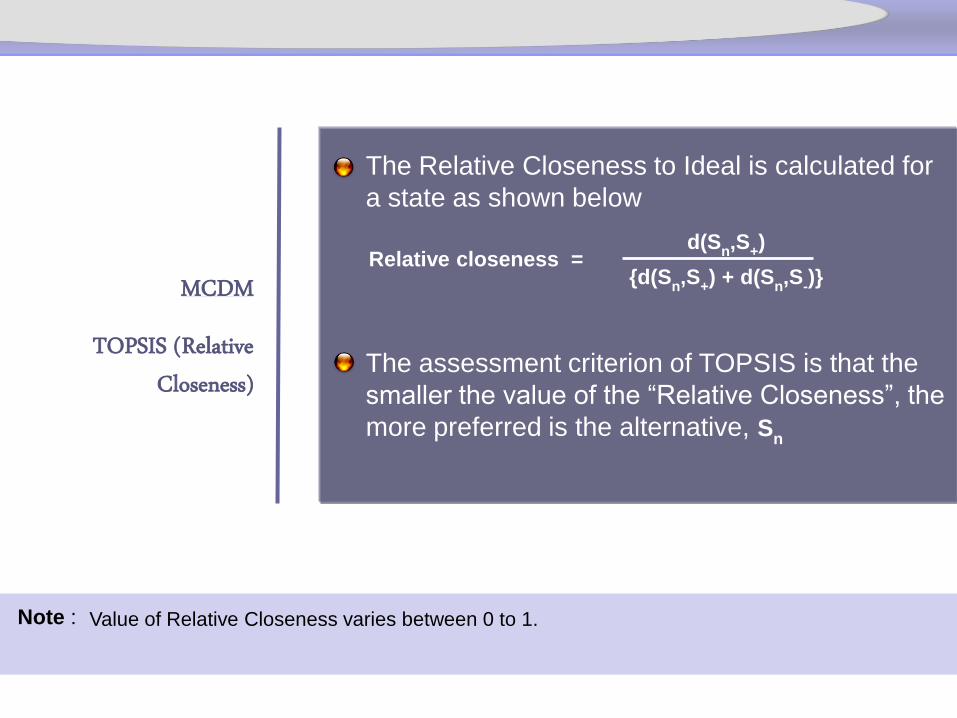
The Relative Closeness to Ideal is calculated for
a state as shown below
Note : Value of Relative Closeness varies between 0 to 1.
d(Sn,S
+)
{d(Sn,S
+) + d(S
n,S
-)}
Relative closeness =
The assessment criterion of TOPSIS is that the
smaller the value of the “Relative Closeness”, the
more preferred is the alternative, Sn
Page 20
MCDM
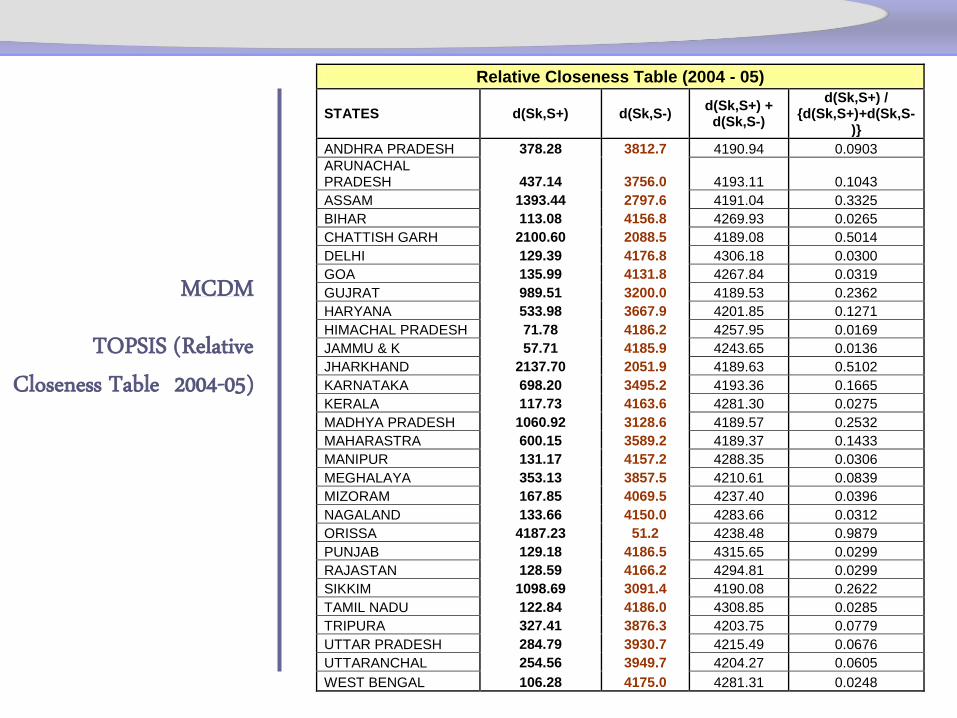
TOPSIS (Relative Closeness Table 2004-05)
Relative Closeness Table (2004 - 05)
STATES d(Sk,S+) d(Sk,S-) d(Sk,S+) +
d(Sk,S-)
d(Sk,S+) / {d(Sk,S+)+d(Sk,S-
)}
ANDHRA PRADESH 378.28 3812.7 4190.94 0.0903
ARUNACHAL PRADESH 437.14 3756.0 4193.11 0.1043
ASSAM 1393.44 2797.6 4191.04 0.3325
BIHAR 113.08 4156.8 4269.93 0.0265
CHATTISH GARH 2100.60 2088.5 4189.08 0.5014
DELHI 129.39 4176.8 4306.18 0.0300
GOA 135.99 4131.8 4267.84 0.0319
GUJRAT 989.51 3200.0 4189.53 0.2362
HARYANA 533.98 3667.9 4201.85 0.1271
HIMACHAL PRADESH 71.78 4186.2 4257.95 0.0169
JAMMU & K 57.71 4185.9 4243.65 0.0136
JHARKHAND 2137.70 2051.9 4189.63 0.5102
KARNATAKA 698.20 3495.2 4193.36 0.1665
KERALA 117.73 4163.6 4281.30 0.0275
MADHYA PRADESH 1060.92 3128.6 4189.57 0.2532
MAHARASTRA 600.15 3589.2 4189.37 0.1433
MANIPUR 131.17 4157.2 4288.35 0.0306
MEGHALAYA 353.13 3857.5 4210.61 0.0839
MIZORAM 167.85 4069.5 4237.40 0.0396
NAGALAND 133.66 4150.0 4283.66 0.0312
ORISSA 4187.23 51.2 4238.48 0.9879
PUNJAB 129.18 4186.5 4315.65 0.0299
RAJASTAN 128.59 4166.2 4294.81 0.0299
SIKKIM 1098.69 3091.4 4190.08 0.2622
TAMIL NADU 122.84 4186.0 4308.85 0.0285
TRIPURA 327.41 3876.3 4203.75 0.0779
UTTAR PRADESH 284.79 3930.7 4215.49 0.0676
UTTARANCHAL 254.56 3949.7 4204.27 0.0605
WEST BENGAL 106.28 4175.0 4281.31 0.0248
Page 21
CONCLUSION
Two rank correlations are found to be
statistically significant :
Between TOPSIS Rank 2013-14 & TOPSIS Rank
2003-04 implying a consistency in the process of
progress for the States regarding all the indicators
of MDGs taken together
Between TOPSIS Rank 2003-04 & ST Pop
Percent Rank 2003-04 (but not between TOPSIS
Rank 2013-14 & ST Pop Percent Rank 2013-14)
implying a gradual process of social inclusion over
the decade.
Page 22
LIMITATIONS OF STUDY
Per Capita Net State Domestic Product and Total
Literacy Rates do not have significant connection
MDG indicators.
There might be some other important factor
playing a larger role but not captured in the
present study – The political leadership at State &
Centre.
However, measurability of political leadership
needs to be explored in future.