64

STATE OF CALIFORNIA
JACK SCOTT, CHANCELLOR
CALIFORNIA COMMUNITY COLLEGES CHANCELLOR’S OFFICE 1102 Q STREET SACRAMENTO, CA 95811-6549 (916) 445-8752
http://www.cccco.edu
August 10, 2012
The Honorable Jerry Brown
Governor of California
State Capitol
Sacramento, California 95814
Dear Governor Brown:
I am pleased to present to you the California Community Colleges Chancellor’s Office report on Student Financial Aid Programs in 2010/2011.
As you may be aware, the number of community college students who apply for financial aid has steadily increased during the past decade. Our financial aid officers throughout the state are doing a heroic job as they strive to meet record breaking demands for services on their campuses.
This report documents the expenditures of the Board Financial Assistance Program-
Student Financial Aid Administration funds provided to increase student financial
aid participation in all of our colleges. It also includes extensive data on the
numbers and characteristics of new financial aid recipients and a comparison of
years 2009/10 and 2010/11 with the baseline year 2002/03 performance measures.
We have included as a supplement to this report highlights of the state’s ongoing
public awareness campaign on the availability of financial aid opportunities for
California community college students.
If you or your staff have questions or comments regarding this report, please contact
Erik Skinner, executive vice chancellor for programs, at (916) 323-7007 or
Thank you for your interest in these programs and the students they serve.
Sincerely,
Jack Scott, Ph.D.
Chancellor
Student Financial Aid
Executive Summary
The California Community Colleges is the nation’s largest system of public higher education and serves more than 2.6 million students. The 112 community colleges offer many programs of study and courses that address its three primary areas of mission: education for university transfer, career technical education, and basic skills.
Due to reductions in state funding, enrollments have dropped for two consecutive years and are still at a level below that of 2002/03, the base year with which this report’s figures are compared. Despite the downward trend in enrollment, California’s community colleges continue to make tremendous strides in providing increased financial aid to their students.
Over the past eight years, community college
financial aid recipients have doubled from 610,000
to 1.2 million, and financial aid dollars have nearly tripled, from $895 million to nearly $2.6 billion. These extraordinary increases are the result of expanded financial aid services made possible by financial aid capacity funds first provided by the state in 2003/04. The capacity funds have served their intended purpose: to promote public awareness of financial aid and ensure that the fee increases did not discourage students, particularly low-income or disadvantaged students, from attending college.
Table of Contents
Table of Contents Executive Summary Page 1
Introduction Page 3
Methodology Page 5
Background Page 5
Financial Aid Administrative Funding Sources Page 11
Accurately Comparing Financial Aid Participation Rates Page 12
Allocation Formula for BFAP SFAA Page 14
How Colleges have Invested Funds to Increase Participation Page 14
College Performance Indicators Page 21
In-Reach and Outreach Services Page 29
Key Findings Page 45
Conclusions Page 46
SUPPLEMENTAL REPORT “I Can Afford College” Page 47
Acknowledgments Page 61
Student Financial Aid Programs 2010/11 | 1
2 | California Community Colleges Chancellor’s Office
The 2010/11 Budget Act includes the same funding components as those established in the 2004/05 capacity funding augmentation: $34.2 million for administrative capacity and $2.8 million for the statewide “I Can Afford College” financial aid awareness media campaign. Included in the budget is language that directs the system chancellor to submit an annual report to the governor and legislature that compares the most recent two years on:
Changes in financial aid applications and Board of Governors (BOG) Fee
Waivers processed.
Types and frequency of outreach contacts. Overall costs of outreach efforts.
Student subgroups, based on age, race, ethnicity, gender, BOG Fee Waiver status, and other external factors, as determined by the chancellor.
Relative enrollment changes since the 2002/03 baseline year.
The report contains aggregated data from all 112 community colleges and documents the outcomes of Board Financial Assistance Program-Student Financial Aid Administration (FAP-SFAA) funds provided to increase student financial aid participation. Included in the report is information on the distribution of funds, specific uses of the funds, strategies to reach potentially eligible low-income and disadvantaged students, and the extent to which districts were successful in increasing the number of students accessing financial aid, particularly Pell Grants.
The report also includes:
Demographic tables and exhibits showing student enrollment headcounts,
financial aid applications, financial aid awards, and funding levels for the baseline 2002/03 academic year and the 2009/10 and 2010/11 reporting years.
A description of the method used to allocate funds through the 2010/11 year.
A display of allocations by college.
A summary of the 2010/11 financial aid outreach strategies.
A comparison of the 2002/03 Student Financial Assistance Programs (SFAP) performance data with data from the 2009/10 and 2010/11 academic years.
A summary of the “I Can Afford College” campaign efforts during 2010/11.
A summary of the challenges faced by financial aid officers for 2010/11 and 2011/12.
Student Financial Aid Programs 2010/11 | 3
Introduction
In 2003/04, the state Budget Act redirected $38 million in the California Community Colleges Chancellor’s Office budget to increase financial aid administrative capacity and outreach. These funds were intended as a countermeasure to that year’s 64 percent increase in community college fees, from $11 to $18, and were meant to ensure that the fee increase did not discourage or deprive students of the means for attending college. The fees have since doubled to $36 per unit and increased to $46 per unit in the summer of 2012.
Of the $38 million in BFAP-SFAA funds budgeted for 2003/04, $34.2 million was designated to expand financial aid outreach and administrative capacity; and $3.8 million was designated for the statewide “I Can Afford College” financial aid awareness media campaign to promote public awareness and increase participation in financial aid programs. T h e media campaign funds were reduced to $2.8 million in 2004/05 and have subsequently been maintained annually at that level. The BFAP-SFAA capacity funding not only enables community colleges to reduce the impact of the increased fees on low income and disadvantaged students and their families, but also allows expanded outreach efforts to increase the number of students who receive financial aid services and financial aid funds.
When combined with the base funding for student financial aid administration, the 2010/11 Budget Act provided a total of $45.6 million in funding for student financial aid administration. The funds serve a dual purpose:
To increase awareness and participation in student financial aid programs through direct contact with potential students, current students, and families.
To increase low-income and disadvantaged student participation
in postsecondary education, by providing access to information, application assistance, and expanding the number of funded financial aid awards.
4 | California Community Colleges Chancellor’s Office
California’s community colleges conducted more than 12,000 in-reach and outreach events in 2010/11, including more than 3,000 multilingual events. As a result of these efforts, more than 600,000 new recipients were awarded financial aid in 2010/11. This represents a 70 percent increase in the number of new recipients since 2002/03. Community colleges served 1.5 million financial aid applicants in 2010/11 and a cumulative total of 3.5 million student financial aid applicants since 2002/03.
While enrollments are less than they were in 2002/03 base year, community colleges have made enormous progress in providing increased financial aid services and awards:
Unduplicated financial aid recipients have increased 89 percent.
BOG Fee Waiver awards have increased 89 percent.
Pell Grant awards have increased 105 percent. Funding to all students in financial aid programs has increased 184 percent.
The findings in this report illustrate the high return on the state’s $37 million funding for financial aid administration and the statewide “I Can Afford College” financial aid awareness media campaign. Of particular note is the 105 percent increase in federal Pell Grant recipients. Federal financial aid programs added over $2 billion to California’s economy in 2010/11. The BFAP-SFAA funding has not only enabled community colleges to reduce the impact of the increased fees on low-income and disadvantaged students and their families, but has also allowed them to steadily produce substantial annual increases in the number of students who receive financial aid services and funds.
Student Financial Aid Programs 2010/11 | 5
Methodology
The primary source of data for this report is the Chancellor’s Office Management Information System (COMIS), which provides information on:
student enrollments
student demographics
program awards
financial aid
matriculation
Another significant source of information is the data provided on the BFAP- SFAA campus annual report forms that are required from each college. These forms are aggregated and analyzed by the Chancellor’s Office to provide information on the use of funds, outreach activities, program applications and staffing, including:
administrative costs
BFAP-SFAA funding allocations
student support services
The “I Can Afford College” campaign provides additional information and data regarding the use of funds for statewide financial aid awareness advertising, marketing, media relations and outreach activities.
Background
Financial Aid Programs in California Community Colleges
Community college financial aid offices administer as many as 30 state, federal, and campus student aid programs. In 2002/03, colleges provided 610,000 students with more than $895 million from various student financial assistance programs to cover educational expenses. With the introduction of the BFAP-SFAA administrative capacity funding, in 2003/04, financial aid program participants and financial aid dollars have risen dramatically.
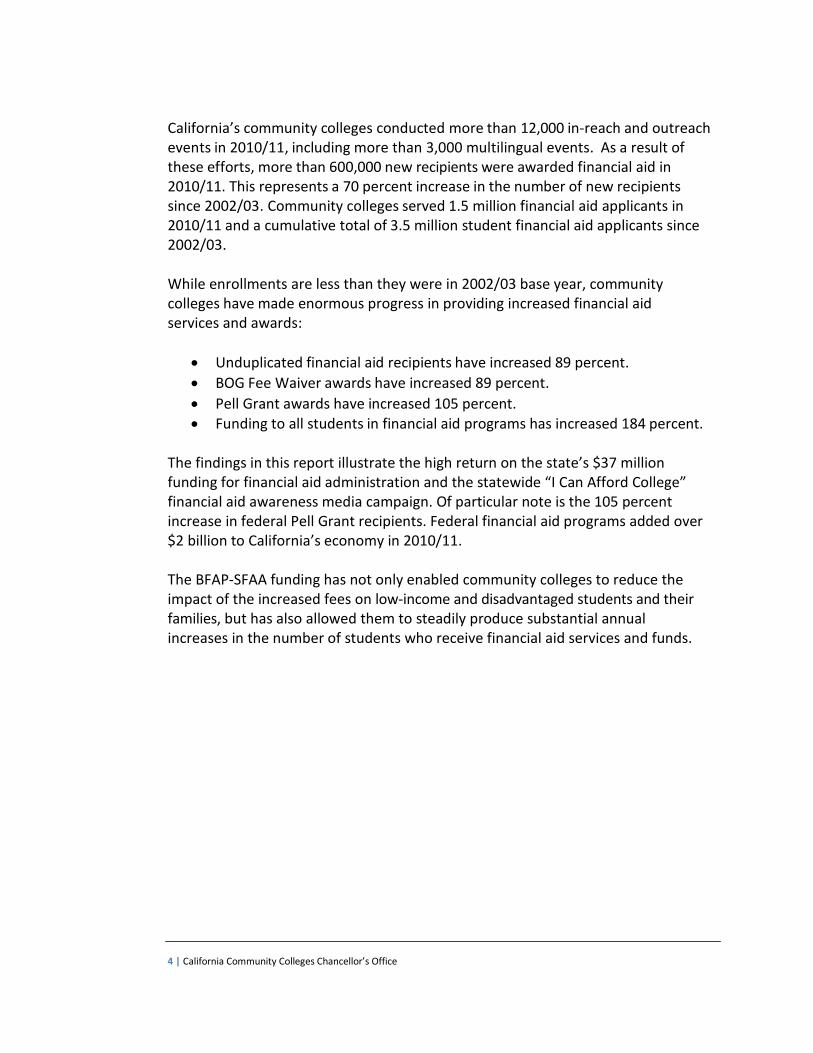
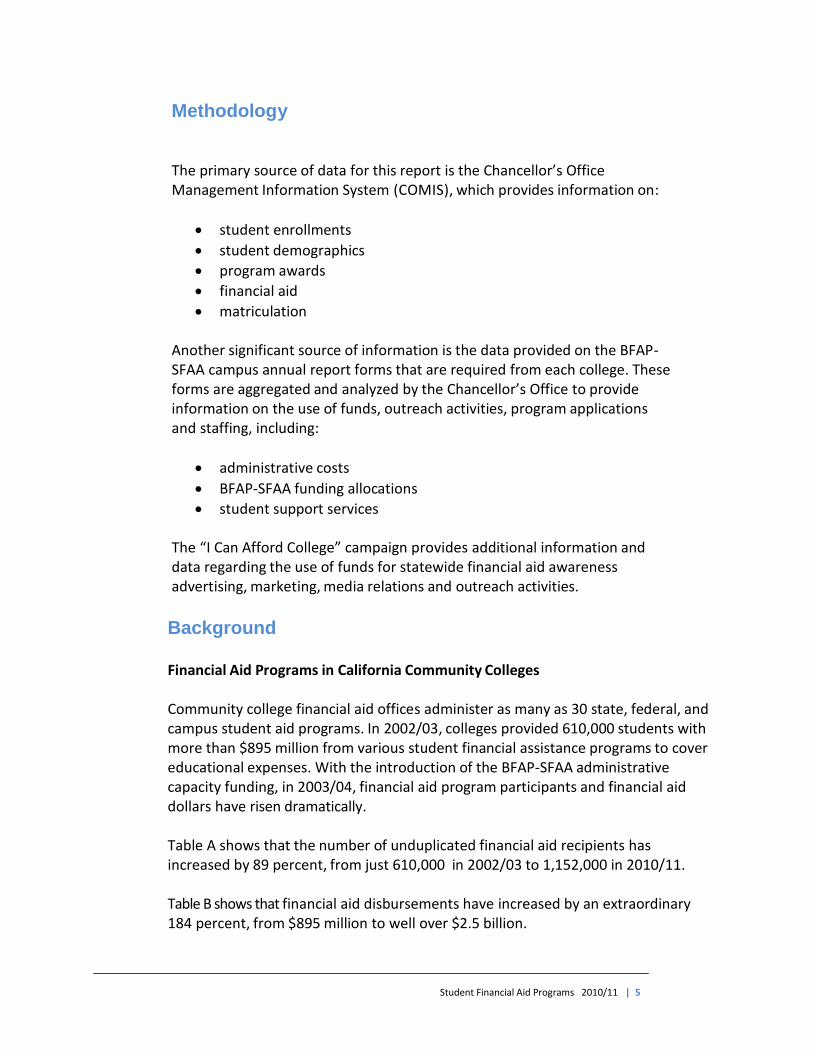
Table A shows that the number of unduplicated financial aid recipients has increased by 89 percent, from just 610,000 in 2002/03 to 1,152,000 in 2010/11. Table B shows that financial aid disbursements have increased by an extraordinary 184 percent, from $895 million to well over $2.5 billion.
6 | California Community Colleges Chancellor’s Office
TABLE A - Year Comparison of Unduplicated Financial Aid Recipients
TABLE B – Distribution of Financial Aid Dollars by Program for 2010/11
Student Financial Aid Programs 2010/11 | 7
With the exception of a slight drop in 2006/07, community colleges have experienced annual increases in both the dollars distributed and the students served since the 2002/03 baseline year. The 2006/07 drop resulted from the combined effects of a change in the federal needs analysis formula and a 23 percent drop in enrollment fees, from $26 to $20 per unit, in January 2007. These factors reduced both the number and amount of awards for that year.
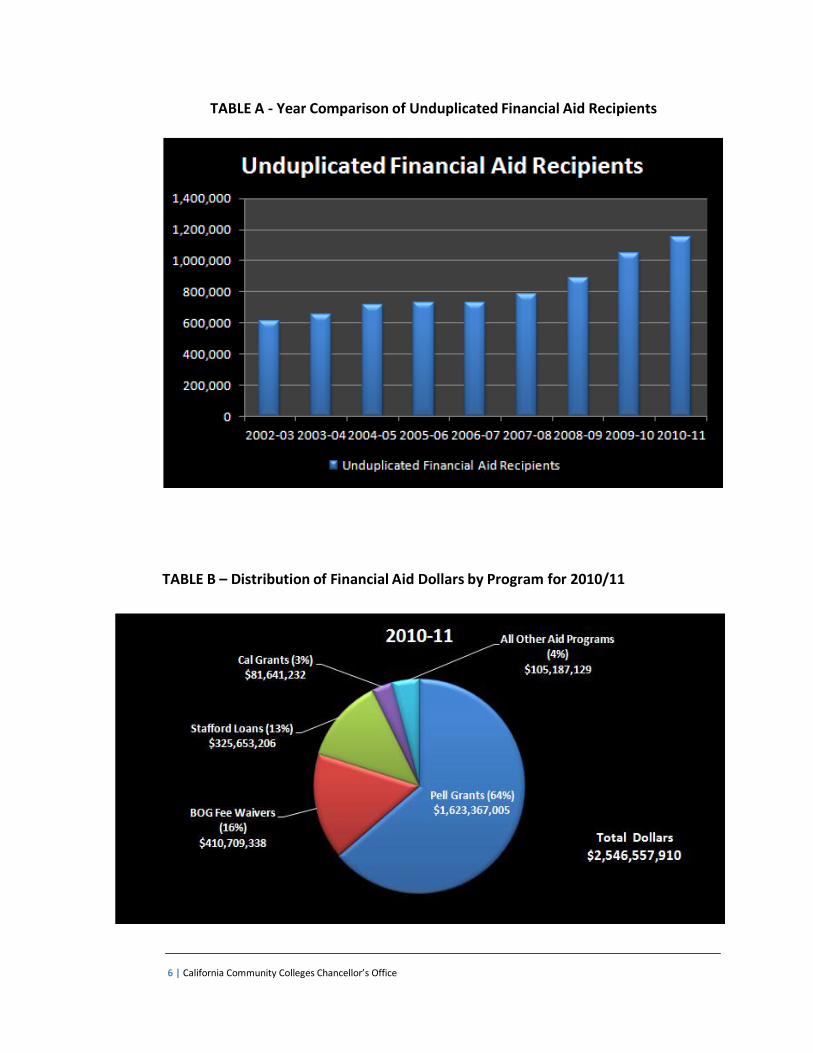
The BOG Fee Waiver and Pell Grant programs account for 80 percent of all award dollars. Table C, below, illustrates the growth in annual recipients of these two award sources.
TABLE C –Comparison of BOG Fee Waivers and Pell Grants
8 | California Community Colleges Chancellor’s Office
The BOG Fee Waiver program, which serves the largest number of students, has grown substantially over the past eight years. In 2002/03, 597,000 students received $102.7 million in BOG Fee Waivers. In 2010/11, those figures grew more than 89 percent over the comparison year, with over 1,130,000 students receiving more than $410 million in BOG Fee Waivers. Virtually all of the growth is attributable to the following factors:
Fees have gone from $11 per unit in 2002-03 to $46 per unit in 2012-13, more
than quadrupling the cost of the program based solely on fee level.
The repeated and significant increase in CCC fee levels has driven an increase in
the demand for fee waiver and a greater need for them.
The economic recession and unemployment in recent years has increased
demand for financial aid and fueled greater eligibility for those applicants due
to lower income and assets.
Changes in the last fiveyears to the federal needs analysis system has made
more students eligible for more aid.
Enhanced technology has streamlined the application and award process.
Awareness of the availability of financial aid in general, and the BOG fee waiver
in particular has increased as a result of increased outreach. As a result this
has also resulted in increased participation.
The Pell Grant program continues to be the largest single source of financial aid award dollars. In 2002/03, 240,000 students received $534 million in Pell Grants. In 2010/11, over 490,000 students received over $1.6 billion in Pell Grants, representing a 105 percent increase in Pell Grant recipients and a 184 percent increase in Pell Grant dollars.
Student Financial Aid Programs 2010/11 | 9
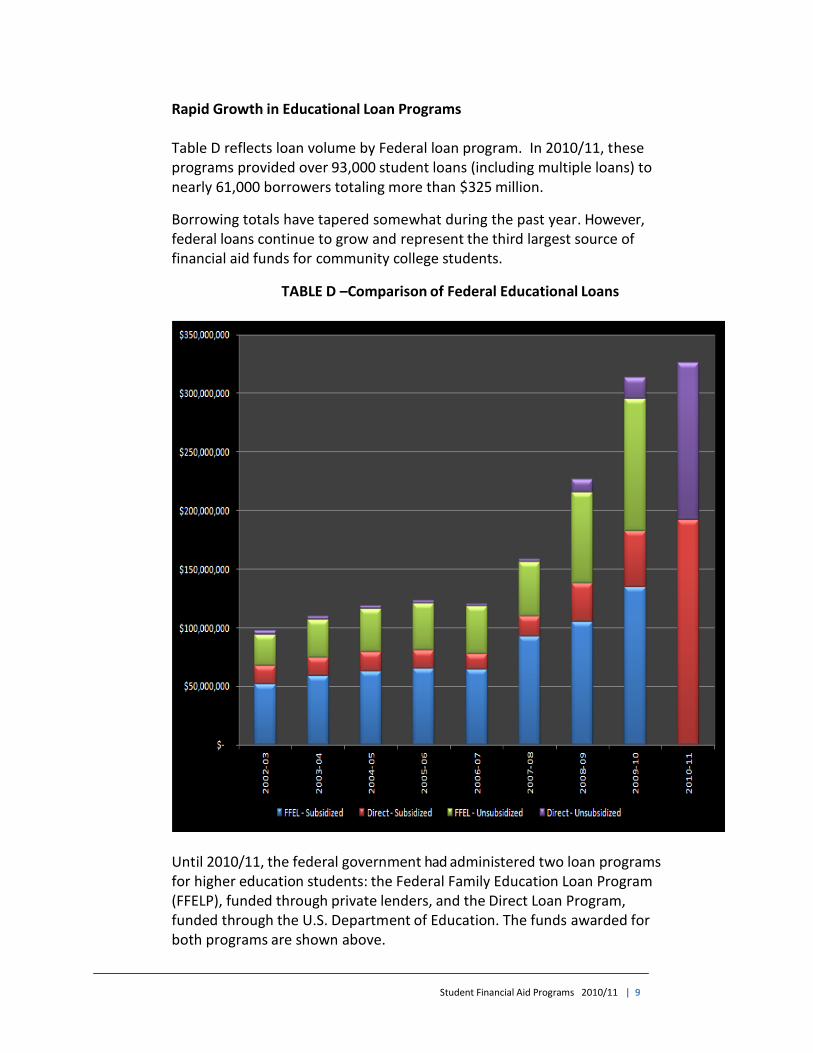
Rapid Growth in Educational Loan Programs
Table D reflects loan volume by Federal loan program. In 2010/11, these programs provided over 93,000 student loans (including multiple loans) to nearly 61,000 borrowers totaling more than $325 million.
Borrowing totals have tapered somewhat during the past year. However, federal loans continue to grow and represent the third largest source of financial aid funds for community college students.
TABLE D –Comparison of Federal Educational Loans
Until 2010/11, the federal government had administered two loan programs for higher education students: the Federal Family Education Loan Program (FFELP), funded through private lenders, and the Direct Loan Program, funded through the U.S. Department of Education. The funds awarded for both programs are shown above.
10 | California Community Colleges Chancellor’s Office
Beginning with the 2010/11 year, the federal government required that all student loans be processed through the Direct Loan Program. The change to all Direct Loans accounts for the dramatic shifts seen in the above table. Community college students take out relatively few educational loans compared to students in other higher education segments. However, the amount they borrowed in 2010/11 accounts for 13 percent of all financial aid dollars and continues to be an important resource for community college students. Cal Grants
Cal Grants for community college students rose slightly in 2010/11, from 67,211 awards to 70,742 awards. Generally speaking, however, the number of recipients and the amount of funding for community college students has remained relatively static since the introduction of the BFAP-SFAA capacity funding. Because of program funding limitations, Cal Grants are limited to only a fraction of eligible applicants. The larger growth in the Pell, BOG Fee Waiver, and Stafford Loan programs has reduced the relative proportion of Cal Grant funds for community colleges to less than half that of 2002/03. As a result, Cal Grants represents only 3 percent of financial aid funds disbursed to community college students.
As Table-B shows, other programs, particularly Pell Grants and BOG Fee Waivers provide the bulk of financial aid funds for community college students.
Student Financial Aid Programs 2010/11 | 11
Financial Aid Administrative Funding Sources
Local discretionary funds and BFAP-SFAA funds are the two primary sources for administering community college financial aid programs. Local discretionary funds are budgeted by individual community colleges and community college districts from their general funds apportionment. The BFAP-SFAA funds are categorical funds and are budgeted directly by the state to administer the BOG Fee Waiver program and promote student financial aid participation. The 2003/04 legislature augmented the BFAP-SFAA funding by providing additional capacity funds to enhance the community colleges’ ability to provide financial aid outreach and support services. The additional funds were intended to ensure that the 2003/04 fee increase did not discourage students from attending community colleges.
Community college administrative expenditures for financial aid programs and services have risen from $97.7 million in 2003/04 to $114 million (16.1 percent) in 2010/11. Total expenditures for 2003/04 were comprised of $42.4 million in BFAP-SFAA funds and $55.3 million in local discretionary funds. The BFAP-SFAA funding expenditures have since grown by $3.2 million for a total of $45.6 million. Local expenditures have grown by $13.1 million for a total of $68.4 million.
Because the funds from local districts and colleges have grown at a greater rate than BFAP-SFAA funds, local districts and colleges have had to assume an increasingly larger share of financial aid administrative costs. As a result, local colleges and districts have had to absorb 80 percent of the increased costs for administering the financial aid programs.
Federal administrative funds consist of a Pell Grant administrative allowance and a Federal Campus-Based Programs allowance, which are considered part of local discretionary funds. Due to the enormous increase in Pell awards, the Pell Grant administrative allowance of $5 per recipient has grown from $1.2 million in 2003/04 to $2.5 million in 2010/11. However, this allowance
covers only 2.2 percent of the 2010/11 administrative expenditures.
Federal Campus-Based Programs (Supplemental Educational Opportunity Grant, Federal Work Study, and Perkins Loans) provide a 3 percent administrative allowance totaling $1.5 million for 2010/11. In summary, the combined federal program allowances provide only 3.5 percent of all financial aid administrative funds.
Cal Grant programs provide no program administrative funds.
12 | California Community Colleges Chancellor’s Office
Accurately Comparing Financial Aid Participation Rates
Because financial aid participation is such a critical factor in evaluating the effectiveness of the BFAP-SFAA funding, it is important that colleges accurately measure and compare program participation rates. However, it is difficult to compare California Community College performance data with performance data from other systems. Unlike other segments of higher education, the community colleges serve as open enrollment institutions, rendering comparisons to other segments and our defined service populations incongruous.
In developing initial performance measures, the Chancellor’s Office designated credit enrollment head count as the measure (denominator) of potentially eligible populations attending a community college that might be eligible to apply for and receive one or more types of financial aid. This was decided because:
Enrollment fees are only assessed on credit coursework. Students are eligible
to have their fees waived through the BOG Fee Waiver program.
For Pell and other federal programs and the Cal Grant program, in nearly all cases, a student must be in an eligible credit-enrollment program.
The structure and reporting cycle of the Chancellor’s Office data system do not lend themselves well to direct comparisons. The internal measures for both enrollment and financial aid program participation include aggregated annual data for all terms in an academic year, which may include any of the following:
Summer as a “leading” term in an academic year.*
Fall term (all semester and quarter schools).
Winter term (for quarters and semester inter-sessions)
Spring term (all semester and quarter schools).
Summer as a “trailing” term in an academic year.*
*for most financial aid programs, colleges have the option of using the summer term as a leading term or trailing term
Student Financial Aid Programs 2010/11 | 13
Allocation Formula for BFAP-SFAA
Each year the Budget Act establishes the BFAP-SFAA funding level. The $34.2 million BFAP-SFAA funding level established in 2003/04 has remained unchanged to date. The funds must be used to expand local community college financial aid participation, outreach, and administrative capacity.
The Chancellor’s Office distributes the $34.2 million BFAP-SFAA funds in accordance with the budget guidelines by providing each college with a minimum allocation of $50,000. This ensures that small or newly established colleges are fairly funded. Each of the 112 colleges and one college district were initially allotted a minimum of $50,000 for a total $5.65 million. The remaining $28.55 million was distributed on the basis of a "fair share" formula using two equally-weighted factors:
Each college’s full-time equivalent student (FTES) as a percentage of
total system FTES.
Each college’s BOG Fee Waiver recipients as a percentage of total system BOG Fee Waiver recipients.
All of these funds are intended for local expenditure at the designated local colleges and are subject to the categorical restrictions identified in the Budget Act provisional language. The Budget Act distributes the remaining $2.8 million to the “I Can Afford College” campaign.
Local Maintenance of Effort Requirements
The 2010/11 Budget Act states: “Funds allocated to a community college district for financial aid personnel, outreach, determination of financial need, and delivery of student financial aid services shall supplement, and shall not supplant, the level of funds allocated for the administration of student financial aid programs during the 2001-02 or 2006/07 fiscal year, whichever is greater.” In implementing this provision, the Chancellor’s Office has established a maintenance of effort (MOE) requirement for each college. Any college reporting non-compliance with the MOE requirements is subject to a fiscal penalty. Colleges wishing to appeal these penalties must provide a detailed explanation of the circumstances and a corrective action plan to rectify the local funding MOE shortfall.
14 | California Community Colleges Chancellor’s Office
How Colleges Have Invested Funds to Increase Participation
Identifying Target Populations and Designing Strategies
The BFAP-SFAA budget provisions require community colleges to develop strategies designed to improve program participation and ensure that lower income and underserved students take advantage of financial aid programs available to them. The Chancellor’s Office encourages financial aid officers to identify ways to use the BFAP-SFAA capacity funds to target and assist local populations who are not served or who are underserved. Strategies focus on identifying needy students, assisting in the application process, increasing financial aid office capacity to administer complex student aid programs, and awarding and disbursing student aid funds.
Each year, community colleges submit BFAP-SFAA spending reports to the Chancellor’s Office detailing strategies and expenditures for locally focused student services. The reports show that almost all of these expenditures are related to staffing costs, including direct costs such as salaries and benefits, and indirect costs such as recruiting, training, and equipment purchases.
Annual categorical funding reports submitted by colleges show:
Almost 96 percent of BFAP-SFAA funds are used for expenses associated with
staffing. In 2003/04, 83 percent of the funds were used for staffing expenses.
Without a Cost of Living Adjustment (COLA) or growth, the BFAP-SFAA funding has not kept pace with the increases in staff salary and benefit costs. As a result, colleges are now paying more for 13 percent fewer staff than they were in 2003/04. These figures, combined with the massive growth in the number of financial aid applicants and recipients, show that a decreasing number of financial aid staff are serving more students.
Only 4 percent of BFAP-SFAA funds are left to cover expenses related to
outreach and in-reach activities, such as on-campus and off-campus community events, translation services, publications, and printing. Consequently, many local districts and colleges are covering nearly all of the non-staff-related costs.
During the initial years of the BFAP-SFAA capacity funding, many colleges were able to utilize a larger portion of the funds to initiate and expand financial aid recruitment efforts. However, as staffing positions have become more costly to maintain, a greater portion of the capacity funds must be used to keep pace with processing and operational demands of the growing pool of applicants and recipients.
Student Financial Aid Programs 2010/11 | 15
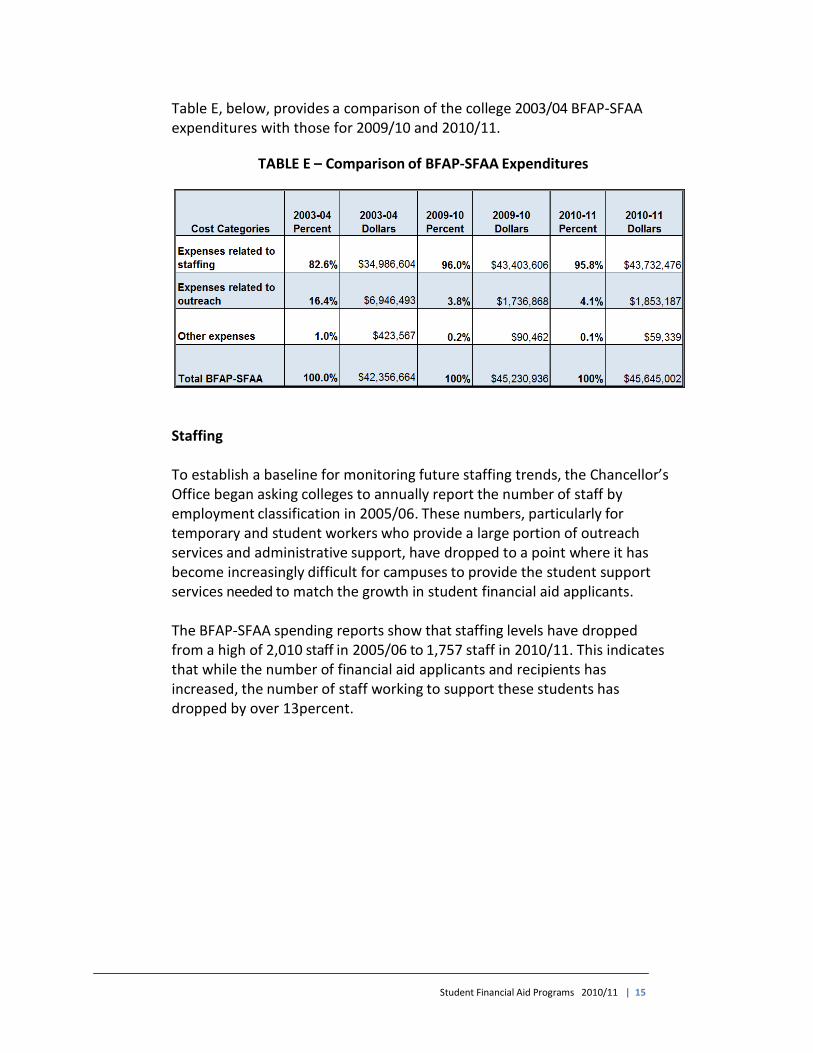
Table E, below, provides a comparison of the college 2003/04 BFAP-SFAA expenditures with those for 2009/10 and 2010/11.
TABLE E – Comparison of BFAP-SFAA Expenditures
Staffing
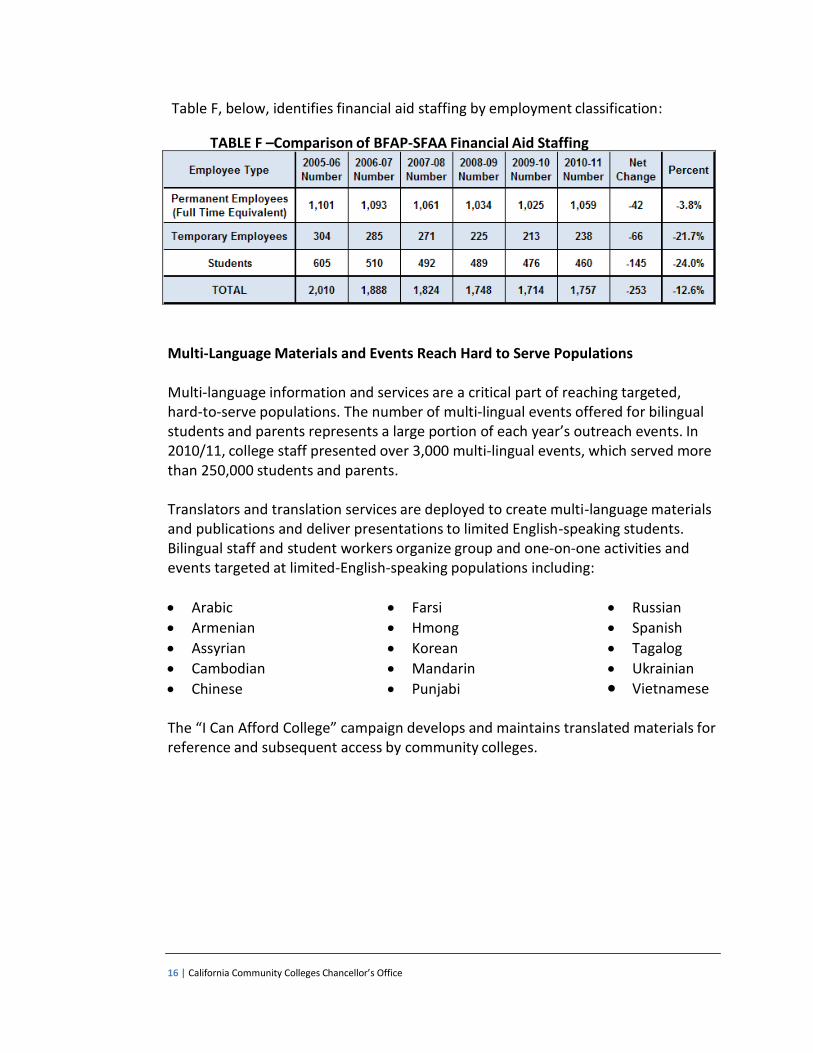
To establish a baseline for monitoring future staffing trends, the Chancellor’s Office began asking colleges to annually report the number of staff by employment classification in 2005/06. These numbers, particularly for temporary and student workers who provide a large portion of outreach services and administrative support, have dropped to a point where it has become increasingly difficult for campuses to provide the student support services needed to match the growth in student financial aid applicants.
The BFAP-SFAA spending reports show that staffing levels have dropped from a high of 2,010 staff in 2005/06 to 1,757 staff in 2010/11. This indicates that while the number of financial aid applicants and recipients has increased, the number of staff working to support these students has dropped by over 13percent.
16 | California Community Colleges Chancellor’s Office
Table F, below, identifies financial aid staffing by employment classification:
TABLE F –Comparison of BFAP-SFAA Financial Aid Staffing
Multi-Language Materials and Events Reach Hard to Serve Populations
Multi-language information and services are a critical part of reaching targeted, hard-to-serve populations. The number of multi-lingual events offered for bilingual students and parents represents a large portion of each year’s outreach events. In 2010/11, college staff presented over 3,000 multi-lingual events, which served more than 250,000 students and parents.
Translators and translation services are deployed to create multi-language materials and publications and deliver presentations to limited English-speaking students. Bilingual staff and student workers organize group and one-on-one activities and events targeted at limited-English-speaking populations including:
Arabic
Armenian
Assyrian
Cambodian
Chinese
Farsi
Hmong
Korean
Mandarin
Punjabi
Russian
Spanish
Tagalog
Ukrainian
Vietnamese
The “I Can Afford College” campaign develops and maintains translated materials for reference and subsequent access by community colleges.
Student Financial Aid Programs 2010/11 | 17
Targeted Outreach Aimed at Low-income and Disadvantaged Students
In accordance with the Budget Act language, community colleges use the BFAP-SFAA capacity funding to execute a number of strategies to identify and better serve low-income and disadvantaged student populations in their local communities. To supplement local community college efforts in identifying and serving students, the “I Can Afford College” campaign specifically engages targeted populations through strategic advertising, marketing, media relations, and outreach efforts.
Mentoring Relationships with High Schools to Increase Awareness of Financial Aid
College financial aid offices maintain regular contact with local high school teachers, counselors, and advisers to ensure they are informed about college student financial aid programs, services, and processes. Most financial aid offices provide in-service training and workshops for high school staff to promote their understanding of campus financial aid programs.
Expanded Outreach Targets Underserved High School Students and Parents
Financial aid and outreach staff regularly participate in college and high school financial aid outreach training events throughout the state. The “I Can Afford College” campaign partners with the California Student Aid Commission “California Cash for College” program to increase awareness of the March 2 Cal Grant Entitlement deadline, and to identify “priority high schools” to better target low-income and disadvantaged students. The outreach events also include workshops and related activities that target alternative/continuation high school students and parents.
Because the March 2 Cal Grant deadline is so highly publicized, and because the Cal Grant program uses the Free Application for Federal Student Aid (FAFSA), many students are under the mistaken impression that they cannot apply for student financial aid beyond March 2. Community college students who miss this deadline have a second opportunity to apply for a Cal Grant by Sept. 2 and can apply to all federal financial aid programs throughout the academic year for which they submit a FAFSA. To ensure that these students understand that they can still apply for financial aid after March 2, community colleges participate in a spring outreach effort known as Financial Aid Awareness Month. This event is
18 | California Community Colleges Chancellor’s Office
publicized through BFAP-SFAA’s “I Can Afford College” spring media campaign.
In 2010/11, Community colleges provided in-reach and outreach services to more than 12,000 on- and off-campus events. These events served nearly 1.2 million students and parents.
Expanded Community Outreach Connects to Young Adult and Adult Populations
Annual budget act provisional language specifically directs colleges to use their capacity funds to target low-income and disadvantaged students by providing additional staff resources to increase both financial aid participation and access to postsecondary education. Included in colleges’ outreach plans are special outreach efforts to target other populations, such as veterans, foster youth, transfer students, and students who may encounter unique educational access needs. To reach hard-to-serve populations, community colleges partner with community and faith-based organizations and offer FAFSA workshops to local and regional community organizations. In addition, college staff also hosts information stations at shopping centers and community events, while offering pre-developed presentations and collateral materials to local groups and faith-based organizations for presentation and distribution to their constituents. The “I Can Afford College” campaign undertakes marketing and outreach activities throughout the year to encourage both high school and adult populations to attend college and apply for financial aid. Financial aid offices provide materials and one-on-one application assistance in multiple languages to reach limited English speaking populations, including guidance and assistance in 16 different languages.
In support of foster youth outreach efforts, each college has identified a Foster Youth Success Initiative liaison to serve as a point of contact for issues of unique concern and to help them access financial aid and other student and academic support services. Integration of Students Organizations in Outreach and In-Reach Efforts
Student associations and student government play an important role in outreach and in-reach initiatives, including co-hosting events, assisting in creating campus/student awareness, and encouraging participation in student financial aid programs.
Student Financial Aid Programs 2010/11 | 19
Student workers play an even greater role in outreach and in-reach activities and offer many benefits to both the colleges and the students. Student workers provide the colleges with:
Greater staffing flexibility to better serve the needs of prospective financial aid
applicants and recipients.
Additional bilingual resources to assist limited-English-speaking students and families with completion of the FAFSA.
Financial aid staff, who attend classes and help create awareness and encouragement to other students.
Student peer advisers, who offer prospective students a valuable student- based perspective on campus life and campus support systems.
College In-Reach and Service Improvements
College in-reach is an important aspect of efforts to make continuing students aware of the financial aid program and application processes. Many students are eligible for financial aid but are either unaware of its availability or are intimidated by the application and verification processes.
With the help of BFAP-SFAA capacity funds, colleges have been able to distribute posters, announcements, and flyers; set up screens, banners, and kiosks; place ads in college and community newspapers, handbooks, class schedules and catalogs; offer open-house events dedicated to financial aid information and application materials; and go directly into classrooms to inform students of financial programs and services.
Strategies to reach low-income and disadvantaged students include:
Assigning free campus e-mail addresses for all students. This allows
them to send and receive information regarding programs and services.
Setting up dedicated computer labs with trained staff to allow students to check e-mail, enroll in classes, access program information and apply for financial aid.
Posting flyers at on- and off-campus locations to inform students of upcoming FAFSA workshops and financial aid opportunities and deadlines.
20 | California Community Colleges Chancellor’s Office
Conducting specially scheduled financial aid workshops and financial literacy workshop series.
Publishing brochures and materials, some in multiple languages, to help students and parents better understand program benefits and requirements.
Maintaining telephone banks or other electronic communications systems to quickly communicate with students regarding various financial aid matters.
Providing campus-based websites that allow students to learn about campus financial aid programs and financial aid training opportunities.
Providing portals that allow students access to their financial aid files and determine their financial aid application status.
In-Reach to Other On-Campus Support Programs
Another effective way to improve financial aid participation for low-income and disadvantaged students is for financial aid staff to work with other on-campus student services programs, such as EOPS/ CARE, DSPS, CalWORKs, transfer centers, and the Foster Youth Success Initiative. These collaborative relationships allow direct access to targeted special need, and low-income, disadvantaged students.
Some financial aid administrators work with faculty and arrange presentations in their classes to provide information and materials. This is especially beneficial for students who are uncomfortable with asking for assistance, but when given an opportunity to hear directly from staff, will often take the next step and visit the financial aid office.

22 | California Community Colleges Chancellor’s Office
Performance Indicators
Established Benchmark Performance Indicators
Under the provisions of the State Budget Act, the Chancellor’s Office must report the extent to which districts and colleges are successful in increasing the number of students accessing financial aid, particularly Pell Grant awards.
The Chancellor’s Office has identified several primary performance indicators to monitor and measure annual performance resulting from the BFAP-SFAA capacity and participation funding. These include both Pell Grants and BOG Fee Waivers.
The Pell Grant program is a federally funded program that provides financial aid funds directly to community college students. To qualify for Pell Grant assistance, students must be enrolled in an eligible program leading to a degree, certificate or transfer.
Performance indicators include:
The number of annual unduplicated headcount credit enrollment
receiving Pell Grants.
The percent of annual unduplicated headcount credit enrollment receiving Pell Grants.
The dollar value of annual award payments for Pell Grants.
The BOG Fee Waiver program is a state-funded program that waives the enrollment fee for students who have financial need. Performance indicators include:
The number of unduplicated headcount credit enrollment receiving a
BOG Fee Waiver.
The percent of unduplicated headcount credit enrollment receiving a BOG Fee Waiver.
The dollar value of annual award payments for BOG Fee Waivers.
The Chancellor’s Office encourages colleges to establish local performance goals and objectives in support of these statewide performance measures.

Student Financial Aid Programs 2010/11 | 23
California Community Colleges Performance Relative to Benchmarks
Based on established indicators, Tables G and H show systemwide performance.
Table G displays credit enrollment headcounts; the number and dollar value of BOG Fee Waivers and Pell Grants and the combined dollar value all financial aid awards for 2002/03 through 2010/11.
TABLE G – Comparison of BOG Fee Waivers and Pell Grants
1
All aid programs include BOGFW, Pell and all other aid programs
In comparing 2010/11 data to the 2002/03 base year data, this table indicates:
Credit enrollments have declined slightly for the second consecutive year.
BOG Fee Waivers have increased by 89.3 percent.
Pell Grants have increased by 104.9 percent.
Pell award dollars have increased by 204.2 percent.
Overall financial aid dollars for all programs have increased by 184.4 percent.
24 | California Community Colleges Chancellor’s Office
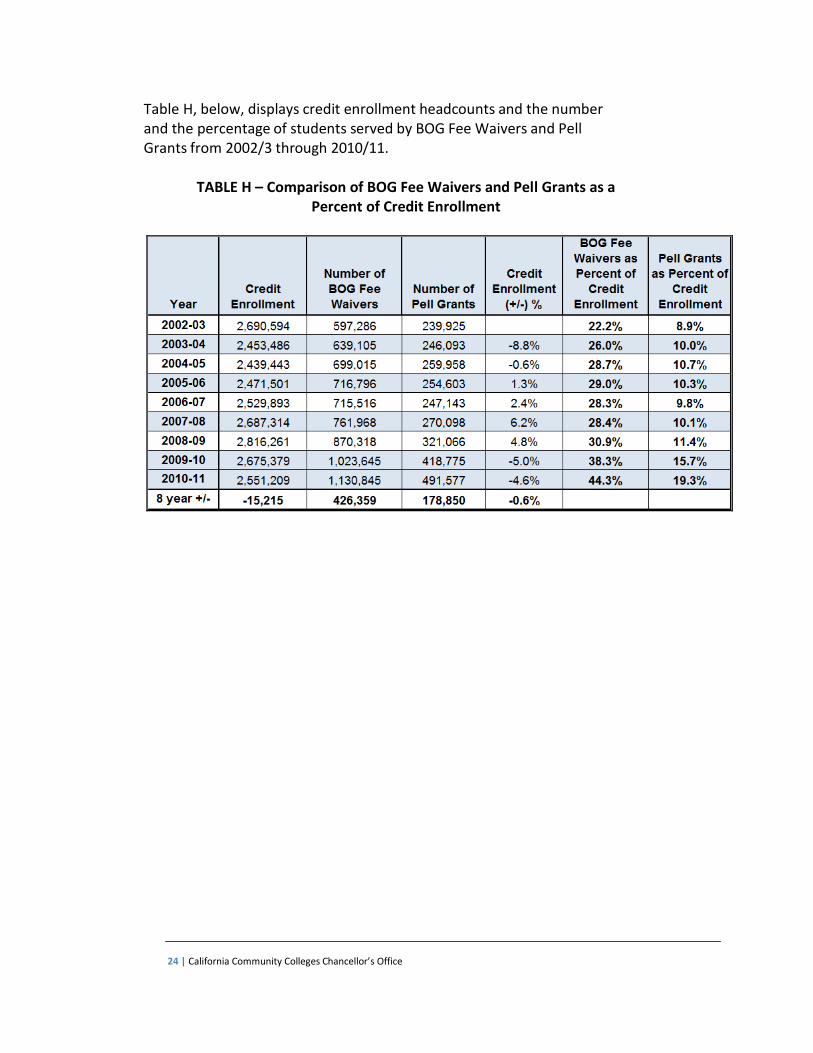
Table H, below, displays credit enrollment headcounts and the number and the percentage of students served by BOG Fee Waivers and Pell Grants from 2002/3 through 2010/11.
TABLE H – Comparison of BOG Fee Waivers and Pell Grants as a
Percent of Credit Enrollment
Student Financial Aid Programs 2010/11 | 25
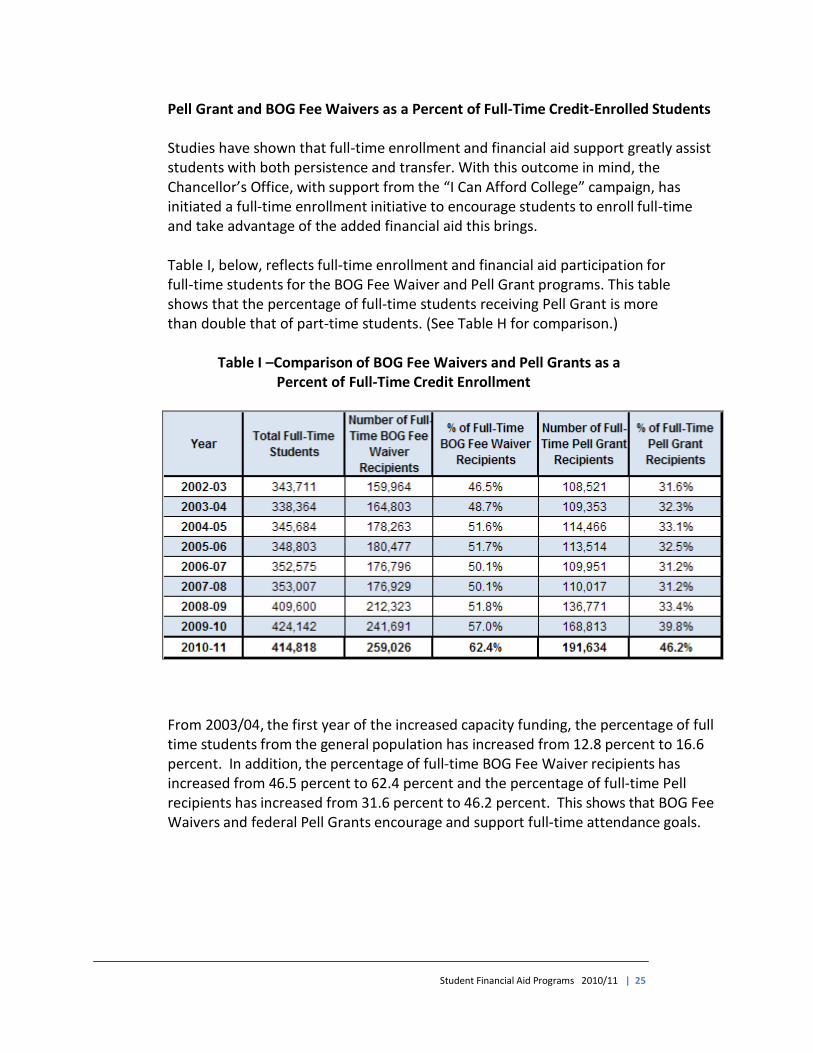
Pell Grant and BOG Fee Waivers as a Percent of Full-Time Credit-Enrolled Students
Studies have shown that full-time enrollment and financial aid support greatly assist students with both persistence and transfer. With this outcome in mind, the Chancellor’s Office, with support from the “I Can Afford College” campaign, has initiated a full-time enrollment initiative to encourage students to enroll full-time and take advantage of the added financial aid this brings.
Table I, below, reflects full-time enrollment and financial aid participation for full-time students for the BOG Fee Waiver and Pell Grant programs. This table shows that the percentage of full-time students receiving Pell Grant is more than double that of part-time students. (See Table H for comparison.)
Table I –Comparison of BOG Fee Waivers and Pell Grants as a
Percent of Full-Time Credit Enrollment
From 2003/04, the first year of the increased capacity funding, the percentage of full time students from the general population has increased from 12.8 percent to 16.6 percent. In addition, the percentage of full-time BOG Fee Waiver recipients has increased from 46.5 percent to 62.4 percent and the percentage of full-time Pell recipients has increased from 31.6 percent to 46.2 percent. This shows that BOG Fee Waivers and federal Pell Grants encourage and support full-time attendance goals.
26 | California Community Colleges Chancellor’s Office
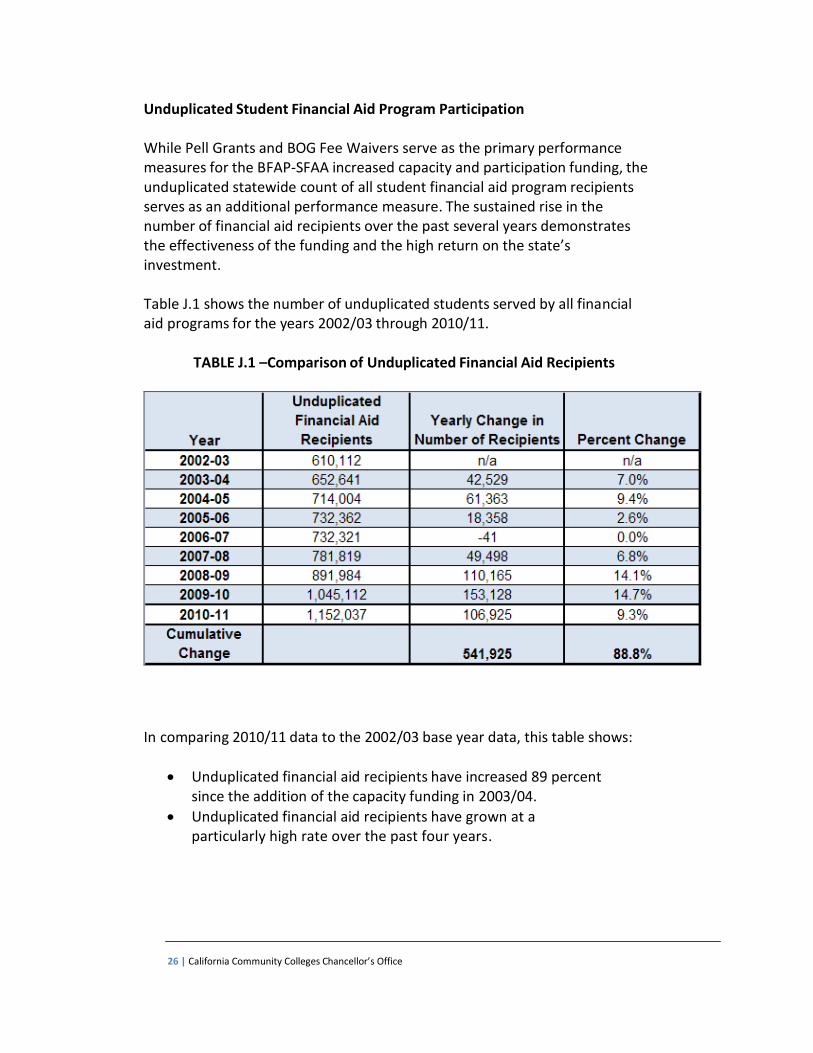
Unduplicated Student Financial Aid Program Participation
While Pell Grants and BOG Fee Waivers serve as the primary performance measures for the BFAP-SFAA increased capacity and participation funding, the unduplicated statewide count of all student financial aid program recipients serves as an additional performance measure. The sustained rise in the number of financial aid recipients over the past several years demonstrates the effectiveness of the funding and the high return on the state’s investment.
Table J.1 shows the number of unduplicated students served by all financial aid programs for the years 2002/03 through 2010/11.
TABLE J.1 –Comparison of Unduplicated Financial Aid Recipients
In comparing 2010/11 data to the 2002/03 base year data, this table shows:
Unduplicated financial aid recipients have increased 89 percent since the addition of the capacity funding in 2003/04.
Unduplicated financial aid recipients have grown at a particularly high rate over the past four years.

Student Financial Aid Programs 2010/11 | 27
Table J.2 compares the number of unduplicated financial aid recipients by selected age groups for 2002/03, 2009/10 and 2010/11.
TABLE J.2 – Comparison of Age for Unduplicated Financial Aid Recipients
for 2009/10 and 2010/11 to the Base Year
Table J.3 reflects the ethnic distribution of unduplicated financial aid recipients for 2002/03, 2009/10, and 2010/11.
TABLE J.3 – Comparison of Ethnicity for Unduplicated 2009/10 and 2010/11
Financial Aid Recipients to the Base Year
In comparison to 2002/03 base year data, this table shows:
Targeted Hispanics and African Americans have shown enormous
growth in student financial aid recipients since 2002/03.* * Hispanics and African Americans are the only ethnic groups whose
proportion of financial aid (FA) recipients exceed their proportion of enrollments. Whites represent 32.2 percent of enrollments but only 25.6 percent of FA recipients. Hispanics represent 33.8 percent of enrollments but 39.4 percent of FA recipients. African Americans represent only 7.6 percent of enrollments but 12.6 percent of FA recipients.
28 | California Community Colleges Chancellor’s Office
The greater growth among Hispanic and African American student financial aid recipients demonstrates the success of the BFAP-SFAA in-reach and outreach efforts in targeting low-income and disadvantaged students.
2010/11 College Performance Relative to 2002/03 Benchmarks
This report summarizes college level performance using both credit enrollment and financial aid participation rates for 2002/03 through 2010/11.
Participation Rates:
111 colleges, or 99 percent, reported growth in the number of BOG Fee Waiver recipients from 2002/03 through 2010/11.
All 112 colleges reported growth in the number of Pell Grants from 2002/03 through 2010/11.
Participation as a Percent of Credit Enrollment:
All 112 colleges have reported growth in the percentage of credit
enrollment served with Pell Grant awards from 2002/03 through 2010/11.*
All 112 colleges have reported growth in the percentage of credit
enrollment served with BOG Fee Waivers from 2002/03 through 2010/11.*
* For newer colleges that began reporting first-time figures after the 2002/03 base year, growth is measured by comparing the 2010/11 enrollment and financial aid figures with the colleges’ first-year figures
Student Financial Aid Programs 2010/11 | 29
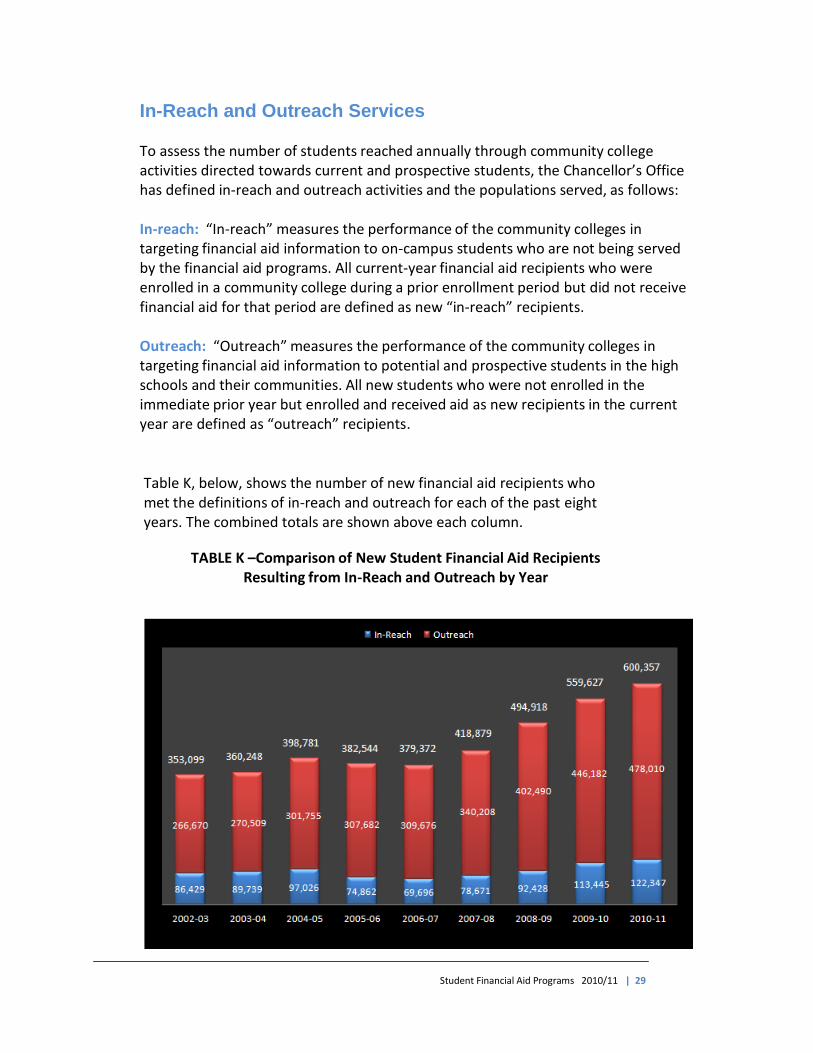
In-Reach and Outreach Services
To assess the number of students reached annually through community college activities directed towards current and prospective students, the Chancellor’s Office has defined in-reach and outreach activities and the populations served, as follows:
In-reach: “In-reach” measures the performance of the community colleges in targeting financial aid information to on-campus students who are not being served by the financial aid programs. All current-year financial aid recipients who were enrolled in a community college during a prior enrollment period but did not receive financial aid for that period are defined as new “in-reach” recipients.
Outreach: “Outreach” measures the performance of the community colleges in targeting financial aid information to potential and prospective students in the high schools and their communities. All new students who were not enrolled in the immediate prior year but enrolled and received aid as new recipients in the current year are defined as “outreach” recipients.
Table K, below, shows the number of new financial aid recipients who met the definitions of in-reach and outreach for each of the past eight years. The combined totals are shown above each column.
TABLE K –Comparison of New Student Financial Aid Recipients
Resulting from In-Reach and Outreach by Year
30 | California Community Colleges Chancellor’s Office
Demographic Indicators of New Recipients from In-Reach and Outreach Activities
The resources provided through the increased SFAA program capacity and participation funding and the “I Can Afford College” campaign are focused on alleviating impacts of enrollment fees on both current and prospective students, especially those from low-income and disadvantaged populations. These resources have become more critical as fees have continued to rise.
In-Reach and Outreach Activities
The following tables display the gender, age, and ethnic distribution of new financial aid recipients reached through college in-reach and outreach efforts. These data points provide evidence that the state’s investment in funding financial aid administration has enabled the colleges to make gains across all populations.
Student Financial Aid Programs 2010/11 | 31
IN-REACH ACTIVITIES
Gender, Age and Ethnicity
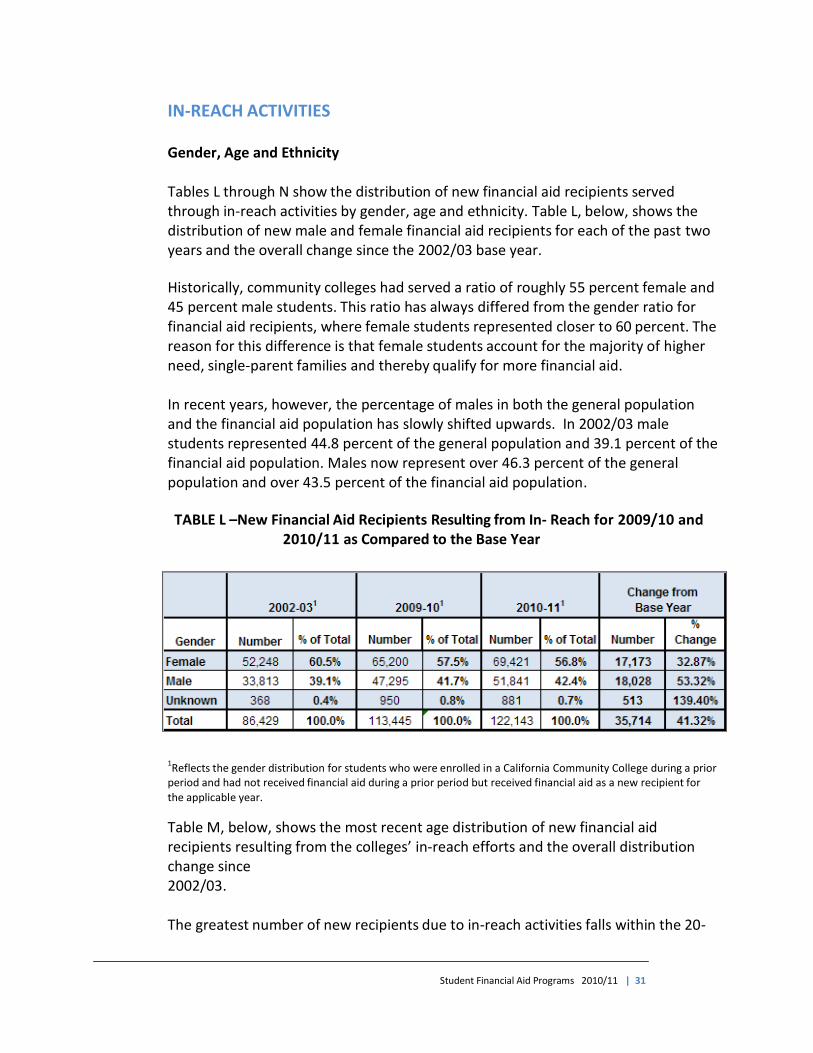
Tables L through N show the distribution of new financial aid recipients served through in-reach activities by gender, age and ethnicity. Table L, below, shows the distribution of new male and female financial aid recipients for each of the past two years and the overall change since the 2002/03 base year.
Historically, community colleges had served a ratio of roughly 55 percent female and 45 percent male students. This ratio has always differed from the gender ratio for financial aid recipients, where female students represented closer to 60 percent. The reason for this difference is that female students account for the majority of higher need, single-parent families and thereby qualify for more financial aid. In recent years, however, the percentage of males in both the general population and the financial aid population has slowly shifted upwards. In 2002/03 male students represented 44.8 percent of the general population and 39.1 percent of the financial aid population. Males now represent over 46.3 percent of the general population and over 43.5 percent of the financial aid population.
TABLE L –New Financial Aid Recipients Resulting from In- Reach for 2009/10 and
2010/11 as Compared to the Base Year
1Reflects the gender distribution for students who were enrolled in a California Community College during a prior
period and had not received financial aid during a prior period but received financial aid as a new recipient for the applicable year.
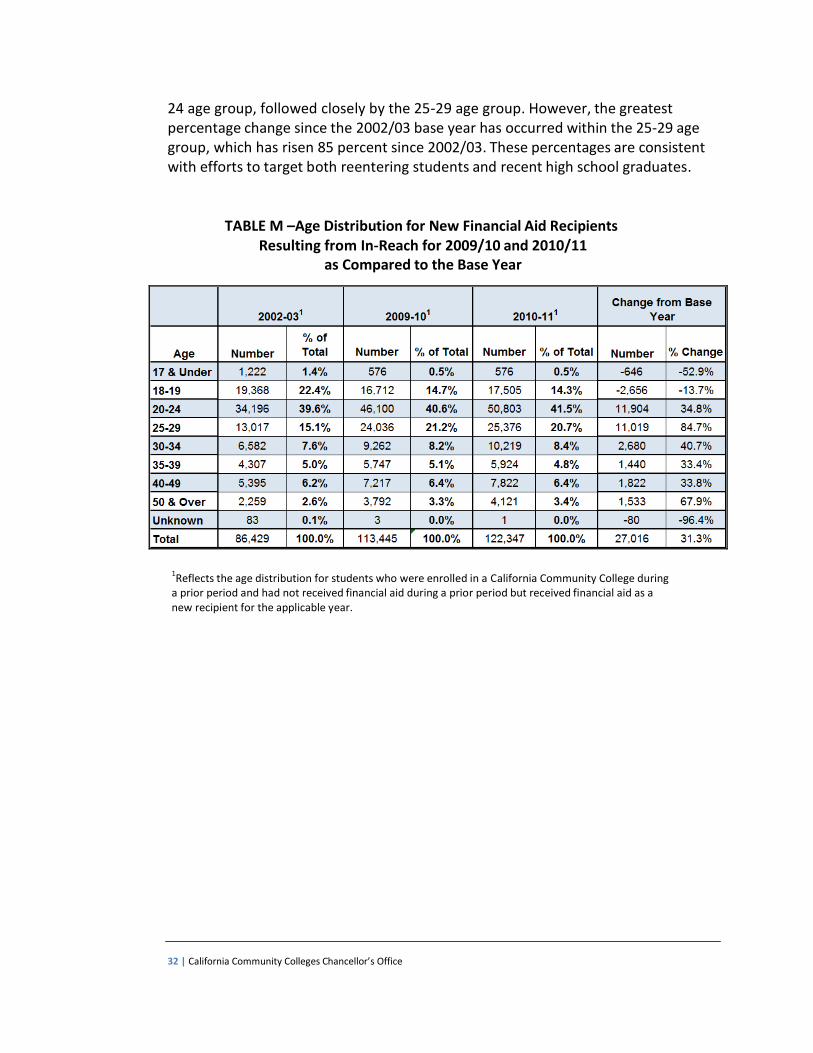
Table M, below, shows the most recent age distribution of new financial aid recipients resulting from the colleges’ in-reach efforts and the overall distribution change since 2002/03.
The greatest number of new recipients due to in-reach activities falls within the 20-
32 | California Community Colleges Chancellor’s Office
24 age group, followed closely by the 25-29 age group. However, the greatest percentage change since the 2002/03 base year has occurred within the 25-29 age group, which has risen 85 percent since 2002/03. These percentages are consistent with efforts to target both reentering students and recent high school graduates.
TABLE M –Age Distribution for New Financial Aid Recipients Resulting from In-Reach for 2009/10 and 2010/11
as Compared to the Base Year
1Reflects the age distribution for students who were enrolled in a California Community College during
a prior period and had not received financial aid during a prior period but received financial aid as a new recipient for the applicable year.
Student Financial Aid Programs 2010/11 | 33
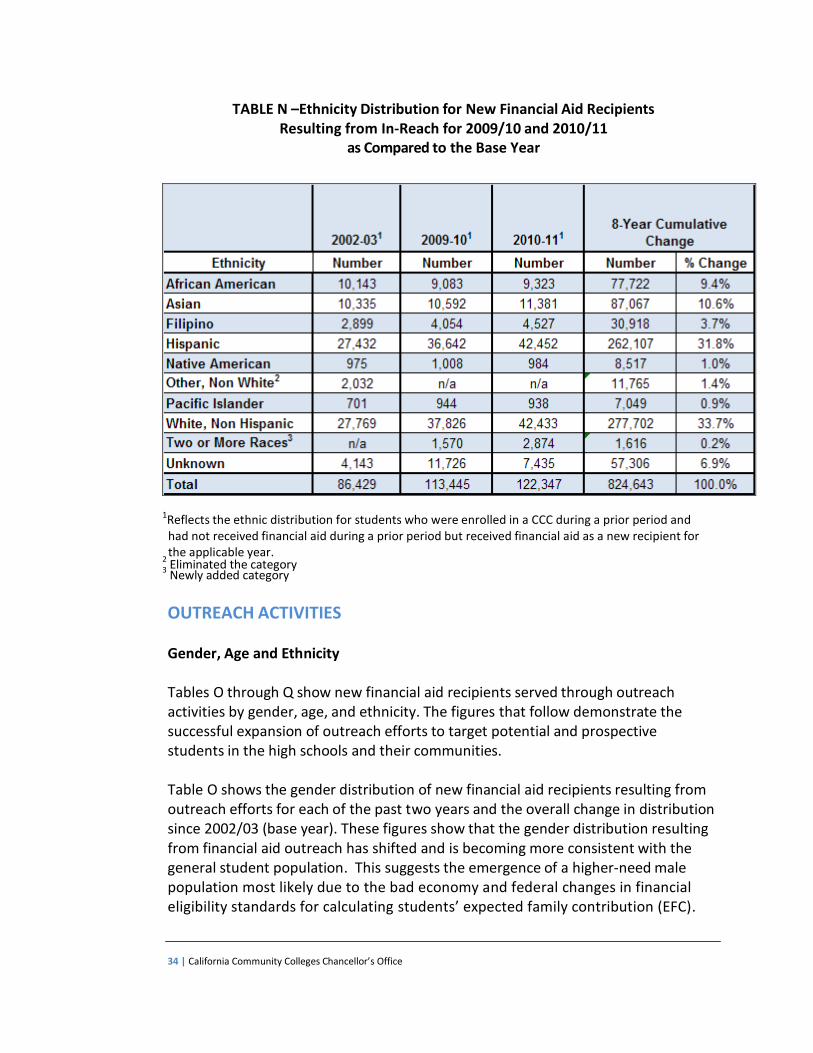
Table N, next page, shows the ethnic distribution of new financial aid recipients served through in-reach efforts for each of the past two years and the cumulative change in the ethnic distribution over the past eight years. The overall distribution of new financial aid recipients through in-reach efforts is relatively consistent with the ethnic distribution within students already attending community college campuses. For example, Hispanic students represent 33.8 percent of 2010/11 enrollments and 34.7 percent of new financial aid recipients through in-reach. African American students represent 7.6 percent of enrolled community college students and 7.6 percent of new financial aid recipients through in-reach. The four largest ethnic categories of financial aid recipients served through in-reach efforts are also the four largest ethnic categories in the total enrollment population:
African American Asian Hispanic White
34 | California Community Colleges Chancellor’s Office
TABLE N –Ethnicity Distribution for New Financial Aid Recipients Resulting from In-Reach for 2009/10 and 2010/11
as Compared to the Base Year
1Reflects the ethnic distribution for students who were enrolled in a CCC during a prior period and had not received financial aid during a prior period but received financial aid as a new recipient for the applicable year.
2 Eliminated the category 3 Newly added category
OUTREACH ACTIVITIES Gender, Age and Ethnicity
Tables O through Q show new financial aid recipients served through outreach activities by gender, age, and ethnicity. The figures that follow demonstrate the successful expansion of outreach efforts to target potential and prospective students in the high schools and their communities.
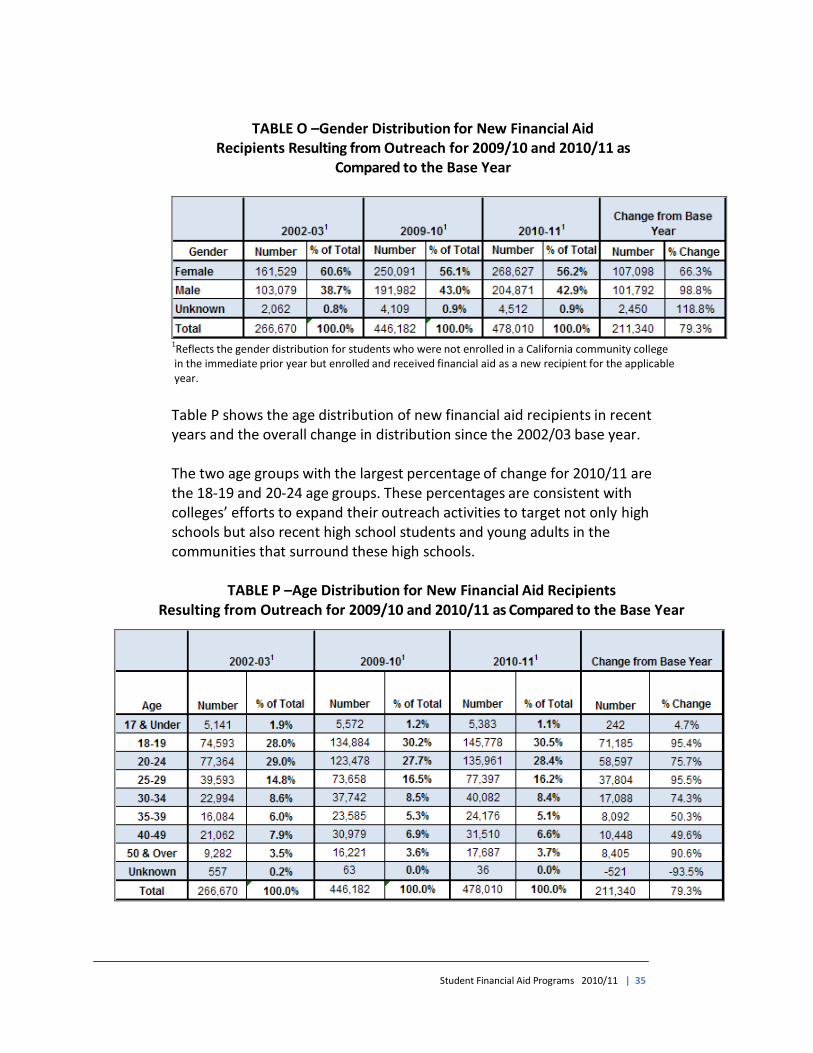
Table O shows the gender distribution of new financial aid recipients resulting from outreach efforts for each of the past two years and the overall change in distribution since 2002/03 (base year). These figures show that the gender distribution resulting from financial aid outreach has shifted and is becoming more consistent with the general student population. This suggests the emergence of a higher-need male population most likely due to the bad economy and federal changes in financial eligibility standards for calculating students’ expected family contribution (EFC).
Student Financial Aid Programs 2010/11 | 35
TABLE O –Gender Distribution for New Financial Aid Recipients Resulting from Outreach for 2009/10 and 2010/11 as
Compared to the Base Year
1Reflects the gender distribution for students who were not enrolled in a California community college in the immediate prior year but enrolled and received financial aid as a new recipient for the applicable year.
Table P shows the age distribution of new financial aid recipients in recent years and the overall change in distribution since the 2002/03 base year.
The two age groups with the largest percentage of change for 2010/11 are the 18-19 and 20-24 age groups. These percentages are consistent with colleges’ efforts to expand their outreach activities to target not only high schools but also recent high school students and young adults in the communities that surround these high schools.
TABLE P –Age Distribution for New Financial Aid Recipients
Resulting from Outreach for 2009/10 and 2010/11 as Compared to the Base Year
36 | California Community Colleges Chancellor’s Office
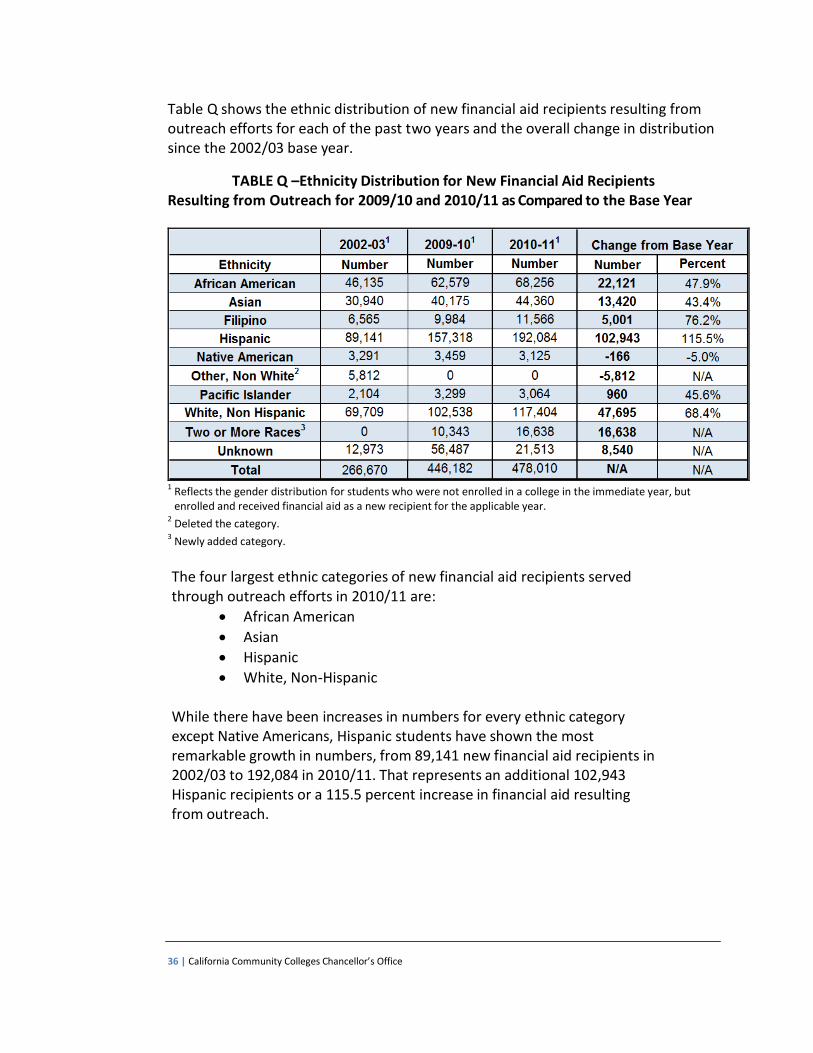
Table Q shows the ethnic distribution of new financial aid recipients resulting from outreach efforts for each of the past two years and the overall change in distribution since the 2002/03 base year.
TABLE Q –Ethnicity Distribution for New Financial Aid Recipients Resulting from Outreach for 2009/10 and 2010/11 as Compared to the Base Year
1 Reflects the gender distribution for students who were not enrolled in a college in the immediate year, but enrolled and received financial aid as a new recipient for the applicable year.
2 Deleted the category.
3 Newly added category.
The four largest ethnic categories of new financial aid recipients served through outreach efforts in 2010/11 are:
African American
Asian
Hispanic
White, Non-Hispanic
While there have been increases in numbers for every ethnic category except Native Americans, Hispanic students have shown the most remarkable growth in numbers, from 89,141 new financial aid recipients in 2002/03 to 192,084 in 2010/11. That represents an additional 102,943 Hispanic recipients or a 115.5 percent increase in financial aid resulting from outreach.
Student Financial Aid Programs 2010/11 | 37
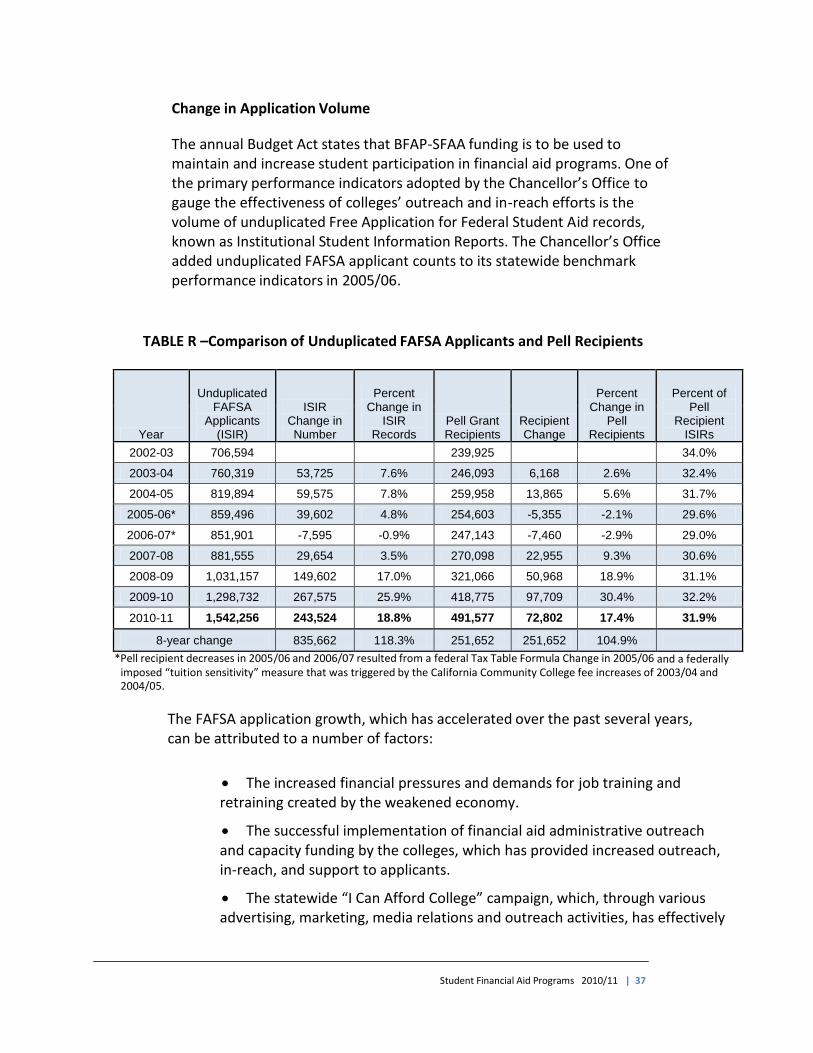
Change in Application Volume
The annual Budget Act states that BFAP-SFAA funding is to be used to maintain and increase student participation in financial aid programs. One of the primary performance indicators adopted by the Chancellor’s Office to gauge the effectiveness of colleges’ outreach and in-reach efforts is the volume of unduplicated Free Application for Federal Student Aid records, known as Institutional Student Information Reports. The Chancellor’s Office added unduplicated FAFSA applicant counts to its statewide benchmark performance indicators in 2005/06.
TABLE R –Comparison of Unduplicated FAFSA Applicants and Pell Recipients
Year
Unduplicated FAFSA
Applicants (ISIR)
ISIR Change in Number
Percent Change in
ISIR Records
Pell Grant Recipients
Recipient Change
Percent Change in
Pell Recipients
Percent of Pell
Recipient ISIRs
2002-03 706,594 239,925 34.0%
2003-04 760,319 53,725 7.6% 246,093 6,168 2.6% 32.4%
2004-05 819,894 59,575 7.8% 259,958 13,865 5.6% 31.7%
2005-06* 859,496 39,602 4.8% 254,603 -5,355 -2.1% 29.6%
2006-07* 851,901 -7,595 -0.9% 247,143 -7,460 -2.9% 29.0%
2007-08 881,555 29,654 3.5% 270,098 22,955 9.3% 30.6%
2008-09 1,031,157 149,602 17.0% 321,066 50,968 18.9% 31.1%
2009-10 1,298,732 267,575 25.9% 418,775 97,709 30.4% 32.2%
2010-11 1,542,256 243,524 18.8% 491,577 72,802 17.4% 31.9%
8-year change 835,662 118.3% 251,652 251,652 104.9%
*Pell recipient decreases in 2005/06 and 2006/07 resulted from a federal Tax Table Formula Change in 2005/06 and a federally imposed “tuition sensitivity” measure that was triggered by the California Community College fee increases of 2003/04 and 2004/05.
The FAFSA application growth, which has accelerated over the past several years, can be attributed to a number of factors:
The increased financial pressures and demands for job training and retraining created by the weakened economy.
The successful implementation of financial aid administrative outreach and capacity funding by the colleges, which has provided increased outreach, in-reach, and support to applicants.
The statewide “I Can Afford College” campaign, which, through various advertising, marketing, media relations and outreach activities, has effectively
38 | California Community Colleges Chancellor’s Office
communicated the message that financial aid is available year round and one-on-one assistance is available for those who need help with the application process.
The successful collaboration with the California Student Aid Commission’s Cal Grant Campaign and “California Cash for College” and other statewide and local outreach efforts, which create awareness of financial aid programs and provide application support for low income and disadvantaged students.
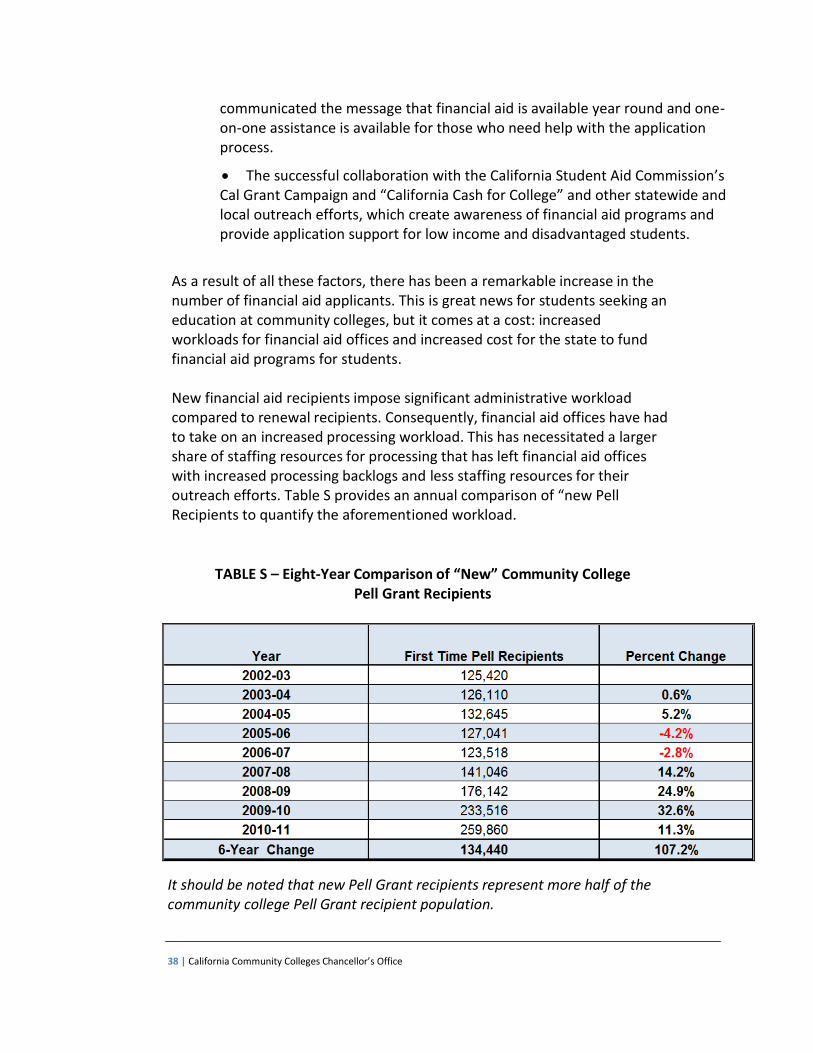
As a result of all these factors, there has been a remarkable increase in the number of financial aid applicants. This is great news for students seeking an education at community colleges, but it comes at a cost: increased workloads for financial aid offices and increased cost for the state to fund financial aid programs for students. New financial aid recipients impose significant administrative workload compared to renewal recipients. Consequently, financial aid offices have had to take on an increased processing workload. This has necessitated a larger share of staffing resources for processing that has left financial aid offices with increased processing backlogs and less staffing resources for their outreach efforts. Table S provides an annual comparison of “new Pell Recipients to quantify the aforementioned workload.
TABLE S – Eight-Year Comparison of “New” Community College Pell Grant Recipients
It should be noted that new Pell Grant recipients represent more half of the community college Pell Grant recipient population.

Student Financial Aid Programs 2010/11 | 39
Enrollment Status – Term and Annual Unit Load Approach
The following analysis attempts to identify students most likely to be enrolled in eligible certificate and degree programs and therefore more likely to be eligible for student financial aid program participation.
For the Pell Grant data, the Chancellor’s Office compares its data with the most recent data provided by the Institute of Educational Sciences National Center for Education Statistics in a report titled, “2007/08 National Postsecondary Student Aid Study.”
Table T displays the number of students and their relative participation rates by term and annual unit load levels. The analysis compares participation rates in:
BOG Fee Waivers and Pell Grants for all students in all terms of the award
year.
BOG Fee Waivers and Pell Grants for students attending at least half time (12 or more units) within an award year and those attending less than full time (less than 12 units) within an award year.
BOG Fee Waivers and Pell Grants for students attending at least half time (6 or more units) in any term(s) within an award year and those attending less than half-time (less than 6 units in each term) in any term within an award year.
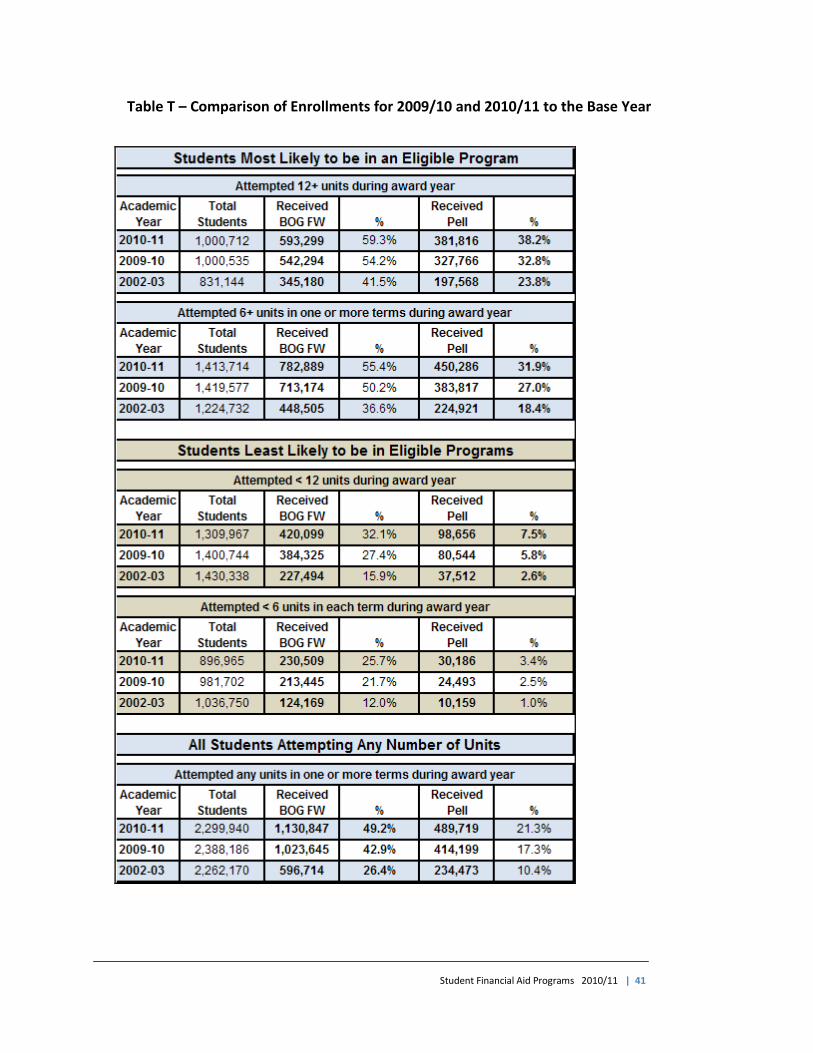
Table T, on page 41, provides an estimate of participation rates by identifying and excluding enrollment status for students whose course patterns would likely indicate non-vocational or recreational studies based (ineligible for federal aid). Table T findings include:
Since 2002/03, the percentage of students with “six or more”
attempted units who received a Pell Grant has increased from 18.4 percent to 31.9 percent and the percentage of students with “12 or more” attempted units who received a Pell Grant has increased from 23.8 percent to 38.2 percent. This figure exceeds the last nationally published figure for public two-year colleges. In its most recent report, in 2007-08, the National Center for Education Statistics showed a 35.1 percent figure for full-time students attending public two-year colleges.
40 | California Community Colleges Chancellor’s Office
Students in the above two categories are those who are most likely to be enrolled in Pell eligible programs such as certificate, degree, or transfer programs, which are required for Pell participation.
Since 2002/03, the percentage of students with “less than 6”
attempted units who received a Pell Grant has increased from 1.0% to 3.4%. The percentage of students with “less than 12” attempted units who received a Pell Grant has increased slightly from 2.6% to 7.5%. Students in these two categories are those who are least likely to be enrolled Pell eligible programs. These students are more likely to be in non-degree/certificate programs or recreational programs and are therefore ineligible for Pell Grants.
The percentage of students with “six or more” attempted units who
received a BOG Fee Waiver has increased from 36.6% to 55.4%. The percentage of students with “12 or more” attempted units who received a BOG Fee Waiver has increased from 41.5% to 59.3%. The students in these two categories are those who are most likely to be enrolled in certificate, degree, or transfer programs.
The percentage of students with “less than six” attempted units who received a BOG Fee Waiver has increased appreciably (from 12.0% to 25.7%) and the percentage of students with “less than 12” attempted units who have received a BOG Fee Waiver also has increased appreciably (from 15.9% to 32.1%). The students in these two categories are those who are least likely to be enrolled in certificate, degree, or transfer programs. They are more likely to be in non- degree/certificate programs or recreational programs.
With 46.2 percent of California Community Colleges full-time attendees receiving Pell Grants, it would appear that this figure greatly exceeds the 32.6 percent national figure for full-time undergraduates published in the National Center for Education Statistics most recent “2007/08 National Postsecondary Student Aid Study. This tells us that in the case of full-time students, California’s community colleges are performing as well or better than other colleges throughout the nation in serving Pell Grant candidates and recipients.
Student Financial Aid Programs 2010/11 | 41
Table T – Comparison of Enrollments for 2009/10 and 2010/11 to the Base Year
42 | California Community Colleges Chancellor’s Office
Challenges Facing CCC Financial Aid Offices in 2010/2011 and Beyond
The amazing success in promoting financial aid outreach and support services has greatly
benefited California’s community college students. In the time since the legislature enacted
the 2003/04 financial aid administrative capacity funding, student applicants and recipients
have doubled and financial aid award dollars have tripled. This success, however, comes at a
cost: increased service demands, increased workloads, and a decreased ability to effectively
serve students. With continued cuts and declining resources, financial aid administrators face
even greater challenges over the next year.
To further complicate this situation, both state and federal entities continue the proliferation
of program policy changes, most of which impose additional program administrative
requirements. The following sections briefly summarize the state and federal policy changes
facing community college financial aid offices. All of these changes should be considered in
assessing any additional workload challenges imposed on community college financial aid
offices.
Federal Considerations
The U.S. Department of Education has changed the cohort default rate formula for the
federal loan program to calculate each college’s cohort default rate on a three-year
default period rather than two. If a student defaults on a student loan within three
years of entering repayment, the loan will be counted in college’s default rate. The
added year will increase college cohort default rates by an estimated 35-50%. The
increased default rates will require greater vigilance in the review process and create
additional workload for community colleges regardless of their default statuses.
Community colleges continue to express concerns regarding higher default rates and
the potential for federal or state sanctions to eventually affect their eligibility to offer
any financial aid to their students. As a result several colleges have voluntarily exited
the federal loan program, typically to avoid sanctions and minimize administrative
burdens.
There have been recent budget proposals and a growing pressure to reduce Pell Grant
funding. The program has grown from a $14 billion dollar a year entitlement program
to an estimated $36 billion program. For most financially qualified students, this
program award has been the cornerstone of their financial aid packaging. Any
reductions in funds will have a direct effect on students’ ability to attend college and
succeed.
Student Financial Aid Programs 2010/11 | 43
o One of the most significant cost saving measures having the greatest impact on
students was the reduction of the 18 semester (full-time equivalent) limitation
on new Pell recipients beginning in 2008/09 to 12 semester (FT equivalent)
limitation for all Pell recipients regardless of when they first received a Pell
grant. Using data available on our community college students we estimate
that as many as 25,000 current students are likely to have exhausted their full
Pell eligibility by the end of the 2011/12 year. In addition, this new limitation
will force students to consider deferring or rationing their Pell Grant while in a
community college to ensure funding when they transfer to four-year colleges,
thus potentially jeopardizing their success in achieving transfer.
o An additional cost saving solution employed for 2012/13 eliminated financial
aid for students who don’t have a High School diploma or its equivalent.
Historically students who have not graduated from high school were able to
establish eligibility for federal financial aid by taking and passing a federally
approved test to demonstrate their “Ability to Benefit” (ATB) from a college
education. As a result of recent federal legislation this eligibility option has now
been eliminated. Unless students already have a high school diploma or a
federally recognized equivalent, they will not be eligible for federal aid. In
2010/11 more than 20,000 CCC students qualified for financial aid under the
ATB provisions. With this option no longer available after July 1, 2012 for newly
enrolled students many of these most disadvantaged students will be barred
from receiving federal aid.
o Another cost saving solution was to reduce the income and asset protection
allowances for 2012/13 applicants under the federal need-analysis
methodology. In addition there was a significant reduction in the income
threshold for automatically eligible applicants (auto-zero EFC). Both of these
changes will result in decreased federal aid eligibility for applicants. Since the
state of California has adopted the federal methodology for determining in part
a student’s eligibility for Cal Grant aid, the reduced allowances will also affect
Cal Grant awards.
o Additional cost savings were realized by temporarily eliminating the federal
student loan grace period interest subsidies for students. This will create
borrower confusion and increased pressure on borrowers to begin repaying
loans as soon as they stop attending at least half-time and will likely result in
increased delinquencies and defaults.
44 | California Community Colleges Chancellor’s Office
o All of these federal changes require financial aid offices to revise their grant
and loan policy guidelines, policies and processes and increase the necessity for
consumer information when advising financial aid applicants and borrowers. An
even greater challenge will come in trying to find creative ways to serve
students who lose or are subject to reduced eligibility to ensure they will have
the resources to successfully complete their education.
Clarified federal Satisfactory Academic Progress (SAP) standards affect how and when
colleges must measure a student’s academic progress for continued federal financial
aid eligibility. This is a labor-intensive process that most colleges used to do once a
year must now be done each term and will result in dramatic increases to students
requiring administrative interventions and students filing appeals for relief from
sanctions.
State and Local Considerations
The implementation of the Student Success Task Force (SSTF) recommendations and
accompanying legislation will require financial aid program software and process
changes to correspond with legislative and policy changes implemented to support
student persistence, retention and success.
The requirements under the California Student Aid Commission’s newly drafted
Institutional Program Agreements (IPA) will place more unfunded responsibility and
workload on colleges. The Commission, which provides no administrative allowance
funds to colleges, has over the last decade continued to shift a larger portion of
administrative responsibility onto participating colleges. As a result of SB 70 (2011
Education Budget trailer bill) the new IPA would require colleges, as a result of their
“voluntary participation in the Cal Grant Program,” to provide data above and beyond
that already required by the newly enacted federal changes under Gainful
Employment program requirements. Of greatest concern for community colleges are
the requirements to report wage and job placement data which is not currently
collected or maintained by community colleges. As a result of our inability to comply
with parts of the data reporting requirements of SB 70 and the Commission’s proposed
implementing regulations which, in their current form, extend beyond the scope of the
CSAC’s responsibility and authority under the law, community colleges may be
jeopardizing their participation in the Cal Grant programs.
Student Financial Aid Programs 2010/11 | 45
Key Findings
Because of the BFAP-SFAA capacity and participation funding allowance, community colleges have made tremendous strides in promoting student awareness and participation in the financial aid programs. Even as the economy continues to struggle and enrollments decrease, Community colleges continued to increase the number or financial aid participants and the amount of funds given to these students. Despite the enormous resource demands created by the outreach efforts and the administrative support that must accompany those efforts, community colleges have again met the additional challenges posed to them.
During the period from 2002/03 to 2010/11 enrollments actually dropped slightly, yet during this same period:
The number of financial aid applications has increased by 118 percent.
The number of financial aid awards has increased by 89 percent.
The number of Pell Grants has increased 105 percent. The number of BOG Fee Waivers has increased by 89 percent.
The total amount of financial aid funds disbursed has increased by 184 percent.
These figures demonstrate the positive return on the state’s BFAP-SFAA investment. The findings of this report clearly illustrate the many benefits this funding has provided for community college students. To date the BFAP-SFAA capacity funding has resulted in more than 835,000 additional financial aid awards and nearly $1.7 billion in additional funds. Of this amount, over $1.3 billion comes from increased federal funds. These federal funds go beyond benefitting California’s students by also benefitting California’s economy with outside resources that go directly into the local economies when students pay for books, rent, gas, food and other education-related expenses.
46 | California Community Colleges Chancellor’s Office
Conclusions
The California Community Colleges and the “I Can Afford College” campaign have made remarkable strides in increasing financial aid awareness, applicants and recipients over the past two years.
The 2010/11 data show that the percentage of community college financial aid applicants has grown from 33 percent to 60.5 percent. Even with the decline in enrollments, over 1.5 million CCC students applied for aid in
2010/11. As a result, Pell Grants have more than doubled since 2002/03,
from 239,925 recipients to 491,577, and Pell Grant dollars have more than tripled since 2002/03, from $668 million to $1.62 billion.
The continual policy changes and the added burdens that these have created, raises the question as to whether community colleges can sustain the level and quality of their financial aid services. This will in large part depend on the support provided to improve capacity and meet future demands. As the number of financial aid applicants increases, related servicing demands also increase.
Given the status of the economy and state budget, it is understandable that the state may be unable to offer additional funds needed to meet the many responsibilities required of Community college financial aid administrators. As staffing decreases and the “buying power” of the BFAP-SFAA funds erodes, it is imperative that community college financial administrators be given the utmost support to ensure that California’s students receive the financial aid benefits needed to sustain these students in their academic pursuits.
Student Financial Aid Programs 2010/11 | 47
How the I Can Afford College Campaign Has Increased Awareness Overview
Less than a generation ago, California’s community colleges were open to everyone.
Cost was not a factor. The only things delineating one student from the other were his
or her individual effort and talents. The state’s residents funded the no-fee campuses
through taxes and enjoyed the economic bounty that an educated and highly trained
populace provided. The tax wasn’t seen as a burden but as an investment, and it
worked. The Golden State’s community college system was the envy of the world.
A quarter of a century later the California Community Colleges are no longer free to
attend. A gradual, steady rise in costs has also seen huge spikes. Tuition will rise from
$36 a unit to $46 a unit by summer 2012, making that same class that was once free
cost as much as $138. Many California families are experiencing financial hardships
that exclude the chance to attend a community college. They think community
colleges are unaffordable. That’s why the I Can Afford College program was created
and has become a beacon of hope for many of the 2.6 million who attend one of
California’s 112 community colleges. I Can Afford College has provided valuable
information to millions of students and sounded the call that cost shouldn’t stall or
destroy an academic career, that money is available to attend community college - if
you know where to get it.
In the 2010/2011 fiscal budget, $3.5 million was appropriated by the Legislature for
the I Can Afford College campaign to promote the following messages:
California Community Colleges remain affordable
Financial aid is available to cover enrollment fees and help with other costs such as books, supplies and even living expenses
Financial aid experts are on all 112 campuses and are available to provide free one-on-one assistance and much of the information is available on the icanaffordcollege.com website.
Target Audiences
The campaign has been charged with effectively reaching low-income and
disadvantaged students who must overcome barriers in accessing postsecondary
education. The target audiences for the I Can Afford College campaign are as follows:
48 | California Community Colleges Chancellor’s Office
Teens and young adults age 16-24 with an annual combined household income at or below $40,000.
Adults age 25-54 with an annual combined household income at or below $40,000, with an emphasis on the unemployed and underemployed.
Influencers of primary and secondary audiences, including parents, teachers, counselors and community leaders.
Strategy
As in prior years, the campaign worked closely with the Chancellor’s Office and the
California Community Colleges Student Financial Aid Advisors Association (CCCSFAAA)
to develop the strategy and tactics for reaching the target audiences. Funding for the
campaign was leveraged by partnering in paid advertising with other state campaigns,
such as WhoDoUWant2B and California Student Aid Commission’s Cash for College.
Various advertising, marketing, media relations and outreach tactics drove traffic to
icanaffordcollege.com and the toll-free phone line, 1-800-987-ICAN (4226). Students
visiting the website or calling the phone line were provided with valuable information
about financial aid and were connected directly with financial aid professionals at
community college campuses to receive one-on-one assistance with the application
process.
Summary of Results
Since the inception of the campaign in 2003/2004, the number of students receiving
some type of financial aid has increased from 652,641 to 1,045,122, an increase of 60
percent. The following is a summary of results achieved by the campaign during
2010/2011 fiscal year:
icanaffordcollege.com received nearly 350,000 unique visitors viewing more than one million pages. 101.9 million impressions were delivered through radio advertising and added value elements.
59 million impressions were delivered through outdoor advertising.
Transit interior bus ads reached 61 million riders.
More than 3.5 million current students and potential students and their influencers were reached through statewide media relations efforts.
Roughly 18,000 current and potential students were directly connected with their
local community college financial aid office for assistance through
icanaffordcollege.com and 1-800-987-ICAN (4226).
Student Financial Aid Programs 2010/11 | 49
Community college campuses promoted 927 financial aid workshops on icanaffordcollege.com. Students attending the events received one-on-one assistance completing financial aid applications.
More than 349,362 pieces of collateral and promotional material were provided statewide to community colleges, high schools, state agencies and campaigns and community and faith- based organizations free of charge.
Website
At the heart of the campaign is the
bilingual English and Spanish
website, icanaffordcollege.com.
During 2010/11,
icanaffordcollege.com received
nearly 350,000 unique visitors
viewing more than one million
pages. The website provides
students with valuable information
about financial aid, online access to
the financial aid applications and
connects them with financial aid
professionals at their local college to receive free one-on-one assistance.
The key features of the website include:
Online access to all of the necessary financial aid forms and answers to the most frequently asked financial aid questions.
Zip code locator that offers students direct contact information for their nearest community college campuses, including physical and website addresses and financial aid office phone numbers and e-mail addresses.
A financial aid event and workshop locator that helps students find a nearby event where they can receive free individual professional assistance to identify the types of aid that are right for them and to complete appropriate financial aid forms.
Students who do not have Internet access can call 1-800-987-ICAN (4226) to get
connected with a local financial aid office in their area.
Advertising
The I Can Afford College campaign used advertising - mainly radio and online
properties - to reach our target audiences throughout the state and drive them to

50 | California Community Colleges Chancellor’s Office
icanaffordcollege.com and the toll-free phone line. Funds were maximized by
leveraging relationships with media partners and other state agencies to broaden the
reach and frequency of paid advertising.
The following advertising campaigns ran during the 2010/11 fiscal year:
Radio/Online
Historically, radio has proven to be very successful in reaching our target audiences.
Through the longstanding relationship with Clear Channel, the campaign’s radio
partner, target audiences were reached through traditional radio, web banners,
streaming radio, and Pandora Radio.
These advertising efforts resulted in:
An estimated 316,300 visitors to icanaffordcollege.com
178 million impressions were delivered through paid radio, online, Pandora and added value elements.
More than 20,000 radio spots streamed on the Internet.
33.5 million impressions delivered by Pandora Radio.
More than 76.8 million impressions were delivered by Internet promotions and website banners.
The following radio advertising flights took place during 2010/2011:
ONLINE Run Dates: October 26 – December 31, 2010
Messaging: The messaging for this flight centered on encouraging potential students to
“go back to community college” to receive retraining and help with changes in a career
if unemployed. The secondary message reinforced that financial aid is available.
Online streaming ads and banners drove listeners to the home page of
icanaffordcollege.com where they could complete the two steps: 1. Enroll at a
community college, and 2. Complete the Free Application for Federal Student Aid
(FAFSA).
Markets: Three media markets received online and bonus on-air advertising support
during this radio campaign: Los Angeles, Sacramento and San Francisco. A total of
21,150,013 impressions ran for the online campaign.
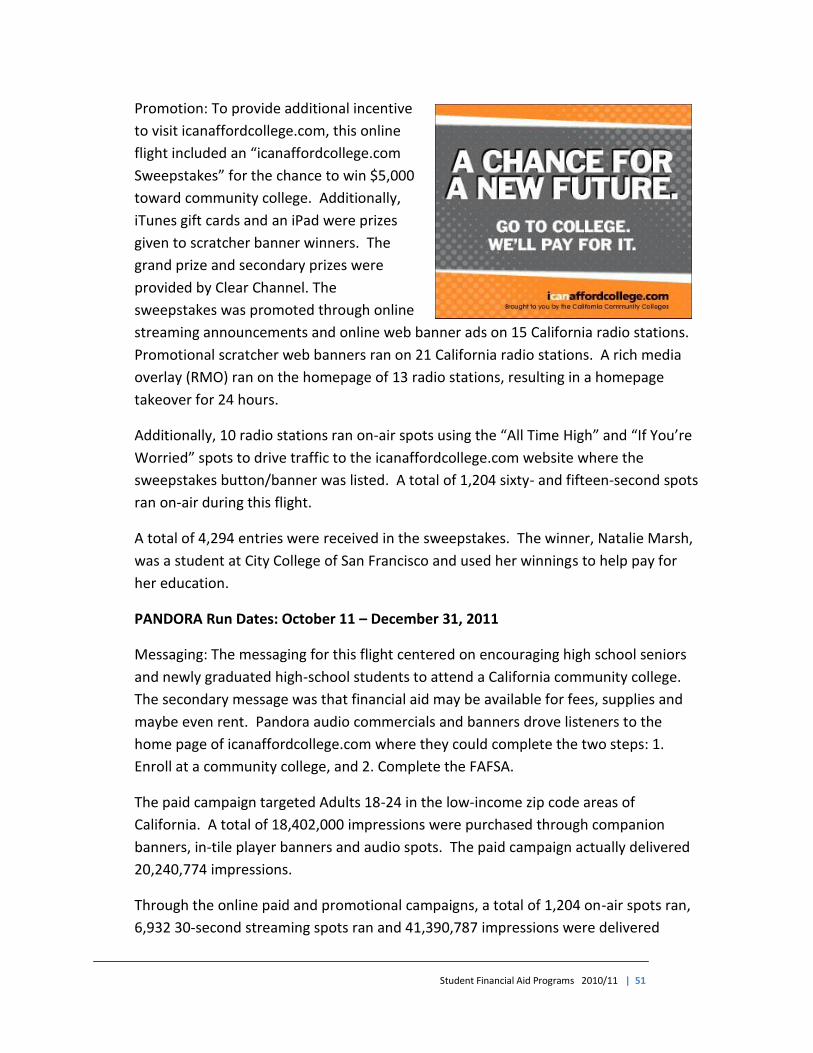
Student Financial Aid Programs 2010/11 | 51
Promotion: To provide additional incentive
to visit icanaffordcollege.com, this online
flight included an “icanaffordcollege.com
Sweepstakes” for the chance to win $5,000
toward community college. Additionally,
iTunes gift cards and an iPad were prizes
given to scratcher banner winners. The
grand prize and secondary prizes were
provided by Clear Channel. The
sweepstakes was promoted through online
streaming announcements and online web banner ads on 15 California radio stations.
Promotional scratcher web banners ran on 21 California radio stations. A rich media
overlay (RMO) ran on the homepage of 13 radio stations, resulting in a homepage
takeover for 24 hours.
Additionally, 10 radio stations ran on-air spots using the “All Time High” and “If You’re
Worried” spots to drive traffic to the icanaffordcollege.com website where the
sweepstakes button/banner was listed. A total of 1,204 sixty- and fifteen-second spots
ran on-air during this flight.
A total of 4,294 entries were received in the sweepstakes. The winner, Natalie Marsh,
was a student at City College of San Francisco and used her winnings to help pay for
her education.
PANDORA Run Dates: October 11 – December 31, 2011
Messaging: The messaging for this flight centered on encouraging high school seniors
and newly graduated high-school students to attend a California community college.
The secondary message was that financial aid may be available for fees, supplies and
maybe even rent. Pandora audio commercials and banners drove listeners to the
home page of icanaffordcollege.com where they could complete the two steps: 1.
Enroll at a community college, and 2. Complete the FAFSA.
The paid campaign targeted Adults 18-24 in the low-income zip code areas of
California. A total of 18,402,000 impressions were purchased through companion
banners, in-tile player banners and audio spots. The paid campaign actually delivered
20,240,774 impressions.
Through the online paid and promotional campaigns, a total of 1,204 on-air spots ran,
6,932 30-second streaming spots ran and 41,390,787 impressions were delivered

52 | California Community Colleges Chancellor’s Office
through Pandora, flash banners, scratcher banners, streaming companion banners and
rich media overlay. Over-delivery was 3,988,877 online/Pandora impressions.
Results: Clear Channel estimated that this paid online and bonus on-air campaign
delivered more than 50 million impressions for our target audiences. During this flight,
the website had more than 90,000 visitors viewing nearly 340,000 pages.
ONLINE Run Dates: January 31 –
March 31, 2011
Messaging: The campaign
partnered with the California
Student Aid Commission to deliver a
joint I Can Afford College and the
March 2 Cal Grant deadline. After
the deadline, the messaging focused
on that it’s not too late to apply for
financial aid. Online streaming ads
and banners drove the target
audience to the home page of
icanaffordcollege.com where they could complete the two steps: 1. Enroll at a
community college, and 2. Complete the FAFSA.
Markets: Five media markets received online advertising support during this radio
campaign: Los Angeles, Riverside, Sacramento, San Diego and San Francisco. A total
44,705,254 impression ran for the online campaign.
Promotion: To provide additional incentive to visit icanaffordcollege.com, this online
along with the on-air flight included a “Pay Your College Bills Sweepstakes” for the
chance to win $5,000 toward community college. Additionally, iTunes gift cards and an
iPad were prizes given to scratcher banner winners. The grand prize and secondary
prizes were provided by Clear Channel. The sweepstakes was promoted through online
streaming announcements and online web banner ads on 32 California radio stations.
Promotional scratcher web banners ran on 32 California radio stations.
Student Financial Aid Programs 2010/11 | 53
PANDORA Run Dates February 1 – March 13, 2011
Messaging: The messaging for this flight centered on encouraging high school seniors
and newly graduated high-school students to attend a California Community Colleges
and let them know about the March 2nd deadline for turning in Cal Grant application
forms. The secondary message was that financial aid may be available for fees,
supplies and maybe even rent. Pandora audio commercials and banners drove the
target audience to the home page of
icanaffordcollege.com where they could complete the two steps: 1. Enroll at a
community college, 2. Turn in Cal Grant forms by March 2nd and 3. Complete the
FAFSA.
The paid campaign targeted the 16-24 demographic in the low-income zip code areas
of California. A total of 7,235,000 impressions were purchased through companion
banners, in-tile player banners and audio spots. The paid campaign actually delivered
7,203,873 impressions.
ON-AIR RADIO Run Dates: February 7 – March 2, 2011
Messaging the Adults 18-24 Demo: The campaign partnered with the California
Student Aid Commission to deliver a joint I Can Afford College and the March 2 Cal
Grant deadline with the “Show Me the Money” and “Totally Given Up” radio spots.
On-air commercials drove listeners to the home page of icanaffordcollege.com where
they could complete the three steps: 1. Enroll at a community college, 2. Fill out the
Cal Grant forms and 3. Complete the FAFSA.
Markets: Tier 1, 2 and 3 campaign contained 19 media markets and received on-air
advertising support during this radio campaign: Bakersfield, Chico, Fresno, Los
Angeles, Merced, Modesto, Monterey-Salinas, Oxnard-Ventura, Palm Springs, Redding,
Riverside-San Bernardino, Sacramento, San Diego, San Francisco, San Luis Obispo,
Santa Barbara, Santa Maria-Lompoc, Santa Rosa and Stockton.
A total of 6,117,688 impressions were delivered for this demo in this flight.
Messaging for the Adults 25-54 Demo was exactly the same as the Adults 18-24 demo,
but a total of 5,627,431 impressions were delivered for this flight.
Messaging for the Adults 18-24/CAL Student Opportunity Access Program (Cal SOAP)
demo was the same, as well, although the Tier 1, 2 and 3 campaign contained 10
media markets and received on air advertising support during this radio campaign in
Bakersfield, Chico, Los Angeles, Merced, Sacramento, San Diego, San Francisco, San
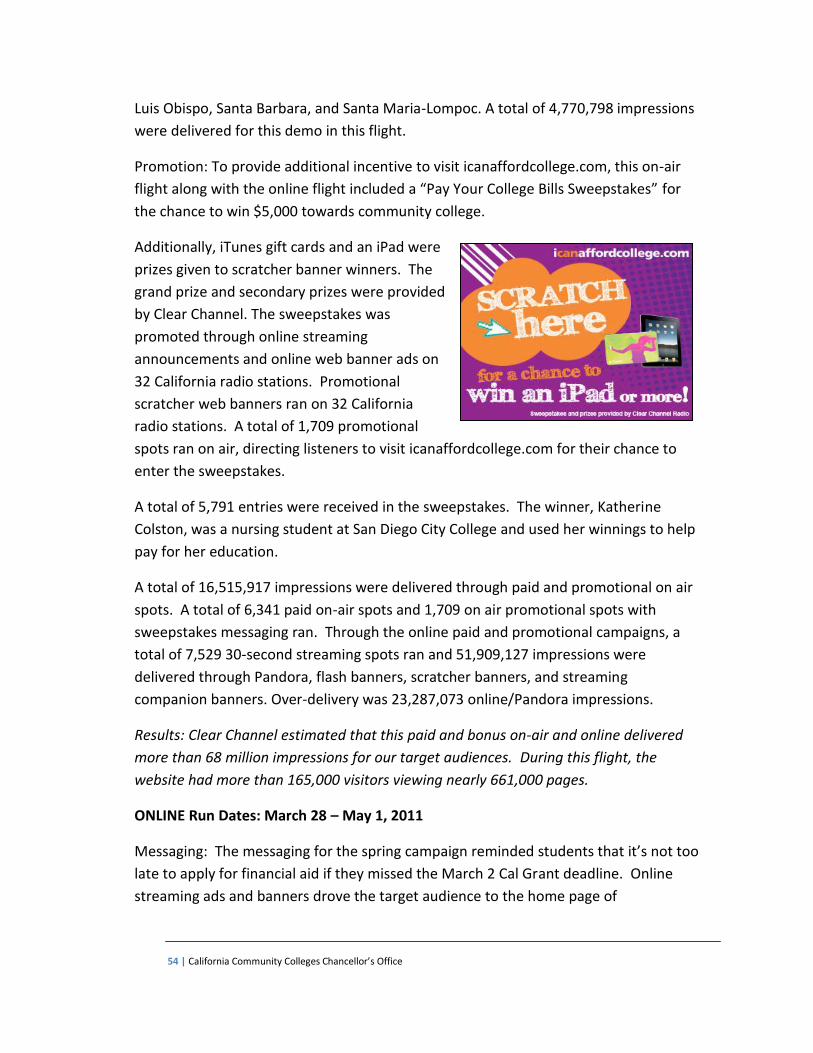
54 | California Community Colleges Chancellor’s Office
Luis Obispo, Santa Barbara, and Santa Maria-Lompoc. A total of 4,770,798 impressions
were delivered for this demo in this flight.
Promotion: To provide additional incentive to visit icanaffordcollege.com, this on-air
flight along with the online flight included a “Pay Your College Bills Sweepstakes” for
the chance to win $5,000 towards community college.
Additionally, iTunes gift cards and an iPad were
prizes given to scratcher banner winners. The
grand prize and secondary prizes were provided
by Clear Channel. The sweepstakes was
promoted through online streaming
announcements and online web banner ads on
32 California radio stations. Promotional
scratcher web banners ran on 32 California
radio stations. A total of 1,709 promotional
spots ran on air, directing listeners to visit icanaffordcollege.com for their chance to
enter the sweepstakes.
A total of 5,791 entries were received in the sweepstakes. The winner, Katherine
Colston, was a nursing student at San Diego City College and used her winnings to help
pay for her education.
A total of 16,515,917 impressions were delivered through paid and promotional on air
spots. A total of 6,341 paid on-air spots and 1,709 on air promotional spots with
sweepstakes messaging ran. Through the online paid and promotional campaigns, a
total of 7,529 30-second streaming spots ran and 51,909,127 impressions were
delivered through Pandora, flash banners, scratcher banners, and streaming
companion banners. Over-delivery was 23,287,073 online/Pandora impressions.
Results: Clear Channel estimated that this paid and bonus on-air and online delivered
more than 68 million impressions for our target audiences. During this flight, the
website had more than 165,000 visitors viewing nearly 661,000 pages.
ONLINE Run Dates: March 28 – May 1, 2011
Messaging: The messaging for the spring campaign reminded students that it’s not too
late to apply for financial aid if they missed the March 2 Cal Grant deadline. Online
streaming ads and banners drove the target audience to the home page of
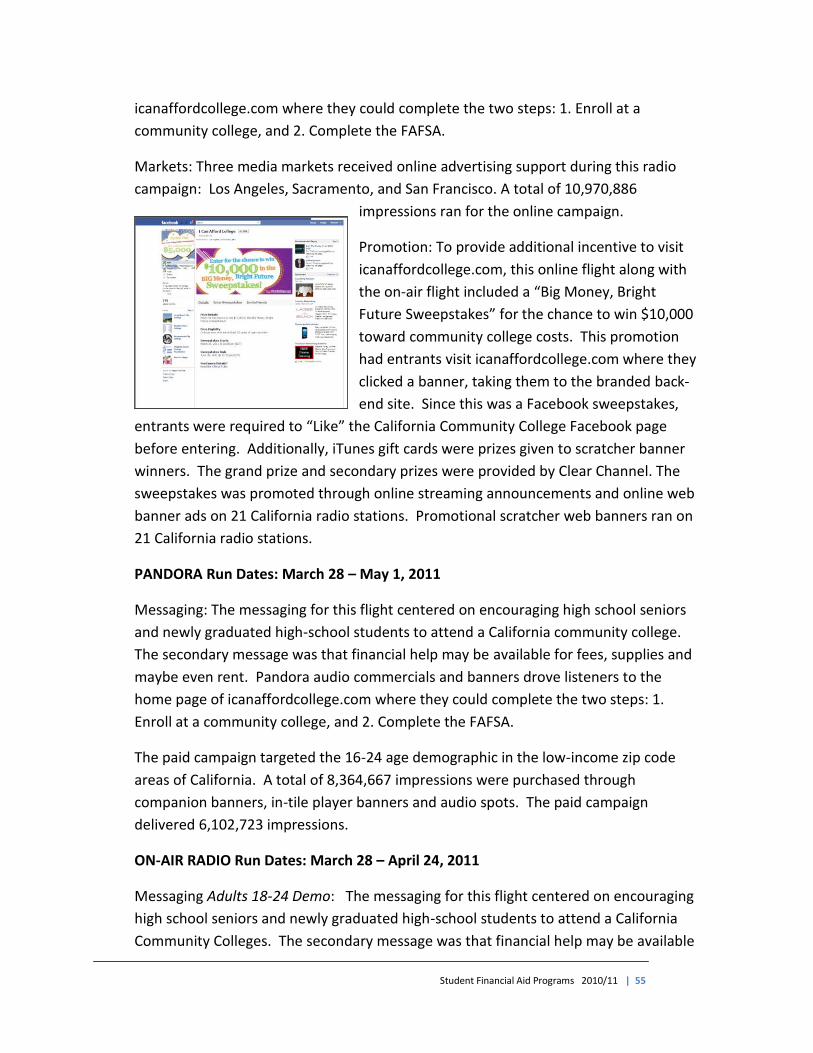
Student Financial Aid Programs 2010/11 | 55
icanaffordcollege.com where they could complete the two steps: 1. Enroll at a
community college, and 2. Complete the FAFSA.
Markets: Three media markets received online advertising support during this radio
campaign: Los Angeles, Sacramento, and San Francisco. A total of 10,970,886
impressions ran for the online campaign.
Promotion: To provide additional incentive to visit
icanaffordcollege.com, this online flight along with
the on-air flight included a “Big Money, Bright
Future Sweepstakes” for the chance to win $10,000
toward community college costs. This promotion
had entrants visit icanaffordcollege.com where they
clicked a banner, taking them to the branded back-
end site. Since this was a Facebook sweepstakes,
entrants were required to “Like” the California Community College Facebook page
before entering. Additionally, iTunes gift cards were prizes given to scratcher banner
winners. The grand prize and secondary prizes were provided by Clear Channel. The
sweepstakes was promoted through online streaming announcements and online web
banner ads on 21 California radio stations. Promotional scratcher web banners ran on
21 California radio stations.
PANDORA Run Dates: March 28 – May 1, 2011
Messaging: The messaging for this flight centered on encouraging high school seniors
and newly graduated high-school students to attend a California community college.
The secondary message was that financial help may be available for fees, supplies and
maybe even rent. Pandora audio commercials and banners drove listeners to the
home page of icanaffordcollege.com where they could complete the two steps: 1.
Enroll at a community college, and 2. Complete the FAFSA.
The paid campaign targeted the 16-24 age demographic in the low-income zip code
areas of California. A total of 8,364,667 impressions were purchased through
companion banners, in-tile player banners and audio spots. The paid campaign
delivered 6,102,723 impressions.
ON-AIR RADIO Run Dates: March 28 – April 24, 2011
Messaging Adults 18-24 Demo: The messaging for this flight centered on encouraging
high school seniors and newly graduated high-school students to attend a California
Community Colleges. The secondary message was that financial help may be available
56 | California Community Colleges Chancellor’s Office
for fees, supplies and maybe even rent. On air commercials and banners drove
listeners to the home page of icanaffordcollege.com where they could complete the
two steps: 1. Enroll at a community college, and 2. Complete the FAFSA.
Markets: Tier 1, 2 and 3 campaign contained 19 media markets and received on-air
advertising support during this radio campaign: Bakersfield, Chico, Fresno, Los
Angeles, Merced, Modesto, Monterey-Salinas, Oxnard-Ventura, Palm Springs, Redding,
Riverside-San Bernardino, Sacramento, San Diego, San Francisco, San Luis Obispo,
Santa Barbara, Santa Maria-Lompoc, Santa Rosa, and Stockton.
A total of 25,629,733 impressions were delivered for this demo in this flight.
Messaging Adults 25-54 Demo: The messaging for this flight centered on encouraging
training to find a new career and re-enter the job market. The secondary message was
that financial help may be available for fees, supplies and maybe even rent. On-air
commercials and banners drove listeners to the home page of icanaffordcollege.com
where they could complete the two steps: 1. Enroll at a community college, and 2.
Complete the FAFSA.
Markets: Tier 1, 2 and 3 campaign contained 19 media markets and received on air
advertising support during this radio campaign: Bakersfield, Chico, Fresno, Los
Angeles, Merced, Modesto, Monterey-Salinas, Oxnard-Ventura, Palm Springs, Redding,
Riverside-San Bernardino, Sacramento, San Diego, San Francisco, San Luis Obispo,
Santa Barbara, Santa Maria-Lompoc, Santa Rosa, and Stockton.
A total of 17,349,662 impressions were delivered for this demo in this flight.
Promotion: To provide additional incentive to visit icanaffordcollege.com, this on-air
flight along with the online flight included a “Big Money, Bright Future Sweepstakes”
for the chance to win $10,000 toward community college costs. This promotion had
entrants visit icanaffordcollege.com where they clicked a banner, taking them to the
branded back-end site. Since this was a Facebook sweepstakes, entrants were
required to “Like” the California Community College Facebook page before entering.
Additionally, iTunes gift cards were prizes given to scratcher banner winners. The
grand prize and secondary prizes were provided by Clear Channel. The sweepstakes
was promoted through online streaming announcements and online web banner ads
on 21 California radio stations. Promotional scratcher web banners ran on 21
California radio stations. Radio stations also ran 724 30-second on-air promotional
spots help supporting the sweepstakes.
Student Financial Aid Programs 2010/11 | 57
A total of 522 entries were received in the sweepstakes as of April 27, 2011. The end
date sweepstakes was extended into the 2011-2012 fiscal year.
A total of 42,979,395 on-air radio impressions ran for this flight. A total of 3,664 paid
on-air spots and 724 promotional on air spots ran with sweepstakes messaging.
Through the online paid and promotional campaigns, a total of 5,976 30-second
streaming spots ran, and 17,073,609 impressions were delivered through Pandora,
flash banners, scratcher banners, and streaming companion banners.
Results: Clear Channel estimated that these paid and bonus online and promotional on-
air spots delivered more than 60 million impressions to our target audiences. During
this flight, the website had more than 61,300 visitors viewing nearly 205,000 pages.
Donated Radio/Other
In March and April of 2011, Clear Channel coordinated radio stations in 19 California
markets to run a combined total of 804 added-value announcements in support of the
“Hands Across
California” event on April 17, 2011, bringing attention to California Community
Colleges students and raising money for financial aid. Ryan Seacrest helped voice the
30-second spot that ran on radio stations in Bakersfield, Chico, Fresno, Los Angeles,
Merced, Modesto, Monterey-Salinas, Oxnard-Ventura, Palm Springs, Redding,
Riverside-San Bernardino, Sacramento, San Diego, San Francisco, San Luis Obispo,
Santa Barbara, Santa Maria-Lompoc, Santa Rosa and Stockton.
Also in support of the “Hands Across California” event, Clear Channel coordinated a
30-minute block program in support of the event. The interview ran on radio stations
in Bakersfield, Fresno, Los Angeles, Riverside, Sacramento, San Diego and San
Francisco for a total of 23 airings.
The campaign was able to substantially increase the value of the advertising budget as
a result of cooperative efforts with Clear Channel. During the 2010/2011 fiscal year,
Clear Channel increased the campaign’s exposure by providing the following added-
value to media buys with an estimated value of $1.71 million:
Free talent and production for all radio and online spots.
Production of promotional web banners and artwork.
4,441 additional on-air promotional announcements.
27,275,950 bonus impressions delivered by web banners and Pandora (over-
delivery).
58 | California Community Colleges Chancellor’s Office
Promotional prizes, $5,000 for community college in the “icanffordcollege.com
Sweepstakes,” $5,000 for community college in the “Pay Your College Bills
Sweepstakes,” $10,000 for community college in the “Big Money, Bright Future
Sweepstakes,” along with instant win prizes including over 180 iTunes gift cards,
and five Apple iPads.
Prime visibility at the Wango Tango concert, including space in the artist program
handed out to all of the concert attendees along with JumboTron announcements,
recorded by Manny on the Streets from the KIIS-FM Morning Show.
Provided all sweepstakes elements including website operations, legal
conformance, prize distribution and promotion.
Recorded 30-minute block program that aired 23 times in support of the “Hands
Across California” event.
Online Advertising
In May 2010, I Can Afford College launched its first online advertising campaign to
broaden our reach to target audiences. The online ads were placed to provide
maximum reach and exposure to low-income audiences ages 16-24 and 25-54. Ads for
ages 25-54 were targeted to reach the unemployed. Between May and June 2010,
icanaffordcollege.com received 34,113 unique visitors as a result of online search
engine and display campaigns.
Media Relations
In addition to paid advertising, the campaign sought additional exposure through
media relations. The campaign garnered media attention through TV, radio, Internet
and print. The campaign was featured on various formats of both general market and
ethnic media including Spanish, Asian and African American media outlets. Interviews
about the availability of financial aid aired on radio and TV stations throughout the
state, including KXTV, Fox40, KNX, Univision, Telemundo, KTSF, KYNO, KPAY and KUFW.
Stories appeared in newspapers such as the Oakland Tribune, Tri-Valley Herald, Chico
Enterprise Record, La Opinion and in New American Media ethnic publications
throughout the state.
During this time period, stories and interviews reached more than 3.5 million viewers,
readers, and/or listeners. These numbers are based on circulation numbers for
newspapers and Nielsen numbers for broadcast outlets (many broadcast outlets were
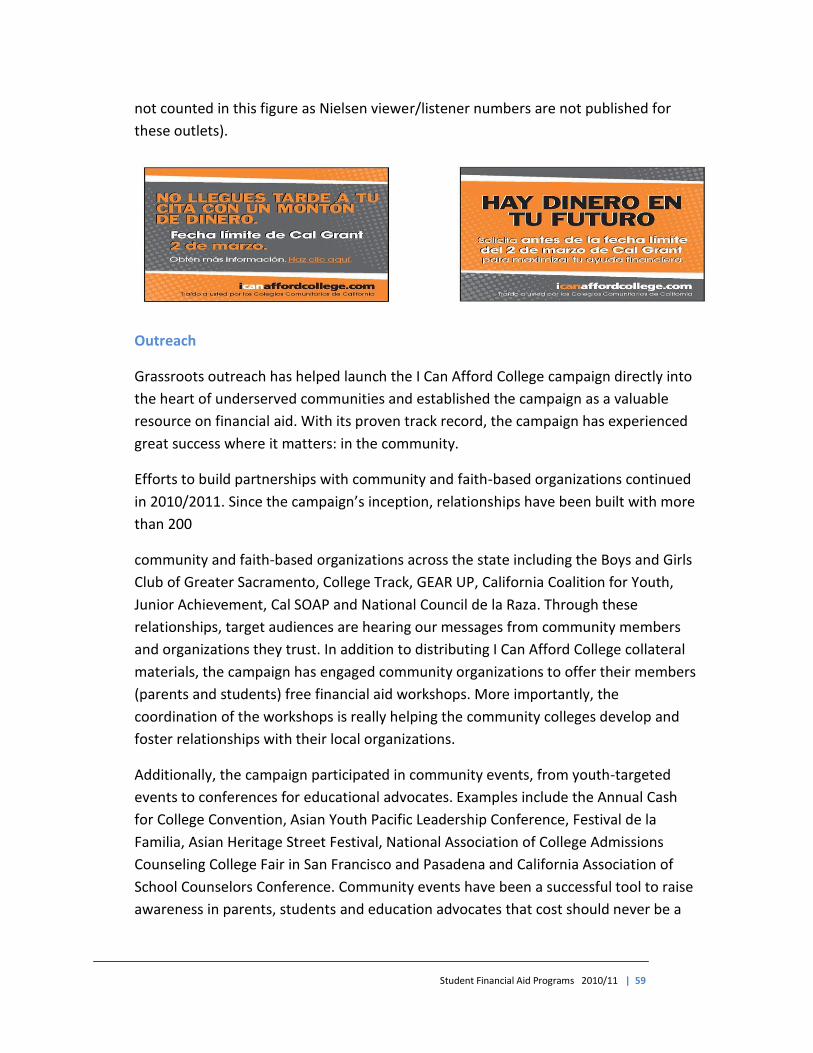
Student Financial Aid Programs 2010/11 | 59
not counted in this figure as Nielsen viewer/listener numbers are not published for
these outlets).
Outreach
Grassroots outreach has helped launch the I Can Afford College campaign directly into
the heart of underserved communities and established the campaign as a valuable
resource on financial aid. With its proven track record, the campaign has experienced
great success where it matters: in the community.
Efforts to build partnerships with community and faith-based organizations continued
in 2010/2011. Since the campaign’s inception, relationships have been built with more
than 200
community and faith-based organizations across the state including the Boys and Girls
Club of Greater Sacramento, College Track, GEAR UP, California Coalition for Youth,
Junior Achievement, Cal SOAP and National Council de la Raza. Through these
relationships, target audiences are hearing our messages from community members
and organizations they trust. In addition to distributing I Can Afford College collateral
materials, the campaign has engaged community organizations to offer their members
(parents and students) free financial aid workshops. More importantly, the
coordination of the workshops is really helping the community colleges develop and
foster relationships with their local organizations.
Additionally, the campaign participated in community events, from youth-targeted
events to conferences for educational advocates. Examples include the Annual Cash
for College Convention, Asian Youth Pacific Leadership Conference, Festival de la
Familia, Asian Heritage Street Festival, National Association of College Admissions
Counseling College Fair in San Francisco and Pasadena and California Association of
School Counselors Conference. Community events have been a successful tool to raise
awareness in parents, students and education advocates that cost should never be a
60 | California Community Colleges Chancellor’s Office
barrier to higher education and that financial aid is available year-round at the
California Community Colleges.
Financial Aid Awareness Month – April 2011
As a result of the highly publicized Cal Grant deadline, many students falsely believe
they cannot apply for student financial aid beyond March 2. Financial Aid Awareness
Month takes place in April to inform students that it’s not too late to apply for financial
aid for the upcoming academic year.
The seventh annual California Community College Financial Aid Awareness Month
(FAAM) took place in April 2011, marking yet another collaborative effort between the
campaign and local campus financial aid offices. During FAAM, 82 colleges promoted
more than 179 free financial aid workshops on icanaffordcollege.com to help students
identify and apply for the financial aid programs that are available year-round. These
events were supported by a paid radio advertising campaign and media relations
efforts that drove interested parties to icanaffordcollege.com where they received up-
to-date information on financial aid workshops taking place in their community.
Student Financial Aid Programs 2010/11 | 61
Acknowledgments
Chancellor Jack Scott would like to acknowledge and thank those individuals who have made significant contributions to this report.
CHANCELLOR’S OFFICE CALIFORNIA COMMUNITY COLLEGES
Erik Skinner, executive vice chancellor
Student Services Division
Linda Michalowski, vice chancellor Jeff Spano, dean
Tim Bonnel, student financial assistance coordinator Steve Arena, retired annuitant
Management Information Systems Division
Patrick Perry, vice chancellor Myrna Huffman, administrator
Debbie Gutierrez, retired annuitant
Economic and Workforce Development Division Jeannine Clemons, digital composition specialist II
Office of Communications Paul Feist, vice Chancellor
Paige Marlatt Dorr, director of communications

California Community Colleges Chancellor’s Office 1102 Q Street | Sacramento, CA 95811
www.cccco.edu CORML #30 and #31


