State of California Department of Water Resources NEW MANAGEMENT TOOLS FOR THE FLOODPLAIN MAPPING PROGRAM Prepared for the California Department of Water Resources Division of Flood Management Floodplain Management Branch Contract Number 4600001508 Prepared By August 2003
Transcript
State of California Department of Water Resources
NEW MANAGEMENT TOOLS FOR THE
FLOODPLAIN MAPPING PROGRAM
Prepared for the
California Department of Water Resources Division of Flood Management Floodplain Management Branch
Contract Number 4600001508
Prepared By
August 2003
New Management Tools
i
TABLE OF CONTENTS
10 Introduction 1-1
11 Awareness Floodplain Mapping Program 1-1 12 Support of FEMA Map Modernization Plan 1-2 13 Improved Community Outreach 1-3
41 The Process 4-1 42 The Findings 4-1 43 Recommended Actions 4-2
50 Conclusion and Future Steps 5-1
51 Awareness Floodplain Mapping Program 5-1 52 Support of FEMA Map Modernization Plan 5-1 53 Improved Community Outreach 5-2
New Management Tools
ii
APPENDICES
A - Prioritization Results and Meeting Notes
This appendix includes a tab for each county with the following information
(DATA GROUPED BY CATEGORY NOT BY COUNTY FOR THIS APPENDIX)
bull Stream prioritization figure
bull Stream prioritization figure with an overlay of FEMA Q3 Awareness Mapping and county areas of interest
bull First visit meeting notes (NOT INCLUDED IN THIS BUSINESS PLAN)
bull Second visit meeting notes (NOT INCLUDED IN THIS BUSINESS PLAN)
B - Presentation Figures
B-1 First round of meetings presentation figures (NOT INCLUDED IN THIS BUSINESS PLAN)
B-2 Second round of meetings presentation figures (NOT INCLUDED IN THIS BUSINESS PLAN)
New Management Tools
iii
LIST OF TABLES
2-1 Total Number of County Unmapped Stream Miles and Mapped by the Awareness Floodplain Mapping Program
New Management Tools
iv
LIST OF FIGURES
2-1 Distribution of Stream Miles by Prioritization Category All Unmapped Stream Miles vs Stream Miles Mapped by Awareness Floodplain Mapping Program
2-2 California Stream Prioritization Results
2-3 Awareness Floodplain Mapping Remaining Category 1 Miles by County
2-4 Awareness Floodplain Mapping Remaining Category 2 Miles by County
New Management Tools
1-1
10 Introduction
Floods cause loss of life property and economic activity In January 1997 California
experienced one of the most geographically extensive and costly floods in the Statersquos
history Of the Statersquos 58 counties 48 were declared disaster areas Nine people were
killed 120000 people were evacuated from their homes and 300 square miles were
flooded Damages approached $2 billion and floods impacted over 23000 homes as well
as numerous businesses agricultural lands bridges roads and floodwater management
infrastructures Estimated indirect costs associated with the disruption of the Statersquos
economy exceeded $5 billion The 1997 State of California Flood Emergency Action
Team (FEAT) report emphasized the need for increased support for responsible
floodplain management
The Statersquos goal is to provide public safety through the identification of potential flood
hazard areas within the next 10 years This will enable each community to provide better
protection for its citizens against loss of life and loss of property during a flood event and
to reduce community costs for emergency response needs To accomplish this DWR is
focusing on the following areas
bull Continue and promote the efforts of the Statewide Awareness Floodplain
Mapping Program (AFMP) including an equitable prioritization methodology
using Geographic Information System (GIS) for California streams to be studied
through the AFMP
bull Support of FEMArsquos Map Modernization Plan and
bull Improved Community Outreach
11 Awareness Floodplain Mapping Program
With Californiarsquos population expected to increase an estimated 40 to 50 percent over the
next 25 years about one-third of Californiarsquos stream reaches will be experiencing
development pressures In 2001 DWR focused its attention on these flood prone areas
New Management Tools
1-2
by initiating the statewide AFMP where floodplains were analyzed using approximate
methods Mapping all floodplains to FEMA standards would be a formidable task as
well as cost prohibitive DWRrsquos priority is to identify potential flood hazard areas by
producing quality maps that maximizes the extent of coverage and makes the most
efficient use of funding Awareness Floodplain Mapping is a cost-effective solution to
mapping areas currently not mapped by FEMA A goal of the Statersquos AFMP is to
compliment FEMArsquos mapping program and not supersede it The AFMP will only study
streams located outside of existing FEMA floodplains
To better capture the Statersquos awareness floodplain mapping needs a fair and impartial
stream rating process was developed The stream rating process evaluates and prioritizes
all unmapped streams that have a potential for some degree of development within the
next 25 years A GIS-based prioritization methodology was developed providing a
recommended sequence in which streams should be studied The methodology and final
results were ultimately presented to 55 of 58 counties 5 cities and 1 flood control
agency San Francisco San Mateo and Siskiyou counties did not participate in this
program The participating cities were Manteca Poway San Bernardino and San
Fernando The participating flood control agency was the Fresno Metropolitan Flood
Control District These results are presented in Section 20
12 Support of FEMA Map Modernization Plan
FEMA will begin implementing their Map Modernization Plan in FY 2003 with the
objectives of reducing the average age of the maps to 6 years producing digital mapping
products with up-to-date flood hazard data for the highest priority areas and developing
flood maps for half of the unmapped flood prone communities As development takes
place and floodplain characteristics change flood maps need to be updated to ensure
communities have a useful tool for floodplain management and that flood insurance
policies are rated properly To prioritize the Map Modernization Plan FEMA is using
their Mapping Needs Update Support System (MNUSS) assessment tool The Mapping
Needs Assessment Process was established to identify and prioritize floodplain map
update needs for communities in accordance with the National Flood Insurance Reform
New Management Tools
1-3
Act of 1994 Information regarding a communityrsquos mapping needs are collected by
FEMA in the MNUSS database DWR is a leading supporter of this effort by promoting
the Map Modernization Plan and helping to develop Californiarsquos priority list for new
detailed flood insurance studies Section 30 discusses the support efforts
13 Improved Community Outreach
DWRrsquos Floodplain Management Program has always aided local governments to develop
sound land use practices and to adopt floodplain management regulations to meet the
minimum requirements of the National Flood Insurance Program However DWR wants
to develop a more effective coordination process that improves on their mapping
program Current coordination practices are incomplete primarily due to budget
limitations The communities have a need and are very interested in understanding and
improving DWRrsquos support for mapping The input received from the communities
regarding ways to improve communication with DWR is included in Section 40
New Management Tools
2-1
20 Awareness Floodplain Mapping Program
21 Introduction
California is expected to witness an increase in its population by an estimated 40 to 50
percent over the next 25 years leading to development pressures on floodplains that have
not been mapped The intent of the AFMP is to map potential flood hazard areas for
these floodplains within the next 10 years This will enable California communities to
better protect its citizens and their properties
To meet the goal of identifying potential flood hazard areas it was necessary to use
approximate assessments and awareness to identify these unmapped floodplains for both
riverine and alluvial fan conditions The final mapping product of the AFMP includes a
base map and the delineation of approximate floodplain boundaries These data are
provided to communities and made available for reference on the Internet through the
DWR Web site It is important to note that awareness mapping is not a FEMA product
It is intended for use as an advisory tool rather than as a regulatory one However
communities can choose to benefit further using this mapping data by requesting FEMA
to include this information on their Flood Insurance Rate Maps (FIRMs)
In accomplishing this mapping effort DWR is being assisted by its districts the United
States Army Corps of Engineers (USACE) the Natural Resources Conservation Service
(NRCS) and URS Group (URS) To better capture the communitiesrsquo floodplain mapping
needs DWR tasked URS to develop a fair and impartial stream rating process to evaluate
all unmapped streams in California that have a potential for some degree of development
within the next 25 years A prioritization methodology using a Geographic Information
System (GIS) was developed to help determine the sequence in which streams should be
studied URS presented the preliminary methodology and final results to 55 of 58
California counties 5 cities and 1 flood control agency selected by DWR Their input
comments and concerns received during two series of visits were incorporated Three
counties (San Francisco San Mateo and Siskiyou) did not to participate The figures
used in the presentations are in Appendix B
New Management Tools
2-2
22 Rational
Given the significant number of unmapped stream miles and the importance of using
available funding effectively a process was developed to identify streams with the
highest priority for study in the next phase of mapping The prioritization methodology
established a hierarchy for California streams based on four major elements
bull Proximity to a transportation corridor (ie the closer a stream is to a road or
highway the higher the priority)
bull Proximity to populated places (ie the closer a stream is to a populated place the
higher the priority)
bull Location within an area of positive population growth
bull Location within an area open for development according to the Growth Area
Potential (GAP) status
The rationale behind using these four elements was to evaluate the direction future
development is likely to follow and to keep this development out of high flood-risk areas
The main goal of the AFMP is to provide an advisory tool that can be used to minimize
loss of human life and property
The prioritization methodology for future awareness floodplain mapping efforts uses
existing digital databases and shapefiles and the ArcView GIS interface Sources for the
digital data include the California Spatial Information Library the United States
Environmental Protection Agencyrsquos (EPA) BASINS database Environmental Systems
Research Institute (ESRI) FEMA DWR and URS The following section elaborates on
the data sources and their relevancy to the prioritization of California streams
23 Data Sources
Data files used in the prioritization methodology include the following
bull Stream Lines The Reach File 3 (RF3) database which is a set of all major
stream lines depicted on United States Geologic Survey (USGS) 1100000
quadrangle maps was used The Web site address of
New Management Tools
2-3
(httpwwwepagovregion02gisatlasrf3htm) provides the following description
for the database
Reach File 3 (RF3) is a national hydrologic database containing 32 million networked reaches It is based upon the 1988 USGS Digital Line Graph 1100000 scale linework for national surface water features This database has evolved over several released versions RF1 RF2 and RF3 This change over time has focused on going from 1250000 to 1100000 scale and a correspondingly denser network of 32 million vs 68000 reaches The Geographic Names Information System (GNIS) was also incorporated
bull Road Networks Shape files representing the road networks throughout the state
were obtained through ESRIrsquos Census Data site The Web site address of
(httpmapserver4 esricomadoltiger) provides the following description of the
database
The TIGERLine files are a digital database of geographic features such as roads railroads rivers lakes political boundaries census statistical boundaries etc covering the entire United States The data base contains information about these features such as their location in latitude and longitude the name the type of feature address ranges for most streets the geographic relationship to other features and other related information They are the public product created from the Census Bureaursquos TIGERreg (Topologically Integrated Geographic Encoding and Referencing) database of geographic information In order for others to use the information in the Census TIGER database in a geographic information system (GIS) the Census Bureau releases periodic extracts of the database including the TIGERLine Files to the public Through ArcData Online you may now access TIGERLine 1995 TIGERLine 1995 include files for all counties and statistically equivalent entities in the United States The data sets are being delivered in industry-standard shapefile format so they are easily accessible with GIS software products such as ArcView and ArcExplorer
bull Populated Places A database of populated places throughout California was
obtained from the California Spatial Information Library The Web site address of
(httpwwwgiscagov data_indexepl) provides the following data description
The lsquoPLACESrsquo layer contains the locations and names of populated places in California The source of this point coverage is the US Geological Surveyrsquos Geographic Names Information System (GNIS) datafile These text files are compiled mainly from USGS map products such as the 75rsquo 124000 quads
New Management Tools
2-4
bull Population Growth Recent population growth information was developed by
comparing census data by census tract between 1990 and 2000 The Web site
containing the year 2000 Census information is at
httpwwwesricomdatadownloadcensus2000_tigerlineindexhtml Census
information for the year 1990 can be obtained at the California Spatial Information
Library
bull Growth Area Potential (GAP) Status A database identifying development
potential was also obtained from the California Spatial Information Library website
The Web site address of (httpwwwgiscagovdata_indexepl) provides the
following data description
Land ownership and management of California distinguishing local state and federal jurisdictions from private lands and delineating areas managed for the long-term maintenance of natural ecological processes and biodiversity This layer therefore contains attributes both for ownership and for the level of biodiversity protection
The ownership data were derived from the 1100000 scale Bureau of Land Management Surface Management Status maps The most recent national forest maps and other sources were used to update the BLM maps prior to digitizing The managed area boundaries were compiled from many sources Many larger areas could be found on the USGS 1100000 scale topographic maps revised in the 1980s Fish and Game Ecological Reserves and Wildlife Areas and Nature Conservancy Preserves were provided as digital files from the California Department of Fish and Gamersquos Heritage Program ARCINFO coverages of the Santa Monica Mountains National Recreation Area BLM Areas of Critical Environmental Concern and some other managed areas were obtained from the responsible agency USFS wilderness area boundaries were obtained from published and unpublished Forest Service maps The wilderness areas and park designations in the California Desert Conservation Act of 1994 were obtained from the 1991 digital GIS coverage prepared by the BLM state office Various paper maps were used to delineate state wildernesses and all other managed areas
Status Description
1 An area having permanent protection from conversion of natural land cover and a mandated management plan in operation to maintain a natural state within which disturbance events (of natural type frequency and intensity) are allowed to proceed without interference or are mimicked through management (Fire is usually suppressed in most managed areas in California however)
New Management Tools
2-5
2 An area having permanent protection from conversion of natural land cover and a mandated management plan in operation to maintain a primarily natural state but which may receive use or management practices that degrade the quality of existing natural communities
3 An area having permanent protection from conversion of natural land cover for the majority of the area but subject to extractive uses of either a broad low-intensity type or localized intense type It also confers protection to federally listed endangered and threatened species throughout the area
4 Lack of irrevocable easement or mandate to prevent conversion of natural habitat types to anthropogenic habitat types and allow for intensive use throughout the tract or existence of such restrictions is unknown
bull FEMA-Mapped Floodplains Floodplain shapefiles were obtained including
coverages provided by FEMA (Q3 data through 1996) and coverage depicting
awareness floodplain mapping accomplished to-date
24 Stream Prioritization Assessment Procedure
Proximity of streams to populated places is one of the prioritization factors The
following process was used to establish priorities for this factor Distance coverages
which consist of grids of values identifying the distance from any point within the
coverage to the nearest populated place were created first Next the streams were
overlain on these maps and the endpoints of the stream reaches were queried to
determine the value of the underlying distance grid The average value of the two
endpoint values are then associated with that given stream reach in the accompanying
database table
Similar procedures were used to establish priorities associated with population growth
and development potential factors Stream lines were overlain on polygon coverages of
growth and GAP coverages and each stream reachrsquos database table was updated to
reflect the value of the underlying coverage
The fourth prioritization factor is proximity to roads Developing priorities for this factor
were accomplished in a similar way except that major and minor roads were
New Management Tools
2-6
differentiated Major roads were defined as primary transportation corridors ranging
from federal to state and county roads minor roads were defined as private and unnamed
public roads Again a proximity grid was established for major and minor roads
throughout the state and streams were overlain against this grid to ascertain their
proximity to the nearest road
The end result of the querying procedures was an updated database table for the stream
reaches that reflects values associated with proximity to populated places proximity to
major and minor roads recent population growth in the local vicinity and development
potential Each of these data were then normalized on a scale of 1 to 4 (2 to 5 for minor
roads) according to the following formulas
Town Proximity
0-1 mile 1-2 miles 2-3 miles gt 3 miles
Priority 1 2 3 4
Road Proximity
Priority
0 ndash 05 mile
05 ndash 10 miles 10 ndash 15 miles
gt 15 miles
Major Roads 1 2 3 4
Minor Roads 2 3 4 5
Change in Population Density
(People per square mile)
gt 1000 500 ndash 1000
0 ndash 500 Negative
Priority
1 2 3 4
GAP Status
4 3 2 1
Priority
1 2 3 4
New Management Tools
2-7
The sum of the values for each factor provides a summary prioritization factor that varies
from a low of 4 to a high of 21 with the lower values reflecting higher priority
Stream reach shapefiles were then color coded according to those priorities and overlain
on maps depicting floodplains mapped by FEMA (Q3 data through 1996) previous
awareness floodplain mapping and the community areas of preference for future
awareness floodplain mapping Future mapping efforts may be directed following the
priorities indicated for the remaining unmapped reaches
25 Results
The results of the stream prioritization process for the AFMP are included in Appendix
A The first figure depicts the results of the stream prioritization The next figure shows
the same first figure overlain by FEMA mapping data (Q3 data through 1996) AFMP
mapping data and polygons of areas of interest identified by the communities
The stream analysis results show that prior to commencing the statewide AFMP there
were approximately 153000 unmapped stream miles in the state At the time of
performing this analysis approximately 5900 stream miles had been mapped through the
Awareness Mapping Program This number has increased to approximately 13000
stream miles mapped at the time this final report was released
Table 2-1 lists by county the total number of unmapped stream miles and the number of
stream miles mapped by the AFMP
Figure 2-1 shows the stream miles the AFMP have mapped and where those stream miles
fall within the four prioritization categories A graph that compares prioritization
distributions by category for total unmapped streams and awareness floodplain mapping
is included
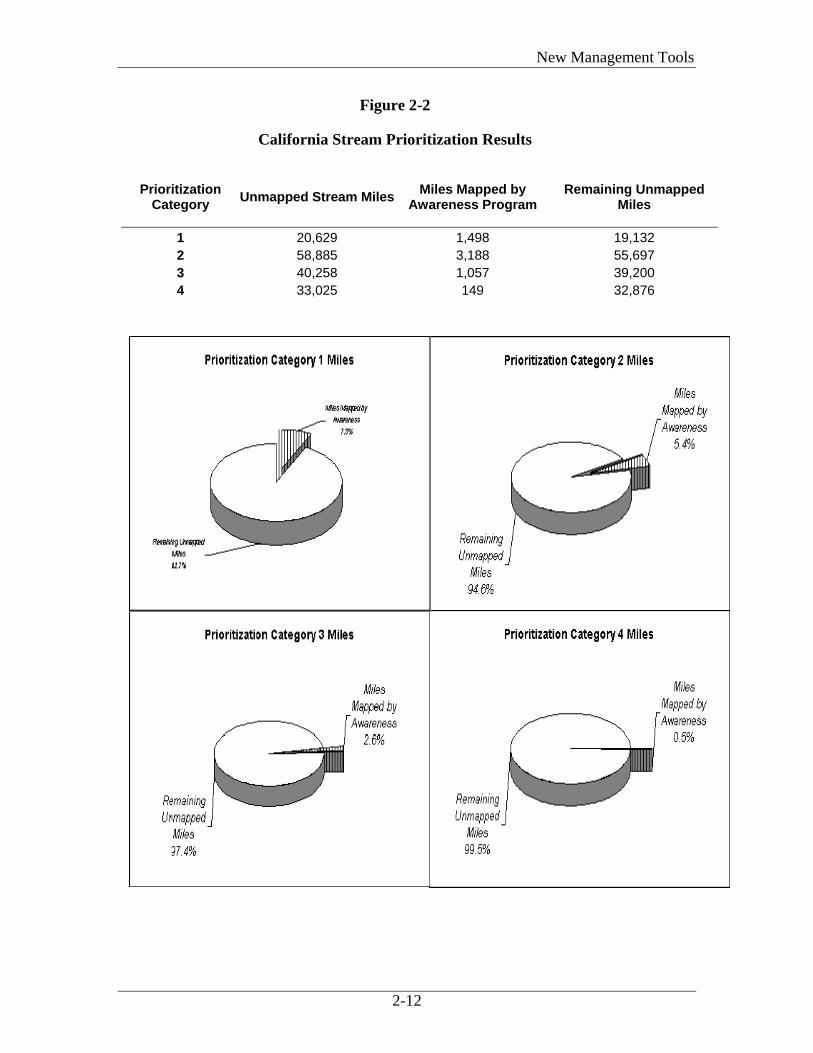
Figure 2-2 shows the percentages of AFMP miles and remaining miles for each of the
four ranking categories The results indicate that approximately 7 of the Priority 1
unmapped stream miles have been mapped through the AFMP This leaves
New Management Tools
2-8
approximately 19000 Priority 1stream miles to be mapped before Priority 2 stream miles
are mapped
Figures 2-3 and 2-4 show remaining stream miles for Categories 1 and 2 by county This
is the future Awareness Floodplain Mapping Program
It should be noted that the input received from the communities in the form of ldquoselectiverdquo
areas of interest for awareness mapping might cover stream miles of a lower priority than
Priority 1 streams This is because communities have a better understanding of the
activities and prioritization elements pertaining to their own communities and citizens
Community input also could be viewed as a quality assurance factor that improves the
applicability of the prioritization results
New Management Tools
2-9
TABLE 2-1
Total Number of County Unmapped Stream Miles and Mapped by the
Awareness Floodplain Mapping Program (as of May 2003)
County Unmapped Stream Miles Mapped by Awareness ProgramAlameda 897 0 Alpine 1033 101 Amador 862 325
Butte 1735 67
Calaveras 1829 732
Colusa 757 0
Contra Costa 383 0
Del Norte 1100 30 El Dorado 2423 0 Fresno 5026 0 Glenn 1557 0
County Unmapped Stream Miles Mapped by Awareness ProgramSacramento 566 364 San Benito 2070 602 San Bernardino 19530 0 San Diego 5120 0 San Francisco 20 0 San Joaquin 672 0 San Luis Obispo 3467 0 San Mateo 556 0 Santa Barbara 3857 559 Santa Clara 1274 257 Santa Cruz 433 0 Shasta 3327 0 Sierra 1270 0 Siskiyou 4430 0 Solano 338 161 Sonoma 1743 0 Stanislaus 1539 711 Sutter 179 0 Tehama 3287 30 Trinity 3631 0 Tuolumne 2981 0 Tulare 3634 0 Ventura 2643 136 Yolo 472 0
Yuba 618 0
TOTAL 152797 5891 Not participating in the NFIP County does not wish to participate in the AFMP Total number of stream miles mapped under the AFMP at the time of completing the stream prioritization methodology analysis This number has increased to reach approximately 13000 stream miles at the time of releasing this report
New Management Tools
2-11
Figure 2-1
Distribution of Stream Miles by Prioritization Category All Unmapped Stream Miles vs Stream Miles Mapped by Awareness Floodplain
Mapping Program
Stream Miles by Prioritization Category Group of Streams 1st 2nd 3rd 4th Total
All Unmapped Streams 20629 58885 40258 33025 152797
Awareness Mapping 1498 3188 1057 149 5891
State of CaliforniaComparison of Prioritization Distribution
216
263
385
135
254
541
25
179
0
10
20
30
40
50
60
1st 2nd 3rd 4th
Prioritization Category
Perc
ent o
f Tot
al M
iles
by G
roup
Unmapped Streams Awareness Mapping
The percentages shown for each category are percentage of the total of that specific category alone For example 135 of all of the unmapped stream miles are in the first category 541 of all the Awareness Program mapped miles are in the second category
New Management Tools
2-12
Figure 2-2
California Stream Prioritization Results
Prioritization Category Unmapped Stream Miles Miles Mapped by
41 The Process 4-1 42 The Findings 4-1 43 Recommended Actions 4-2
50 Conclusion and Future Steps 5-1
51 Awareness Floodplain Mapping Program 5-1 52 Support of FEMA Map Modernization Plan 5-1 53 Improved Community Outreach 5-2
New Management Tools
ii
APPENDICES
A - Prioritization Results and Meeting Notes
This appendix includes a tab for each county with the following information
(DATA GROUPED BY CATEGORY NOT BY COUNTY FOR THIS APPENDIX)
bull Stream prioritization figure
bull Stream prioritization figure with an overlay of FEMA Q3 Awareness Mapping and county areas of interest
bull First visit meeting notes (NOT INCLUDED IN THIS BUSINESS PLAN)
bull Second visit meeting notes (NOT INCLUDED IN THIS BUSINESS PLAN)
B - Presentation Figures
B-1 First round of meetings presentation figures (NOT INCLUDED IN THIS BUSINESS PLAN)
B-2 Second round of meetings presentation figures (NOT INCLUDED IN THIS BUSINESS PLAN)
New Management Tools
iii
LIST OF TABLES
2-1 Total Number of County Unmapped Stream Miles and Mapped by the Awareness Floodplain Mapping Program
New Management Tools
iv
LIST OF FIGURES
2-1 Distribution of Stream Miles by Prioritization Category All Unmapped Stream Miles vs Stream Miles Mapped by Awareness Floodplain Mapping Program
2-2 California Stream Prioritization Results
2-3 Awareness Floodplain Mapping Remaining Category 1 Miles by County
2-4 Awareness Floodplain Mapping Remaining Category 2 Miles by County
New Management Tools
1-1
10 Introduction
Floods cause loss of life property and economic activity In January 1997 California
experienced one of the most geographically extensive and costly floods in the Statersquos
history Of the Statersquos 58 counties 48 were declared disaster areas Nine people were
killed 120000 people were evacuated from their homes and 300 square miles were
flooded Damages approached $2 billion and floods impacted over 23000 homes as well
as numerous businesses agricultural lands bridges roads and floodwater management
infrastructures Estimated indirect costs associated with the disruption of the Statersquos
economy exceeded $5 billion The 1997 State of California Flood Emergency Action
Team (FEAT) report emphasized the need for increased support for responsible
floodplain management
The Statersquos goal is to provide public safety through the identification of potential flood
hazard areas within the next 10 years This will enable each community to provide better
protection for its citizens against loss of life and loss of property during a flood event and
to reduce community costs for emergency response needs To accomplish this DWR is
focusing on the following areas
bull Continue and promote the efforts of the Statewide Awareness Floodplain
Mapping Program (AFMP) including an equitable prioritization methodology
using Geographic Information System (GIS) for California streams to be studied
through the AFMP
bull Support of FEMArsquos Map Modernization Plan and
bull Improved Community Outreach
11 Awareness Floodplain Mapping Program
With Californiarsquos population expected to increase an estimated 40 to 50 percent over the
next 25 years about one-third of Californiarsquos stream reaches will be experiencing
development pressures In 2001 DWR focused its attention on these flood prone areas
New Management Tools
1-2
by initiating the statewide AFMP where floodplains were analyzed using approximate
methods Mapping all floodplains to FEMA standards would be a formidable task as
well as cost prohibitive DWRrsquos priority is to identify potential flood hazard areas by
producing quality maps that maximizes the extent of coverage and makes the most
efficient use of funding Awareness Floodplain Mapping is a cost-effective solution to
mapping areas currently not mapped by FEMA A goal of the Statersquos AFMP is to
compliment FEMArsquos mapping program and not supersede it The AFMP will only study
streams located outside of existing FEMA floodplains
To better capture the Statersquos awareness floodplain mapping needs a fair and impartial
stream rating process was developed The stream rating process evaluates and prioritizes
all unmapped streams that have a potential for some degree of development within the
next 25 years A GIS-based prioritization methodology was developed providing a
recommended sequence in which streams should be studied The methodology and final
results were ultimately presented to 55 of 58 counties 5 cities and 1 flood control
agency San Francisco San Mateo and Siskiyou counties did not participate in this
program The participating cities were Manteca Poway San Bernardino and San
Fernando The participating flood control agency was the Fresno Metropolitan Flood
Control District These results are presented in Section 20
12 Support of FEMA Map Modernization Plan
FEMA will begin implementing their Map Modernization Plan in FY 2003 with the
objectives of reducing the average age of the maps to 6 years producing digital mapping
products with up-to-date flood hazard data for the highest priority areas and developing
flood maps for half of the unmapped flood prone communities As development takes
place and floodplain characteristics change flood maps need to be updated to ensure
communities have a useful tool for floodplain management and that flood insurance
policies are rated properly To prioritize the Map Modernization Plan FEMA is using
their Mapping Needs Update Support System (MNUSS) assessment tool The Mapping
Needs Assessment Process was established to identify and prioritize floodplain map
update needs for communities in accordance with the National Flood Insurance Reform
New Management Tools
1-3
Act of 1994 Information regarding a communityrsquos mapping needs are collected by
FEMA in the MNUSS database DWR is a leading supporter of this effort by promoting
the Map Modernization Plan and helping to develop Californiarsquos priority list for new
detailed flood insurance studies Section 30 discusses the support efforts
13 Improved Community Outreach
DWRrsquos Floodplain Management Program has always aided local governments to develop
sound land use practices and to adopt floodplain management regulations to meet the
minimum requirements of the National Flood Insurance Program However DWR wants
to develop a more effective coordination process that improves on their mapping
program Current coordination practices are incomplete primarily due to budget
limitations The communities have a need and are very interested in understanding and
improving DWRrsquos support for mapping The input received from the communities
regarding ways to improve communication with DWR is included in Section 40
New Management Tools
2-1
20 Awareness Floodplain Mapping Program
21 Introduction
California is expected to witness an increase in its population by an estimated 40 to 50
percent over the next 25 years leading to development pressures on floodplains that have
not been mapped The intent of the AFMP is to map potential flood hazard areas for
these floodplains within the next 10 years This will enable California communities to
better protect its citizens and their properties
To meet the goal of identifying potential flood hazard areas it was necessary to use
approximate assessments and awareness to identify these unmapped floodplains for both
riverine and alluvial fan conditions The final mapping product of the AFMP includes a
base map and the delineation of approximate floodplain boundaries These data are
provided to communities and made available for reference on the Internet through the
DWR Web site It is important to note that awareness mapping is not a FEMA product
It is intended for use as an advisory tool rather than as a regulatory one However
communities can choose to benefit further using this mapping data by requesting FEMA
to include this information on their Flood Insurance Rate Maps (FIRMs)
In accomplishing this mapping effort DWR is being assisted by its districts the United
States Army Corps of Engineers (USACE) the Natural Resources Conservation Service
(NRCS) and URS Group (URS) To better capture the communitiesrsquo floodplain mapping
needs DWR tasked URS to develop a fair and impartial stream rating process to evaluate
all unmapped streams in California that have a potential for some degree of development
within the next 25 years A prioritization methodology using a Geographic Information
System (GIS) was developed to help determine the sequence in which streams should be
studied URS presented the preliminary methodology and final results to 55 of 58
California counties 5 cities and 1 flood control agency selected by DWR Their input
comments and concerns received during two series of visits were incorporated Three
counties (San Francisco San Mateo and Siskiyou) did not to participate The figures
used in the presentations are in Appendix B
New Management Tools
2-2
22 Rational
Given the significant number of unmapped stream miles and the importance of using
available funding effectively a process was developed to identify streams with the
highest priority for study in the next phase of mapping The prioritization methodology
established a hierarchy for California streams based on four major elements
bull Proximity to a transportation corridor (ie the closer a stream is to a road or
highway the higher the priority)
bull Proximity to populated places (ie the closer a stream is to a populated place the
higher the priority)
bull Location within an area of positive population growth
bull Location within an area open for development according to the Growth Area
Potential (GAP) status
The rationale behind using these four elements was to evaluate the direction future
development is likely to follow and to keep this development out of high flood-risk areas
The main goal of the AFMP is to provide an advisory tool that can be used to minimize
loss of human life and property
The prioritization methodology for future awareness floodplain mapping efforts uses
existing digital databases and shapefiles and the ArcView GIS interface Sources for the
digital data include the California Spatial Information Library the United States
Environmental Protection Agencyrsquos (EPA) BASINS database Environmental Systems
Research Institute (ESRI) FEMA DWR and URS The following section elaborates on
the data sources and their relevancy to the prioritization of California streams
23 Data Sources
Data files used in the prioritization methodology include the following
bull Stream Lines The Reach File 3 (RF3) database which is a set of all major
stream lines depicted on United States Geologic Survey (USGS) 1100000
quadrangle maps was used The Web site address of
New Management Tools
2-3
(httpwwwepagovregion02gisatlasrf3htm) provides the following description
for the database
Reach File 3 (RF3) is a national hydrologic database containing 32 million networked reaches It is based upon the 1988 USGS Digital Line Graph 1100000 scale linework for national surface water features This database has evolved over several released versions RF1 RF2 and RF3 This change over time has focused on going from 1250000 to 1100000 scale and a correspondingly denser network of 32 million vs 68000 reaches The Geographic Names Information System (GNIS) was also incorporated
bull Road Networks Shape files representing the road networks throughout the state
were obtained through ESRIrsquos Census Data site The Web site address of
(httpmapserver4 esricomadoltiger) provides the following description of the
database
The TIGERLine files are a digital database of geographic features such as roads railroads rivers lakes political boundaries census statistical boundaries etc covering the entire United States The data base contains information about these features such as their location in latitude and longitude the name the type of feature address ranges for most streets the geographic relationship to other features and other related information They are the public product created from the Census Bureaursquos TIGERreg (Topologically Integrated Geographic Encoding and Referencing) database of geographic information In order for others to use the information in the Census TIGER database in a geographic information system (GIS) the Census Bureau releases periodic extracts of the database including the TIGERLine Files to the public Through ArcData Online you may now access TIGERLine 1995 TIGERLine 1995 include files for all counties and statistically equivalent entities in the United States The data sets are being delivered in industry-standard shapefile format so they are easily accessible with GIS software products such as ArcView and ArcExplorer
bull Populated Places A database of populated places throughout California was
obtained from the California Spatial Information Library The Web site address of
(httpwwwgiscagov data_indexepl) provides the following data description
The lsquoPLACESrsquo layer contains the locations and names of populated places in California The source of this point coverage is the US Geological Surveyrsquos Geographic Names Information System (GNIS) datafile These text files are compiled mainly from USGS map products such as the 75rsquo 124000 quads
New Management Tools
2-4
bull Population Growth Recent population growth information was developed by
comparing census data by census tract between 1990 and 2000 The Web site
containing the year 2000 Census information is at
httpwwwesricomdatadownloadcensus2000_tigerlineindexhtml Census
information for the year 1990 can be obtained at the California Spatial Information
Library
bull Growth Area Potential (GAP) Status A database identifying development
potential was also obtained from the California Spatial Information Library website
The Web site address of (httpwwwgiscagovdata_indexepl) provides the
following data description
Land ownership and management of California distinguishing local state and federal jurisdictions from private lands and delineating areas managed for the long-term maintenance of natural ecological processes and biodiversity This layer therefore contains attributes both for ownership and for the level of biodiversity protection
The ownership data were derived from the 1100000 scale Bureau of Land Management Surface Management Status maps The most recent national forest maps and other sources were used to update the BLM maps prior to digitizing The managed area boundaries were compiled from many sources Many larger areas could be found on the USGS 1100000 scale topographic maps revised in the 1980s Fish and Game Ecological Reserves and Wildlife Areas and Nature Conservancy Preserves were provided as digital files from the California Department of Fish and Gamersquos Heritage Program ARCINFO coverages of the Santa Monica Mountains National Recreation Area BLM Areas of Critical Environmental Concern and some other managed areas were obtained from the responsible agency USFS wilderness area boundaries were obtained from published and unpublished Forest Service maps The wilderness areas and park designations in the California Desert Conservation Act of 1994 were obtained from the 1991 digital GIS coverage prepared by the BLM state office Various paper maps were used to delineate state wildernesses and all other managed areas
Status Description
1 An area having permanent protection from conversion of natural land cover and a mandated management plan in operation to maintain a natural state within which disturbance events (of natural type frequency and intensity) are allowed to proceed without interference or are mimicked through management (Fire is usually suppressed in most managed areas in California however)
New Management Tools
2-5
2 An area having permanent protection from conversion of natural land cover and a mandated management plan in operation to maintain a primarily natural state but which may receive use or management practices that degrade the quality of existing natural communities
3 An area having permanent protection from conversion of natural land cover for the majority of the area but subject to extractive uses of either a broad low-intensity type or localized intense type It also confers protection to federally listed endangered and threatened species throughout the area
4 Lack of irrevocable easement or mandate to prevent conversion of natural habitat types to anthropogenic habitat types and allow for intensive use throughout the tract or existence of such restrictions is unknown
bull FEMA-Mapped Floodplains Floodplain shapefiles were obtained including
coverages provided by FEMA (Q3 data through 1996) and coverage depicting
awareness floodplain mapping accomplished to-date
24 Stream Prioritization Assessment Procedure
Proximity of streams to populated places is one of the prioritization factors The
following process was used to establish priorities for this factor Distance coverages
which consist of grids of values identifying the distance from any point within the
coverage to the nearest populated place were created first Next the streams were
overlain on these maps and the endpoints of the stream reaches were queried to
determine the value of the underlying distance grid The average value of the two
endpoint values are then associated with that given stream reach in the accompanying
database table
Similar procedures were used to establish priorities associated with population growth
and development potential factors Stream lines were overlain on polygon coverages of
growth and GAP coverages and each stream reachrsquos database table was updated to
reflect the value of the underlying coverage
The fourth prioritization factor is proximity to roads Developing priorities for this factor
were accomplished in a similar way except that major and minor roads were
New Management Tools
2-6
differentiated Major roads were defined as primary transportation corridors ranging
from federal to state and county roads minor roads were defined as private and unnamed
public roads Again a proximity grid was established for major and minor roads
throughout the state and streams were overlain against this grid to ascertain their
proximity to the nearest road
The end result of the querying procedures was an updated database table for the stream
reaches that reflects values associated with proximity to populated places proximity to
major and minor roads recent population growth in the local vicinity and development
potential Each of these data were then normalized on a scale of 1 to 4 (2 to 5 for minor
roads) according to the following formulas
Town Proximity
0-1 mile 1-2 miles 2-3 miles gt 3 miles
Priority 1 2 3 4
Road Proximity
Priority
0 ndash 05 mile
05 ndash 10 miles 10 ndash 15 miles
gt 15 miles
Major Roads 1 2 3 4
Minor Roads 2 3 4 5
Change in Population Density
(People per square mile)
gt 1000 500 ndash 1000
0 ndash 500 Negative
Priority
1 2 3 4
GAP Status
4 3 2 1
Priority
1 2 3 4
New Management Tools
2-7
The sum of the values for each factor provides a summary prioritization factor that varies
from a low of 4 to a high of 21 with the lower values reflecting higher priority
Stream reach shapefiles were then color coded according to those priorities and overlain
on maps depicting floodplains mapped by FEMA (Q3 data through 1996) previous
awareness floodplain mapping and the community areas of preference for future
awareness floodplain mapping Future mapping efforts may be directed following the
priorities indicated for the remaining unmapped reaches
25 Results
The results of the stream prioritization process for the AFMP are included in Appendix
A The first figure depicts the results of the stream prioritization The next figure shows
the same first figure overlain by FEMA mapping data (Q3 data through 1996) AFMP
mapping data and polygons of areas of interest identified by the communities
The stream analysis results show that prior to commencing the statewide AFMP there
were approximately 153000 unmapped stream miles in the state At the time of
performing this analysis approximately 5900 stream miles had been mapped through the
Awareness Mapping Program This number has increased to approximately 13000
stream miles mapped at the time this final report was released
Table 2-1 lists by county the total number of unmapped stream miles and the number of
stream miles mapped by the AFMP
Figure 2-1 shows the stream miles the AFMP have mapped and where those stream miles
fall within the four prioritization categories A graph that compares prioritization
distributions by category for total unmapped streams and awareness floodplain mapping
is included
Figure 2-2 shows the percentages of AFMP miles and remaining miles for each of the
four ranking categories The results indicate that approximately 7 of the Priority 1
unmapped stream miles have been mapped through the AFMP This leaves
New Management Tools
2-8
approximately 19000 Priority 1stream miles to be mapped before Priority 2 stream miles
are mapped
Figures 2-3 and 2-4 show remaining stream miles for Categories 1 and 2 by county This
is the future Awareness Floodplain Mapping Program
It should be noted that the input received from the communities in the form of ldquoselectiverdquo
areas of interest for awareness mapping might cover stream miles of a lower priority than
Priority 1 streams This is because communities have a better understanding of the
activities and prioritization elements pertaining to their own communities and citizens
Community input also could be viewed as a quality assurance factor that improves the
applicability of the prioritization results
New Management Tools
2-9
TABLE 2-1
Total Number of County Unmapped Stream Miles and Mapped by the
Awareness Floodplain Mapping Program (as of May 2003)
County Unmapped Stream Miles Mapped by Awareness ProgramAlameda 897 0 Alpine 1033 101 Amador 862 325
Butte 1735 67
Calaveras 1829 732
Colusa 757 0
Contra Costa 383 0
Del Norte 1100 30 El Dorado 2423 0 Fresno 5026 0 Glenn 1557 0
County Unmapped Stream Miles Mapped by Awareness ProgramSacramento 566 364 San Benito 2070 602 San Bernardino 19530 0 San Diego 5120 0 San Francisco 20 0 San Joaquin 672 0 San Luis Obispo 3467 0 San Mateo 556 0 Santa Barbara 3857 559 Santa Clara 1274 257 Santa Cruz 433 0 Shasta 3327 0 Sierra 1270 0 Siskiyou 4430 0 Solano 338 161 Sonoma 1743 0 Stanislaus 1539 711 Sutter 179 0 Tehama 3287 30 Trinity 3631 0 Tuolumne 2981 0 Tulare 3634 0 Ventura 2643 136 Yolo 472 0
Yuba 618 0
TOTAL 152797 5891 Not participating in the NFIP County does not wish to participate in the AFMP Total number of stream miles mapped under the AFMP at the time of completing the stream prioritization methodology analysis This number has increased to reach approximately 13000 stream miles at the time of releasing this report
New Management Tools
2-11
Figure 2-1
Distribution of Stream Miles by Prioritization Category All Unmapped Stream Miles vs Stream Miles Mapped by Awareness Floodplain
Mapping Program
Stream Miles by Prioritization Category Group of Streams 1st 2nd 3rd 4th Total
All Unmapped Streams 20629 58885 40258 33025 152797
Awareness Mapping 1498 3188 1057 149 5891
State of CaliforniaComparison of Prioritization Distribution
216
263
385
135
254
541
25
179
0
10
20
30
40
50
60
1st 2nd 3rd 4th
Prioritization Category
Perc
ent o
f Tot
al M
iles
by G
roup
Unmapped Streams Awareness Mapping
The percentages shown for each category are percentage of the total of that specific category alone For example 135 of all of the unmapped stream miles are in the first category 541 of all the Awareness Program mapped miles are in the second category
New Management Tools
2-12
Figure 2-2
California Stream Prioritization Results
Prioritization Category Unmapped Stream Miles Miles Mapped by
Since FEMA issued its July 30 1997 Modernizing FEMArsquos Flood Hazard Mapping
Program report FEMA and its mapping partners have been laying the groundwork for
implementing the Map Modernization Plan In Fiscal Years 2003-2006 the initial
upgrade of the inventory will be underway In planning the flood map upgrades FEMA
will address the following Government Performance Results Act (GPRA) performance
measures suggested by the Office of Management and Budget (OMB) for the proposed
funding for flood map modernization
bull Reducing the average age of the maps to 6 years (current average age of maps is
136 years)
bull Producing digital mapping products with up-to-date flood hazard data for the top
15 of highest priority areas
bull Developing flood maps for half of the unmapped flood prone communities and
bull Encouraging statelocal cost sharing on flood mapping projects
To identify the streams with the highest priorities for studies FEMA has developed a
software application that stores all identified needs nationally performs a benefit cost
analysis and ranks the identified map maintenance needs and flood data update needs for
each community This software application is known as the MNUSS program FEMA
uses this software to assist in its annual selection of new flood studies to be done under
the map modernization initiative
Communities can update their information in the MNUSS database at any time This
special effort is being made now to assure that FEMA has reasonably updated
information to use in selecting new studies to be accomplished using the map
modernization funds allocated for FY-2003
New Management Tools
3-2
32 DWRrsquos Role
This work assignment followed an earlier one during which URS provided electronic
files containing the MNUSS worksheets to about 150 communities This effort was done
in concert with on-going solicitations being performed by FEMA The completed
worksheets were then included in a report submitted to FEMA in 2002 The advantage of
following this approach was that community officials had more time to review their
needs for updated or new flood hazard mapping and to complete the MNUSS worksheets
In addition during the two series of visits to the communities officials had the
opportunity to ask any remaining questions about the MNUSS program the worksheets
and the differences between the DWR AFMP and FEMA Map Modernization Plan
DWR tasked URS to continue soliciting MNUSS information from the communities
The completed worksheets which are necessary for input in the FEMA MNUSS database
for prioritizing potential future detailed floodplain mapping studies were collected
During the community visits conducted by URS community officials were reminded of
the need to submit their priority areas to FEMA for study and detailed mapping by
completing the MNUSS worksheets
Some communities had the impression that DWRrsquos involvement in a FEMA initiative
was an added level of unneeded administration URS explained that DWRrsquos involvement
would result in a more effective communication of the communitiesrsquo needs to FEMA
and that this is an opportunity for the community to resolve existing as well as new
mapping issues
New Management Tools
4-1
40 Community Outreach
41 The Process
In an effort by DWR to improve communication with local communities throughout the
state URS was tasked to take the opportunity during two series of community visits to
have an open discussion with the local officials about the current level of communication
with DWR and means for improving coordination The discussions revolved around
three central issues related to general communication with DWR communication related
to all floodplain mapping efforts and communication related to the AFMP
bull What does the community think of the current level of communication with
DWR
bull What weaknesses can the community identify in DWRrsquos communication
programs
bull What measures would the community recommend DWR take to improve its
communication with the local communities
42 The Findings
In general visits to the communities by URS staff were well received and communication
of information was welcomed Community representatives appreciated having this
opportunity for a ldquodialoguerdquo and felt comfortable to discuss their communitiesrsquo flood
related issues Appendix A at the end of this report includes all of the meeting minutes
from the visits to the communities
During these visits input was received when questions related to communication with
DWR were asked and the range of responses received was as follows
bull Pleased with the level of communication as it stands now
New Management Tools
4-2
bull Pleased with the level of communication as it stands now but see room for
improvement
bull Indifferent to any communication with DWR
bull Unhappy with the level of communication as it stands now and would like to see
significant steps taken to improve it and
bull Not interested in any communication with DWR
A general conclusion drawn from meetings with the various communities was that there
is a lack of knowledge of the role of DWR its programs and the services it provides
Community officials often asked about DWRrsquos programs DWRrsquos organizational chart
DWRrsquos funding and grant programs and the identified and clear points of contact within
DWR for the different programs Communities also were interested in the role DWR can
play in supporting them as they deal with federal agencies
Community officials expressed their pressing need for additional and updated detailed
mapping studies They also shared the challenges they are facing in managing
development within Special Flood Hazard Areas studied by approximate methods which
lack any information about water surface elevations
43 Recommended Actions
To address the suggestions and concerns provided by the communities visited the
following few methods can be adopted by DWR to improve communication
bull Establish a frequent communication process to serve as a venue for the
dissemination of useful relevant information to the communities and to provide
them with more opportunities to interact with DWR This could be in the form of
a regular monthly or quarterly electronic transmittal that includes information
about DWR programs contact information funding mechanisms existing and
upcoming grant programs and available technical support This transmittal could
include information about other agencies or programs with which DWR programs
New Management Tools
4-3
are connected such as the Reclamation Board CALFED California Department
of Fish and Game the USACE and FEMA
This scheduled transmittal should have an established and professional format that
is easy to follow appeals to the reader and provides electronic links to the
locations of beneficial information other programs and contact personnel This
transmittal should also provide the recipient with the opportunity to comment on
the contents and submit questions and feedback
bull Periodic visits should be performed by DWR For example in conjunction with
the Community Assistance Visits (CAV) a small-scale conference could be
arranged that would combine attendees from neighboring communities At this
ldquomini conferencerdquo staff could provide an overview of DWRrsquos programs address
communities issues or concerns and provide an opportunity for open discussion
and continuing communication
bull Training seminars could be presented to improve the technical and regulatory
knowledge of local community officials Examples include training seminars
related to hydrology and hydraulics AFMP process FEMArsquos role and its
mapping process USACErsquos role Reclamation Boardrsquos role and different
permitting processes Speakers and lecturers from outside of DWR with
experience in the proposed training could be invited to help during these seminars
and provide in-depth technical and regulatory information
New Management Tools
5-1
50 Conclusion and Future Steps
51 Awareness Floodplain Mapping Program
The AFMP stream prioritization results will lead to the more efficient use of available
funds for mapping higher priority streams first The results will help focus the effort and
organize the work of the different entities responsible for the awareness mapping in the
different counties in California The combination of the GIS stream prioritization results
with the communitiesrsquo priority areas for flood hazard mapping will result in a more
beneficial mapping effort and ultimately keep people out of harmrsquos way and reduce
property damage
The utilization of the stream prioritization results could be useful in the following areas
in addition to the purposes of the AFMP
bull In support of FEMArsquos mapping efforts under the Map Modernization Plan Since
the Q3 data are already included as one of the layers (see Appendix A) the
highest priority streams could be targeted first for updating existing FEMA maps
in areas requested by communities through the MNUSS program
bull As an element of the communitiesrsquo general plans This information could help
communities direct their future development away from high flood hazard areas
bull As boilerplate for other efforts that require a similar prioritization process The
database of roads populated places areas of growth potential and waterways that
has been developed could prove valuable to these efforts
52 Support of FEMA Map Modernization Plan
Discussions related to the MNUSS program helped emphasize to the communities the
need to complete the MNUSS work sheets which is the means of communicating the
communities detailed mapping needs and revisions to existing FEMA mapping These
visits were also an opportunity to distinguish between FEMA mapping program and
New Management Tools
5-2
process and the AFMP clarify that the AFMP was not intended to re-map areas already
studied by FEMA and the difference between the AFMP and the MNUSS prioritization
processes
As communities complete the MNUSS work sheets they will be forwarded to FEMA to
be used for updating the MNUSS program information FEMA will then be responsible
for follow up with the communities for more information related to their work sheet
submittals and for initiating performing and funding for updating existing FIRMs or
new detailed studies DWR will continue in the role of a leading supporter for the FEMA
Map Modernization Plan in the State of California
53 Improved Community Outreach
Using the opportunity of two series of meetings with local community officials to discuss
means of improving communication with DWR has proved highly beneficial The input
received from the communities can be used to close the communication gaps between
DWR and the communities not only during the AFMP work but also in the longer term
to establish a long-lasting and effective communication process
Future steps related to improving communication between DWR and California
communities will include the initiation of an electronic transmittal that will be forwarded
to community officials via electronic mail This letter will improve the knowledge of
California local officials in the different DWR programs the AFMP FEMA and other
agencies programs and initiatives available funding sources and training and seminar
information DWR could also provide liaison between California communities and
federal agencies such as FEMA and the USACE on floodplain management issues
including pre-disaster mitigation
New Management Tools
2-5
2 An area having permanent protection from conversion of natural land cover and a mandated management plan in operation to maintain a primarily natural state but which may receive use or management practices that degrade the quality of existing natural communities
3 An area having permanent protection from conversion of natural land cover for the majority of the area but subject to extractive uses of either a broad low-intensity type or localized intense type It also confers protection to federally listed endangered and threatened species throughout the area
4 Lack of irrevocable easement or mandate to prevent conversion of natural habitat types to anthropogenic habitat types and allow for intensive use throughout the tract or existence of such restrictions is unknown
bull FEMA-Mapped Floodplains Floodplain shapefiles were obtained including
coverages provided by FEMA (Q3 data through 1996) and coverage depicting
awareness floodplain mapping accomplished to-date
24 Stream Prioritization Assessment Procedure
Proximity of streams to populated places is one of the prioritization factors The
following process was used to establish priorities for this factor Distance coverages
which consist of grids of values identifying the distance from any point within the
coverage to the nearest populated place were created first Next the streams were
overlain on these maps and the endpoints of the stream reaches were queried to
determine the value of the underlying distance grid The average value of the two
endpoint values are then associated with that given stream reach in the accompanying
database table
Similar procedures were used to establish priorities associated with population growth
and development potential factors Stream lines were overlain on polygon coverages of
growth and GAP coverages and each stream reachrsquos database table was updated to
reflect the value of the underlying coverage
The fourth prioritization factor is proximity to roads Developing priorities for this factor
were accomplished in a similar way except that major and minor roads were
New Management Tools
2-6
differentiated Major roads were defined as primary transportation corridors ranging
from federal to state and county roads minor roads were defined as private and unnamed
public roads Again a proximity grid was established for major and minor roads
throughout the state and streams were overlain against this grid to ascertain their
proximity to the nearest road
The end result of the querying procedures was an updated database table for the stream
reaches that reflects values associated with proximity to populated places proximity to
major and minor roads recent population growth in the local vicinity and development
potential Each of these data were then normalized on a scale of 1 to 4 (2 to 5 for minor
roads) according to the following formulas
Town Proximity
0-1 mile 1-2 miles 2-3 miles gt 3 miles
Priority 1 2 3 4
Road Proximity
Priority
0 ndash 05 mile
05 ndash 10 miles 10 ndash 15 miles
gt 15 miles
Major Roads 1 2 3 4
Minor Roads 2 3 4 5
Change in Population Density
(People per square mile)
gt 1000 500 ndash 1000
0 ndash 500 Negative
Priority
1 2 3 4
GAP Status
4 3 2 1
Priority
1 2 3 4
New Management Tools
2-7
The sum of the values for each factor provides a summary prioritization factor that varies
from a low of 4 to a high of 21 with the lower values reflecting higher priority
Stream reach shapefiles were then color coded according to those priorities and overlain
on maps depicting floodplains mapped by FEMA (Q3 data through 1996) previous
awareness floodplain mapping and the community areas of preference for future
awareness floodplain mapping Future mapping efforts may be directed following the
priorities indicated for the remaining unmapped reaches
25 Results
The results of the stream prioritization process for the AFMP are included in Appendix
A The first figure depicts the results of the stream prioritization The next figure shows
the same first figure overlain by FEMA mapping data (Q3 data through 1996) AFMP
mapping data and polygons of areas of interest identified by the communities
The stream analysis results show that prior to commencing the statewide AFMP there
were approximately 153000 unmapped stream miles in the state At the time of
performing this analysis approximately 5900 stream miles had been mapped through the
Awareness Mapping Program This number has increased to approximately 13000
stream miles mapped at the time this final report was released
Table 2-1 lists by county the total number of unmapped stream miles and the number of
stream miles mapped by the AFMP
Figure 2-1 shows the stream miles the AFMP have mapped and where those stream miles
fall within the four prioritization categories A graph that compares prioritization
distributions by category for total unmapped streams and awareness floodplain mapping
is included
Figure 2-2 shows the percentages of AFMP miles and remaining miles for each of the
four ranking categories The results indicate that approximately 7 of the Priority 1
unmapped stream miles have been mapped through the AFMP This leaves
New Management Tools
2-8
approximately 19000 Priority 1stream miles to be mapped before Priority 2 stream miles
are mapped
Figures 2-3 and 2-4 show remaining stream miles for Categories 1 and 2 by county This
is the future Awareness Floodplain Mapping Program
It should be noted that the input received from the communities in the form of ldquoselectiverdquo
areas of interest for awareness mapping might cover stream miles of a lower priority than
Priority 1 streams This is because communities have a better understanding of the
activities and prioritization elements pertaining to their own communities and citizens
Community input also could be viewed as a quality assurance factor that improves the
applicability of the prioritization results
New Management Tools
2-9
TABLE 2-1
Total Number of County Unmapped Stream Miles and Mapped by the
Awareness Floodplain Mapping Program (as of May 2003)
County Unmapped Stream Miles Mapped by Awareness ProgramAlameda 897 0 Alpine 1033 101 Amador 862 325
Butte 1735 67
Calaveras 1829 732
Colusa 757 0
Contra Costa 383 0
Del Norte 1100 30 El Dorado 2423 0 Fresno 5026 0 Glenn 1557 0
County Unmapped Stream Miles Mapped by Awareness ProgramSacramento 566 364 San Benito 2070 602 San Bernardino 19530 0 San Diego 5120 0 San Francisco 20 0 San Joaquin 672 0 San Luis Obispo 3467 0 San Mateo 556 0 Santa Barbara 3857 559 Santa Clara 1274 257 Santa Cruz 433 0 Shasta 3327 0 Sierra 1270 0 Siskiyou 4430 0 Solano 338 161 Sonoma 1743 0 Stanislaus 1539 711 Sutter 179 0 Tehama 3287 30 Trinity 3631 0 Tuolumne 2981 0 Tulare 3634 0 Ventura 2643 136 Yolo 472 0
Yuba 618 0
TOTAL 152797 5891 Not participating in the NFIP County does not wish to participate in the AFMP Total number of stream miles mapped under the AFMP at the time of completing the stream prioritization methodology analysis This number has increased to reach approximately 13000 stream miles at the time of releasing this report
New Management Tools
2-11
Figure 2-1
Distribution of Stream Miles by Prioritization Category All Unmapped Stream Miles vs Stream Miles Mapped by Awareness Floodplain
Mapping Program
Stream Miles by Prioritization Category Group of Streams 1st 2nd 3rd 4th Total
All Unmapped Streams 20629 58885 40258 33025 152797
Awareness Mapping 1498 3188 1057 149 5891
State of CaliforniaComparison of Prioritization Distribution
216
263
385
135
254
541
25
179
0
10
20
30
40
50
60
1st 2nd 3rd 4th
Prioritization Category
Perc
ent o
f Tot
al M
iles
by G
roup
Unmapped Streams Awareness Mapping
The percentages shown for each category are percentage of the total of that specific category alone For example 135 of all of the unmapped stream miles are in the first category 541 of all the Awareness Program mapped miles are in the second category
New Management Tools
2-12
Figure 2-2
California Stream Prioritization Results
Prioritization Category Unmapped Stream Miles Miles Mapped by
Since FEMA issued its July 30 1997 Modernizing FEMArsquos Flood Hazard Mapping
Program report FEMA and its mapping partners have been laying the groundwork for
implementing the Map Modernization Plan In Fiscal Years 2003-2006 the initial
upgrade of the inventory will be underway In planning the flood map upgrades FEMA
will address the following Government Performance Results Act (GPRA) performance
measures suggested by the Office of Management and Budget (OMB) for the proposed
funding for flood map modernization
bull Reducing the average age of the maps to 6 years (current average age of maps is
136 years)
bull Producing digital mapping products with up-to-date flood hazard data for the top
15 of highest priority areas
bull Developing flood maps for half of the unmapped flood prone communities and
bull Encouraging statelocal cost sharing on flood mapping projects
To identify the streams with the highest priorities for studies FEMA has developed a
software application that stores all identified needs nationally performs a benefit cost
analysis and ranks the identified map maintenance needs and flood data update needs for
each community This software application is known as the MNUSS program FEMA
uses this software to assist in its annual selection of new flood studies to be done under
the map modernization initiative
Communities can update their information in the MNUSS database at any time This
special effort is being made now to assure that FEMA has reasonably updated
information to use in selecting new studies to be accomplished using the map
modernization funds allocated for FY-2003
New Management Tools
3-2
32 DWRrsquos Role
This work assignment followed an earlier one during which URS provided electronic
files containing the MNUSS worksheets to about 150 communities This effort was done
in concert with on-going solicitations being performed by FEMA The completed
worksheets were then included in a report submitted to FEMA in 2002 The advantage of
following this approach was that community officials had more time to review their
needs for updated or new flood hazard mapping and to complete the MNUSS worksheets
In addition during the two series of visits to the communities officials had the
opportunity to ask any remaining questions about the MNUSS program the worksheets
and the differences between the DWR AFMP and FEMA Map Modernization Plan
DWR tasked URS to continue soliciting MNUSS information from the communities
The completed worksheets which are necessary for input in the FEMA MNUSS database
for prioritizing potential future detailed floodplain mapping studies were collected
During the community visits conducted by URS community officials were reminded of
the need to submit their priority areas to FEMA for study and detailed mapping by
completing the MNUSS worksheets
Some communities had the impression that DWRrsquos involvement in a FEMA initiative
was an added level of unneeded administration URS explained that DWRrsquos involvement
would result in a more effective communication of the communitiesrsquo needs to FEMA
and that this is an opportunity for the community to resolve existing as well as new
mapping issues
New Management Tools
4-1
40 Community Outreach
41 The Process
In an effort by DWR to improve communication with local communities throughout the
state URS was tasked to take the opportunity during two series of community visits to
have an open discussion with the local officials about the current level of communication
with DWR and means for improving coordination The discussions revolved around
three central issues related to general communication with DWR communication related
to all floodplain mapping efforts and communication related to the AFMP
bull What does the community think of the current level of communication with
DWR
bull What weaknesses can the community identify in DWRrsquos communication
programs
bull What measures would the community recommend DWR take to improve its
communication with the local communities
42 The Findings
In general visits to the communities by URS staff were well received and communication
of information was welcomed Community representatives appreciated having this
opportunity for a ldquodialoguerdquo and felt comfortable to discuss their communitiesrsquo flood
related issues Appendix A at the end of this report includes all of the meeting minutes
from the visits to the communities
During these visits input was received when questions related to communication with
DWR were asked and the range of responses received was as follows
bull Pleased with the level of communication as it stands now
New Management Tools
4-2
bull Pleased with the level of communication as it stands now but see room for
improvement
bull Indifferent to any communication with DWR
bull Unhappy with the level of communication as it stands now and would like to see
significant steps taken to improve it and
bull Not interested in any communication with DWR
A general conclusion drawn from meetings with the various communities was that there
is a lack of knowledge of the role of DWR its programs and the services it provides
Community officials often asked about DWRrsquos programs DWRrsquos organizational chart
DWRrsquos funding and grant programs and the identified and clear points of contact within
DWR for the different programs Communities also were interested in the role DWR can
play in supporting them as they deal with federal agencies
Community officials expressed their pressing need for additional and updated detailed
mapping studies They also shared the challenges they are facing in managing
development within Special Flood Hazard Areas studied by approximate methods which
lack any information about water surface elevations
43 Recommended Actions
To address the suggestions and concerns provided by the communities visited the
following few methods can be adopted by DWR to improve communication
bull Establish a frequent communication process to serve as a venue for the
dissemination of useful relevant information to the communities and to provide
them with more opportunities to interact with DWR This could be in the form of
a regular monthly or quarterly electronic transmittal that includes information
about DWR programs contact information funding mechanisms existing and
upcoming grant programs and available technical support This transmittal could
include information about other agencies or programs with which DWR programs
New Management Tools
4-3
are connected such as the Reclamation Board CALFED California Department
of Fish and Game the USACE and FEMA
This scheduled transmittal should have an established and professional format that
is easy to follow appeals to the reader and provides electronic links to the
locations of beneficial information other programs and contact personnel This
transmittal should also provide the recipient with the opportunity to comment on
the contents and submit questions and feedback
bull Periodic visits should be performed by DWR For example in conjunction with
the Community Assistance Visits (CAV) a small-scale conference could be
arranged that would combine attendees from neighboring communities At this
ldquomini conferencerdquo staff could provide an overview of DWRrsquos programs address
communities issues or concerns and provide an opportunity for open discussion
and continuing communication
bull Training seminars could be presented to improve the technical and regulatory
knowledge of local community officials Examples include training seminars
related to hydrology and hydraulics AFMP process FEMArsquos role and its
mapping process USACErsquos role Reclamation Boardrsquos role and different
permitting processes Speakers and lecturers from outside of DWR with
experience in the proposed training could be invited to help during these seminars
and provide in-depth technical and regulatory information
New Management Tools
5-1
50 Conclusion and Future Steps
51 Awareness Floodplain Mapping Program
The AFMP stream prioritization results will lead to the more efficient use of available
funds for mapping higher priority streams first The results will help focus the effort and
organize the work of the different entities responsible for the awareness mapping in the
different counties in California The combination of the GIS stream prioritization results
with the communitiesrsquo priority areas for flood hazard mapping will result in a more
beneficial mapping effort and ultimately keep people out of harmrsquos way and reduce
property damage
The utilization of the stream prioritization results could be useful in the following areas
in addition to the purposes of the AFMP
bull In support of FEMArsquos mapping efforts under the Map Modernization Plan Since
the Q3 data are already included as one of the layers (see Appendix A) the
highest priority streams could be targeted first for updating existing FEMA maps
in areas requested by communities through the MNUSS program
bull As an element of the communitiesrsquo general plans This information could help
communities direct their future development away from high flood hazard areas
bull As boilerplate for other efforts that require a similar prioritization process The
database of roads populated places areas of growth potential and waterways that
has been developed could prove valuable to these efforts
52 Support of FEMA Map Modernization Plan
Discussions related to the MNUSS program helped emphasize to the communities the
need to complete the MNUSS work sheets which is the means of communicating the
communities detailed mapping needs and revisions to existing FEMA mapping These
visits were also an opportunity to distinguish between FEMA mapping program and
New Management Tools
5-2
process and the AFMP clarify that the AFMP was not intended to re-map areas already
studied by FEMA and the difference between the AFMP and the MNUSS prioritization
processes
As communities complete the MNUSS work sheets they will be forwarded to FEMA to
be used for updating the MNUSS program information FEMA will then be responsible
for follow up with the communities for more information related to their work sheet
submittals and for initiating performing and funding for updating existing FIRMs or
new detailed studies DWR will continue in the role of a leading supporter for the FEMA
Map Modernization Plan in the State of California
53 Improved Community Outreach
Using the opportunity of two series of meetings with local community officials to discuss
means of improving communication with DWR has proved highly beneficial The input
received from the communities can be used to close the communication gaps between
DWR and the communities not only during the AFMP work but also in the longer term
to establish a long-lasting and effective communication process
Future steps related to improving communication between DWR and California
communities will include the initiation of an electronic transmittal that will be forwarded
to community officials via electronic mail This letter will improve the knowledge of
California local officials in the different DWR programs the AFMP FEMA and other
agencies programs and initiatives available funding sources and training and seminar
information DWR could also provide liaison between California communities and
federal agencies such as FEMA and the USACE on floodplain management issues
including pre-disaster mitigation
New Management Tools
2-10
County Unmapped Stream Miles Mapped by Awareness ProgramSacramento 566 364 San Benito 2070 602 San Bernardino 19530 0 San Diego 5120 0 San Francisco 20 0 San Joaquin 672 0 San Luis Obispo 3467 0 San Mateo 556 0 Santa Barbara 3857 559 Santa Clara 1274 257 Santa Cruz 433 0 Shasta 3327 0 Sierra 1270 0 Siskiyou 4430 0 Solano 338 161 Sonoma 1743 0 Stanislaus 1539 711 Sutter 179 0 Tehama 3287 30 Trinity 3631 0 Tuolumne 2981 0 Tulare 3634 0 Ventura 2643 136 Yolo 472 0
Yuba 618 0
TOTAL 152797 5891 Not participating in the NFIP County does not wish to participate in the AFMP Total number of stream miles mapped under the AFMP at the time of completing the stream prioritization methodology analysis This number has increased to reach approximately 13000 stream miles at the time of releasing this report
New Management Tools
2-11
Figure 2-1
Distribution of Stream Miles by Prioritization Category All Unmapped Stream Miles vs Stream Miles Mapped by Awareness Floodplain
Mapping Program
Stream Miles by Prioritization Category Group of Streams 1st 2nd 3rd 4th Total
All Unmapped Streams 20629 58885 40258 33025 152797
Awareness Mapping 1498 3188 1057 149 5891
State of CaliforniaComparison of Prioritization Distribution
216
263
385
135
254
541
25
179
0
10
20
30
40
50
60
1st 2nd 3rd 4th
Prioritization Category
Perc
ent o
f Tot
al M
iles
by G
roup
Unmapped Streams Awareness Mapping
The percentages shown for each category are percentage of the total of that specific category alone For example 135 of all of the unmapped stream miles are in the first category 541 of all the Awareness Program mapped miles are in the second category
New Management Tools
2-12
Figure 2-2
California Stream Prioritization Results
Prioritization Category Unmapped Stream Miles Miles Mapped by
Since FEMA issued its July 30 1997 Modernizing FEMArsquos Flood Hazard Mapping
Program report FEMA and its mapping partners have been laying the groundwork for
implementing the Map Modernization Plan In Fiscal Years 2003-2006 the initial
upgrade of the inventory will be underway In planning the flood map upgrades FEMA
will address the following Government Performance Results Act (GPRA) performance
measures suggested by the Office of Management and Budget (OMB) for the proposed
funding for flood map modernization
bull Reducing the average age of the maps to 6 years (current average age of maps is
136 years)
bull Producing digital mapping products with up-to-date flood hazard data for the top
15 of highest priority areas
bull Developing flood maps for half of the unmapped flood prone communities and
bull Encouraging statelocal cost sharing on flood mapping projects
To identify the streams with the highest priorities for studies FEMA has developed a
software application that stores all identified needs nationally performs a benefit cost
analysis and ranks the identified map maintenance needs and flood data update needs for
each community This software application is known as the MNUSS program FEMA
uses this software to assist in its annual selection of new flood studies to be done under
the map modernization initiative
Communities can update their information in the MNUSS database at any time This
special effort is being made now to assure that FEMA has reasonably updated
information to use in selecting new studies to be accomplished using the map
modernization funds allocated for FY-2003
New Management Tools
3-2
32 DWRrsquos Role
This work assignment followed an earlier one during which URS provided electronic
files containing the MNUSS worksheets to about 150 communities This effort was done
in concert with on-going solicitations being performed by FEMA The completed
worksheets were then included in a report submitted to FEMA in 2002 The advantage of
following this approach was that community officials had more time to review their
needs for updated or new flood hazard mapping and to complete the MNUSS worksheets
In addition during the two series of visits to the communities officials had the
opportunity to ask any remaining questions about the MNUSS program the worksheets
and the differences between the DWR AFMP and FEMA Map Modernization Plan
DWR tasked URS to continue soliciting MNUSS information from the communities
The completed worksheets which are necessary for input in the FEMA MNUSS database
for prioritizing potential future detailed floodplain mapping studies were collected
During the community visits conducted by URS community officials were reminded of
the need to submit their priority areas to FEMA for study and detailed mapping by
completing the MNUSS worksheets
Some communities had the impression that DWRrsquos involvement in a FEMA initiative
was an added level of unneeded administration URS explained that DWRrsquos involvement
would result in a more effective communication of the communitiesrsquo needs to FEMA
and that this is an opportunity for the community to resolve existing as well as new
mapping issues
New Management Tools
4-1
40 Community Outreach
41 The Process
In an effort by DWR to improve communication with local communities throughout the
state URS was tasked to take the opportunity during two series of community visits to
have an open discussion with the local officials about the current level of communication
with DWR and means for improving coordination The discussions revolved around
three central issues related to general communication with DWR communication related
to all floodplain mapping efforts and communication related to the AFMP
bull What does the community think of the current level of communication with
DWR
bull What weaknesses can the community identify in DWRrsquos communication
programs
bull What measures would the community recommend DWR take to improve its
communication with the local communities
42 The Findings
In general visits to the communities by URS staff were well received and communication
of information was welcomed Community representatives appreciated having this
opportunity for a ldquodialoguerdquo and felt comfortable to discuss their communitiesrsquo flood
related issues Appendix A at the end of this report includes all of the meeting minutes
from the visits to the communities
During these visits input was received when questions related to communication with
DWR were asked and the range of responses received was as follows
bull Pleased with the level of communication as it stands now
New Management Tools
4-2
bull Pleased with the level of communication as it stands now but see room for
improvement
bull Indifferent to any communication with DWR
bull Unhappy with the level of communication as it stands now and would like to see
significant steps taken to improve it and
bull Not interested in any communication with DWR
A general conclusion drawn from meetings with the various communities was that there
is a lack of knowledge of the role of DWR its programs and the services it provides
Community officials often asked about DWRrsquos programs DWRrsquos organizational chart
DWRrsquos funding and grant programs and the identified and clear points of contact within
DWR for the different programs Communities also were interested in the role DWR can
play in supporting them as they deal with federal agencies
Community officials expressed their pressing need for additional and updated detailed
mapping studies They also shared the challenges they are facing in managing
development within Special Flood Hazard Areas studied by approximate methods which
lack any information about water surface elevations
43 Recommended Actions
To address the suggestions and concerns provided by the communities visited the
following few methods can be adopted by DWR to improve communication
bull Establish a frequent communication process to serve as a venue for the
dissemination of useful relevant information to the communities and to provide
them with more opportunities to interact with DWR This could be in the form of
a regular monthly or quarterly electronic transmittal that includes information
about DWR programs contact information funding mechanisms existing and
upcoming grant programs and available technical support This transmittal could
include information about other agencies or programs with which DWR programs
New Management Tools
4-3
are connected such as the Reclamation Board CALFED California Department
of Fish and Game the USACE and FEMA
This scheduled transmittal should have an established and professional format that
is easy to follow appeals to the reader and provides electronic links to the
locations of beneficial information other programs and contact personnel This
transmittal should also provide the recipient with the opportunity to comment on
the contents and submit questions and feedback
bull Periodic visits should be performed by DWR For example in conjunction with
the Community Assistance Visits (CAV) a small-scale conference could be
arranged that would combine attendees from neighboring communities At this
ldquomini conferencerdquo staff could provide an overview of DWRrsquos programs address
communities issues or concerns and provide an opportunity for open discussion
and continuing communication
bull Training seminars could be presented to improve the technical and regulatory
knowledge of local community officials Examples include training seminars
related to hydrology and hydraulics AFMP process FEMArsquos role and its
mapping process USACErsquos role Reclamation Boardrsquos role and different
permitting processes Speakers and lecturers from outside of DWR with
experience in the proposed training could be invited to help during these seminars
and provide in-depth technical and regulatory information
New Management Tools
5-1
50 Conclusion and Future Steps
51 Awareness Floodplain Mapping Program
The AFMP stream prioritization results will lead to the more efficient use of available
funds for mapping higher priority streams first The results will help focus the effort and
organize the work of the different entities responsible for the awareness mapping in the
different counties in California The combination of the GIS stream prioritization results
with the communitiesrsquo priority areas for flood hazard mapping will result in a more
beneficial mapping effort and ultimately keep people out of harmrsquos way and reduce
property damage
The utilization of the stream prioritization results could be useful in the following areas
in addition to the purposes of the AFMP
bull In support of FEMArsquos mapping efforts under the Map Modernization Plan Since
the Q3 data are already included as one of the layers (see Appendix A) the
highest priority streams could be targeted first for updating existing FEMA maps
in areas requested by communities through the MNUSS program
bull As an element of the communitiesrsquo general plans This information could help
communities direct their future development away from high flood hazard areas
bull As boilerplate for other efforts that require a similar prioritization process The
database of roads populated places areas of growth potential and waterways that
has been developed could prove valuable to these efforts
52 Support of FEMA Map Modernization Plan
Discussions related to the MNUSS program helped emphasize to the communities the
need to complete the MNUSS work sheets which is the means of communicating the
communities detailed mapping needs and revisions to existing FEMA mapping These
visits were also an opportunity to distinguish between FEMA mapping program and
New Management Tools
5-2
process and the AFMP clarify that the AFMP was not intended to re-map areas already
studied by FEMA and the difference between the AFMP and the MNUSS prioritization
processes
As communities complete the MNUSS work sheets they will be forwarded to FEMA to
be used for updating the MNUSS program information FEMA will then be responsible
for follow up with the communities for more information related to their work sheet
submittals and for initiating performing and funding for updating existing FIRMs or
new detailed studies DWR will continue in the role of a leading supporter for the FEMA
Map Modernization Plan in the State of California
53 Improved Community Outreach
Using the opportunity of two series of meetings with local community officials to discuss
means of improving communication with DWR has proved highly beneficial The input
received from the communities can be used to close the communication gaps between
DWR and the communities not only during the AFMP work but also in the longer term
to establish a long-lasting and effective communication process
Future steps related to improving communication between DWR and California
communities will include the initiation of an electronic transmittal that will be forwarded
to community officials via electronic mail This letter will improve the knowledge of
California local officials in the different DWR programs the AFMP FEMA and other
agencies programs and initiatives available funding sources and training and seminar
information DWR could also provide liaison between California communities and
federal agencies such as FEMA and the USACE on floodplain management issues
including pre-disaster mitigation
New Management Tools
2-11
Figure 2-1
Distribution of Stream Miles by Prioritization Category All Unmapped Stream Miles vs Stream Miles Mapped by Awareness Floodplain
Mapping Program
Stream Miles by Prioritization Category Group of Streams 1st 2nd 3rd 4th Total
All Unmapped Streams 20629 58885 40258 33025 152797
Awareness Mapping 1498 3188 1057 149 5891
State of CaliforniaComparison of Prioritization Distribution
216
263
385
135
254
541
25
179
0
10
20
30
40
50
60
1st 2nd 3rd 4th
Prioritization Category
Perc
ent o
f Tot
al M
iles
by G
roup
Unmapped Streams Awareness Mapping
The percentages shown for each category are percentage of the total of that specific category alone For example 135 of all of the unmapped stream miles are in the first category 541 of all the Awareness Program mapped miles are in the second category
New Management Tools
2-12
Figure 2-2
California Stream Prioritization Results
Prioritization Category Unmapped Stream Miles Miles Mapped by