www.state.co.us/ospb • Information: [email protected]MEMORANDUM TO: Governor Bill Owens Members of the General Assembly FROM: Office of State Planning and Budgeting DATE: March 21, 2005 SUBJECT: March 2005 Revenue Forecast Attached is the Office of State Planning and Budgeting (OSPB) March 2005 revenue forecast. Included is a discussion of the Taxpayer’s Bill of Rights (TABOR) limit as provided in Article X, Section 20 of the Colorado Constitution. Also provided are General Fund overviews, General Fund and cash fund revenue forecasts, and summaries of both the national and Colorado economic forecasts. STATE OF COLORADO OFFICE OF STATE PLANNING AND BUDGETING 111 State Capitol Building Denver, Colorado 80203 (303) 866-3317 Bill Owens Governor Henry R. Sobanet Director March 2005 OSPB Forecast Highlights • In FY 2005-06, the TABOR limit is 1.3 percent and the TABOR surplus reappears, totaling $98.8 million. From FY 2006-07 through the remainder of the forecast, we expect the TABOR surplus to range between $240 million and $630 million. TABOR surpluses are reduced compared with the December 2004 because of changes to the revenue forecasts, the childcare tax credit allowed per House Bill 00-1351, and a previous error in determining the federal estate tax repeal date. • Based on the March 2005 OSPB revenue projections and FY 2004-05 supplemental expenditures approved to date, the state will have enough General Fund revenue to meet the statutory four percent reserve. However, the General Assembly must either make substantial cuts to the Governor’s FY 2005-06 budget request or pass legislation to provide additional revenue sources to support FY 2005-06 expenditures. • General Fund revenues are forecast to increase 2.6 percent in FY 2004-05 and 4.6 percent in FY 2005-06. • Cash fund revenues are forecast to increase 9.7 percent in FY 2004-05 and experience flat growth in FY 2005-06. In FY 2004-05, unemployment insurance tax revenue growth drives total cash fund revenue growth. • The national economy continues to strengthen. Inflation-adjusted gross domestic product is growing at a healthy pace, inflationary pressures remain moderate, and payrolls are increasing. • The underlying assumptions for the March 2005 OSPB Colorado economic forecast have not changed materially since the release of the December 2004 forecast. The state’s labor markets are recovering and Colorado economic activity is accelerating.
TO: Governor Bill Owens Members of the General Assembly
FROM: Office of State Planning and Budgeting
DATE: March 21, 2005
SUBJECT: March 2005 Revenue Forecast
Attached is the Office of State Planning and Budgeting (OSPB) March 2005 revenue forecast. Included is a discussion of the Taxpayer’s Bill of Rights (TABOR) limit as provided in Article X, Section 20 of the Colorado Constitution. Also provided are General Fund overviews, General Fund and cash fund revenue forecasts, and summaries of both the national and Colorado economic forecasts.
STATE OF COLORADOOFFICE OF STATE PLANNING AND BUDGETING 111 State Capitol Building Denver, Colorado 80203 (303) 866-3317
Bill Owens Governor
Henry R. Sobanet Director
March 2005 OSPB Forecast Highlights
• In FY 2005-06, the TABOR limit is 1.3 percent and the TABOR surplus reappears, totaling $98.8 million. From FY 2006-07 through the remainder of the forecast, we expect the TABOR surplus to range between $240 million and $630 million. TABOR surpluses are reduced compared with the December 2004 because of changes to the revenue forecasts, the childcare tax credit allowed per House Bill 00-1351, and a previous error in determining the federal estate tax repeal date.
• Based on the March 2005 OSPB revenue projections and FY 2004-05 supplemental expenditures approved to date, the state will have enough General Fund revenue to meet the statutory four percent reserve. However, the General Assembly must either make substantial cuts to the Governor’s FY 2005-06 budget request or pass legislation to provide additional revenue sources to support FY 2005-06 expenditures.
• General Fund revenues are forecast to increase 2.6 percent in FY 2004-05 and 4.6 percent in FY 2005-06.
• Cash fund revenues are forecast to increase 9.7 percent in FY 2004-05 and experience flat growth in FY 2005-06. In FY 2004-05, unemployment insurance tax revenue growth drives total cash fund revenue growth.
• The national economy continues to strengthen. Inflation-adjusted gross domestic product is growing at a healthy pace, inflationary pressures remain moderate, and payrolls are increasing.
• The underlying assumptions for the March 2005 OSPB Colorado economic forecast have not changed materially since the release of the December 2004 forecast. The state’s labor markets are recovering and Colorado economic activity is accelerating.
Colorado Economic Perspective — March 21, 2005 TABOR/General Fund
Office of State Planning and Budgeting 1
This section provides a summary of the March 2005 Office of State Planning and Budgeting (OSPB) General Fund revenue and expenditure outlook. First, it discusses the limits contained in the Taxpayer’s Bill of Rights (TABOR) — Article X, Section 20 of the Colorado Constitution. Next, it provides a General Fund overview. Finally, the section discusses the OSPB General Fund revenue forecast.
The TABOR Surplus
The Taxpayer’s Bill of Rights (TABOR) — Article X, Section 20 of the Colorado Constitution — limits the state’s revenue growth to the sum of inflation plus population growth in the previous calendar year. Table 1 displays the expected TABOR surpluses through the forecast horizon, while Table 2 provides a detailed calculation of TABOR revenues from FY 2003-04 through FY 2009-10 under current law.
Table 1 TABOR Surplus Revenues
Based on the March 2005 OSPB Revenue Forecast (Dollar Amounts in Millions)
In FY 2005-06, the TABOR surplus reappears after a four-year absence, totaling $98.8 million. From FY 2006-07 through the remainder of the forecast, we expect the TABOR surplus to range between $240 million and $630 million. The March 2005 OSPB forecast for the FY 2004-05 TABOR surplus is $150.8 million lower than was forecast in December 2004. The decrease is primarily due to House Bill 05-1310, which adjusts how the state credits over-payments of prior years’ TABOR refunds so that the correct amount is returned to taxpayers and TABOR revenues are properly recorded. The effect of House Bill 05-1310 is to raise the FY 2002-03 base by $75 million, which permanently raises the TABOR limit thereafter by $75 million, adjusted for inflation plus population growth. The legislation also permits the state to credit against future TABOR surpluses $104 million previously over-paid to taxpayers for TABOR surpluses occurring prior to FY 2001-02. The details of this change are
In FY 2005-06, the TABOR surplus reappears, totaling $98.8 million.
The TABOR Limit and General Fund Revenue Outlook
TABOR/General Fund September 20, 2003 – Colorado Economic Perspective
2 Office of State Planning and Budgeting
March 21, 2005 — Colorado Economic Perspective
Office of State Planning and Budgeting
presented at the end of this section. Changes to the General Fund forecast are discussed at the end of this section and changes to the cash fund forecasts are discussed in the following section.
General Fund Overview
Table 3 provides an overview of General Fund revenues, expenditures, and reserves through FY 2009-10. Table 3 shows the original FY 2004-05 General Fund appropriation as well as the additional amount necessitated by supplemental bills, primarily required to fund Medicaid expenditures. Table 3 assumes current law for capital construction transfers, other transfers to the General Fund, and rebates and expenditures. It also accounts for the effects of the federal Jobs and Growth Tax Relief Reconciliation Act of 2003 on Colorado’s Medicaid program and tax receipts.
Under current law, the OSPB forecast shows that the state will have enough General Fund revenue to preserve the FY 2004-05 statutory four-percent reserve requirement specified in C.R.S. 24-75-201.1(1)(d)(III). From Table 3 it is also apparent that the General Assembly must either make substantial cuts to the Governor’s FY 2005-06 budget request or pass legislation to provide additional revenue sources to support FY 2005-06 expenditures. One such revenue source would be provided by tobacco securitization as offered in House Bill 05-1222.
Table 4 provides an overview of General Fund revenues under the House Bill 05-1194 compromise as announced at the March 17, 2005 press conference. The agreement, reached jointly by the Governor and Legislative leadership, calls for a five-year “time-out” on TABOR beginning in FY 2005-06. The TABOR limit set for FY 2010-11 will include an additional one-time $100 million increase to the base for transportation bonds. In FY 2010-11 and thereafter, when the state is in a TABOR surplus situation, the state income tax rate will be reduced to 4.5 percent from 4.63 percent.
General Fund Revenues
The forecast for General Fund revenues is shown in Table 5. The March 2005 OSPB forecast for FY 2004-05 General Fund revenues is $70.1 million lower than the December 2004 OSPB forecast and the forecast for General Fund revenues in FY 2005-06 is $128.9 million lower. We also reduced the FY 2009-10 forecast because of an error in determining the federal estate tax repeal date. This section presents the details of our forecast for General Fund revenues in FY 2004-05 and FY 2005-06.
General Fund revenues are expected to increase 2.6 percent in FY 2004-05 compared with FY 2003-04. This is a slower pace than was reported in the December 2004 OSPB economic forecast. In FY 2005-06, General Fund revenues are forecast to grow 4.6 percent, a result of the strengthening Colorado economy. However, the FY 2005-06 forecast also reflects federal tax law changes that will affect revenue growth rates. For example, net corporate income tax revenue growth in FY 2004-05 will be inflated because of the 50 percent bonus depreciation and increased small business expensing provisions of the federal Jobs and Growth Tax Relief Reconciliation Act of 2003, which will no longer be in effect in FY 2005-06.
Under current law, the OSPB forecast shows that the state will have enough General Fund revenue to preserve the FY 2004-05 statutory four percent reserve. In FY 2005-06, General Fund revenues are forecast to grow 4.6 percent.
Colorado Economic Perspective — March 21, 2005 TABOR/General Fund
Office of State Planning and Budgeting 3
Net individual income tax receipts will increase 1.0 percent in FY 2004-05 and 6.8 percent in FY 2005-06. The components of individual income taxes — withholdings, estimated payments, cash-with-returns receipts (checks mailed for income taxes due on April 15), and refunds — have stabilized compared with recent years. Indeed, year-to-date FY 2004-05 individual income tax withholdings and estimated payments are up 5.5 percent and 23.7 percent, respectively, compared with year-to-date FY 2003-04. However, we have moderated our expectations for cash-with-returns and refunds to account for year-to-date tracking. The change to the cash-with-returns and refunds forecasts has a large impact on the net individual income tax forecast because of the way accrual accounting adjustments are computed. Also, when the TABOR surplus returns in FY 2005-06, qualifying individuals can claim an additional childcare tax credit against their income taxes as per House Bill 00-1351. From FY 2005-06 through FY 2009-10, this credit will reduce TABOR revenues by a total of about $250 million, thereby lowering the cumulative TABOR surpluses refunded to taxpayers by an equal amount.
Net corporate income tax receipts rose 4.5 percent in FY 2003-04. They are forecast to increase 32.9 percent in FY 2004-05 and 1.0 percent in FY 2005-06. Net corporate income tax receipts are experiencing strong growth in FY 2004-05 as a result of the 50 percent bonus depreciation and increased small business expensing provisions of the Federal Jobs and Growth Tax Relief Reconciliation Act of 2003, which ends in 2004. We forecast that corporate income tax receipts will remain at about the same level in FY 2005-06 as they are in FY 2004-05, as the strengthening economy offsets the expiration of the depreciation and expensing provisions of the federal Jobs Act of 2003.
Sales tax revenues rose 4.0 percent in FY 2003-04 after falling 3.0 percent in FY 2002-03. Sales tax revenues are forecast to increase 4.2 percent in FY 2004-05 and 5.8 percent in FY 2005-06. Sales tax revenues are rising because of the strengthening Colorado economy, as rising payrolls increase the wages available for Colorado citizens to spend.
Changes in the Treatment of TABOR Revenues The state refunds each year’s TABOR surplus through a variety of mechanisms. Currently there are 18 refund mechanisms in addition to the TABOR sales tax refund that taxpayers collect when they file their Colorado income tax returns. Because monies are distributed through each of the mechanisms concurrently, the state has frequently refunded more money to taxpayers than the actual TABOR surplus. Since the state is not obligated to refund more than the TABOR surplus, legislation was enacted to credit the amount of the over payment to future TABOR surpluses. This legislation, enacted as C.R.S. 27-77-103.7, simply reduced revenues by the amount of the over payment, thereby lowering the amount of that year’s TABOR surplus. Unfortunately, the procedure specified in C.R.S. 27-77-103.7 did not anticipate the impact of a recession on calculations of TABOR revenues.
Because there was no TABOR surplus in FY 2001-02 and FY 2002-03, the reduction of TABOR revenues by the amount of the over payment did not result in a credit to future TABOR surpluses as had been intended. In addition, since TABOR revenues were reduced by the amount of the over payment in FY 2001-02 and FY 2002-03, the TABOR limits computed for FY 2002-03 and FY 2003-04 were too low. Indeed, in
Sales tax revenues are forecast to increase 4.2 percent in FY 2004-05 and 5.8 percent in FY 2005-06.
TABOR/General Fund September 20, 2003 – Colorado Economic Perspective
4 Office of State Planning and Budgeting
March 21, 2005 — Colorado Economic Perspective
Office of State Planning and Budgeting
FY 2002-03, the reported TABOR revenues used to compute the FY 2003-04 TABOR limit were $74.7 million lower than actual FY 2002-03 TABOR revenues because the state deducted from revenue the prior years’ over payments.
House Bill 05-1310 allows the $104.0 million in over payments made to taxpayers that have not yet been credited towards TABOR surpluses to be used as a credit against future TABOR surpluses, as was originally intended. It also corrects the error in the TABOR limit that was perpetuated because the reported FY 2002-03 TABOR revenues were lower than actual TABOR revenues by $74.7 million. Thus, House Bill 05-1310 permanently raises the TABOR limit by $74.7 million — increased annually by population growth plus inflation — and allows $104.0 million to be credited towards the FY 2004-05 and FY 2005-06 surpluses.
Colorado E
conomic P
erspective — M
arch 21, 2005TA
BO
R/G
eneral Fund
Office of S
tate Planning and B
udgeting 5
Table 2 TABOR Surplus Revenue Calculation
(Dollar Amounts in Millions)
March 2005 Estimate by Fiscal Year Line No. FY 2003-04 FY 2004-05 FY 2005-06 FY 2006-07 FY 2007-08 FY 2008-09 FY 2009-10
/A These figures differ from the General Fund revenues reported in other tables because they net out revenues credited to the State Education Fund per Amendment 23, other revenues that are exempt from TABOR, and revenues that are recorded as both General Fund and cash fund. For instance, the General Fund gaming revenues, unexpended prior-year Medicaid expenditures that are booked in “other revenue,” and transfers of unclaimed property are netted out.
/B S.B. 04-189 and S.B. 04-252 grant enterprise status to the University of Colorado in FY 2004-05 and all Colorado institutions of higher education in FY 2005-06 and thereafter. To account for this change, the FY 2003-04 TABOR limit is reduced by $391.6 million (the amount of tuition and fees collected by the University of Colorado in FY 2003-04 plus adjustments for the Brand Board and the Capitol Parking Fund becoming TABOR exempt enterprises on July 1, 2004) before the FY 2004-05 TABOR limit is computed. Similarly, the FY 2004-05 TABOR limit is reduced by $389.7 million (the amount of tuition and fees collected in FY 2004-05 by the remaining state institutions of higher education) before the FY 2005-06 TABOR limit is computed.
/C The allowable TABOR limit can be increased by a total of 6.0 percentage points over the next nine years as directed in H.B. 02-1310 and S.B. 02-179. These bills allow the state to increase the TABOR limit by 6.0 percentage points for population growth that occurred during the 1990s that was not captured by U.S. Bureau of the Census 1990 intercensal estimates. Since the state was not in a TABOR surplus position in FY 2001-02, the legislation allows the extra population growth to be used when the state returns to a TABOR surplus position.
/D The TABOR limit is calculated by applying the “Allowable TABOR Growth Rate” to either “Total TABOR Revenues” or the “TABOR Limit,” whichever is smaller. In FY 2002-03, total TABOR revenues were less than the TABOR limit, so the FY 2003-04 TABOR limit was calculated by growing FY 2002-03 actual total TABOR revenues by the FY 2003-04 allowable TABOR growth rate. In the remaining years, the TABOR limit is less than or equal to total TABOR revenues, so the TABOR limit is calculated from the previous year’s TABOR limit.
/E In years when projected revenues exceed the amount allowed by the Constitution, the three percent TABOR reserve is calculated based on the TABOR limit, rather than on projected total TABOR revenues. Given that the state will only retain the maximum allowed by the Constitution, it need only reserve three percent of such amount.
/F In FY 2003-04, per S.B. 03-258, the three percent TABOR emergency reserve is designated as the Colorado river recovery program loan fund, the fish and wildlife resources fund, the perpetual base account of the severance tax trust fund, the species conservation trust fund, the wildlife cash fund and fund equity, and up to $87.4 million of state properties.
/G In FY 2004-05 and thereafter, per H.B. 04-1422, the three percent TABOR emergency reserve is designated as up to $24.0 million from the major medical insurance fund, up to $20.0 million from the subsequent injury fund, up to $12.0 million from the workers’ compensation cash fund, up to $6.0 million from the severance tax trust fund, up to $6.0 million from the Colorado river recovery program loan fund, up to $3.0 million in the fish and wildlife resources fund, up to $98.7 million in the wildlife cash fund and fund equity, and up to $89.0 million of state properties.
/H Assumes passage of H.B. 05-1310.
Office of S
tate Planning and B
udgeting6
March 21, 2005 —
Colorado E
conomic P
erspectiveTA
BO
R/G
eneral Fund
Table 3 General Fund Overview – Current Law
(Dollar Amounts in Millions) March 2005 Estimate by Fiscal Year
Funding Sources and Diversions: 1 Beginning Reserve $216.6 $224.0 $232.8 $238.5 $246.3 $256.9 $267.9 2 Gross General Fund Revenues 6,045.2 6,201.9 $6,489.8 6,936.0 7,367.5 7,801.5 8,256.6 3 Transfers to General Fund 54.4 /A 59.7 /A 30.5 /A 30.1 /A 34.1 /A 33.2 /A 32.4 /A 4 Senate Bill 97-1 Transfers to the HUTF 0.0 0.0 0.0 0.0 0.0 0.0 0.0 5 Diversion to the Older Coloradan's Program (2.3) (2.3) (2.8) (2.8) (2.8) (2.8) (2.8) 6 Transfer to the State Education Fund (270.7) /B (284.6) /B (299.1) /B (321.3) /B (341.9) /B (363.0) /B (385.5) /B 7 Adjustments to the State Education Fund for Over (Under) Payments (8.0) /C (20.0) /C 0.0 0.0 0.0 0.0 0.0 8 Total Funds Available $6,035.2 $6,178.8 $6,451.3 $6,880.6 $7,303.2 $7,725.9 $8,168.6 Expenditures:
9 General Fund Appropriations (Long Bill) $5,590.7 $5,795.9 5,962.3 6,158.2 6,422.3 6,696.3 6,994.3 10 Increase (Reduction) from Supplemental Bills 9.5 23.7 0.0 11 K-12 Capital Construction 0.0 /D 0.0 /D 0.0 /D 0.0 /D 0.0 /D 0.0 /D 0.0 /D 12 Capital Construction Freeze (S.B. 03-179) 0.0 0.0 0.0 0.0 0.0 0.0 0.0 13 Federal Medical Assistance Enhancement for Medicaid (71.4) 0.0 0.0 0.0 0.0 0.0 0.0 14 Rebates and Expenditures 112.8 /E 120.8 /E 151.6 157.6 164.7 172.0 179.9 15 Capital and Prison Construction 9.5 0.2 /F 0.1 /F 7.4 /F 20.0 /F 19.4 /F 19.3 /F 16 TABOR Refund 0.0 0.0 98.8 245.3 372.6 502.6 626.3 17 Homestead Exemption 0.0 /G 0.0 /G 0.0 /G 65.8 66.7 67.8 68.9 18 Transfer to the Controlled Maintenance Trust Fund (S.B. 03-262) 0.0 0.0 /H 0.0 /H 0.0 0.0 0.0 0.0 19 General Fund Payback 56.2 /I 0.0 0.0 0.0 0.0 0.0 0.0 20 Reversions & Accounting Adjustments (18.5) 0.0 0.0 0.0 0.0 0.0 0.0 21 Total Obligations $5,688.8 $5,940.5 $6,212.8 $6,634.2 $7,046.3 $7,458.1 $7,888.8 22 Year-end General Fund Reserve: $346.3 $238.2 $238.5 $246.3 $256.9 $267.9 $279.8 23 Statutory Reserve: 4.0% of Appropriations 224.0 232.8 238.5 246.3 256.9 267.9 279.8 24 Monies Above (Below) Statutory Reserve 122.3 5.4 0.0 0.0 0.0 0.0 0.0 25 Excess Monies Reserved for Transportation 81.5 /J 3.6 /J 0.0 0.0 0.0 0.0 0.0 26 Excess Monies Reserved for Capital Construction 40.8 /J 1.8 /J 0.0 0.0 0.0 0.0 0.0 27 Reserve as a % of Appropriations 6.2% 4.1% 4.0% 4.0% 4.0% 4.0% 4.0%28 Appropriations Change $185.8 $219.3 $142.7 $195.9 $264.1 $273.9 $298.1 29 3.4% 3.9% 2.5% 3.3% 4.3% 4.3% 4.5%
/A This figure represents the total transfers to the General Fund per H.B. 02-1267, H.B. 02-1391, H.B. 02-1392, H.B. 02-1443, H.B. 02-1444, H.B. 02-1445, H.B. 02-1478, S.B. 03-107, S.B. 03-172, S.B. 03-179, S.B. 03-188, S.B. 03-190, S.B. 03-191, S.B. 03-260, S.B. 03-261, S.B. 03-271, S.B. 03-274, S.B. 03-296, S.B. 03-300, and H.B. 04-1421.
/B Per Amendment 23, one-third of one percentage point of Colorado taxable income is credited to the State Education Fund beginning January 1, 2001. /C As new data become available regarding Colorado taxable income, the state must adjust the diversion to the State Education Fund as per section 22-55-103, C.R.S. /D S.B. 00-181 transfers money to the K-12 Capital Construction Fund. This money is exempt from the statutory limit, but is used in the base for calculation of the next year's limit. In FY 2003-04, the payment is paid
from the State Education Fund and, to the extent available, Powerball. As per C.R.S. 24-75-201.1(4)(c), in FY 2004-05 and thereafter, the payment will not be made unless General Fund revenues exceed the statutory reserve by at least $80 million.
/E Per S.B. 03-263, state expenditures for unfunded, old hire pension plans in the Fire and Police Pensions Association are eliminated in FY 2003-04 and FY 2004-05. /F H.B. 04-1412 eliminated the General Fund transfer to the capital construction fund scheduled to occur in FY 2004-05 and FY 2005-06. The transfers shown in FY 2004-05 and FY 2005-06 are per H.B. 04-1003 and
H.B. 04-1021, respectively. Thereafter, the amounts are the minimums required to cover lease payments. /G S.B. 03-265 eliminated the senior homestead exemption property tax credit in FY 2003-04 through FY 2005-06. /H H.B. 04-1267 repealed the statutory requirement to repay the Controlled Maintenance Trust Fund in FY 2004-05 and FY 2005-06. /I S.B. 03-191 requires that $10 million be repaid to the Major Medical Fund on July 1, 2003, and S.B. 03-274 requires that up to $6.9 million be repaid to the local government limited gaming impact fund from any
revenues above $5.0 million collected through the FY 2003-04 tax amnesty program. Per H.B. 02-1391, the state is required to pay back some transfers into the General Fund if there are sufficient revenues. Our forecast shows that there is not sufficient revenue to make the paybacks required in H.B. 02-1391 from FY 2005-06 through the forecast horizon.
/J Per H.B. 02-1310, two-thirds of the amount in excess of a four percent reserve is credited to the Highway Users Tax Fund and one-third is credited to the Capital Construction Fund.
Colorado E
conomic P
erspective — M
arch 21, 2005TA
BO
R/G
eneral Fund
Office of S
tate Planning and B
udgeting 7
Table 4 General Fund Overview – Assuming House Bill 05-1194 Compromise
(Dollar Amounts in Millions) March 2005 Estimate by Fiscal Year
Funding Sources and Diversions: 1 Beginning Reserve $216.6 $224.0 $232.8 $243.9 $257.7 $273.1 $289.5 2 Gross General Fund Revenues 6,045.2 6,201.9 6,536.2 6,983.8 7,416.8 7,852.7 8,309.8 3 Transfers to General Fund 54.4 59.7 30.5 30.1 34.1 33.2 32.4 4 Senate Bill 97-1 Transfers to the HUTF 0.0 0.0 0.0 0.0 (7.3) (2.8) 0.0 5 Diversion to the Older Coloradan's Program (2.3) (2.3) (2.8) (2.8) (2.8) (2.8) (2.8) 6 Transfer to the State Education Fund ($270.7) ($284.6) ($302.6) ($324.8) ($345.6) ($366.8) ($389.4) 7 Adjustments to the State Education Fund for Over (Under) Payments (8.0) (20.0) 0.0 0.0 0.0 0.0 0.0 8 Total Funds Available $6,035.2 $6,178.8 $6,494.2 $6,930.2 $7,352.8 $7,786.7 $8,239.6 Expenditures:
9 General Fund Appropriations (Long Bill) $5,590.7 $5,795.9 $6,098.6 $6,441.8 $6,828.3 $7,238.0 $7,664.8 10 Increase (Reduction) from Supplemental Bills 9.5 23.7 0.0 0.0 0.0 0.0 0.0
11 K-12 Capital Construction 0.0 0.0 0.0 0.0 0.0 0.0 0.0 12 Capital Construction Freeze (S.B. 03-179) 0.0 0.0 0.0 0.0 0.0 0.0 0.0 13 Federal Medical Assistance Enhancement for Medicaid (71.4) 0.0 0.0 0.0 0.0 0.0 0.0 14 Rebates and Expenditures 112.8 120.8 151.6 157.6 164.7 172.0 179.9 15 Capital and Prison Construction 9.5 0.2 0.1 7.4 20.0 19.4 19.3 16 TABOR Refund 0.0 0.0 0.0 0.0 0.0 0.0 0.0 17 Homestead Exemption 0.0 0.0 0.0 65.8 66.7 67.8 68.9 18 Transfer to the Controlled Maintenance Trust Fund (S.B. 03-262) 0.0 0.0 0.0 0.0 0.0 0.0 0.0 19 General Fund Payback 56.2 0.0 0.0 0.0 0.0 0.0 0.0 20 Reversions & Accounting Adjustments (18.5) 0.0 0.0 0.0 0.0 0.0 0.0 21 Total Obligations 5,688.8 5,940.5 6,250.3 6,672.6 7,079.7 7,497.2 7,933.0 22 Year-end General Fund Reserve: 346.3 238.2 243.9 257.7 273.1 289.5 306.6 23 Statutory Reserve: 4.0% of Appropriations 224.0 232.8 243.9 257.7 273.1 289.5 306.6 24 Monies Above (Below) Statutory Reserve 122.3 5.4 0.0 0.0 0.0 0.0 0.0 25 Excess Monies Reserved for Transportation 81.5 3.6 0.0 0.0 0.0 0.0 0.0 26 Excess Monies Reserved for Capital Construction 40.8 1.8 0.0 0.0 0.0 0.0 0.0 27 Reserve as a % of Appropriations 6.2% 4.1% 4.0% 4.0% 4.0% 4.0% 4.0%28 Appropriations Change $185.8 $219.3 $279.0 $343.2 $386.5 $409.7 $426.8 29 3.4% 3.9% 4.8% 5.6% 6.0% 6.0% 5.9%
/A This figure represents the total transfers to the General Fund per H.B. 02-1267, H.B. 02-1391, H.B. 02-1392, H.B. 02-1443, H.B. 02-1444, H.B. 02-1445, H.B. 02-1478, S.B. 03-107, S.B. 03-172, S.B. 03-179, S.B. 03-188, S.B. 03-190, S.B. 03-191, S.B. 03-260, S.B. 03-261, S.B. 03-271, S.B. 03-274, S.B. 03-296, S.B. 03-300, and H.B. 04-1421.
/B Per Amendment 23, one-third of one percentage point of Colorado taxable income is credited to the State Education Fund beginning January 1, 2001. /C As new data become available regarding Colorado taxable income, the state must adjust the diversion to the State Education Fund as per section 22-55-103, C.R.S. /D S.B. 00-181 transfers money to the K-12 Capital Construction Fund. This money is exempt from the statutory limit, but is used in the base for calculation of the next year's limit. In FY 2003-04, the payment is paid
from the State Education Fund and, to the extent available, Powerball. As per C.R.S. 24-75-201.1(4)(c), in FY 2004-05 and thereafter, the payment will not be made unless General Fund revenues exceed the statutory reserve by at least $80 million.
/E Per S.B. 03-263, state expenditures for unfunded, old hire pension plans in the Fire and Police Pensions Association are eliminated in FY 2003-04 and FY 2004-05. /F H.B. 04-1412 eliminated the General Fund transfer to the capital construction fund scheduled to occur in FY 2004-05 and FY 2005-06. The transfers shown in FY 2004-05 and FY 2005-06 are per H.B. 04-1003 and
H.B. 04-1021, respectively. Thereafter, the amounts are the minimums required to cover lease payments. /G S.B. 03-265 eliminated the senior homestead exemption property tax credit in FY 2003-04 through FY 2005-06. /H H.B. 04-1267 repealed the statutory requirement to repay the Controlled Maintenance Trust Fund in FY 2004-05 and FY 2005-06. /I S.B. 03-191 requires that $10 million be repaid to the Major Medical Fund on July 1, 2003, and S.B. 03-274 requires that up to $6.9 million be repaid to the local government limited gaming impact fund from any
revenues above $5.0 million collected through the FY 2003-04 tax amnesty program. Per H.B. 02-1391, the state is required to pay back some transfers into the General Fund if there are sufficient revenues. Our forecast shows that there is not sufficient revenue to make the paybacks required in H.B. 02-1391 from FY 2005-06 through the forecast horizon.
/J Per H.B. 02-1310, two-thirds of the amount in excess of a four percent reserve is credited to the Highway Users Tax Fund and one-third is credited to the Capital Construction Fund.
Office of S
tate Planning and B
udgeting8
March 21, 2005 —
Colorado E
conomic P
erspectiveTA
BO
R/G
eneral Fund
Table 5 Colorado General Fund – Revenue Estimates by Tax Category
(Accrual Basis, Dollar Amounts in Millions) March 2005 Estimate by Fiscal Year with Percent Change Over Prior Year
NA: Not Available. /A Per H.B. 00-1259, beginning January 1, 2001, 10.34 percent of sales and use taxes will be diverted to the Highway Users Tax Fund when revenues are available to fund expenditures. The full
amount of sales and use taxes are reported here and the amount transferred is deducted from available revenues in the General Fund Overview in Table 3. /B The 2001 Federal tax relief package phases out the federal estate tax as well as the state credit claimed by Colorado as its share of federal estate taxes. Thus, the state’s estate tax collections will
be phased out and almost entirely eliminated by FY 2005-06. If the federal estate tax relief is not made permanent, the estate tax will return in FY 2010-11. /C The state received about $40 million in one-time revenues from the sale of financial assets in FY 2002-03, resulting in exceptionally strong interest income growth in FY 2002-03 and a decline in
interest income in FY 2003-04. /D Other income in FY 2003-04 includes monies from the Employment Support Fund surcharge as per S.B. 03-296, resulting in strong other income growth in FY 2003-04 and a decline in other income
growth in FY 2004-05. /E Per S.B. 03-263, state expenditures for unfunded, old hire pension plans in the Fire and Police Pensions Association are eliminated in FY 2003-04 and FY 2004-05. /F Effective January 1, 2005, Amendment 35 raised the state’s tax on cigarettes by $0.64 per pack and the tax on tobacco products by 20 percent. These revenues are TABOR exempt and shown for
informational purposes only. The growth rate in FY 2005-06 has been adjusted to reflect the partial collection of taxes in FY 2004-05, the fiscal year the tax increases were enacted. /G As Per H.B. 00-1351, when the state has a TABOR surplus, qualifying individuals are allowed an additional childcare credit against income taxes. The March 2005 OSPB forecast indicates that this
credit will be in effect in FY 2005-06 through FY 2009-10. In FY 2005-06, individual income tax receipts are lowered by about $45 million due to this credit.
Colorado Economic Perspective — March 21, 2005 Cash Fund Revenue Forecast
Office of State Planning and Budgeting 9
The March 2005 OSPB cash fund revenue forecast is summarized in Table 6. Cash fund revenues are monies collected and earmarked for specific purposes. They comprised 31 percent of total TABOR revenues in FY 2003-04. In FY 2004-05, cash fund revenues are forecast to increase 9.7 percent, to $2,440.7 million. However, from FY 2004-05 through FY 2009-10, cash fund revenue growth will be flat, primarily due to falling unemployment insurance (UI) tax revenues that are forecast to offset more robust growth in the remaining cash funds. The remainder of this section details the revenue forecasts for the larger cash funds.
Transportation-Related Cash Funds
Table 7 details the forecast for transportation-related cash fund revenues, which increased 4.3 percent in FY 2003-04. Total transportation-related cash fund revenues are forecast to rise 1.2 percent in FY 2004-05 compared with FY 2003-04. They are forecast to increase 2.1 percent in FY 2005-06. From FY 2004-05 through FY 2009-10, total transportation-related cash fund revenues will grow at a compound average annual rate of 3.3 percent.
• The Highway Users Tax Fund (HUTF), the largest of the transportation-related funds, is composed primarily of fuel tax revenues and registration fees. In FY 2003-04, HUTF revenues increased 2.4 percent. This group of revenues is expected to experience only 1.3 percent growth in FY 2004-05 as consumers begin to slow down their purchase of newer automobiles and the combination of higher gasoline prices and more fuel efficient vehicles creates a decline in gasoline purchases.
• Other transportation-related cash fund revenue increased 25.9 percent in FY 2003-04 due in part to the enactment of Senate Bill 03-272, which imposes new fees on license plates, decals, placards, and tabs to cover the direct costs of issuing them. Also, the E-470 Authority repaid a loan to the Department of Transportation that included $10 million in interest and this created a one time infusion of money in this fund. In FY 2004-05, these cash funds are forecast to remain at a high level again as several projects enter into their final stages and utilize federal funds, which require a match of local funds. In FY 2005-06, other transportation-related cash fund revenue will decrease 8.8 percent due to the increased activity in FY 2003-04 and FY 2004-05.
Higher Education
The March 2005 forecast for higher education cash fund revenue is shown in Table 8. In FY 2003-04, total higher education revenues increased 10.8 percent as a result of tuition increases and strong student enrollment growth. In FY 2004-05, higher education revenues (excluding the University of Colorado, which became an enterprise in FY 2004-05) are expected to grow 4.1 percent.
Cash Fund Revenue Forecast In FY 2004-05, cash fund revenues are forecast to increase 9.7 percent. From FY 2004-05 through FY 2009-10, total transportation-related cash fund revenues will grow at a compound average annual rate of 3.3 percent.
Cash Fund Revenue Forecast December 20, 2004 — Colorado Economic Perspective
10 Office of State Planning and Budgeting
March 21, 2005 — Colorado Economic Perspective
Office of State Planning and Budgeting
Under the provisions of Senate Bill 04-252, the University of Colorado became eligible for enterprise status beginning in FY 2004-05. Because of its enterprise status, the tuition and fees collected by the University of Colorado do not count as TABOR revenue in FY 2004-05 and thereafter and are thus not included in the cash fund revenue forecast. Meanwhile, as a result of the funding mechanism provided by Senate Bill 04-189, all state institutions of higher education are expected to meet the requirements necessary to be granted enterprise status beginning in FY 2005-06, so the tuition and fees collected from these institutions will not be counted as TABOR revenue in FY 2005-06 and thereafter. Thus, beginning in FY 2005-06, the OSPB cash fund revenue forecast does not include tuition and fees collected by Colorado institutions of higher education.
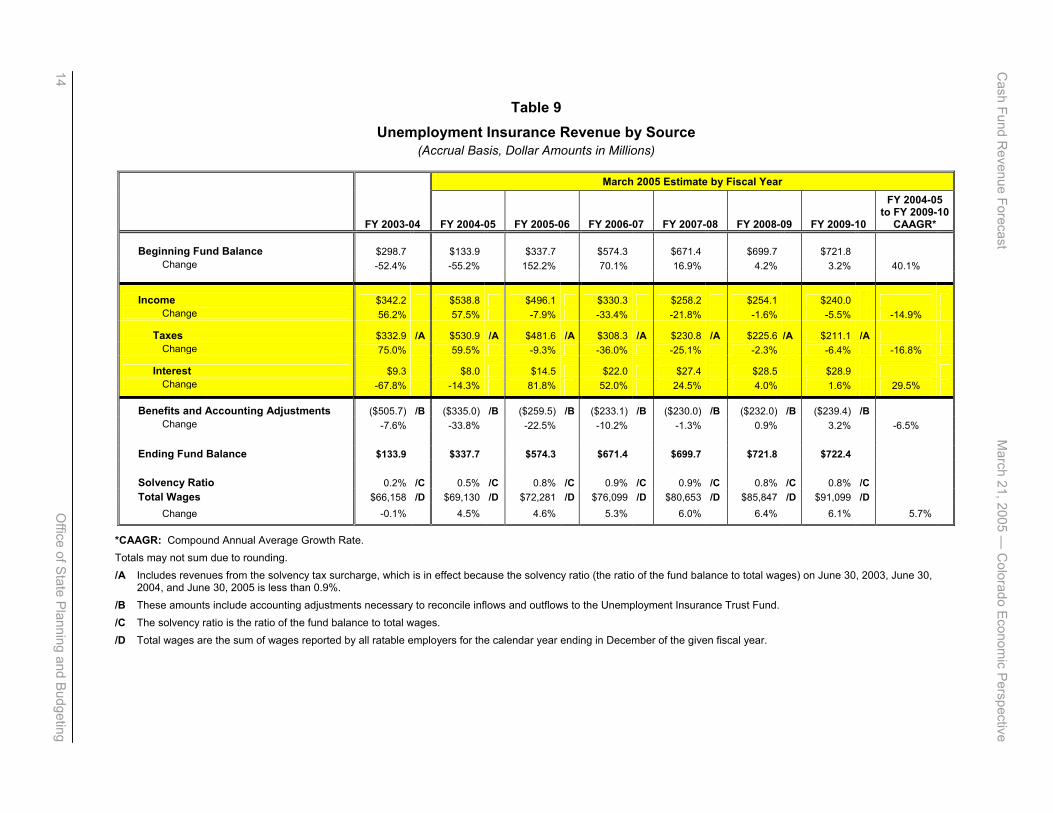
Unemployment Insurance Trust Fund
The March 2005 UI Trust Fund revenue forecast is shown in Table 9. In FY 2003-04, total UI Trust Fund revenues — UI taxes and interest earnings on the UI Trust Fund balance — increased 56.2 percent. They are forecast to increase 57.5 percent in FY 2004-05. Tax revenues rose in FY 2002-03 through FY 2004-05 because UI tax rates automatically increase to compensate for the higher UI benefit payments made since 2001. Thereafter, the improving economy will result in declining benefit payments, which means UI tax rates will fall.
• In both calendar years 2004 and 2005, the unemployment insurance tax rate schedule will move to a higher level. This occurs because two components of employer UI tax rates — the base rate and the solvency surcharge — rise when the UI Trust Fund balance drops below certain thresholds. The UI Trust Fund balance triggered the solvency surcharge on January 1, 2004. Meanwhile, the UI Trust Fund ended FY 2003-04 with a balance of only $133.9 million, so the solvency surcharge remains in effect in calendar year 2005. The OSPB forecast indicates the solvency surcharge will remain in effect through calendar year 2006. The statutory provisions of the UI base rates and solvency surcharge can be found in Section 8-76-103, C.R.S.
• In FY 2004-05, UI benefit payments will fall 28.3 percent, following a 13.6 percent decrease in FY 2003-04. They will continue to fall through FY 2007-08, and beginning in FY 2008-09, benefit payments will remain flat, reflecting a healthy labor market.
Other Cash Funds
The March 2005 forecast for total revenues collected by the remaining cash funds in FY 2004-05 is essentially unchanged from our December 2004 forecast. In FY 2003-04, these cash fund revenues increased 14.3 percent as a result of unusually high growth in severance tax collections. Severance taxes are monies collected on the value of minerals severed from the earth and, due to a combination of increased production, rising gas and oil prices, and merger and acquisition activity, revenues collected from severance taxes increased nearly 300 percent in FY 2003-04. In FY 2004-05, we forecast a 21.4 percent decline in severance tax revenues, primarily because of offsetting credits received for property taxes paid on mineral production sites in previous years.
Total UI Trust Fund revenues . . . are forecast to increase 57.5 percent in FY 2004-05. In FY 2004-05, UI benefit payments will fall 28.3 percent following a 13.6 percent decrease in FY 2003-04.
Colorado E
conomic P
erspective — M
arch 21, 2005 C
ash Fund Revenue Forecast
Office of S
tate Planning and B
udgeting 11
Table 6
Cash Fund Revenue by Major Category (Accrual Basis, Dollar Amounts in Millions)
Controlled Maintenance Trust Fund Interest $2.0 $0.0 /E $0.0 /E $0.0 $0.0 $0.0 $0.0 Change NA NA NA NA NA NA NA NA /E Miscellaneous Cash Funds $315.0 $317.2 $323.4 $334.1 $346.4 $358.7 $372.8 Change -1.9% 0.7% 2.0% 3.3% 3.7% 3.5% 4.0% 3.3%
*CAAGR: Compound Annual Average Growth Rate. NA: Not Applicable. NE: Not Estimated. Totals may not sum due to rounding. /A In FY 2003-04, schools increased resident tuition between 5.0% and 15.0% and nonresident tuition between 5.0% and 23.1%. The University of Colorado at Boulder was allowed an additional 5.0%
increase for its Quality for Colorado program. In FY 2004-05, residential tuition increased by the Denver-Boulder-Greeley inflation rate and, on average, nonresidential tuition increased 5.0%. /B Per S.B. 04-189 and S.B. 04-252, state institutes of higher education are granted enterprise status. This means that Higher Education tuition and fees will no longer count as TABOR revenues.
Beginning in FY 2004-05, the University of Colorado is an enterprise and in FY 2005-06, the remaining state institutions of higher education are considered enterprises for purposes of this forecast. /C Includes revenues from the solvency tax surcharge, which is in effect because the solvency ratio on June 30, 2003, June 30, 2004, and June 30, 2005 is less than 0.9%. /D Reflects a change in the state environmental surcharge imposed on petroleum products through FY 2006-07. /E Per H.B. 04-1222, payback of the Controlled Maintenance Trust Fund is eliminated. /F Growth rates have been adjusted to account for the enterprise status of state institutions of higher education.
Office of S
tate Planning and B
udgeting12
March 21, 2005 —
Colorado E
conomic P
erspectiveC
ash Fund Revenue Forecast
Table 7
Transportation-Related Cash Fund Revenue by Source (Accrual Basis, Dollar Amounts in Millions)
*CAAGR: Compound Annual Average Growth Rate. Totals may not sum due to rounding. /A Includes interest earnings, court fines, driver's license fees, and other miscellaneous income. /B In accordance with C.R.S. 42-2-114, drivers' license fees will be raised on July 1, 2006.
Colorado E
conomic P
erspective — M
arch 21, 2005 C
ash Fund Revenue Forecast
Office of S
tate Planning and B
udgeting 13
Table 8
Higher Education Cash Fund Revenue by Source (Accrual Basis, Dollar Amounts in Millions)
Tuition $601.7 /A $317.6 /A NE NE NE NE NE Change 12.9% 5.7% NE NE NE NE NE NE Non-Tuition $156.1 $72.1 NE NE NE NE NE Change 3.4% 4.6% NE NE NE NE NE NE
TOTAL HIGHER EDUCATION $757.8 $389.7 /B NE /B NE /B NE /B NE /B NE /B Change 10.8% 4.1% /C NE NE NE NE NE NE
NE: Not Estimated. Totals may not sum due to rounding. /A In FY 2003-04, schools increased resident tuition between 5.0% and 15.0% and nonresident tuition between 5.0% and 23.1%. The University of Colorado at Boulder was
allowed an additional 5.0% increase for its Quality for Colorado program. In FY 2004-05, residential tuition increased by the Denver-Boulder-Greeley inflation rate and, on average, nonresidential tuition increased 5.0%.
/B Per S.B. 04-189 and S.B. 04-252, state institutes of higher education are granted enterprise status. This means that higher education tuition and fees will no longer count as TABOR revenues. Beginning in FY 2004-05, the University of Colorado is an enterprise and in FY 2005-06, the remaining state institutes of higher education are enterprises.
/C Growth rates have been adjusted to account for the enterprise status of state institutions of higher education. /D The FTE student enrollment forecast includes all students attending state institutions of higher education, including the University of Colorado.
Office of S
tate Planning and B
udgeting14
March 21, 2005 —
Colorado E
conomic P
erspectiveC
ash Fund Revenue Forecast
Table 9
Unemployment Insurance Revenue by Source (Accrual Basis, Dollar Amounts in Millions)
*CAAGR: Compound Annual Average Growth Rate. Totals may not sum due to rounding. /A Includes revenues from the solvency tax surcharge, which is in effect because the solvency ratio (the ratio of the fund balance to total wages) on June 30, 2003, June 30,
2004, and June 30, 2005 is less than 0.9%. /B These amounts include accounting adjustments necessary to reconcile inflows and outflows to the Unemployment Insurance Trust Fund. /C The solvency ratio is the ratio of the fund balance to total wages. /D Total wages are the sum of wages reported by all ratable employers for the calendar year ending in December of the given fiscal year.
Colorado Economic Perspective — March 21, 2005 The National Economy
Office of State Planning and Budgeting 15
The March 2005 national forecast is not fundamentally different compared with the December 2004 national forecast. The following details the current outlook for the nation’s economy.
The National Economic Forecast Gross Domestic Product and Its Components
Inflation-adjusted GDP increased 4.4 percent in 2004, with strong growth in the first and last quarter of the year offsetting weaker but still respectable growth in the second and third quarter. Inflation-adjusted annual GDP growth is forecast to grow at about its long-term potential — 3.1 percent to 3.5 percent — from 2005 through 2009.
• Consumer spending, which represents almost 70 percent of GDP, has been supported over the past year by tax cuts and borrowing from home equity. Now, the pace of sales growth will slow despite the strengthening economy because these other sources of cash are dissipating. Furthermore, rising interest rates will dampen demand, particularly for automobiles, homes, and home-related goods. Consumer spending grew 3.8 percent in 2004 and is expected to grow 3.3 percent in 2005, a slight upward revision compared with the December 2004 forecast. In 2004, consumer spending on durable and nondurable goods increased at a faster pace than spending on services. In 2005 and through the remainder of the forecast, spending on nondurable goods and services will lead growth.
• Business investment grew 10.3 percent in 2004 and is expected to average 8.9 percent growth in 2005. Investment growth in 2005 is affected by the expiration of two of the key provisions of the federal Jobs and Growth Tax Relief Reconciliation Act of 2003. These provisions, which increase the amount of capital investment that small businesses are permitted to immediately expense and which provide a 50 percent bonus depreciation on investments made before the end of 2004, increased business spending in 2004 by moving forward purchases that would otherwise have been made in 2005. Thus, 2005 investment will be lower than would have occurred without these provisions.
Business investment is currently supported by replacement demand, as well as investment in new technologies. Future investment growth will be supported by strong profitability, healthy cash flow, and tax incentives. Investment in information technology equipment and software increased 13.3 percent in 2004 and is expected to increase 10.1 percent in 2005 before moderating to a 5.1 percent pace in 2006. Meanwhile, investment in nonresidential structures in 2004 remained relatively flat, increasing only 1.0 percent, but is expected to increase 5.0 percent in 2005 and 5.8 percent in 2006.
• Government spending increased 2.0 percent in 2004 and is expected to increase 1.9 percent in 2005 and 2.2 percent in 2006. In 2005 and 2006, federal defense spending will increase 4.8 percent and 1.5 percent, respectively. Meanwhile,
The National Economy Consumer spending grew 3.8 percent in 2004 and is expected to grow 3.3 percent in 2005.
The National Economy December 20, 2004 — Colorado Economic Perspective
16 Office of State Planning and Budgeting
March 21, 2005 — Colorado Economic Perspective
Office of State Planning and Budgeting
federal nondefense spending, which fell 0.6 percent in 2004, is expected to rise 2.2 percent in 2005 and 2.7 percent in 2006. Defense spending will be relatively strong in the near term because of the conflict in Iraq and nondefense spending will rise because of the increasing costs of health care, entitlement programs, and homeland security. Passage of the Medicare prescription drug benefit program is also putting upward pressure on federal nondefense spending. State and local government expenditures are forecast to increase 0.7 percent in 2005 and 2.5 percent in 2006.
Inflation
Inflationary pressures are moderate. Overall, consumer prices rose 2.7 percent in 2004 and are expected to rise 2.3 percent in 2005 and 2.1 percent in 2006. Meanwhile, core consumer prices — which exclude energy and food prices — increased 1.8 percent in 2004 and are expected to increase at or below 2.7 percent through the forecast horizon. The cost of shelter, the largest contributor to consumer price inflation, is forecast to rise 2.4 percent in 2005, while the cost of medical care is forecast to increase 4.4 percent. Energy prices are the key risk to this relatively sanguine outlook. Energy prices are expected to moderate over the next year as global energy demand growth decelerates and global energy supply increases. Natural gas prices are also expected to decline, but to remain somewhat elevated compared to oil prices as imports of natural gas are currently constrained by a lack of available pipeline and seaport capacity. Natural gas accounts for nearly one quarter of the nation’s energy consumption.
Interest Rates
The current stimulatory fiscal policy is expected to gradually diminish through 2005 and into 2006. By mid-2006 fiscal policy is expected to be neutral. The Federal Reserve Board is expected to continue raising interest rates in a measured way through the end of 2005. The federal funds rate was 2.25 percent at year-end 2004 and is expected to rise to 3.5 percent by year-end 2005. In the long run, the federal funds rate target is expected to average about 4.5 percent, which is equal to long-run sustainable inflation-adjusted GDP growth of 3.0 percent plus 1.5 percent inflation.
Employment
The national employment forecast has not changed materially since the December 2004 forecast. National payrolls will increase 1.8 percent in 2005, with 2.3 million workers added to nonfarm payrolls between 2004 and 2005. In 2006 and 2007, employment will increase 1.5 percent and 1.0 percent, respectively. Service-producing industries — including well-paying occupations in professional and business services — will increase their payrolls most rapidly. Construction employment, which is benefiting from the unusual strength of the housing market, will also add jobs. Meanwhile, manufacturing employment will continue to contract through the forecast horizon.
In 2005 and 2006, the unemployment rate is forecast to average 5.3 percent. The strengthening labor market will entice job-seekers back into the labor force, offsetting the number of currently unemployed workers that will find employment in newly created positions. Thus, the unemployment rate will fall only gradually, slowly reaching 5.0 percent by 2009.
Core consumer prices . . . increased 1.8 percent in 2004 and are expected to increase at or below 2.7 percent through the forecast horizon.
National employment will increase 1.8 percent in 2005, with 2.3 million workers added to nonfarm payrolls between 2004 and 2005.
Colorado Economic Perspective — March 21, 2005 The National Economy
Office of State Planning and Budgeting 17
Risks to the Forecast
As has been true over the past year, most of the events likely to affect the current national economic forecast would result in a downward revision to the near-term strength of the recovery. The threat of global terrorism continues to pose a significant downside risk, negatively impacting consumer and business confidence. Moreover, the economic recovery could be disrupted if the expected moderation in energy prices fails to materialize. Meanwhile, the large current account deficit might necessitate an even steeper decline in the dollar, which would negatively impact the economy. Also, household debt burdens and defaults remain high and the possibility of declining house prices in overpriced markets increases the risk of falling household credit quality. Weakening household credit quality could undermine lenders’ willingness to extend credit, thereby curtailing households’ ability to spend and weakening economic growth.
Most of the events likely to affect the current national economic forecast would result in a downward revision to the near-term strength of the recovery.
Office of S
tate Planning and B
udgeting18
March 21, 2005 —
Colorado E
conomic P
erspectiveThe N
ational Econom
y
Table 10 History And Forecast For Key National Economic Variables
1999-2009
Line Actual March 2005 Forecast No. 1999 2000 2001 2002 2003 2004 2005 2006 2007 2008 2009
Inflation-Adjusted & Current Dollar Income Accounts
1/ Population values through 2000 are adjusted for 2000 Census. 2/ Employment by place of work from Current Employment Statistics (CES) survey of payroll records. Sources: Economy.com; U.S. Department of Labor, Bureau of Labor Statistics; and U.S. Department of Commerce, Bureaus of the Census and Economic Analysis.
Colorado Economic Perspective — March 21, 2005 The Colorado Economy
Office of State Planning and Budgeting 19
The Colorado economy is showing increasing strength. In 2004, Colorado employment rose 1.3 percent — an increase of nearly 30,000 jobs. Moreover, Colorado’s 2.5 percent January 2005 employment increase is 11th highest in the country. Meanwhile, 2004 retail trade sales increased 6.2 percent, the highest annual rise since 2000. Table 11 highlights the state’s recent economic activity.
1/ Year-to-date. 2/ Employment by place of work from the Current Employment Statistics (CES) survey of payroll records. 3/ Copyright 2003, F.W. Dodge Division, The McGraw-Hill companies. All rights reserved. 4/ Year-to-date through December 2004. Sources: U.S. Department of Labor, Bureau of Labor Statistics; U.S. Department of Commerce, Bureaus of the Census and Economic Analysis; and
F.W. Dodge Division, the McGraw-Hill companies.
Colorado’s Economic Forecast
The March 2005 OSPB forecast for the Colorado economy is not significantly changed compared with the December 2004 forecast.
Economic Indicators
This section presents the OSPB forecast for Colorado’s economic and demographic indicators, shown in Table 12. It includes a discussion of employment and unemployment, inflation, wages and income, and population and migration.
Employment
In 2004, Colorado employment rose 1.3 percent, a net increase of nearly 30,000 new jobs. By 2005, employment growth will be 2.3 percent and we forecast that the number of jobs in the state will increase by 2.8 percent in 2006.
The U.S. Department of Labor, Bureau of Labor Statistics, has revised the methodology for computing the national and state unemployment rates. The revision resulted in an increase in the 2004 Colorado unemployment rate to 5.4 percent from 5.1 percent as computed under the old system. The unemployment rate will drop to 5.0 percent in 2005 and fall to 4.4 percent in 2009.
Colorado’s 2.5 percent January 2005 employment increase is 11th highest in the country. The March 2005 OSPB forecast for the Colorado economy is not significantly changed compared with the December 2004 forecast.
The Colorado Economy
The Colorado Economy December 20, 2004 — Colorado Economic Perspective
20 Office of State Planning and Budgeting
March 21, 2005 — Colorado Economic Perspective
Office of State Planning and Budgeting
Inflation
Overall consumer prices in the Denver-Boulder-Greeley area were essentially unchanged in 2004, rising a mere 0.1 percent. In Colorado, inflationary pressure associated with the price of shelter was constrained by incentives offered by landlords that lower rental costs. Although the average price of homes sold in Colorado continues to rise, the official measure of the change in the cost of shelter shows a decline because effective rental rates are falling. Since the cost of shelter contributes almost one-third of total inflation, a decline in shelter costs translates into exceptionally low inflation.
We forecast that Colorado inflation will be 1.8 percent in 2005 and 1.9 percent in 2006. From 2007 through 2009, Colorado inflation will remain well below three percent.
Wages and Income
Colorado per capita income continues to exceed the national average. Overall, personal income grew 2.2 in 2003, with the pace accelerating throughout the year. We forecast that personal income will grow 5.2 percent in 2004 and 2005. Personal income growth will average about seven percent from 2006 through 2009.
Colorado wage and salary income rose only 1.2 percent in 2003 because employment levels were lower and because high-wage jobs in the advanced technology and financial sectors had been lost. As labor markets recover, we forecast that total wage and salary disbursements will rise, increasing 4.1 percent in 2004, 4.7 percent in 2005, and 5.6 percent in 2006. In 2007 and thereafter, wage and salary income growth will be above six percent.
Population and Migration
In 2004, net in-migration to Colorado was 15,400 and total population growth was 1.2 percent. Despite the severity of the 2001 recession, state net migration has remained positive. As the national and Colorado economies recover, the number of net in-migrants to the state will increase and the state’s population growth will be 1.6 percent by 2009.
Industrial Sectors
This section details our forecast for Colorado’s residential and nonresidential construction and retail trade industries.
Construction
In 2004, residential home permits issued in Colorado rose 15.6 percent. Meanwhile, the value of nonresidential construction (excluding nonbuilding projects like roads) increased 26.3 percent. The March 2005 OSPB forecast for the residential and nonresidential construction markets anticipates a moderate correction in 2005 and 2006.
Overall consumer prices in the Denver-Boulder-Greeley area were essentially unchanged in 2004, rising a mere 0.1 percent. Residential and nonresidential construction markets anticipates a moderate correction in 2005 and 2006.
Colorado Economic Perspective — March 21, 2005 The Colorado Economy
Office of State Planning and Budgeting 21
Residential Construction
In 2002 and 2003, single-family home construction fell in reaction to high inventories that were the result of the rapidly deteriorating economy after the events of September 11, 2001. In 2004, home construction activity increased in response to still low mortgage interest rates and the strengthening Colorado economy. The total number of home permits issued in 2004 rose 15.6 percent. However, in 2005 and 2006, low in-migration combined with high inventories and rising interest rates will dampen demand for new homes. In 2007 and beyond, the number of home permits issued will rise year-over-year as net in-migration and jobs increase.
Nonresidential Construction
Denver-area nonresidential building construction continues to be impacted by oversupply in most markets. However, the 2004 value of new nonresidential building construction rose 26.3 percent. This is primarily the consequence of new hospitals, medical facilities, and manufacturing plants, which offset a correction in office and retail construction. The correction in office and retail construction will continue into 2005. Thereafter, the value of nonresidential construction put in place will show modest increases through 2009, as the economy recovers and currently vacant space becomes occupied with newly formed and expanding businesses.
Retail Trade
Retail trade sales in Colorado rose 6.2 percent in 2004, with substantial strengthening in the last half of the year. We forecast retail sales will grow 5.8 percent in 2005 and 5.3 percent in 2006. In 2005, spending increases will be less than might be implied by the strengthening state economy because consumer demand was already satiated as consumers took advantage of low interest rates and tax rebates to make purchases earlier than would have occurred otherwise.
Risks to the Colorado Forecast
Colorado’s recovery will begin to outpace the national recovery by the middle of 2005. However, the Colorado recovery will likely mirror any major shift — either positive or negative — in the national recovery.
Retail trade sales in Colorado rose 6.2 percent in 2004, with substantial strengthening in the last half of the year.
Office of S
tate Planning and B
udgeting22
March 21, 2005 —
Colorado E
conomic P
erspectiveThe C
olorado Econom
y
Table 12 History And Forecast For Key Colorado Economic Variables
Calendar Year 1999-2009
Line Actual March 2005 Forecast No. 1999 2000 2001 2002 2003 2004 2005 2006 2007 2008 2009
20 Change 2.9% 4.0% 4.7% 1.9% 1.1% 0.1% 1.8% 1.9% 2.3% 2.6% 2.5% 1/ Population values through 2000 are adjusted for 2000 Census. 2/ Values through 2000 revised by Colorado Department of Local Affairs to reflect 2000 Census. 3/ Employment by place of work from Current Employment Statistics (CES) survey of payroll records. 4/ Copyright 2003, F.W. Dodge Division, The McGraw-Hill companies. All rights reserved. Sources: U.S. Department of Labor, Bureau of Labor Statistics; U.S. Department of Commerce, Bureaus of the Census and Economic Analysis; Colorado Departments of Labor and Employment, Local Affairs, and Revenue; and F.W. Dodge Division, the McGraw-Hill companies.