24
State of Global Retailing A Closer Look at Russia Artem Bektemirov, CEO Pharmacy Chain 36.6 NRF Annual Meeting 16 January 2005
| Date post: | 30-Dec-2015 |
| Category: |
Documents |
| Upload: | darrel-buckley |
| View: | 36 times |
| Download: | 0 times |

State of Global RetailingState of Global Retailing
A Closer Look at Russia
Artem Bektemirov, CEOPharmacy Chain 36.6NRF Annual Meeting
16 January 2005

2
Soviet-Style
Retailing
3
Retailing
Today

4
Shopping at
Apteka 36.6

5
RUSSIA: #1 EMERGING RETAIL GROWTH MARKETRUSSIA: #1 EMERGING RETAIL GROWTH MARKET
Ranking CountryCountry
RiskMarket
AttractivenessMarket
SaturationTime
Pressure Score
1 Russia 56 56 77 100 100
2 India 62 34 92 72 88
3 China 71 42 62 90 86
A.T. Kearney’s 2004 Global Retail Development Index

6
Market Growth: 10% annual growth in the next 5 years. Already one of the 10 largest retail markets in the world.
Strong Economy: Driven by strong trade balance, growth in productivity and investment, and fiscal responsibility.
Market Opportunities: With rising incomes, consumers seek greater quality and choice offered by modern formats.
Government Support: Relatively liberal policies in consumer economy balance traditional hurdles.
Strong Local Players Emerging: Russia retailers now emerging with operating efficiencies comparable to international benchmarks.
WHY RUSSIA IS #1 RETAIL GROWTH MARKETWHY RUSSIA IS #1 RETAIL GROWTH MARKET
7
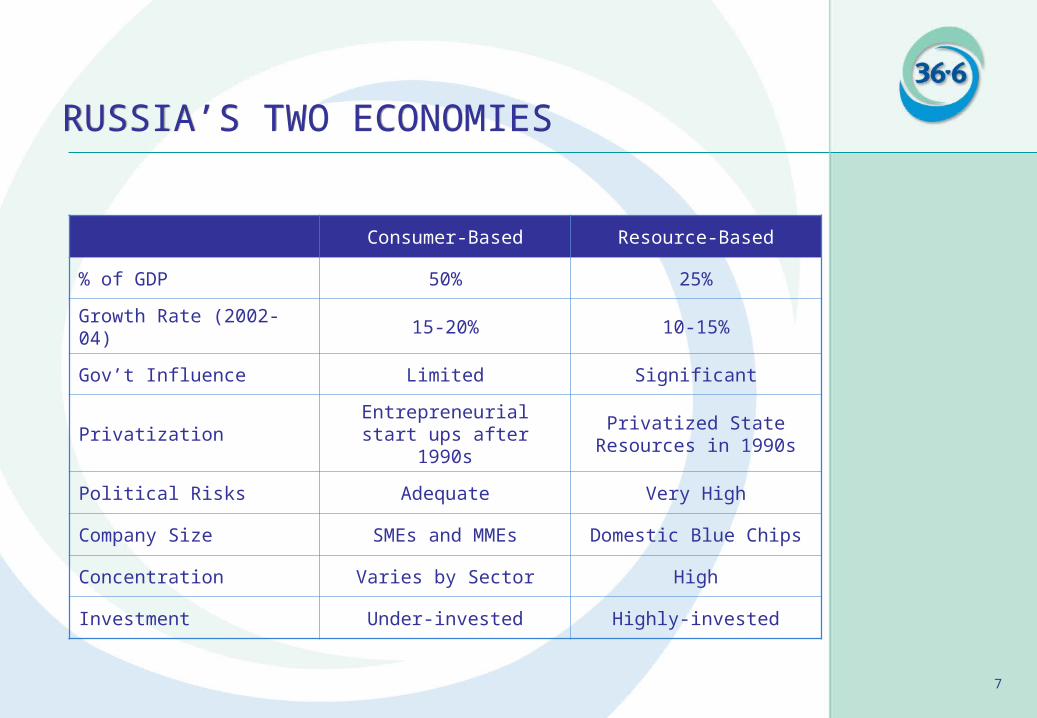
RUSSIA’S TWO ECONOMIESRUSSIA’S TWO ECONOMIES
Consumer-Based Resource-Based
% of GDP 50% 25%
Growth Rate (2002-04) 15-20% 10-15%
Gov’t Influence Limited Significant
PrivatizationEntrepreneurial start ups
after 1990sPrivatized State Resources
in 1990s
Political Risks Adequate Very High
Company Size SMEs and MMEs Domestic Blue Chips
Concentration Varies by Sector High
Investment Under-invested Highly-invested

8
Real growth of consumer income and retail turnover % y-o-y
11.9
8.5 8.9
14.6
10.2
9.09.0
10.9
9.2
8.0
9.28.5
0.0
2.0
4.0
6.0
8.0
10.0
12.0
14.0
16.0
2000 2001 2002 2003 2004F 2005F
Income Retail turnover
Source: State statistic committee, IRG estimations
6-Year Annual
Average:
Retail:
9.1%
Income:
10.3%
RUSSIA’S RETAIL MARKET:$170 BILLION AND GROWINGRUSSIA’S RETAIL MARKET:$170 BILLION AND GROWING

9
Source: GKS, UFG, Euromonitor
RETAIL MARKET SEGMENTSRETAIL MARKET SEGMENTSAnnual
Forecast Growth 2004-2010*
Electronics 15%
DIY 14%
Food 12%
Cosmetics 11%
Pharmaceuticals 9%
*nominal USD, CAGR
Apparel13%
Other19%
Food47% Furniture
7%
Consumer electronics
4%Cosmetics & toiletries
4%2%
DIY4%
Pharmaceuticals

10
5%Food
36%Electronics
9%DIY
6%Pharmaceuticals
Source: UFG Research
Top-5 Players’ Marketshare
RUSSIAN RETAIL MARKETREMAINS FRAGMENTEDRUSSIAN RETAIL MARKETREMAINS FRAGMENTED
Food:
Metro
Electronics:
Eldorado
Pharmaceuticals:
36.6
DIY:
Starik Hottabych
Top Russian
Retailers

11
Sales per Square Meter (2002)
15500
14080
16500
9400
5600
4900
22000Tesco
Sainsbury
Safeway
Morrisons
Pyaterochka
Perekrestok
Sedmoy Kontinent
USD
FOOD RETAIL: RUSSIA vs. INTERNATIONALFOOD RETAIL: RUSSIA vs. INTERNATIONAL
12
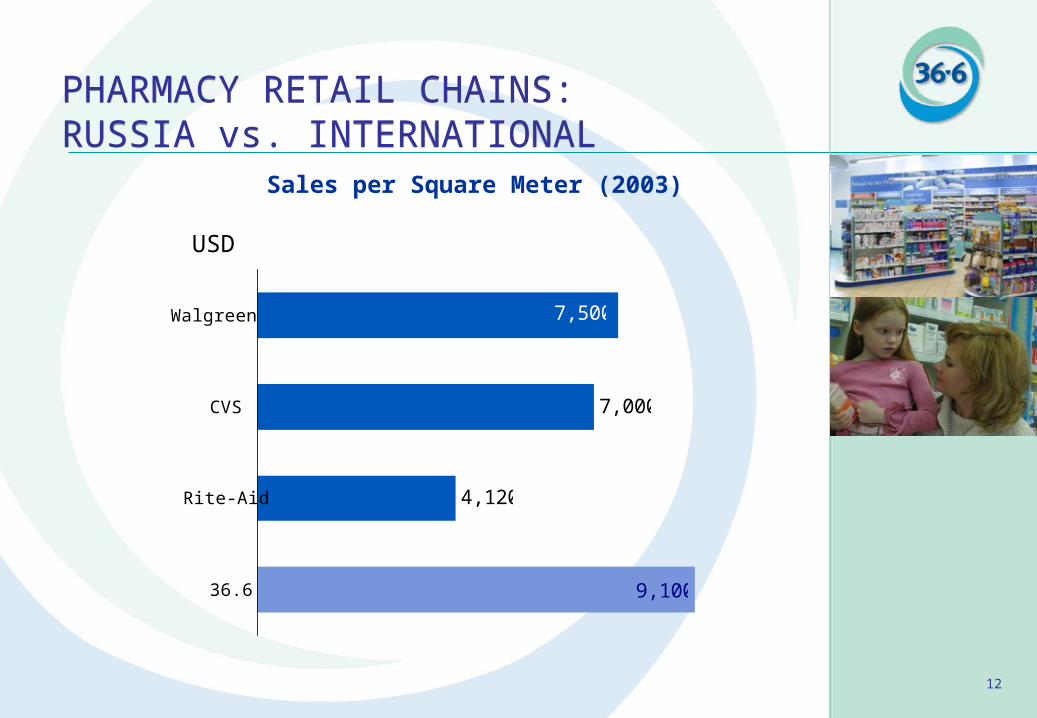
Sales per Square Meter (2003)
7,000
4,120
7,500
9,100
Walgreen
CVS
Rite-Aid
36.6
USD
PHARMACY RETAIL CHAINS: RUSSIA vs. INTERNATIONALPHARMACY RETAIL CHAINS: RUSSIA vs. INTERNATIONAL
13
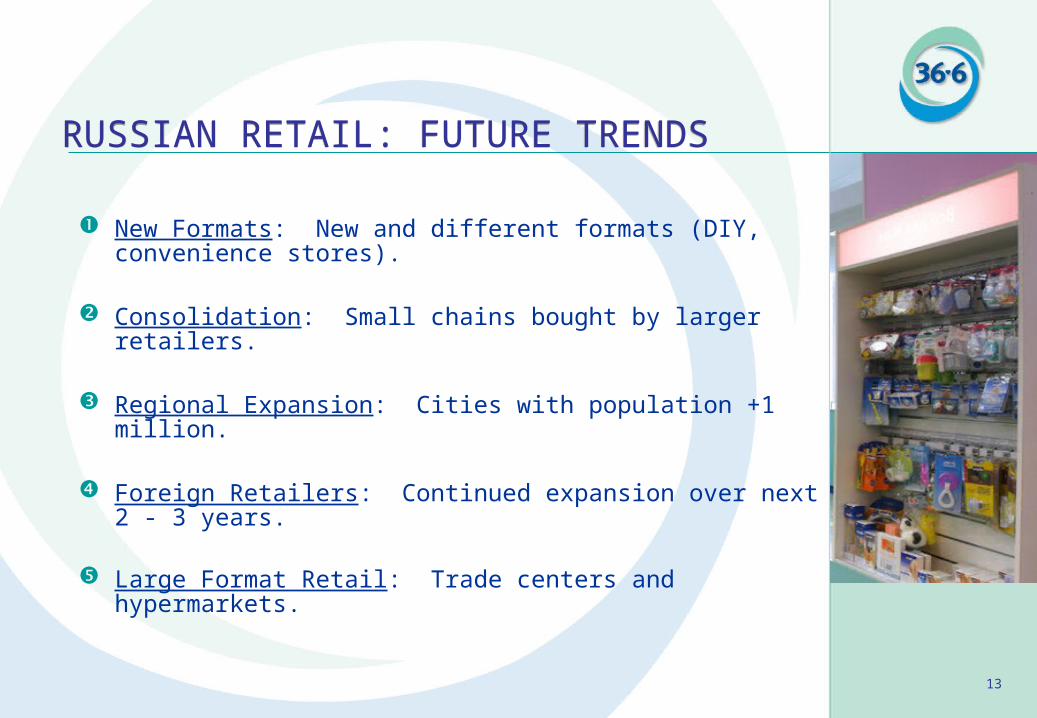
RUSSIAN RETAIL: FUTURE TRENDSRUSSIAN RETAIL: FUTURE TRENDS
New Formats: New and different formats (DIY, convenience stores).
Consolidation: Small chains bought by larger retailers.
Regional Expansion: Cities with population +1 million.
Foreign Retailers: Continued expansion over next 2 - 3 years.
Large Format Retail: Trade centers and hypermarkets.
14
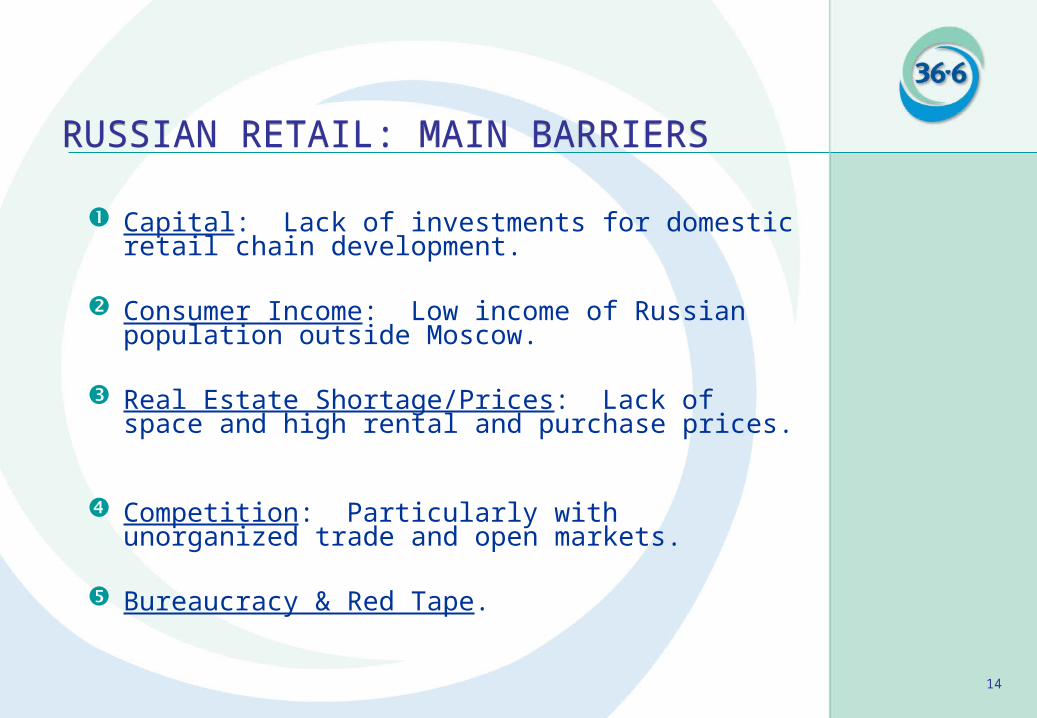
RUSSIAN RETAIL: MAIN BARRIERSRUSSIAN RETAIL: MAIN BARRIERS
Capital: Lack of investments for domestic retail chain development.
Consumer Income: Low income of Russian population outside Moscow.
Real Estate Shortage/Prices: Lack of space and high rental and purchase prices.
Competition: Particularly with unorganized trade and open markets.
Bureaucracy & Red Tape.

15
Source: Pharmexpert, RMBC, DSM, 36.6
617 660 706 749 786 826 867
3,0543,378
3,7364,137
4,5884,979
5,402
2003 2004F 2005F 2006F 2007F 2008F 2009F
Moscow
Regions
Russia 3,6714,038
4,4424,886
5,3755,805
6,269
2003-2009 CAGR*
Russia
9.3%
Regions
10%
Moscow
5.8%
*Compound Annual Growth Rate
USD Millions
PHARMACEUTICAL MARKET FORECASTPHARMACEUTICAL MARKET FORECAST

16
*Includes medical devices (blood pressure meters, thermometers, glucometers, etc.), first aid (adhesive bandages, wound care materials, etc.), patient care products, specialty hosiery and support products.
Source: Euromonitor, Pharmexpert, Supplier data, Internal estimates
163 199 237 278 322 368 413180
200240
288
346
415
498
2002 2003 2004F 2005F 2006F 2007F 2008F
Dietary supplements
Other*
Total PPh 343399
477
566
667
783
911
2003-2009 CAGR
Total PPh
18%
Other
20%
Supplements
15.8%
USD Millions
PARA-PHARMACEUTICAL MARKET FORECASTPARA-PHARMACEUTICAL MARKET FORECAST
17
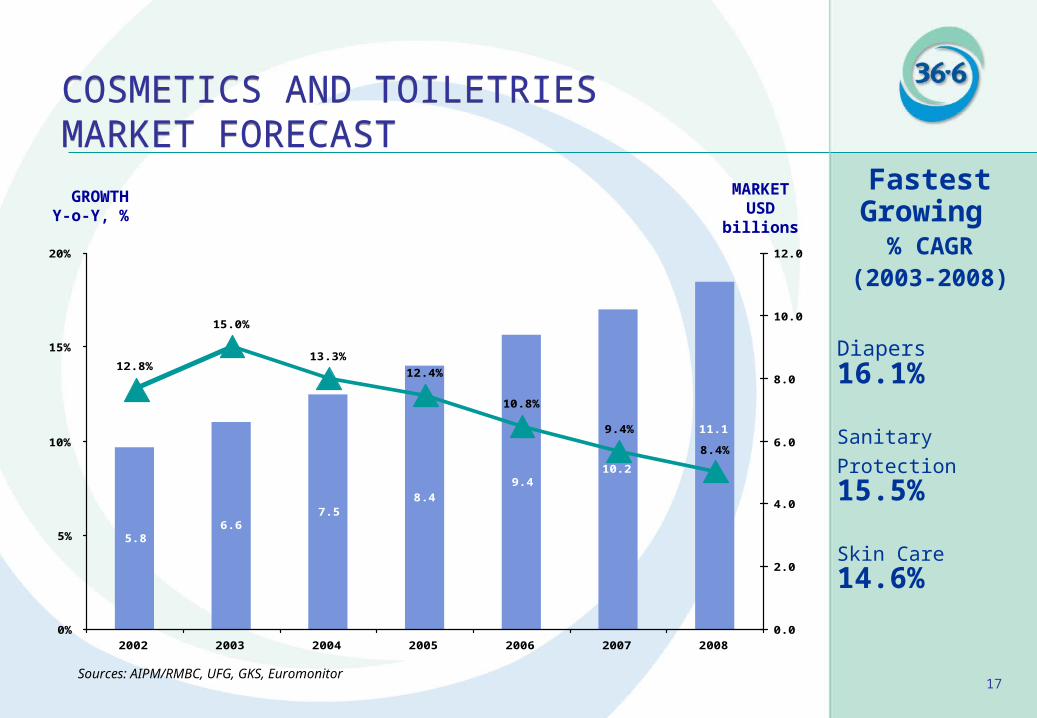
5.86.6
7.58.4
9.410.2
11.1
12.8%
15.0%
13.3%
12.4%
10.8%
9.4%
8.4%
0%
5%
10%
15%
20%
2002 2003 2004 2005 2006 2007 20080.0
2.0
4.0
6.0
8.0
10.0
12.0
Sources: AIPM/RMBC, UFG, GKS, Euromonitor
GROWTHY-o-Y, %
MARKETUSD billions
COSMETICS AND TOILETRIES MARKET FORECASTCOSMETICS AND TOILETRIES MARKET FORECAST
Diapers 16.1%
SanitaryProtection 15.5%
Skin Care 14.6%
Fastest Growing
% CAGR(2003-2008)

Pharmacy Chain 36.6
Russia’s Leading Health and Beauty Retailer

19
sales in 2003. EBITDA was 9.3% in 2003.
market capitalization. 20% of shares placedin 2003 IPO.
topline annual growth: 30% in retail, 20% inmanufacturing.
in 7 Russian regions.
purchases in 4th quarter 2004.
in the generic portfolio of Veropharm.
skilled personnel and experiencedmanagement team.
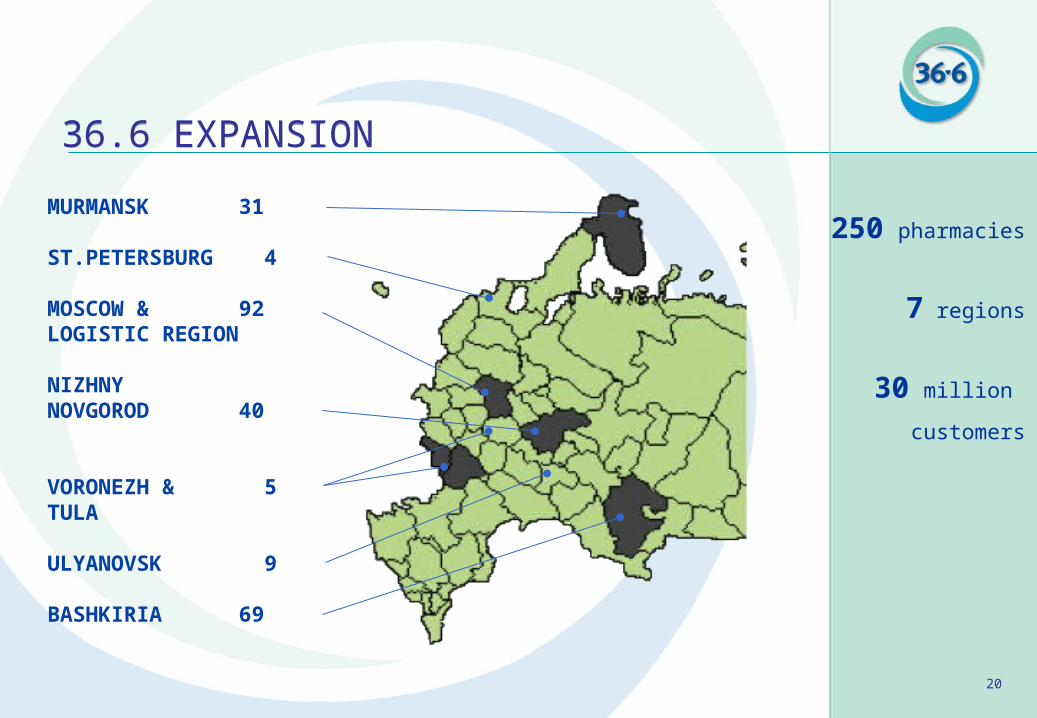
250pharmacies
145million
25%
290products
6000employees
147.8million
7.3million
36.6 AT A GLANCE36.6 AT A GLANCE
20
250 pharmacies
7 regions
30 million
customers
MURMANSK 31
ST.PETERSBURG 4
MOSCOW & 92LOGISTIC REGION
NIZHNYNOVGOROD 40
VORONEZH & 5TULA
ULYANOVSK 9
BASHKIRIA 69
36.6 EXPANSION36.6 EXPANSION
21
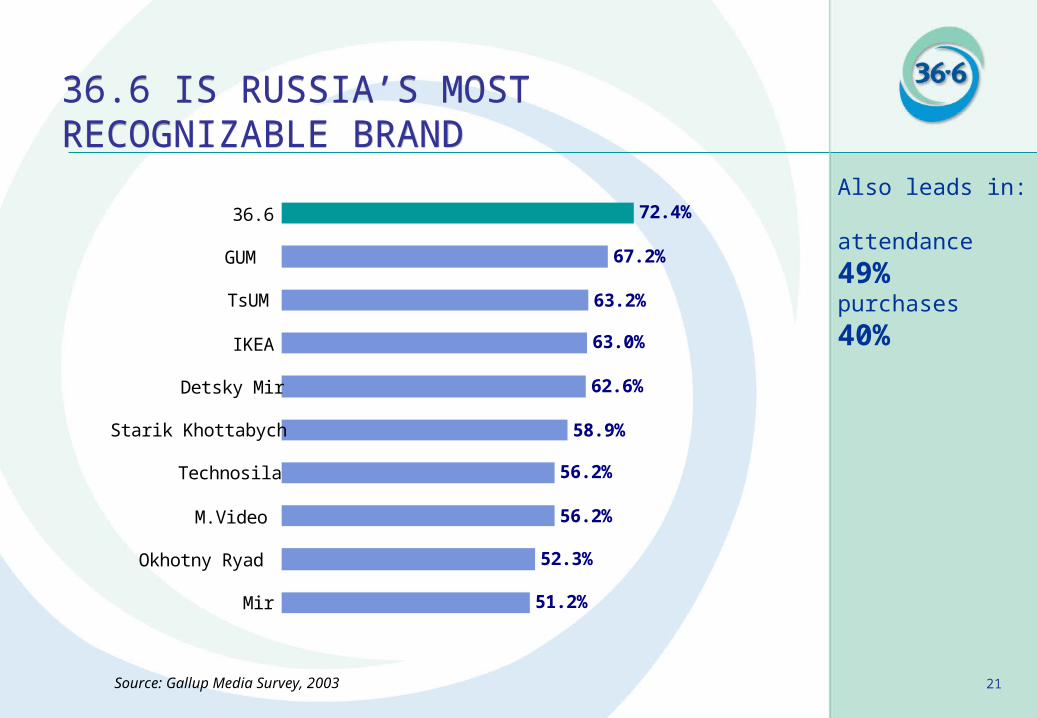
72.4%
67.2%
63.2%
63.0%
62.6%
58.9%
56.2%
56.2%
52.3%
51.2%
36.6
GUM
TsUM
IKEA
Detsky Mir
Starik Khottabych
Technosila
M.Video
Okhotny Ryad
Mir
Source: Gallup Media Survey, 2003
Also leads in:
attendance 49%purchases 40%
36.6 IS RUSSIA’S MOST RECOGNIZABLE BRAND36.6 IS RUSSIA’S MOST RECOGNIZABLE BRAND
22
We strive to increase the value of the company by providing our customers with a reason to come back.
CUSTOMER VALUE PROPOSITIONCUSTOMER VALUE PROPOSITION
Convenient locations.
Reliable quality products.
Excellent shopping experience.
Wide assortment.
Competitive prices.
23
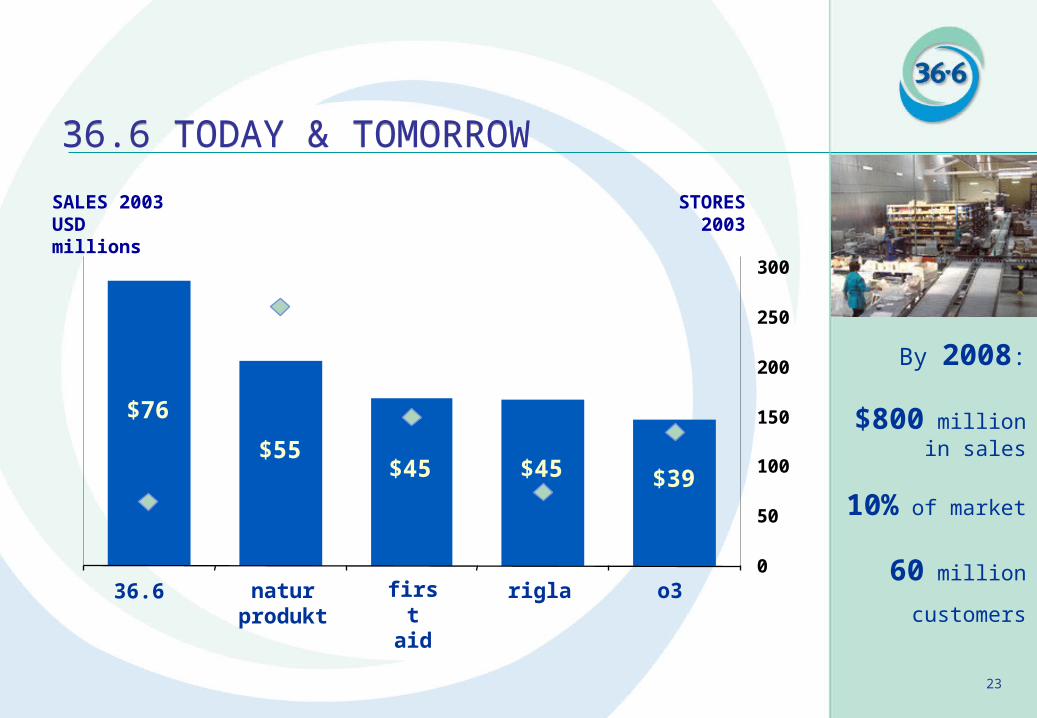
By 2008:
$800 million in sales
10% of market
60 million
customers
36.6 TODAY & TOMORROW36.6 TODAY & TOMORROW
0
50
100
150
200
250
300
$55
$76
$45 $45 $39
STORES2003
SALES 2003USD millions
36.6 o3riglafirst aid
natur produkt
24
Address: 105082 Moscow,36 Bolshaya Pochtovaya str.
Tel.: +7 (095) 792-5207Fax: +7 (095) 792-5206E-mail: [email protected]
www.pharmacychain366.com


