GEOLOGIC HAZARDS IMPACT ANALYSIS OF POTENTIAL GEOTHERMAL RESOURCE AREAS Circular C-107 State of Hawaii DEPARTMENT OF LAND AND NATURAL RESOURCES Division of Water and Land Development Honolulu, Hawaii September 1984
Transcript
GEOLOGIC HAZARDS IMPACT ANALYSIS
OF POTENTIAL GEOTHERMAL RESOURCE AREAS
Circular C-107
State of Hawaii DEPARTMENT OF LAND AND NATURAL RESOURCES
Division of Water and Land Development
Honolulu, Hawaii September 1984
GEORGE R. ARIYOSHI Governor
BOARD OF LAND AND NATURAL RESOURCES
SUSUMU ONO, Chairperson, Member at Large
ROLAND H. HIGASHI, Hawaii Member
THOMAS S. YAGI, Maui Member
J. DOUGLAS ING, Oahu Member
MOSES W. KEALOHA, Member at Large
LEONARD H. ZALOPANY, Kauai Member
DEPARTl\lENT OF LAND AND NATURAL RESOURCES
SUSUMU ONO, Chairperson and l\lember Board of Land and Natural Resources
EDGAR A. HAl\lASU, Deputy to the Chairperson
ROBERT T. CHUCK, Manager-Chief Engineer Division of Water and Land Development
ii
PREFACE
Act 296, Session Laws of Hawaii 1983, as amended by Act 151,
SLH 1984, requires that the Board of Land and Natural Resources
examine various factors when designating subzone areas for the
exploration, development, and production of geothermal resources.
These factors include potential for production, prospects for
utilization, geologic hazards, social and environmental impacts, land
use compatibility, and economic benefits. The Department of Land and
Natural Resources has prepared a series of reports which addresses
each of the subzone factors. This report analyzes the major geologic
hazards and their resultant effects within potential geothermal areas.
Effects include risks to people and property. Available hazard
mitigation techniques will also be described.
This report was prepared by Joseph Kubacki, Energy Specialist,
in collaboration with Dr. George Walker, Volcanologist with the Hawaii
Institute of Geophysics, and under the general direction of Manabu
Tagomori, Chief Water Resources and Flood Control Engineer, Division
of Water and Land Development, Department of Land and Natural
Kapoho, Hawaii . . . • • • • . . • . . • . . • 9 Use of Lava Diversion Walls and Explosives
on Mount Etna, Italy • • • • • . • • . . • • • • • • • 10 Pumping Water on Lava Flows in Kapoho, Hawaii . • • • . 11 Pumping Water on Lava Flows on Heimaey Island, Iceland • 11 Bombing Lava Channels on Mauna Loa, Hawaii. • . • • 12 Emergency Planning at the Geothermal Development
in Krafla, Iceland • • . . . . . . . . . • . 12
GEOLOGIC HAZARD ANALYSIS
Maui
Haleakala Southwest Rift Zone Haleakala East Rift Zone . . . . .
Hawaii
Hualalai . . . . . . . . . Mauna Loa Southwest Rift Zone Mauna Loa Northeast Rift Zone Kilauea Southwest Rift Zone Kilauea Upper East Rift Zone Kilauea Lower East Rift Zone
REFERL~ CES . . . . . . . . . . . . . .
v
13
13 13
14
14 14 15 16 17 20
37
Figure
1
2
3
4
5
6
7
8
9
10
11
12
13
14
15
16A
16B
16C
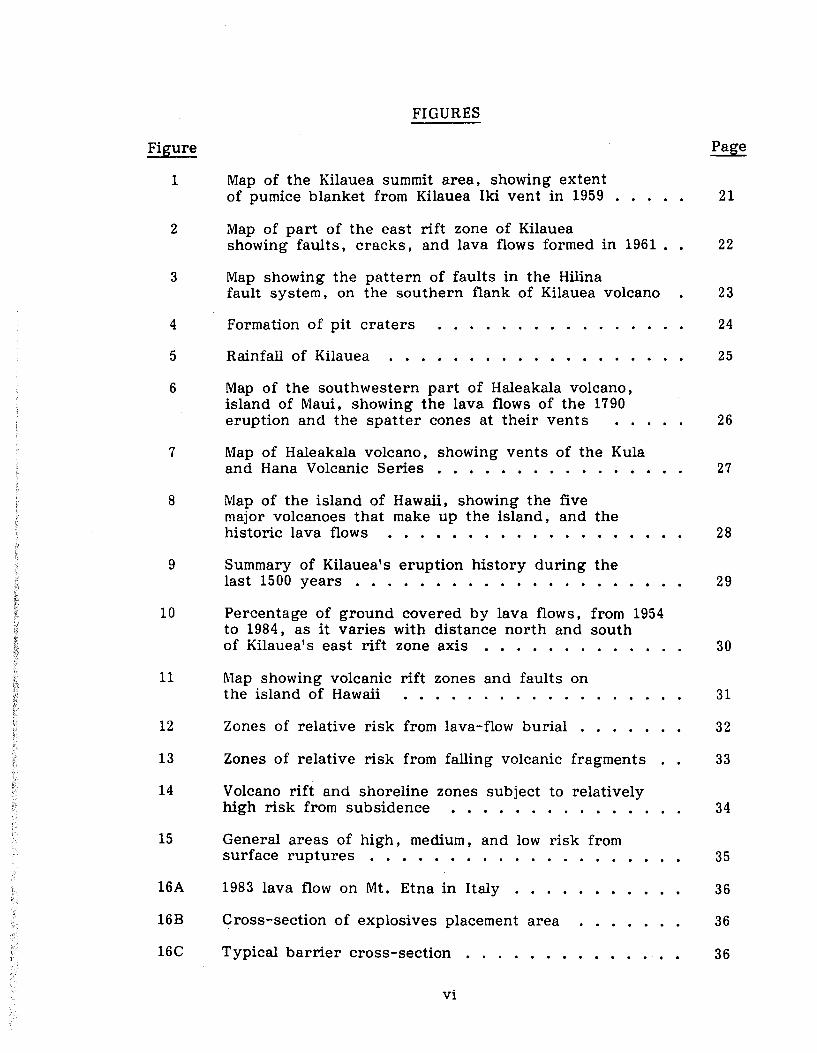
FIGURES
Map of the Kilauea summit area, showing extent of pumice blanket from Kilauea Iki vent in 1959
Map of part of the east rift zone of Kilauea showing faults, cracks, and lava flows formed in 1961 . .
Map showing the pattern of faults in the Hilina fault system, on the southern flank of Kilauea volcano
Formation of pit craters
Rainfall of Kilauea
Map of the southwestern part of Haleakala volcano, island of Maui, showing the lava flows of the 1790 eruption and the spatter cones at their vents
Map of Haleakala volcano, showing vents of the Kula and Hana Volcanic Series . . • . . • . . . . .
Map of the island of Hawaii, showing the five major volcanoes that make up the island, and the historic lava flows . • . • . . . . . • . . .
Summary of Kilauea's eruption history during the last 1500 years . . . . • . . . • . . . . . • . .
Percentage of ground covered by lava flows, from 1954 to 1984, as it varies with distance north and south of Kilauea's east rift zone axis . . . . . . . . . . . . .
Map showing volcanic rift zones and faults on the island of Hawaii . . . . . . . . . . . .
Zones of relative risk from lava-flow burial
Zones of relative risk from falling volcanic fragments
Volcano rift and shoreline zones subject to relatively high risk from subsidence . • . . . . • . . . .
General areas of high, medium, and low risk from surface ruptures • • . • .
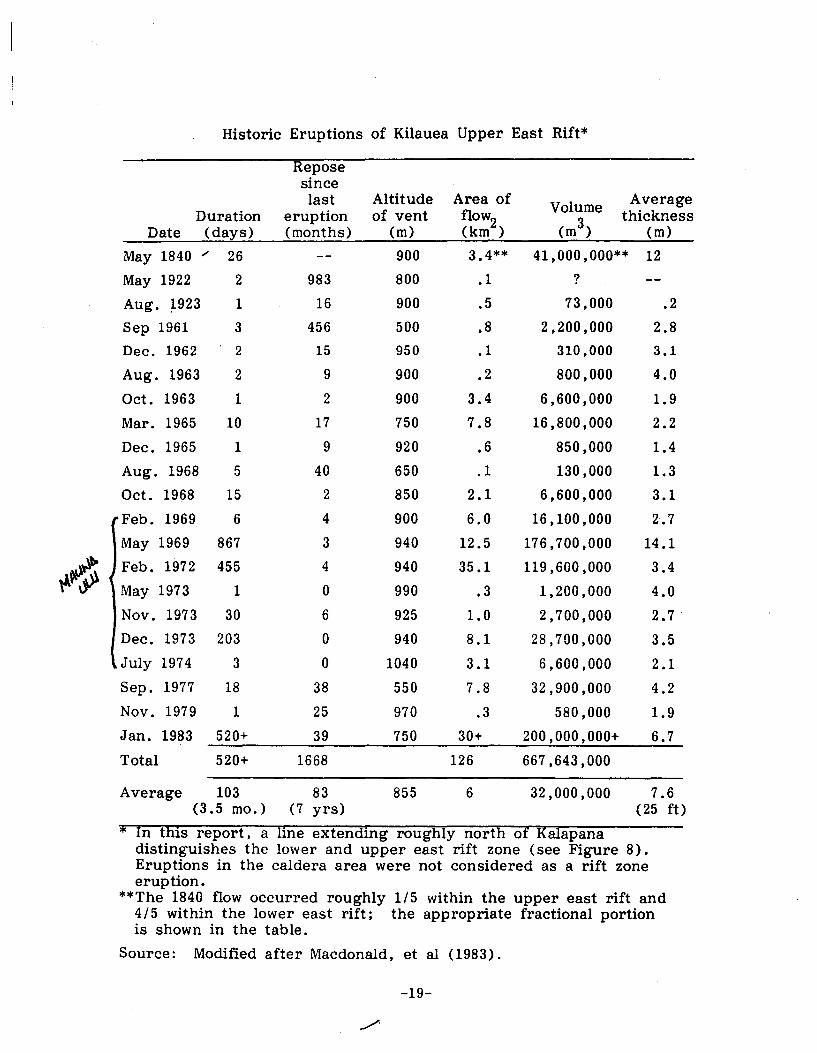
* In this report, a line extending roughly north of Kalapana distinguishes the lower and upper east rift zone (see Figure 8). Eruptions in the caldera area were not considered as a rift zone eruption.
**The 1840 flow occurred roughly 1/5 within the upper east rift and 4/5 within the lower east rift; the appropriate fractional portion is shown in the table.
Source: Modified after Macdonald, et al (1983).
-19-
Kilauea Lower East Rift Zone o There have been 5 eruptions on the lower east rift zone since
0
0
0
0
0
1750; an average of one every 47 years. 2 The largest flow, in 1955, covered2 an area of 16 km . The average flow has been about 11 km • The most recent flow, in 1960, covered an area of about 11 km
2
near and in Kapoho. The southern flanks of Kilauea's rift zones are much more prone to be covered by lava flows than are the north flanks due to its topography (see Figure 9). Figure 10 graphically depicts the percentage of ground covered by lava flows, from 1954 to 1984, as it varies with distance north and south of the rift zone axis. Intervals between historic eruptions have varied from 5 years (1955 to 1960) to 115 years (1840 to 1955). It is not possible to predict the precise time and place of future eruptions. The earthquake of 1868 on the southern tip of the island was the largest earthquake in this area (magnitude 7. 5).
0 There may be some danger from tsunami and ground subsidence in the coastal portion of this geothermal resource area.
Historic Eruptions of Kilauea Lower East Rift*
Duration Date (days)
1750 (?)
1790 (?)
May 1840
Feb. 1955
Jan. 1960
Total
Average
26
88
36
50
Repose since last
eruption (months)
480
605
1384
56
2525
631 (53 yrs)
Altitude of vent
(m)
510
300
350
175
35
274
Area of flow2 (km )
4.1
7.9
13.8**
15.9
10.7
52.4
10.5
Average thickness
(m)
14,200,000 3.5
27,500,000 3.5
164,000,000** 11.9
87,600,000 5.5
113,200,000 10.6
406,500,000
81,000,000 9.5 (31 ft)
* In this report, a line extending rqughly north of Kalapana distinguishes the lower and upper east rift zone (see Figure 8) • Eruptions in the caldera area were not considered as a rift zone eruption.
**The 1840 flow occurred roughly 1/5 within the upper east rift and 4 I 5 within the lower east rift; the appropriate fractional portion is shown in the table.
Source: Modified after Macdonald, et al, p. 64 (1983)
Figure 1. Map of the Kilauea summit area, showing extent of pumice blanket from Kilauea Iki vent in 1959. (In Mullineaux and Peterson, 1974, from Richter and others, 1970)
0 !5 kilometers . o c • ...,.,-_.,.-.__ ____ __, iliJ ..... c ....
Figure 2. Map of part of the east rift zone of Kilauea showing faults, cracks, and lava flows formed in 1961. (In Holcomb, 1980; modified after Richter et al., 1964)
-22-
, .'
• o\)' 0
,, Fault, dashed where 1nferred;
symbol shows s1de that moved down
0 Pit crater
----+-------------19•15 0 Cinder and spatter cone
Fissure 0
knomerera
Figure 3. Map showing the pattern of faults in the Hilina fault system, on the southern flank of Kilauea volcano. (In Macdonald et al., 1983; modified after Stearns and Macdonald, 1946)
-23-
A WEST
8 - ·- -·-
c
D 0
-~-:------·----------~
' ' ' '
1 kilometer
EAST
Meters A Dove Seo L.evel
·900
00
00
Diagram showing the manner of formation of
Makaopuhi, a double pit crater. A. A subcircular fault block sinks. leaving a crater at the surface. (The position and attitude of tht- faults is hypothetical.) The upper walls of the crater collapse to form talus<"s (pilt"s of rock fragments) that hide the lower walls. B. Lava pouring into the cratt-r collects in a deep pool. the surface of which solidifies to form a nt-arly flat floor. C. A second block sinks. making a second crater that cuts across the westem edgt- of the first one. The pool of lava in the bottom of the second crater is from a small eruption in 192 2. D. :\ much Ia r~er eruption (in 19fi5) forms a poo\90 meters dt't'p in tht• st·cond crater.
Noh' tht> slump Sl'<Hps at tht• ed~e of tht· nt·w Ia' '' floor. fornwd as la,·a in tht' c:t•ntral part of the crater dr<~lll~ l>.tck into undnh ·
in~ wnts.
Figure 4. Formation of pit craters. (Macdonald et al. , 1983)
-24-
f o...._, _ ___._'P-~2..0 Km.
. Figure 5. Rainfall of Kilauea. (In Holcomb, 1980; after Taliaferro 1959)
Figure 6. Map of the southwestern part of Haleakala volcano, island of Maui, showing the lava flows of the 1790 eruption and the spatter cones at their vents. (In Macdonald et al., 1983; modified after Stearns and Macdonald, 1942)
-26-
I I I I
0
0
-t- 0
0 0 1 ~
0
.,:) /
0 -<\ 0
0 ..-\0
0 0
00 0 0 0
0 0
0 0
0
0 0 0
0
xx X X X
"x X
X X
"' X
Figure 7. Map of Haleakala volcano, showing vents of the Kula (circles) and Hana (crosses) Volcanic Series. i\Iolokini Islet is a t·uff cone on the southwest rift zone of Haleakala. (In l\1acdonald et al., 1983; after Stearns and Macdonald, 1942)
-27-
N '~
o._:::::a;;;;c::ii0._ _ _..20 Kilometers
OC=-o::::::.' •lii:0'=======20 M i I e s Contour intervol 1000 feet
Figure 8. Map of the island of Hawaii, showing the five major volcanoes that make up the island, and the historic lava flows. (Macdonald et al., 1983)
-28-
I
500 - 1000 rra. ·~·
250 - 100 yra. ·~·
• Type A, 8 eruptlonl
C-JJ Type c eruption•
110 - 210 yra ......
eo - 110 yra. a . .-.
0 - 50 yra. B.P.
• Type D eruption•
lEttfJ Type E eruption•
[3 Younger lava flowl
0 Older lava flowe
Figure 9. Summary of Kilauea's eruption history during the last 1500 years. (Holcomb, 1980)
-29-
az -60-
so-
~ -60-
40-
30 ..
/0 ..
+ 8
Kilauea Lower East Rift Zone
Kilauea Upper East Rift Zone
+ 2.
Km south of rift zone axis ' 0 2. 4 6
Km north of rift zone axis
Figure 10. Percentage of ground covered by lava flows, from 1954 to 1984, as it varies with distance north and south of Kilauea's east rift zone axis. If 30 years is the assumed life of a geothermal power plant, these figures suggest the probability that sites may be threatened by burial during their lifetime, as based on Kilauea's history from 1954 to 1984.
Figure 11. Map showing volcanic rift zones and faults on the island of Hawaii. (In Macdonald et al., 1983; submarine slumps after Normark et al., 1978)
-31-
--- Physit:al boundary, approximately located
-----Judgmental boundary
• I
" . ,._
I I I
• .. .......
Figure 12. Zones of relative risk from lava-flow burial. Risk increases from "a" through "f". (Mullineaux and Peterson, 1974)
-32-
---Judgmental bounda-ry
L
·--·
• . ·-I " ! • .:. ....... •
Figure 13. Zones of relative risk from falling volcanic fragments: H, high; M, medium; L, low. (Mullineaux and Peterson, 197 4)
-33-
...... . . .. •
• I • . ·-
" ............
Figure 14. Volcano rift and shoreline zones subject to relatively high risk from subsidence (cross hachured). (Mullineaux and Peterson, 1974)
-34-
----Judgmental boundary
• I • . --
1 .:. ......... •
Figure 15. General areas of high (H), medium (M); and low (L) risk from surface ruptures. (Mullineaux and Peterson, 1974)
-35-
16a
DRILLHOLES
16b
......
16c
Figure 16A. 1983 lava flow on Mt. Etna in Italy. Figure 16B. Cross-section of explosives placement area. Figure 16C. Typical barrier cross-section
(Figures from Lockwood, 1983)
-36-
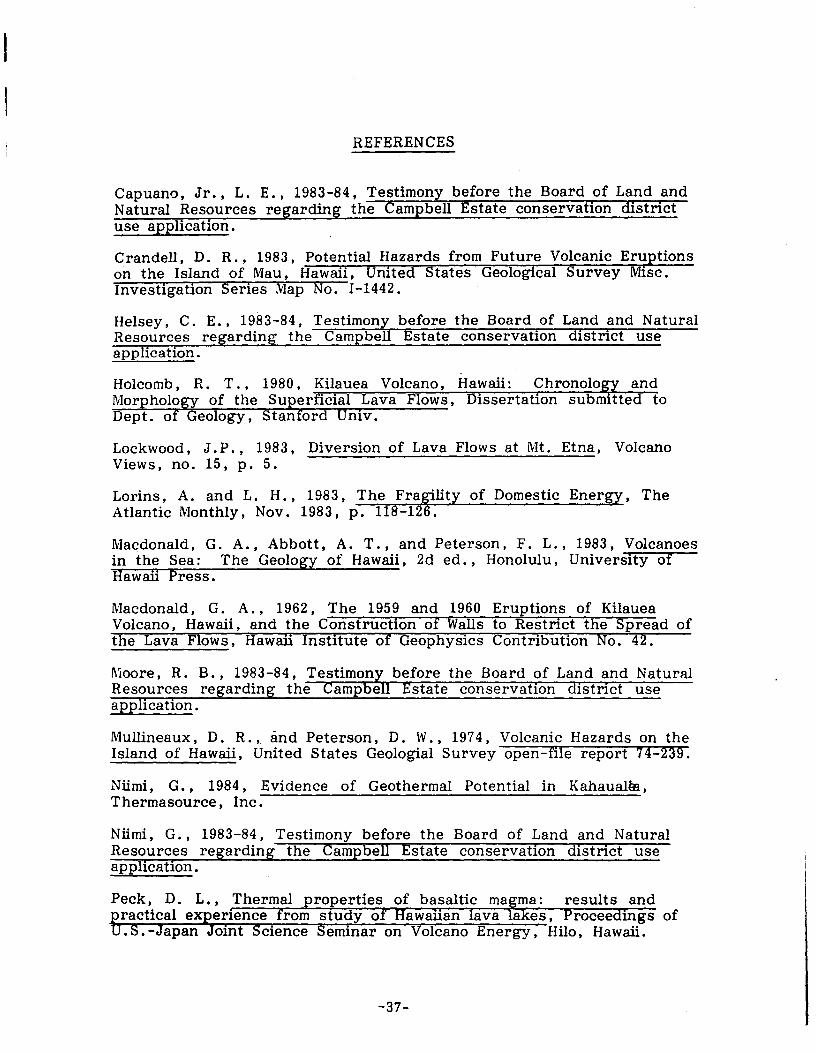
REFERENCES
Capuano, Jr., L. E., 1983-84, Testimony before the Board of Land and Natural Resources regarding the Campbell Estate conservation district use application.
Crandell, D. R., 1983, Potential Hazards from Future Volcanic Eruptions on the Island of Mau, Hawaii, United States Geological Survey Mise. Investigation Series Map No. l-1442.
Heisey, C. E., 1983-84, Testimony before the Board of Land and Natural Resources regarding the Campbell Estate conservation district use application.
-Holcomb, R. T., 1980, Kilauea Volcano, Hawaii: Chronolo and Morphology of the Super icial Lava Flows, Dissertation submitted to Dept. of Geology, Stanford Univ.
Lockwood, J.P., 1983, Diversion of Lava Flows at Mt. Etna, Volcano Views, no. 15, p. 5.
Lorins, A. and L. H., 1983, The Fraflity of Domestic Energy, The Atlantic Monthly, Nov. 1983, p. 118-12 .
Macdonald, G. A. , Abbott, A. T. , and Peterson, F. L. , 1983, Volcanoes in the Sea: The Geology of Hawaii, 2d ed., Honolulu, University of Hawaii Press.
Macdonald, G. A., 1962, The 1959 and 1960 Erlttions of Kilauea Volcano, Hawaii, and the Construction of Walls to estrict the Spread of the Lava Flows, Hawaii Institute of Geophysics Contribution No. 42.
application.
Mullineaux, D. R., and Peterson, D. W., 1974, Volcanic Hazards on the Island of Hawaii, United States Geologia! Survey open-file report 74-239.
Niimi, G., 1984, Evidence of Geothermal Potential in Kahaualm, Thermasource, Inc.
Niimi, G., 1983-84, Testimony before the Board of Land and Natural Resources re ardin the Cam bell Estate conservation district use app ICahon.
Peck, D. L. , Thermal properties of basaltic ma~ma: results and tJractical ex1;rrience from study of Hawaiian lava akes, Proceedings of
• S. -Japan oint Science Seminar on Volcano Energy, Hila, Hawaii.
-37-
Sean Report, March 1984, Mauna Loa Volcano, U.S.G.S. Hawaiian Volcano Observatory.
Stearns, H. T. , not dated, The Geothermal Well Field in the Puna District, Hawaii, report prepared for the Hawaiian Electric Company.
True/Mid-Pacific Geothermal Venture, 1982, Revised Environmental Impact Statement for the Kahauale' a Geothermal Project , prepared by R. M. Towill Corp. , Honolulu.
Tryggvason, E., 1979, Rifting of the Plate Boundary in North Iceland 1975-1978, Journal of Geophysical Research, Vol. 84, p. 3029.
Williams, R. S. and Moore, J. G. , 1977, the Eruption on Heimaey, U.S. Geological Survey Publication.