State of Illinois Office of the Treasurer College Savings Program Financial Audit Years Ended June 30, 2012 and 2011 Performed as Special Assistant Auditors for the Auditor General, State of Illinois
Transcript
State of Illinois Office of the Treasurer College Savings Program Financial Audit Years Ended June 30, 2012 and 2011 Performed as Special Assistant Auditors for the Auditor General, State of Illinois
State of Illinois Office of the Treasurer College Savings Program
Table of Contents
Page
Treasurer’s Office Officials 1 Financial Statement Report Summary 2 Independent Auditors’ Report 3 - 4 Statements of Fiduciary Net Assets 5 Statements of Changes in Fiduciary Net Assets 6 Notes to the Financial Statements 7 - 20 Supplementary Information Combining Statements of Fiduciary Net Assets 21 Combining Statements of Changes in Fiduciary Net Assets 22 Bright Start Statements of Fiduciary Net Assets by Portfolio 23 - 32 Bright Directions Statements of Fiduciary Net Assets by Portfolio 33 - 46 Bright Start Statements of Changes in Fiduciary Net Assets by Portfolio 47 - 56 Bright Directions Statements of Changes in Fiduciary Net Assets by Portfolio 57 - 71 Other Information Key Performance Measures (Unaudited) 72 - 73 Bright Start Investment Policy (Unaudited) 74 - 81 Bright Directions Investment Policy (Unaudited) 82 - 88 Independent Auditors’ Report on Internal Control Over Financial Reporting and on Compliance and Other Matters Based on an Audit of Financial Statements Performed in Accordance with Government Auditing Standards 89 - 90
1
State of Illinois Office of the Treasurer College Savings Program
Treasurer’s Office Officials Treasurer Honorable Dan Rutherford Chief of Staff Mr. Kyle Ham Executive Director of Finance Ms. Bridget Byron (March 21, 2012 – present) Deputy Treasurer/CFO Mr. Edward Buckles (through December 31, 2011) General Counsel Ms. Maureen Lydon Director of College Savings Program Ms. Bridget Byron Manager of College Savings Program Mr. Randall Welsh (July 1, 2012 to present) Inspector General Mr. David Wells Chief Internal Auditor Ms. Barbara Ringler Compliance and Reporting Manager - College Savings Program Mr. Deon Perryman
The Office of the Treasurer maintains the following four office locations:
Executive Office State Capitol
219 State House Springfield, Illinois 62706
Operational Divisions
Illinois Business Center 400 West Monroe
Springfield, Illinois 62704
Unclaimed Property & Other Divisions Myers Building
1 W. Old State Capitol Plaza Springfield, Illinois 62701
Chicago Office Legal / Programmatic
James R. Thompson Center 100 West Randolph Street
Suite 15-600 Chicago, Illinois 60601
FINANCIAL STATEMENT REPORT
2
State of Illinois Office of the Treasurer College Savings Program
Financial Statement Report Summary The audit of the accompanying financial statements of the College Savings Program of the State of Illinois, Office of the Treasurer, was performed by McGladrey LLP as of and for the years ended June 30, 2012 and 2011. Based on their audits, the auditors expressed unqualified opinions on the College Savings Program’s financial statements.
Independent Auditors’ Report
3
Independent Auditors’ Report The Honorable William G. Holland Auditor General State of Illinois As Special Assistant Auditors for the Auditor General, we have audited the accompanying Statements of Fiduciary Net Assets of the College Savings Program, a fiduciary (private-purpose trust) fund of the State of Illinois, Office of the Treasurer, as of June 30, 2012 and 2011, and the related Statements of Changes in Fiduciary Net Assets for the years then ended. These financial statements are the responsibility of management of the State of Illinois, Office of the Treasurer. Our responsibility is to express an opinion on these financial statements based on our audits. We conducted our audits in accordance with auditing standards generally accepted in the United States of America and the standards applicable to financial audits contained in Government Auditing Standards,
issued by the Comptroller General of the United States. Those standards require that we plan and perform the audit to obtain reasonable assurance about whether the financial statements are free of material misstatement. An audit includes consideration of internal control over financial reporting as a basis for designing audit procedures that are appropriate in the circumstances, but not for the purpose of expressing an opinion on the effectiveness of the College Savings Program’s internal control over financial reporting. Accordingly, we express no such opinion. An audit also includes examining, on a test basis, evidence supporting the amounts and disclosures in the financial statements, assessing the accounting principles used and significant estimates made by management, as well as evaluating the overall financial statement presentation. We believe that our audits provide a reasonable basis for our opinion. As discussed in Note 1, the financial statements of the College Savings Program of the State of Illinois, Office of the Treasurer present only this fiduciary (private-purpose trust) fund and do not purport to, and do not, present fairly the financial position of the State of Illinois, Office of the Treasurer as of June 30, 2012 and 2011, and the changes in its financial position for the years then ended in conformity with accounting principles generally accepted in the United States of America. In our opinion, the June 30, 2012 and 2011 financial statements referred to above present fairly, in all material respects, the financial position of the College Savings Program Fund as of June 30, 2012 and 2011, and the changes in financial position thereof, for the years then ended in conformity with accounting principles generally accepted in the United States of America. In accordance with Government Auditing Standards, we have also issued our reports dated December 17, 2012, and February 22, 2012 on our consideration of the State of Illinois, Office of the Treasurer’s internal control over financial reporting of the College Savings Program and our tests of the State of Illinois, Office of the Treasurer’s compliance with certain provisions of laws, regulations, contracts and grant agreements, and other matters. The purpose of these reports is to describe the scope of our testing of internal control over financial reporting and compliance and the results of that testing, and not to provide an opinion on the internal control over financial reporting or on compliance. These reports are an integral part of an audit performed in accordance with Government Auditing Standards and should be considered in assessing the results of our audits.
4
Management has omitted management’s discussion and analysis for the College Savings Program that accounting principles generally accepted in the United States of America requires to be presented to supplement the financial statements. Such missing information, although not a required part of the fund financial statements, is required by the Governmental Accounting Standards Board who considers it to be an essential part of the financial reporting for placing the fund financial statements in an appropriate operational, economic or historical context. Our opinion on the fund financial statements is not affected by this missing information.
Our audits were conducted for the purpose of forming an opinion on the financial statements of the College Savings Program Fund of the State of Illinois, Office of the Treasurer. The combining statements, Bright Start statements and Bright Directions statements on pages 21 through 71 are presented for purposes of additional analysis and are not a required part of the fund financial statements. Such information is the responsibility of management and was derived from and relates directly to the underlying accounting and other records used to prepare the fund financial statements. The information has been subjected to the auditing procedures applied in the audit of the fund financial statements and certain additional procedures, including comparing and reconciling such information directly to the underlying accounting and other records used to prepare the fund financial statements or to the fund financial statements themselves, and other additional procedures in accordance with auditing standards generally accepted in the United States of America. In our opinion, the information is fairly stated in all material respects in relation to the fund financial statements as a whole.
Our audits were conducted for the purpose of forming an opinion on the financial statements of the College Savings Program of the State of Illinois, Office of the Treasurer. The other information which includes key performance measures and the Bright Start and Bright Directions investment policies is presented for purposes of additional analysis and is not a required part of the fund financial statements. Such information has not been subjected to the auditing procedures applied in the audits of the fund financial statements, and accordingly, we do not express an opinion or provide any assurance on it.
Schaumburg, Illinois December 17, 2012
5
2012 2011
Assets
Cash and cash equivalents 324,469,353$ 218,903,260$
Capital shares receivable 4,897,740 4,129,592
Securities sold receivable 787,700 684,306
Dividends receivable 1,353,454 1,273,344
Mutual funds 4,214,035,424 3,907,719,754
Total assets 4,545,543,671$ 4,132,710,256$
Liabilities and Net Assets
Liabilities
Payable for capital shares 3,377,245$ 5,656,591$
Payable for securities purchased 1,809,674 1,738,153
Other liabilities 1,274,498 1,384,020
Total liabilities 6,461,417 8,778,764
Net assets held in trust for participants 4,539,082,254 4,123,931,492
Total liabilities and net assets 4,545,543,671$ 4,132,710,256$
The accompanying notes are an integral part of these statements.
June 30, 2012 and 2011
State of Illinois
Office of the Treasurer
College Savings Program
Statements of Fiduciary Net Assets
6
2012 2011
Investment income (expense)
Investment earnings 39,715,905$ 34,501,712$
Net change in fair value of investments 40,548,095 594,881,143
Distribution fees (3,049,007) (2,880,424)
State administrative fees (748,048) (796,993)
Insurance fees (264,872) (196,970)
12b-1 fees (2,703,176) (2,211,451)
Management and bank custodial fees (8,783,468) (7,994,225)
Net investment earnings 64,715,429 615,302,792
Distributions to participants
Net investment income (24,308) (16,111)
Other participant transactions
Program contributions 1,628,541,126 1,539,502,826
Program distributions (1,278,104,640) (1,148,711,670)
Distributions reinvested 23,155 16,939
Total increase from participant transactions 350,459,641 390,808,095
Change in net assets 415,150,762 1,006,094,776
Net assets, beginning of fiscal year 4,123,931,492 3,117,836,716
Net assets, end of fiscal year 4,539,082,254$ 4,123,931,492$
The accompanying notes are an integral part of these statements.
Statements of Changes in Fiduciary Net Assets
For the Years Ended June 30, 2012 and 2011
State of Illinois
Office of the Treasurer
College Savings Program
State of Illinois Office of the Treasurer College Savings Program Notes to the Financial Statements For the Years Ended June 30, 2012 and 2011
7
Background In May 1999, the General Assembly of the State of Illinois adopted Public Act 91-0607 authorizing the State Treasurer of the State of Illinois (the “Treasurer”) to establish and administer a program designed to be a “qualified state tuition program” under Section 529 of the Internal Revenue Code of 1986, as amended. The program is known as the College Savings Program (the “Program”). Participants of the Program have a choice of two Section 529 investment programs, the Bright Start College Savings Program (“Bright Start”) and the Bright Directions College Savings Program (“Bright Directions”). Bright Start commenced operations on March 27, 2000. Bright Directions commenced operations on November 18, 2005. Investors may participate in Bright Start directly (Direct-sold Plan) or through participating financial advisors (Advisor-sold Plan). Bright Directions is available through participating financial advisors only. The Program provides an opportunity for investors residing in Illinois to invest on a tax-favored basis toward the qualified higher education expenses of a designated beneficiary (the “Beneficiary”) associated with attending an Institution of Higher Education. If the investor is not an Illinois taxpayer, depending upon the laws of the investor’s home state or the home state of the investor’s beneficiary, favorable state tax treatment or other benefits offered by such home state for investing in Section 529 college savings plans may be available only if invested in the home state’s Section 529 plan. Institutions of Higher Education generally include accredited postsecondary educational institutions offering credit toward a bachelor’s degree, an associate’s degree, a graduate level or professional degree, or another recognized postsecondary credential including certain proprietary, postsecondary vocational and foreign institutions. The institution must be eligible to participate in the U.S. Department of Education student aid programs. Qualified higher education expenses generally include tuition, fees, books, supplies, and equipment required for the Beneficiary’s enrollment plus, subject to certain limitations, room and board expenses provided the Beneficiary is enrolled on at least a half-time basis. Under the Program, Program participants (the “Account Owners”) select investment portfolios for their accounts established for the purpose of helping Account Owners meet the qualified higher education expenses of the Beneficiaries designated on the Program accounts (the “Accounts”). Amounts contributed to the Program will be invested in the College Savings Trust (the “Trust”). As of June 30, 2012, OFI Private Investments, Inc. provided investment advisory, administrative, recordkeeping and marketing services for the Bright Start Program. As of June 30, 2012, Union Bank and Trust Company advised the Treasurer on the investment of contributions and provided administrative, recordkeeping and marketing services for the Bright Directions Program. As such, as of June 30, 2012, OFI Private Investments, Inc. and Union Bank and Trust Company acted as program managers (the “Managers”) of the two investment programs. The Treasurer acts as trustee and is responsible for the overall administration of the programs. Note 1. Summary of Significant Accounting Policies Financial Reporting Entity
As described in the Illinois Comprehensive Annual Financial Report, the State of Illinois is the primary government which includes all funds, elected offices, departments and agencies of the State, as well as boards, commissions, authorities, universities and colleges over which the State’s executive or legislative branches exercise legal control.
State of Illinois Office of the Treasurer College Savings Program Notes to the Financial Statements For the Years Ended June 30, 2012 and 2011
8
Note 1. Summary of Significant Accounting Policies (Continued) The College Savings Program is a separate legal entity from the State of Illinois, with the assets segregated into a Trust, and the Treasurer appointed as Trustee of the Trust, as established in the Declaration of Trust dated March 27, 2000. However, for financial reporting purposes, the College Savings Program is a part of the primary government. The Program is included in the Illinois Comprehensive Annual Financial Report as a private-purpose trust fund. The scope of the College Savings Program financial statements presented herein is limited to the financial position of the College Savings Program private-purpose trust fund.
Fiduciary Fund
The College Savings Fund is classified as a private-purpose trust fund. This trust fund is used to account for assets held by the Treasurer in a trustee capacity. This fund is not held in the State Treasury and is a non-appropriated fund.
Basis of Accounting and Measurement Focus
The accounts of the College Savings Program are maintained and reported using the economic resources measurement focus and the accrual basis of accounting. Revenues are recorded when earned and expenses are recorded at the time liabilities are incurred, regardless of when the related cash flow takes place.
Cash and Cash Equivalents
Cash and cash equivalents consist of money market mutual funds and timing differences associated with the purchase of mutual fund shares and short-term, highly liquid investments readily convertible to cash, with a maturity of 90 days or less at the time of purchase.
Investment Earnings
Investment earnings are a combination of dividend income and interest income generated from mutual fund investments. Mutual fund yields are subject to market rate fluctuations.
Fair Value of Investments
Investments in the underlying funds are carried at fair value based on the closing net asset or unit value per share of each Underlying Fund on the last business day on or prior to June 30.
State of Illinois Office of the Treasurer College Savings Program Notes to the Financial Statements For the Years Ended June 30, 2012 and 2011
9
Note 1. Summary of Significant Accounting Policies (Continued) Management Estimates
To prepare financial statements in conformity with accounting principles generally accepted in the United States of America, management is required to make certain estimates that affect the reported amounts of assets and liabilities and disclosure of contingent assets and liabilities at the date of the financial statements and the reported amounts of revenues and expenses during the reporting period. These estimates may differ from actual results. Presentation Changes Certain presentations for the year ended June 30, 2011 have been changed to be consistent with the current (FY2012) presentation. Note 2. Investments
Governmental Accounting Standards Board Statement No. 31, Accounting and Financial Reporting for Certain Investments and for External Investment Pools, established standards for accounting for investments held by governmental entities. The College Savings Program has been designed as a qualified state tuition program under Section 529 of the Internal Revenue Code and reports all investments at fair value based upon quoted market value with the exception of investments in the Bright Start Principal Protection Income Portfolio which are reported at contract value.
Bright Start College Savings Program
Permitted Investments:
The Treasurer’s Bright Start investment activities are governed by the Treasurer’s published Bright Start investment policy (included in the “other information” section of this report), which was developed in accordance with the State statute. In addition, the Treasurer has adopted its own investment practices, which supplements the statutory requirements. The Bright Start Investment Policy allows funds (contributions) to be invested in one of several Portfolios, each with a designated mix of investments that is appropriate for the investment objective of the Portfolio. Each Portfolio allocates assets in a combination of underlying investments, investing among large capitalization U.S. stocks, small capitalization U.S. stocks, international stocks, fixed-income and/or short-term investments. The asset allocation of each Portfolio is established by the Treasurer and managed by the Manager. The Treasurer may adjust the weighting in stocks, bonds and cash in each Portfolio and may change the underlying investments within the Portfolios consistent with its Investment Policy Statement and its agreement with the Manager.
State of Illinois Office of the Treasurer College Savings Program Notes to the Financial Statements For the Years Ended June 30, 2012 and 2011
General Overview The Bright Start Program offers the following investment portfolios:
Direct-sold Plan: Advisor-sold Plan: Blended Age-Based Portfolios Blended Fixed Income Portfolio Blended Equity Portfolio Blended Balanced Portfolio Money Market Portfolio Principal Protection Income Portfolio Index Age-Based Portfolios Index Fixed Income Portfolio Index Equity Portfolio Index Balanced Portfolio
Advisor Age-Based Portfolios Advisor Fixed Income Portfolio Advisor Equity Portfolio Advisor Balanced Portfolio Advisor Money Market Portfolio Principal Protection Income Portfolio
Brief Description of Investment Portfolios: Age-Based Portfolios: The goal of a portfolio under the Age-Based Option is to seek an asset allocation strategy consistent with the ages of the Beneficiaries of those Account Owners who have invested in that Portfolio. Based on the age of the Beneficiary, the following Age-Based Portfolios are available:
Direct-sold Plan: Advisor-sold Plan: Blended Age-Based 0-6 Years Portfolio Blended Age-Based 7-9 Years Portfolio Blended Age-Based 10-11 Years Portfolio Blended Age-Based 12-14 Years Portfolio Blended Age-Based 15-17 Years Portfolio Blended Age-Based 18 Years Portfolio Index Age-Based 0-6 Years Portfolio Index Age-Based 7-9 Years Portfolio Index Age-Based 10-11 Years Portfolio Index Age-Based 12-14 Years Portfolio Index Age-Based 15-17 Years Portfolio Index Age-Based 18 Years Portfolio
Advisor Age-Based 0-6 Years Portfolio Advisor Age-Based 7-9 Years Portfolio Advisor Age-Based 10-11 Years Portfolio Advisor Age-Based 12-14 Years Portfolio Advisor Age-Based 15-17 Years Portfolio Advisor Age-Based 18 Years Portfolio
State of Illinois Office of the Treasurer College Savings Program Notes to the Financial Statements For the Years Ended June 30, 2012 and 2011
11
Note 2. Investments (Continued) Account assets generally do not remain in the Age-Based Portfolio in which they are initially invested. Account assets are redeemed by the Manager when the Beneficiary attains an age that is greater than the upper limit of the age range that corresponds to a particular Portfolio, including the Portfolio in which assets were invested initially. The Manager then reinvests these assets in the Portfolio that corresponds to the age of the Beneficiary. This continues until the Beneficiary is 18 years old, or the assets are withdrawn from the Account, whichever occurs first. The asset allocation strategy for the Age-Based Portfolio becomes increasingly conservative with each successive Portfolio. Fixed Income Portfolios: Blended Fixed Income Portfolio Advisor Fixed Income Portfolio Index Fixed Income Portfolio The goal of the Fixed Income Portfolios is to seek the relatively more stable returns of a fixed income investment in exchange for giving up the long-term return potential that the stock market may offer. Equity Portfolios:
Blended Equity Portfolio Advisor Equity Portfolio Index Equity Portfolio The goal of the Equity Portfolios is to seek long-term capital appreciation through investments in equity mutual funds. The Equity Portfolio is only appropriate for investors with longer time horizons, who are comfortable with an increased level of risk while seeking higher longer-term returns, or who use this investment Portfolio as part of an overall college savings strategy that includes less aggressive investments. Balanced Portfolios:
Blended Balanced Portfolio Advisor Balanced Portfolio Index Balanced Portfolio The goal of the Balanced Portfolios is to seek attractive total return with reasonable safety of principal through investment in equity and fixed income securities. Money Market Portfolios: Money Market Portfolio Advisor Money Market Portfolio
The goal of the Money Market Portfolio is to seek current income and preservation of principal.
State of Illinois Office of the Treasurer College Savings Program Notes to the Financial Statements For the Years Ended June 30, 2012 and 2011
12
Note 2. Investments (Continued) Principal Protection Income Portfolio:
Principal Protection Income Portfolio
The Principal Protection Income Portfolio attempts to significantly reduce fluctuations in the value of its assets, other than money market securities and money market fund securities, by investing in Security Backed Investment Contracts (also called Synthetic Guaranteed Investment Contracts or Synthetic GICs). Security Guaranteed Investment Contracts are comprised of two components: investment contracts (also called wrapper agreements) and an underlying portfolio of marketable fixed income securities which are held and owned by the Portfolio. The fixed income portfolio is actively managed by Galliard Capital Management. Wrapper agreements are issued by high quality financial institutions such as an insurance company or a bank (a “Wrapper Provider”) whose long-term credit rating at the time the wrapper agreement is entered into is at least a minimum of A1 by Moody’s Investors Service (“Moody’s”), A by Standard & Poor’s (“S&P”), or A by Fitch Ratings. A wrapper agreement enables the Portfolio, regardless of market fluctuations, to value the assets of the Portfolio covered by the wrapper agreement (the “Covered Assets”) at their book value. Book value generally means all Contributions allocated to the Portfolio that are invested in Covered Assets, plus all income accrued less fees or expenses at the “Crediting Rate” described below, as in effect from time to time, less the sum of withdrawals from the Covered Assets. Should the amount received from liquidating all of the Covered Assets ever be insufficient to satisfy requested withdrawals from the Portfolio that are covered by the wrapper agreements, under normal circumstances the Wrapper Provider would be obligated to pay the amount of the shortfall to the Portfolio. It is expected that the Portfolio will value the wrapper agreements at the difference between the book value and the market value of the Covered Assets. If the market value of the Covered Assets exceeded their book value, the difference would not be reflected in the Portfolio’s valuation of the Covered Assets. ING Life Insurance and Annuity Company currently serves as the Wrapper Provider. The Treasurer has decided to terminate the Portfolio on or about June 30, 2013. This decision may have an impact to the crediting rate. The termination date is subject to change and may occur earlier than expected. Participants will be advised as to future plans regarding the Portfolio’s assets as the termination date nears. In connection with its eventual termination, the Portfolio will increase its allocation to cash over time by investing in Oppenheimer Institutional Money Market Fund or cash equivalents. Such cash is not a Covered Asset under the wrapper agreement. On February 6, 2012, the Principal Protection Income Portfolio was closed and no new contributions into the Portfolio were accepted. Account Owners are permitted to remain invested in the Principal Protection Income Portfolio until the Portfolio is either terminated or merged into a new or existing portfolio in the Program.
State of Illinois Office of the Treasurer College Savings Program Notes to the Financial Statements For the Years Ended June 30, 2012 and 2011
13
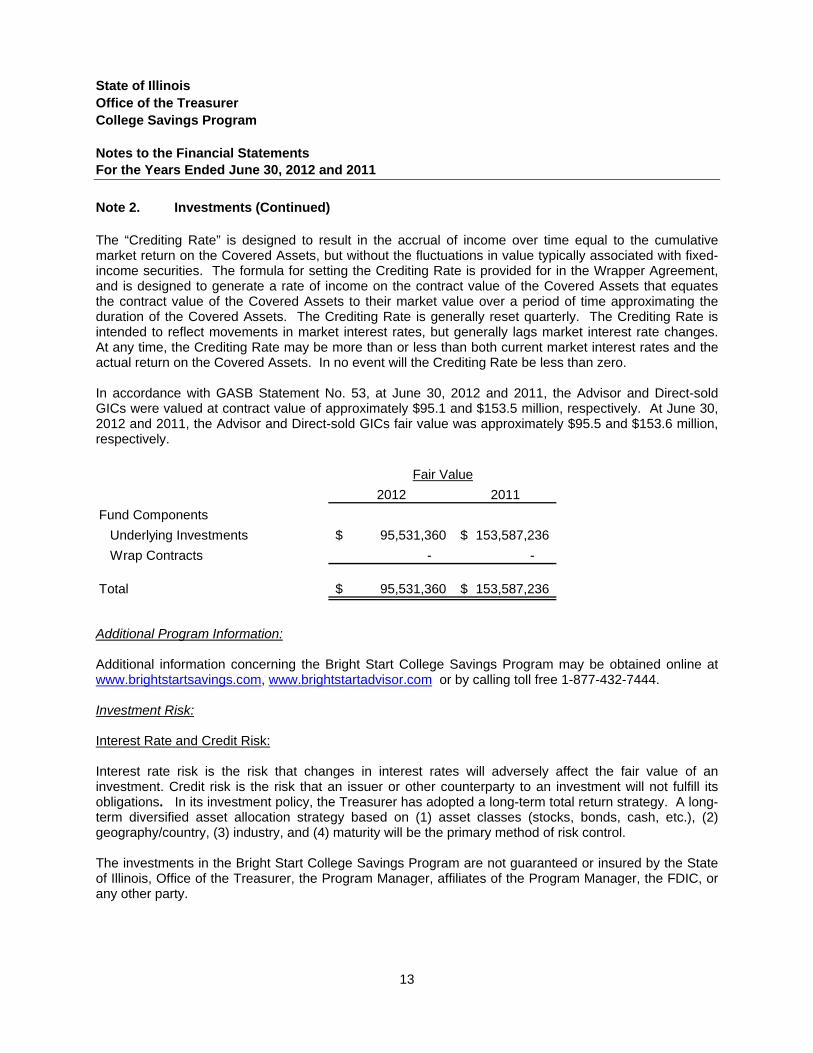
Note 2. Investments (Continued) The “Crediting Rate” is designed to result in the accrual of income over time equal to the cumulative market return on the Covered Assets, but without the fluctuations in value typically associated with fixed-income securities. The formula for setting the Crediting Rate is provided for in the Wrapper Agreement, and is designed to generate a rate of income on the contract value of the Covered Assets that equates the contract value of the Covered Assets to their market value over a period of time approximating the duration of the Covered Assets. The Crediting Rate is generally reset quarterly. The Crediting Rate is intended to reflect movements in market interest rates, but generally lags market interest rate changes. At any time, the Crediting Rate may be more than or less than both current market interest rates and the actual return on the Covered Assets. In no event will the Crediting Rate be less than zero. In accordance with GASB Statement No. 53, at June 30, 2012 and 2011, the Advisor and Direct-sold GICs were valued at contract value of approximately $95.1 and $153.5 million, respectively. At June 30, 2012 and 2011, the Advisor and Direct-sold GICs fair value was approximately $95.5 and $153.6 million, respectively.
2012 2011
Fund Components
Underlying Investments 95,531,360$ 153,587,236$
Wrap Contracts - -
Total 95,531,360$ 153,587,236$
Fair Value
Additional Program Information:
Additional information concerning the Bright Start College Savings Program may be obtained online at www.brightstartsavings.com, www.brightstartadvisor.com or by calling toll free 1-877-432-7444. Investment Risk: Interest Rate and Credit Risk: Interest rate risk is the risk that changes in interest rates will adversely affect the fair value of an investment. Credit risk is the risk that an issuer or other counterparty to an investment will not fulfill its obligations. In its investment policy, the Treasurer has adopted a long-term total return strategy. A long-term diversified asset allocation strategy based on (1) asset classes (stocks, bonds, cash, etc.), (2) geography/country, (3) industry, and (4) maturity will be the primary method of risk control. The investments in the Bright Start College Savings Program are not guaranteed or insured by the State of Illinois, Office of the Treasurer, the Program Manager, affiliates of the Program Manager, the FDIC, or any other party.
State of Illinois Office of the Treasurer College Savings Program Notes to the Financial Statements For the Years Ended June 30, 2012 and 2011
14
Note 2. Investments (Continued) The fair values and weighted average maturities (WAM) or Duration of the money market and fixed income funds for the Bright Start Program as of June 30, 2012 are detailed in the table below. The Bright Start Program’s fixed income funds are not rated.
Type Fair ValueInterest
Rate Risk MethodCredit Risk
Rating Service
Money Market: 256,542,762$ 49 days Weighted Average Maturity AAAm S&P
Fixed Income Funds: 1,167,616,829 4.78 yrs Weighted Average Maturity NR* NA**
*Credit Risk of NR indicates that while the underlying securities within
the funds may be rated, the mutual fund itself is not rated.**Not applicable
The fair values and weighted average maturities (WAM) of the money market and fixed income funds for the Bright Start Program as of June 30, 2011 are detailed in the table below. The Bright Start Program’s money market and fixed income funds are not rated.
Type Fair ValueInterest
Rate Risk MethodCredit Risk
Rating Service
Money Market: 159,087,664$ 54 days Weighted Average Maturity NR* NA**
Fixed Income Funds: 1,107,361,003 4.75 yrs Weighted Average Maturity NR* NA**1,266,448,667$
*Credit Risk of NR indicates that while the underlying securities within
the funds may be rated, the mutual fund itself is not rated.
**Not applicable
State of Illinois Office of the Treasurer College Savings Program Notes to the Financial Statements For the Years Ended June 30, 2012 and 2011
15
Note 2. Investments (Continued) Bright Directions College Savings Program
Permitted Investments: The Treasurer’s Bright Directions investment activities are governed by the Treasurer’s published Bright Directions investment policy (included in the “other information” section of this report), which was developed in accordance with the State statute. In addition, the Treasurer has adopted its own investment practices, which supplements the statutory requirements. Contributions will be invested in one or more of the available Underlying Portfolios, each composed of a designated mix of investments or an individual investment fund, which is appropriate for the age of the participant or the investment objective of the Portfolio. Each Underlying Portfolio may allocate assets among domestic equity, international equity, real estate, fixed-income, and/or money market investments. The asset allocation of each Underlying Portfolio will be established by the Treasurer and managed by Union Bank. The Treasurer may adjust the weighting in stocks, bonds, real estate, and cash in each Underlying Portfolio and may change the mutual funds within the Underlying Portfolios consistent with its Investment Policy Statement. Investment Options:
General Overview
The Bright Directions Program offers the following investment portfolios:
Three Age-Based Tracks, each with five portfolio options Seven Target Portfolios Twenty-Eight Individual Fund Portfolios Four Female & Minority Owned Portfolios
The three Age-Based portfolios are designed to reduce the account’s exposure to principal loss the closer the Beneficiary reaches college age; the seven Target Portfolios maintain a constant asset allocation between equity, fixed income, and money market securities; the Individual Fund Portfolios each invest in a single mutual fund; and the Female & Minority Owned Portfolios invest in underlying investment funds which are managed by female or minority-owned investment advisors. The Age-Based, Target, Individual, and Female & Minority Owned Fund Portfolios have been designed by the Treasurer, Manager, and Wilshire Funds Management.
State of Illinois Office of the Treasurer College Savings Program Notes to the Financial Statements For the Years Ended June 30, 2012 and 2011
16
Note 2. Investments (Continued) Brief Description of Investment Options:
Age-Based Portfolios:
The Age-Based Portfolios generally invest in a mix of equity, fixed income, and money market funds allocated based on the current age of the Beneficiary. The Age-Based Portfolios adjust over time so that as the Beneficiary nears college age each Age-Based Portfolio’s allocation between equity, fixed income, and money market funds becomes more conservative relative to the allocation in earlier years.
Program participants may choose from the following three Age-Based Tracks:
Age-Based Aggressive Portfolio Age-Based Growth Portfolio Age-Based Balanced Portfolio The beneficiary age bands within each of the above portfolios include: 0-8 years, 9-12 years, 13-16 years, 17-20 years and 21 years and over.
Target Portfolios:
The Target Portfolios are asset allocation portfolios that invest in a set or “static” mix of equity, fixed income, or money market funds. The allocation between equity, fixed income, and money market investments within the Target Portfolios does not change as the Beneficiary gets older. The seven Target Portfolios, ranging from the most aggressive to conservative, are as follows: Fund 100 Fund 80 Fund 60 Fund 40 Fund 20 Fund 10 Fixed Income Fund Individual Fund Portfolios:
The Bright Directions Program offers twenty-eight Individual Fund Portfolios. Each Individual Fund Portfolio is invested solely in shares of a single underlying mutual fund. Account balances may be allocated among one or more Individual Fund Portfolios according to the Account Owners investment objectives, investment time horizon, and risk tolerance. The Individual Fund Portfolios offered are as follows: American Century Equity Growth 529 Portfolio American Century Growth 529 Portfolio American Century Value 529 Portfolio Artisan Emerging Markets 529 Portfolio BlackRock Cash Funds 529 Portfolio BlackRock Inflation Protected Bond 529 Portfolio
State of Illinois Office of the Treasurer College Savings Program Notes to the Financial Statements For the Years Ended June 30, 2012 and 2011
17
Note 2. Investments (Continued) Individual Fund Portfolios (Continued) Calvert Equity 529 Portfolio (formerly known as Calvert Social Investment Equity 529 Portfolio) Delaware Small Cap Core 529 Portfolio Dodge & Cox International Stock 529 Portfolio Eagle Small Cap Growth 529 Portfolio ING Global Real Estate 529 Portfolio MFS Value 529 Portfolio Northern Bond Index 529 Portfolio Northern Institutional Equity Index 529 Portfolio Northern Institutional International Equity Index 529 Portfolio Northern Institutional Small Company Index 529 Portfolio Northern Small Cap Value 529 Portfolio Oppenheimer International Growth 529 Portfolio PIMCO Low Duration 529 Portfolio PIMCO Short-Term 529 Portfolio PIMCO Total Return 529 Portfolio T. Rowe Price Balanced 529 Portfolio T. Rowe Price Equity Income 529 Portfolio T. Rowe Price Extended Equity Market Index 529 Portfolio T. Rowe Price Institutional Large Cap Growth 529 Portfolio T. Rowe Price Real Estate 529 Portfolio Templeton International Bond 529 Portfolio William Blair Mid Cap Growth 529 Portfolio Female & Minority Owned Portfolios:
The Bright Directions Program offers Four Female & Minority Owned Portfolios. Each portfolio is invested in funds which are managed by female and/or minority-owned investment advisors. The Female & Minority Owned Portfolios are as follows: Ariel Fund 529 Portfolio John Hancock Small Company 529 Portfolio SIT Dividend Growth 529 Portfolio Touchstone Total Return Bond 529 Portfolio
Additional Program Information
Additional information concerning the Bright Directions College Savings Program, including a complete description of investment options, may be obtained online at www.brightdirections.com or by calling 1-866-722-7283.
State of Illinois Office of the Treasurer College Savings Program Notes to the Financial Statements For the Years Ended June 30, 2012 and 2011
18
Note 2. Investments (Continued)
Investment Risk: Interest Rate and Credit Risk: Interest rate risk is the risk that changes in interest rates will adversely affect the fair value of an investment. Credit risk is the risk that an issuer or other counterparty to an investment will not fulfill its obligations. In its investment policy the Treasurer has adopted a long-term total return strategy. A long-term diversified asset allocation strategy based on (1) asset classes (stocks, bonds, cash, etc.), (2) geography/country, (3) industry, and (4) maturity will be the primary method of risk control. The investments in the Bright Directions College Savings Program are not guaranteed or insured by the State of Illinois, Office of the Treasurer, the Program Manager, affiliates of the Program Manager, the FDIC, or any other party. The fair values and weighted average maturities (WAM) of the money market and fixed income funds for the Bright Directions Program as of June 30, 2012 are detailed in the table below. The Bright Direction Program’s money market individual fund 529 portfolio and the Target Fixed Income Funds are not rated.
Type Fair Value Interest Rate Risk Method Credit Risk
Money Market: 55,639,360$ 46 days Weighted Average Maturity NR*
Fixed Income Funds: 332,428,701 5.02 yrs Weighted Average Maturity NR*388,068,061$
*Credit Risk of NR indicates that while the underlying securities within
the funds may be rated, the mutual fund itself is not rated.
State of Illinois Office of the Treasurer College Savings Program Notes to the Financial Statements For the Years Ended June 30, 2012 and 2011
19
Note 2. Investments (Continued) The fair values and weighted average maturities (WAM) of the money market and fixed income funds for the Bright Directions Program as of June 30, 2011 are detailed in the table below. The Bright Directions Program’s money market individual fund 529 portfolio and the Target Fixed Income Funds are not rated.
Type Fair Value Interest Rate Risk Method Credit Risk
Money Market: 44,425,692$ 50 days Weighted Average Maturity NR*
Fixed Income Funds: 271,725,580 4.73 yrs Weighted Average Maturity NR*316,151,272$
*Credit Risk of NR indicates that while the underlying securities within
the funds may be rated, the mutual fund itself is not rated.
Note 3. Administrative Fees
To administer the College Savings Program, the Treasurer has a division entitled, “The College Savings Program Division.” This division had three employees as of June 30, 2012. The revenues and expenses of the division are recorded in an enterprise proprietary fund maintained by the Treasurer entitled College Savings Program Administrative Trust Fund No. 668. The Managers of the College Savings Program receive fees for their services. The Bright Start Program Manager received an amount equal to a charge against the assets of the Trust at an annual rate of 0.15% on the blended and advisor portfolios and 0.14% on the index portfolios of the average daily balance of the net assets of the Trust. The fee is calculated daily but payable monthly. The Bright Directions Program Management fee is at an annual rate of 0.35% of the average daily net assets of each Portfolio. The College Savings Program custodial/advisory fees paid from the Trust and the College Savings Program Administrative Trust Fund expenses are as follows:
2012 2011
Custodial/advisory fees 8,783,468$ 7,994,225$
Administrative Trust Fund expenses 918,593 1,204,368
State of Illinois Office of the Treasurer College Savings Program Notes to the Financial Statements For the Years Ended June 30, 2012 and 2011
20
Note 4. Settlement In late January 2009, the Treasurer launched an investigation of OppenheimerFunds, Inc. through the Illinois Attorney General’s Office. The nature of the investigation related to the investment performance of the OFII Core Plus Fixed Income Strategy and whether mismanagement of the underlying investment led to its underperformance in 2008. A formal settlement agreement was reached on December 18, 2009 and OppenheimerFunds, Inc. agreed to pay $77.23 million into a settlement account from which 100% of the proceeds would be distributed to eligible participants (i.e., there is no deduction from the settlement proceeds for administrative or other expenses). As of June 30, 2012, 95% of settlement proceeds had been distributed to eligible participants by way of deposits into a Bright Start account or check disbursement. The settlement distribution process is scheduled for one more disbursement before the remaining unclaimed funds are to be turned over to State of Illinois Unclaimed Property.
SUPPLEMENTARY INFORMATION
21
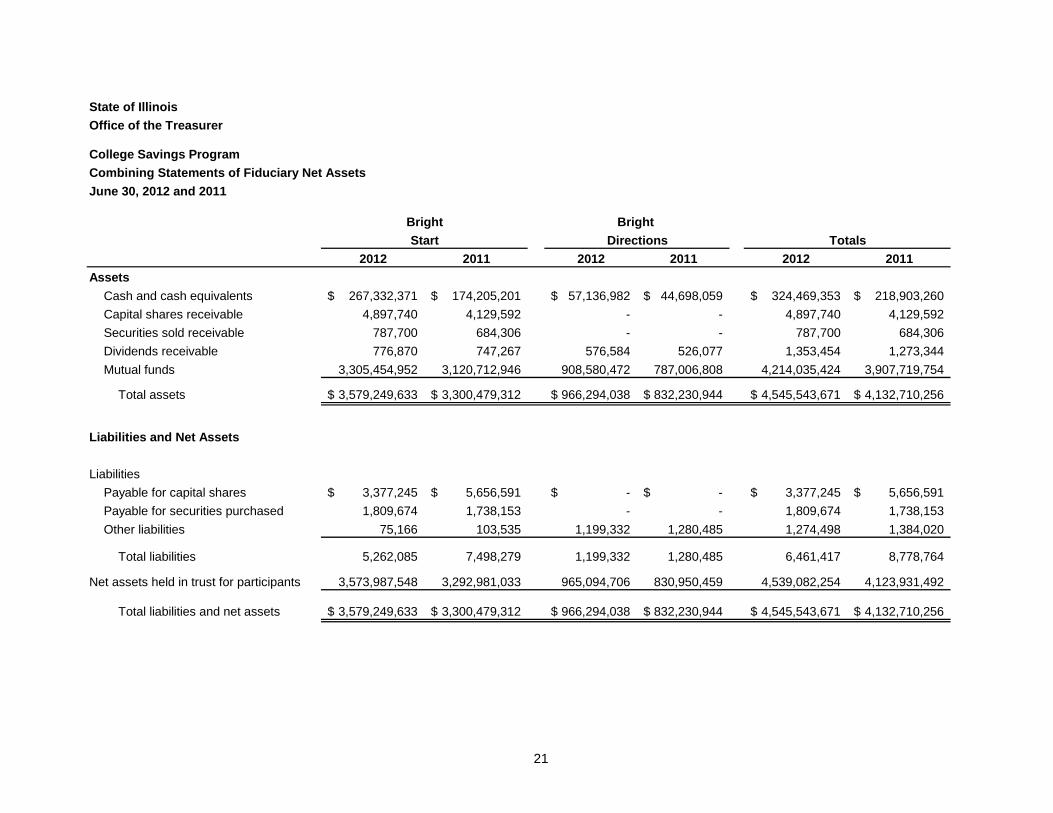
2012 2011 2012 2011 2012 2011
Assets
Cash and cash equivalents 267,332,371$ 174,205,201$ 57,136,982$ 44,698,059$ 324,469,353$ 218,903,260$
Capital shares receivable 4,897,740 4,129,592 - - 4,897,740 4,129,592
Securities sold receivable 787,700 684,306 - - 787,700 684,306
International Small Company Small Cap International Low PimcoEquity Index Index Value Growth Duration Short-Term529 Portfolio 529 Portfolio 529 Portfolio 529 Portfolio 529 Portfolio 529 Portfolio
from participant transactions 3,399,557 275,453 737,093 1,407,922 6,370,226 (12,067,154)
Change in net assets 4,049,593 241,083 725,078 (382,580) 6,465,905 (12,613,290)
Net assets, beginning of fiscal year 5,378,339 2,935,082 4,215,491 10,864,645 - 12,612,860
Net assets, end of fiscal year 9,427,932$ 3,176,165$ 4,940,569$ 10,482,065$ 6,465,905$ (430)$
(Continued)
59
State of IllinoisOffice of the Treasurer
Bright Directions College Savings ProgramStatement of Changes in Fiduciary Net Assets by Portfolio (Continued)Year Ended June 30, 2012
ING NorthernGlobal John Hancock MFS NCM Capital Northern Institutional
Real Estate Small Company Value Mid-Cap Growth Bond Index Equity Index529 Portfolio 529 Portfolio 529 Portfolio 529 Portfolio 529 Portfolio 529 Portfolio
Investment income (expense)Investment earnings 32,800$ 1,604$ 63,194$ 4,980$ 145,513$ 132,727$ Net change in fair value of investments 6,703 (50,592) 374,032 (8,690) 152,103 170,730 12b-1 fees (3,952) (1,364) (2,287) (485) (11,915) (17,560) Management fees (5,816) (3,338) (3,607) (782) (17,307) (28,175)
Net investment earnings (loss) 29,735 (53,690) 431,332 (4,977) 268,394 257,722
Distributions to participantsNet investment income - - - - - -
from participant transactions 693,290 7,149 11,249,053 (282,344) (45,253) (16,462)
Change in net assets 723,025 (46,541) 11,680,385 (287,321) 223,141 241,260
Net assets, beginning of fiscal year 1,238,717 837,443 - 287,321 3,937,413 7,290,729
Net assets, end of fiscal year 1,961,742$ 790,902$ 11,680,385$ -$ 4,160,554$ 7,531,989$
(Continued)
60
State of IllinoisOffice of the Treasurer
Bright Directions College Savings ProgramStatement of Changes in Fiduciary Net Assets by Portfolio (Continued)Year Ended June 30, 2012
Northern Northern
Institutional Institutional Northern Oppenheimer PimcoInternational Small Company Small Cap International Low PimcoEquity Index Index Value Growth Duration Short-Term529 Portfolio 529 Portfolio 529 Portfolio 529 Portfolio 529 Portfolio 529 Portfolio
Investment income (expense)Investment earnings 113,978$ 21,640$ 37,518$ 139,077$ 307,173$ 137,174$ Net change in fair value of investments (891,578) (75,112) (26,608) (1,234,552) 5,402 (56,839) 12b-1 fees (11,410) (6,260) (6,665) (33,409) (28,581) (22,033) Management fees (19,400) (9,745) (24,531) (49,345) (43,424) (27,770)
Net investment earnings (loss) (808,410) (69,477) (20,286) (1,178,229) 240,570 30,532
Distributions to participantsNet investment income - - - - - -
There may be a difference between the assets presented above and the information presented in the statements. Two systems are used to calculate the information and the reports fromeach system are run at different times.
"Participant Accounts" is defined as the total number of investment portfolios.
Illinois Out of State Total
State of Illinois
Office of the Treasurer
College Savings ProgramKey Performance MeasuresAs of June 30, 2012 and 2011(Unaudited)
73
2012 2011 2012 2011 2012 2011
Bright Directions
Number of Participant Accounts 62,445 55,504 5,521 4,050 67,966 59,554
Market Value 875,905,528$ 765,733,522$ 89,200,497$ 65,660,105$ 965,106,025$ 831,393,627$
Notes:
There may be a difference between the Market Value presented above and the information presented in the statements. Two systems are used to calculate the information and each uses adifferent level of decimal rounding.
"Participant Accounts" is defined as the number of unique relationships between an account owner and a beneficiary.
Illinois Out of State Total
State of Illinois
Office of the Treasurer
College Savings ProgramKey Performance MeasuresAs of June 30, 2012 and 2011(Unaudited)
Investment Policies (Unaudited)
Included in this section are the investment policies of the Bright Start Program and the Bright Directions Program.
74
Bright Start College Savings Program Investment Policy Statement
Effective February 3, 2012
I. Statement of Purpose of Investment Policy
The purpose of this Statement is to assist contractors retained by the Treasurer to provide services related to the management of the assets of the Bright Start College Savings Program (the “Program”) and to assist the Treasurer’s Office in evaluating the performance of such contractors by:
Describing the Treasurer’s investment objectives;
Providing general guidelines for the investment of assets of the Program;
Describing the Treasurer’s long-term investment strategy;
Describing the process of evaluating the performance of contractors that provide investment management services to the Program; and
Specifying the responsibilities of any contractors that provide investment management services to the Program.
This is the official Investment Policy Statement of the Program. Deviation from this Policy is not permitted without prior, explicit, written permission from the Treasurer.
II. Establishment and Authority of Entity
The Program has been established as a “qualified tuition program” in accordance with Section 529 of the Internal Revenue Code of 1986, as amended. It was established to provide families with a new opportunity to invest toward future college education expenses.
III. Investment Philosophy
The Treasurer has adopted a long-term total return strategy regarding the Program and its investments. In order to achieve the Program’s objectives, investments shall be diversified so as to minimize the risk of loss. While some asset classes may experience short-term and intermediate-term volatility, their long-term return assumptions justify their inclusion. A long-term focus on investment results as well as prudent diversification across financial markets will be the primary risk control mechanisms.
In its investment strategy, the Treasurer has relied on prevailing financial theory, which currently utilizes a long-term diversified asset allocation strategy. A prudently allocated investment program possesses a significant level of diversification, which produces risk reduction. In terms of impact, diversification shall be considered along the following lines: (1) asset classes (Money Market Instruments, Domestic Fixed Income, International Fixed Income, Domestic Equity, and International Equity,), (2) geography/country, (3) sector, (4) maturity, and (5) duration.
75
Contributions to the Program will be directed to one of several portfolios (the “Portfolios”), each with a designated mix of investments. The determination of the investment parameters of each Portfolio shall be made by the Treasurer and shall take into account the financial characteristics of the investments in the Program. The investment parameters will also give due consideration to the fact that the investment horizon for Account Owners will vary from a few months to over 18 years.
The Treasurer will review the investment performance of each Portfolio at least quarterly and shall review this Investment Policy Statement at least annually.
The holdings of the Program and the Portfolios may be divided into the following broad asset classes:
A. Money Market Instruments
B. Domestic Fixed Income
C. International Fixed Income
D. Domestic Equity
E. International Equity
The Treasurer will establish reasonable guidelines for each Portfolio, specifying (as applicable) limits on asset and asset class exposures. While the investment parameters offered under the Program are developed by the Treasurer, Account Owners bear the risk of investment results. Individual Account Owners who seek investments materially different from those offered may wish to select an investment alternative outside of the Program.
The administration and offering of the Program should not be relied upon as a guarantee to Account Owners. Each Account Owner should seek appropriate advice, as he or she deems necessary.
IV. Investment Objectives
The overall investment program for the Program and, as applicable, the individual Portfolios provided to the Account Owners shall seek to achieve the following long-term investment objectives:
A. A long-term competitive rate of return on investments that is equal to or exceeds a return of the applicable benchmarks shown in Section VII hereof, and a long term rate of return on investments that is competitive with each investment’s peer group.
B. A long-term competitive rate of return on investments through indexed fund portfolios that approximately equal the applicable benchmarks shown in Section VII hereof.
76
C. An investment program flexible enough to meet the needs of Account Owners based upon their age or investment objective or the age of the beneficiary and which provides each individual with the ability to invest in a diversified portfolio to meet his or her long-term investment goals.
V. Investment Responsibilities
The Treasurer is responsible for the investment policy, the direction of investments and administration of the assets of the Program. In order to properly carry out his or her responsibilities, the Treasurer may rely on one or more contractors to assist in the administration of the Program. The Treasurer has engaged, and plans to rely heavily on, OFI Private Investments Inc. (the “Manager”) for various investment management and related administrative services. The Treasurer also plans to rely heavily on an external investment consultant for investment advisory services. Among the current responsibilities of the Manager is the implementation of the investment strategy outlined in this Policy and the rebalancing (as described in Section VI) of the Portfolios when market movement and/or cash flows cause an asset class to be outside its policy allocation bands. The Treasurer's Office and the Manager shall meet quarterly to review portfolio performance as compared to the applicable benchmarks and peer group performance.
In managing the investments of the Program and the Portfolios, the Manager agrees that it will act with the skill, prudence and diligence under the circumstances then prevailing that a prudent person acting in a like capacity and familiar with such matters would use in the conduct of an enterprise of like character and with like objectives.
VI. Investment Parameters
Contributions will be invested in one of several Portfolios, each with a designated mix of investments that is appropriate for the investment objective of the Portfolio. Each Portfolio allocates assets in a combination of underlying investments investing among Money Market Instruments, Domestic Fixed Income, International Fixed Income, Domestic Equity, and International Equity. The asset allocation of each Portfolio will be established by the Treasurer and managed by the Manager. The Treasurer may adjust the weighting in these asset classes in each Portfolio and may change the underlying investments within the Portfolios consistent with this Investment Policy Statement and its agreement with the Manager.
The policy target asset allocations and benchmarks for the underlying investments within the Portfolios are shown below. Under normal market conditions, there is a permissible range of plus or minus a 10% deviation from the target allocation for each asset class. However, during periods of extreme volatility or market crisis, the actual asset allocations for each underlying investment may exceed plus or minus 10% of the target allocations, and any rebalancing will occur quarterly.
Russell 1000 Value Index Russell 1000 Growth Index Russell 2500 Index
25% 16% 16% 15%
21% 12% 12% 11%
18% 10% 10% 10%
15% 8.5% 8.5% 8%
9% 5% 5% 5%
3% 2% 2% 1%
International Equity MSCI EAFE Index
MSCI Emerging Markets Index
13% 5%
10% 4%
8.5% 3.5%
7% 3%
4.5% 1.5%
1.5% 0.5%
Domestic Fixed Income Barclays Capital Aggregate
Bond Index Barclays Capital 1-3 Yr. Government Index
9%
0%
15%
12%
20%
16%
22.5%
22.5%
25%
28%
16%
55%
International Fixed Income
Citi World Government Bond Index (ex-U.S.)
1% 3% 4% 5% 7% 4%
Money Market Instruments
iMoney Net First Tier Institutional Money Market Index
0% 0% 0% 0% 10% 15%
Advisor Plan: Active Fixed Income, Equity, Balanced or Money Market Options
Asset Class Benchmark* Fixed Inc Portfolio
Equity Portfolio
Balanced Portfolio
Money Market
Portfolio
Domestic Equity Russell 1000 Index Russell 1000 Value Index Russell 1000 Growth Index
0% 0% 0%
25% 19.5% 19.5%
15% 9% 9%
0% 0% 0%
Russell 2500 Index 0% 16% 7% 0% International Equity MSCI EAFE Index
MSCI EMG Mkts. Index 0% 0%
14% 6%
7% 3%
0% 0%
Domestic Fixed Income Barclays Capital Aggregate
Bond Index Barclays Capital 1-3 Yr Government Index
30%
35%
0%
0%
25%
10%
0%
0%
International Fixed Income
Citi World Government Bond Index (ex-U.S.)
10% 0% 0% 0%
Money Market Instruments
iMoney Net First Tier Institutional Money Market Index
25% 0% 15% 100%
80
*Benchmarks are subject to change as mutually agreed by the Treasurer and Manager in order to ensure that they remain appropriate for each underlying investment and consistent with industry standards.
Each active underlying investment’s return objective is to equal or exceed, over a three-year rolling period, the annualized return of the applicable benchmark. Volatility, measured by the standard deviation of returns, is expected to be similar to the benchmark. Each underlying investment is also expected to perform favorably relative to its peer group.
To the extent that the assets of a Portfolio are invested in one or more underlying investments approved by the Treasurer having investment objectives consistent with the above-noted asset allocation categories, the above-noted percentage guidelines shall be deemed satisfied. This shall be the case even if such an underlying investment’s assets may not be entirely invested in the asset class in which such underlying investment has been placed.
Principal Protection Income Portfolio The Principal Protection Income Portfolio attempts to reduce significantly under normal circumstances fluctuations in the value of its assets, other than money market securities and money market fund securities, by investing in Security Backed Investment Contracts (also called Synthetic Guaranteed Investment Contracts or Synthetic GICs). Security Backed Investment Contracts are comprised of two components: investment contracts (also called “Wrapper Agreements) and an underlying portfolio of marketable fixed income securities which are held and owned by the Portfolio on behalf of investors.
Wrapper Agreements are issued by high quality financial institutions such as an insurance company or a bank (a "Wrapper Provider") whose long-term credit rating at the time the Wrapper Agreement is entered into must be a minimum of A1 by Moody’s, A by S& P, or A by Fitch. A Wrapper Agreement enables the Portfolio, regardless of market fluctuations, to value the assets of the Portfolio covered by the Wrapper Agreement (the "Covered Assets") at their book value. Book value generally means all Contributions allocated to the Portfolio that are invested in Covered Assets, plus all income accrued at the “Crediting Rate”, as in effect from time to time, less the sum of withdrawals from the Covered Assets. Should the amount received from liquidating all of the Covered Assets ever be insufficient to satisfy requested withdrawals from the Portfolio that are covered
by the Wrapper Agreements, under normal circumstances the Wrapper Provider would be obligated to pay the amount of the shortfall to the Portfolio. It is expected that the Portfolio will value the Wrapper Agreements at the difference between the book value and the market value of the Covered Assets. If the market value of the Covered Assets exceeded their book value, the difference would not be reflected in the Portfolio’s valuation of the Covered Assets. The Treasurer has approved Galliard Capital Management, Inc. (“Galliard”) to manage the assets of the Portfolio and acknowledges
81
that neither OFI nor any of its affiliates are liable to the Portfolio for impairments to Book Value as described in the Wrapper Agreement. The Treasurer has elected to terminate the Principal Protection Income Portfolio before June 30, 2013, and has instructed Galliard to manage the underlying assets to effectively converge the Portfolio's market and book value as soon as reasonably practicable. Upon further instruction from the Treasurer, Galliard and OFI, or one of its affiliates, will liquidate the Portfolio’s remaining assets and invest them as directed by the Treasurer. In anticipation of this Portfolio's termination, the Program will be adding new money market options, the Money Market Portfolio and Advisor Money Market Portfolio to the Plans. Beginning February 6, 2012, the Principal Protection Income Portfolio will be closed to new contributions. Any contributions received for the Principal Protection Income Portfolio on or after February 6, 2012 will be automatically redirected into the appropriate money market portfolio. In connection with the closure of the Principal Protection Income Portfolio, beginning February 6, 2012, the annual asset based sales charge associated with units of that Portfolio will be eliminated and ongoing compensation will no longer be paid to financial advisors and brokers.
82
State of Illinois Office of the Treasurer
BRIGHT DIRECTIONS COLLEGE SAVINGS PROGRAM
INVESTMENT POLICY STATEMENT
Effective December 2011
1.0 Statement of Purpose of Investment Policy: The purpose of this Statement is to assist contractors retained by the Treasurer to provide services related to the management of the assets of the Illinois College Savings Pool that are contributed to the Bright Directions College Savings Program (the “Program”) and to assist the Treasurer’s Office in evaluating the performance of such contractors by:
Describing the Treasurer’s investment objectives; Providing general guidelines for the investment of assets of the Program; Describing the Treasurer’s long-term investment strategy; Describing the process of evaluating the performance of employees or contractors
that provide investment management services to the Program; and Specifying the responsibilities of any contractors that provide investment
management services to the Program.
This is the official Investment Policy Statement of the Program. Deviation from this Policy is not permitted without prior, explicit, written permission from the Treasurer.
2.0 Establishment and Authority of Entity: The Bright Directions College Savings Program has been established as part of the Illinois College Savings Pool, and is intended to qualify as a qualified tuition program in accordance with Section 529 of the Internal Revenue Code of 1986, as amended. The Program is sold through financial advisors and was established to compliment the existing Bright Start College Savings Program by allowing families to utilize a financial advisor to assist them with investing toward future college education expenses.
3.0 Participating Financial Institution: Accounts in the Program will be distributed through registered broker-dealers and financial institutions that have entered into a Selling Agent Agreement with Northern Trust Securities, Inc., acting as distributor for the Program. All new accounts in the Program will be processed through Union Bank & Trust Company (“Union Bank”) as a participating financial institution. Union Bank has elected not to accept deposits in the Program as provided in Illinois Public Act 91-0607.
4.0 Investment Philosophy: The Treasurer has adopted a long-term total return strategy regarding the Program and its investments. In order to achieve the Program’s objectives, investments shall be diversified so as to minimize the risk of loss. While some asset classes may experience short-term and intermediate-term volatility, their long-term return assumptions justify their inclusion. A long-term focus on investment results as well as prudent diversification across public security markets will be the primary risk control mechanisms.
State of Illinois Office of the Treasurer
BRIGHT DIRECTIONS COLLEGE SAVINGS PROGRAM
INVESTMENT POLICY STATEMENT
Effective December 2011
83
In its investment strategy, the Treasurer has relied on prevailing financial theory, which currently utilizes a long-term diversified asset allocation strategy. A prudently allocated investment program possesses a significant level of diversification, which produces risk reduction. In terms of impact, diversification shall be considered along the following lines: (1) asset classes (stocks, bonds, cash, etc.), (2) geography/country, (3) industry, and (4) maturity.
Contributions to the Program will be directed to one or more of the available underlying portfolios (the “Underlying Portfolios”), each composed of a designated mix of investments or an individual investment fund. The determination of the investment parameters of each Underlying Portfolio shall be made by the Treasurer and shall take into account the financial characteristics of the investments in the Program. The investment parameters will also give due consideration to the fact that the investment horizon for participants will vary from a few months to over 18 years.
The Treasurer will review the investment performance of each Underlying Portfolio at least quarterly and shall review this Investment Policy Statement at least annually.
The holdings of the Program and the Underlying Portfolios are divided into the following broad asset categories:
A. Short Term Investments
B. Fixed Income Investments
C. Real Estate Investments
D. Domestic Equity Investments
E. International Equity Investments
The Treasurer will establish reasonable guidelines for each Underlying Portfolio, specifying (as applicable) limits on asset and asset class exposures, risk constraints and investment return objectives. While the investment parameters offered under the Program are developed by the Treasurer, participants bear the risk of investment results. Individual participants who seek investments materially different from those offered may wish to select an investment alternative outside of the Program.
The administration and offering of the Program should not be relied upon as a guarantee to participants. Each participant should seek appropriate advice as he or she deems necessary.
5.0 Investment Objectives: The overall investment program for the Program and, as applicable, the individual Underlying Portfolios provided to the participants shall seek to achieve the following long-term investment objectives:
State of Illinois Office of the Treasurer
BRIGHT DIRECTIONS COLLEGE SAVINGS PROGRAM
INVESTMENT POLICY STATEMENT
Effective December 2011
84
A long-term competitive rate of return on investments that is equal to or exceeds a return of the applicable benchmarks shown in Section VII hereof.
An investment program flexible enough to meet the needs of participants based upon their age or investment objective and which provides each individual with the ability to invest in a diversified portfolio to meet his or her long-term investment goals.
6.0 Investment Responsibilities: The Treasurer is responsible for the investment policy, the direction of investments and administration of the assets of the Program. In order to properly carry out his responsibilities, the Treasurer may rely on one or more contractors to assist in the administration of the Program. The Treasurer has engaged, and plans to rely heavily on Union Bank for administrative services and on Union Bank and its investment advisor, Wilshire Funds Management, the investment management business unit of Wilshire Associates Incorporated, for investment management services. The Treasurer also plans to rely heavily on an external investment consultant for investment advisory services. Among the current responsibilities of Union Bank is the implementation of the investment strategy outlined in this Policy and the rebalancing of the Underlying Portfolios when market movement and/or cash flows cause an asset class to be outside its policy allocation bands. With the Treasurer’s approval, Union Bank has retained Wilshire Funds Management to provide it with portfolio design, due diligence and ongoing monitoring services with respect to the Underlying Portfolios and the implementation of the investment strategy outlined in this policy. The Treasurer’s Office and Union Bank shall meet quarterly to review portfolio performance as compared to the applicable benchmarks and peer group performance.
In managing the investments of the Program and the Underlying Portfolios, Union Bank agrees that it will act with the skill, prudence and diligence under the circumstances then prevailing that a prudent person acting in a like capacity and familiar with such matters would use in the conduct of an enterprise of like character and with like objectives.
7.0 Investment Parameters: Contributions will be invested in one or more of the available Underlying Portfolios, each composed of a designated mix of investments or an individual investment fund, which is appropriate for the age of the participant or the investment objective of the Portfolio. Each Underlying Portfolio may allocate assets among domestic equity, international equity, real estate, fixed-income, and/or money market investments. The asset allocation of each Underlying Portfolio will be established by the Treasurer and managed by Union Bank. The Treasurer may adjust the weighting in stocks, bonds, real estate, and cash in each Underlying Portfolio and may change the mutual funds within the Underlying Portfolios consistent with this Investment Policy Statement.
The policy target asset allocations and benchmarks for the mutual funds within the Age-Based and Target Portfolios are shown below. There is a permissible range of plus or minus 10% of the target allocation for each mutual fund.
State of Illinois Office of the Treasurer
BRIGHT DIRECTIONS COLLEGE SAVINGS PROGRAM
INVESTMENT POLICY STATEMENT
Effective December 2011
85
Age-Based Aggressive Age of Beneficiary
Benchmark
0 - 8 yrs
9 - 12 yrs
13 - 16 yrs
17 - 20 yrs
21+ yrs
Large Cap Value Large Cap Blend Large Cap Growth
Russell 1000 Value S&P 500 Russell 1000 Growth
19.00% 19.00% 19.00%
15.00% 15.00% 15.00%
11.00% 11.50% 11.00%
7.00% 7.00% 7.00%
3.50% 3.50% 3.50%
Small Cap Value Small Cap Blend Small Cap Growth
Russell 2000 Value Russell 2000 Russell 2000 Growth
3.50% 4.00% 3.50%
3.00% 3.00% 3.00%
2.00% 2.00% 2.00%
2.00% 2.00% 2.00%
1.00% 1.00% 1.00%
Global Real Estate
FTSE EPRA/NAREIT Global
3.00%
2.00%
2.00%
2.00%
1.50%
Foreign Stock
MSCI EAFE MSCI Emerging Markets
25.00% 4.00%
21.00% 3.00%
16.50% 2.00%
10.00% 1.00%
5.00% 0.00%
Money Market Ultra-Short Bond Short Bond Intermediate Bond
3-month T-Bills 3-month T-Bills ML 1-3 yr Treasury Barclays U.S. Aggregate Bond
0.00% 0.00% 0.00% 0.00%
0.00% 0.00% 0.00%
16.00%
0.00% 0.00%
20.00% 14.00%
0.00% 20.00% 19.00% 12.00%
20.00% 23.00% 17.00% 12.00%
Foreign Bonds Citigroup World Gov’t Bond 0.00% 4.00% 3.00% 2.00% 0.00%
Russell 2000 Value Russell 2000 Russell 2000 Growth
2.00% 2. 00% 2.00%
2.00% 2.00% 2.00%
1.00% 1.00% 1.00%
0.50% 0.50% 0.50%
0.00% 0.00% 0.00%
Global Real Estate
FTSE EPRA/NAREIT Global
2.00%
2.00%
1.50%
0.00%
0.00%
Foreign Stock
MSCI EAFE MSCI Emerging Markets
16.50% 2.00%
10.00% 1.00%
5.00% 0.00%
2.50% 0.00%
0.00% 0.00%
Money Market Ultra-Short Bond Short Bond Intermediate Bond
3-month T-Bills 3-month T-Bills ML 1-3 yr Treasury Barclays U.S. Aggregate Bond
0.00% 0.00%
20.00% 14.00%
0.00% 20.00% 19.00% 12.00%
20.00% 23.00% 17.00% 12.00%
40.00% 25.00% 15.00% 0.00%
50.00% 28.00% 12.00% 0.00%
Foreign Bonds Citigroup World Gov’t Bond 3.00% 2.00% 0.00% 0.00% 0.00%
U.S. TIPS
Barclays U.S. TIPS
3.00%
7.00%
8.00%
10.00%
10.00%
State of Illinois Office of the Treasurer
BRIGHT DIRECTIONS COLLEGE SAVINGS PROGRAM
INVESTMENT POLICY STATEMENT
Effective December 2011
87
Individual Fund Portfolios
Participants in the Program open their Accounts through registered broker-dealers and other financial advisors. As a result, the Treasurer deems it appropriate to offer individual mutual funds as separate Underlying Portfolios in the Program. The individual mutual funds the Treasurer selects will be described in the Program’s current Program Disclosure Statement and may include the following asset classes:
Asset Class Benchmark
Money Market/Ultra Short Bond 3 Month T-Bill
Low Duration ML 1-3 Treasury Index
Corporate Bond Barclays U.S. Credit Index
Intermediate Bond Barclays U.S. Aggregate Bond Index
Foreign Bonds Citigroup World Government Bond Index
U.S. TIPS Barclays U.S. TIPS Index
Balanced Barclays U.S. Aggregate Bond Index; S&P 500; MSCI EAFE
Large Cap Value Russell 3000 Value, Russell 1000 Value
Large Cap Growth Russell 1000 Growth
Large Cap Blend Russell 1000, S&P 500
Mid-Cap Value Russell 2500 Value
Mid-Cap Growth Russell Mid-Cap Growth
Mid-Cap Blend Wilshire 4500 Index
Small-Cap Value Russell 2000 Value
Small-Cap Growth Russell 2000 Growth
Small-Cap Blend Russell 2000
Foreign Stock MSCI EAFE and MSCI Emerging Markets
Socially Responsible S&P 500
Real Estate DJ Wilshire Real Estate Securities
Global Real Estate FTSE EPRA/NAREIT Global Index
7.0 Investment Parameters – Continued
Each mutual fund’s return objective is to equal or exceed, over a three-year rolling period, the return of the applicable benchmark. Volatility, measured by the standard deviation of quarterly returns over that period, is expected to be similar to the benchmark. Each mutual fund is also expected to perform favorably relative to its peer group.
To the extent that the assets of an Underlying Portfolio are invested in one or more mutual funds approved by the Treasurer having investment objectives consistent with the above-noted asset
State of Illinois Office of the Treasurer
BRIGHT DIRECTIONS COLLEGE SAVINGS PROGRAM
INVESTMENT POLICY STATEMENT
Effective December 2011
88
allocation categories, the above-noted percentage guidelines shall be deemed satisfied. This shall be the case even if such a mutual fund’s underlying assets may not be entirely invested in the asset class in which such fund has been placed.
8.0 Female- and Minority-Owned Portfolios The Program has included the Female- and Minority-Owned Individual Fund Portfolios for participants who would like to have a more diverse set of fund options. The female and minority owned funds utilized in the program were screened on three initial criteria: 1) firms with at least 50% female and/or racial minority ownership or 2) funds that have a female and/or racial minority investment manager that makes the portfolio management decisions (i.e. a minority owned subadvisor), and 3) funds that delivered above median returns over a 3-year and/or 5-year time period. The mutual fund options provided in the program include relatively high scoring female and minority owned investment managers representing a diverse set of asset classes.
Contributions will be invested in one or more of the available Underlying Portfolios, each composed of an individual investment fund, which is appropriate for the investment objective of the Portfolio. The Treasurer may change the mutual funds within the Female- and Minority-Owned Portfolios consistent with this Investment Policy Statement.
Independent Auditors’ Report
89
Independent Auditors’ Report on Internal Control Over Financial Reporting and on Compliance and Other Matters Based on an
Audit of Financial Statements Performed in Accordance with Government Auditing Standards
Honorable William G. Holland Auditor General State of Illinois As Special Assistant Auditors for the Auditor General, we have audited the financial statements of the College Savings Program, a fiduciary (private purpose trust) fund of the State of Illinois, Office of the Treasurer, as of and for the year ended June 30, 2012 and have issued our report thereon dated December 17, 2012. We conducted our audit in accordance with auditing standards generally accepted in the United States of America and the standards applicable to financial audits contained in Government Auditing Standards, issued by the Comptroller General of the United States. Internal Control Over Financial Reporting Management of the State of Illinois, Office of the Treasurer is responsible for establishing and maintaining effective internal control over financial reporting. In planning and performing our audit, we considered the College Savings Program’s internal control over financial reporting as a basis for designing our auditing procedures for the purpose of expressing our opinion on the financial statements, but not for the purpose of expressing an opinion on the effectiveness of the College Savings Program’s internal control over financial reporting. Accordingly, we do not express an opinion on the effectiveness of the College Savings Program’s internal control over financial reporting. A deficiency in internal control exists when the design or operation of a control does not allow management or employees, in the normal course of performing their assigned functions, to prevent, or detect and correct misstatements on a timely basis. A material weakness is a deficiency, or combination of deficiencies, in internal control, such that there is a reasonable possibility that a material misstatement of the entity’s financial statements will not be prevented, or detected and corrected on a timely basis. Our consideration of internal control over financial reporting was for the limited purpose described in the first paragraph of this section and was not designed to identify all deficiencies in internal control over financial reporting that might be deficiencies, significant deficiencies or material weaknesses. We did not identify any deficiencies in internal control over financial reporting that we consider to be material weaknesses, as defined above. Compliance and Other Matters As part of obtaining reasonable assurance about whether the College Savings Program’s financial statements are free of material misstatement, we performed tests of its compliance with certain provisions of laws, regulations, contracts, and grant agreements, noncompliance with which could have a direct and material effect on the determination of financial statement amounts. However, providing an opinion on compliance with those provisions was not an objective of our audit, and accordingly, we do not express such an opinion. The results of our tests disclosed no instances of noncompliance or other matters that are required to be reported under Government Auditing Standards.
90
This report is intended solely for the information and use of the Auditor General, the General Assembly, the Legislative Audit Commission, the Governor, the State of Illinois, Office of the Treasurer, and the College Savings Program’s management, and is not intended to be and should not be used by anyone other than these specified parties.